Veit and Lewis 1996. Am. Nat. 148(2):255-274. Allee Effect & Demographic Stochasticity? At each time...
23
Veit and Lewis 1996. Am. Nat. 148(2):255-274
-
date post
21-Dec-2015 -
Category
Documents
-
view
216 -
download
1
Transcript of Veit and Lewis 1996. Am. Nat. 148(2):255-274. Allee Effect & Demographic Stochasticity? At each time...
Veit and Lewis 1996. Am. Nat. 148(2):255-274

Allee Effect & Demographic Stochasticity?
At each time step, 50% chance of birth, 50% chance of death
1
100
Time
1
0
0)(,12
2,2
100
99
100
101 EP
5.0)(,12
2,2
1
0
1
2 EP

Allee Effect & Demographic Stochasticity
• What is mean lambda for an infinitely large population?• 1 because MM mates with FF.
• What is mean lambda for population size = 2?• 0.5 because MM and FF do not mate.
At each time step, 50% chance of male, 50% chance of femaleEach breeding pair produces two offspring, then die.
M,MM,FF,MF,F
M,F
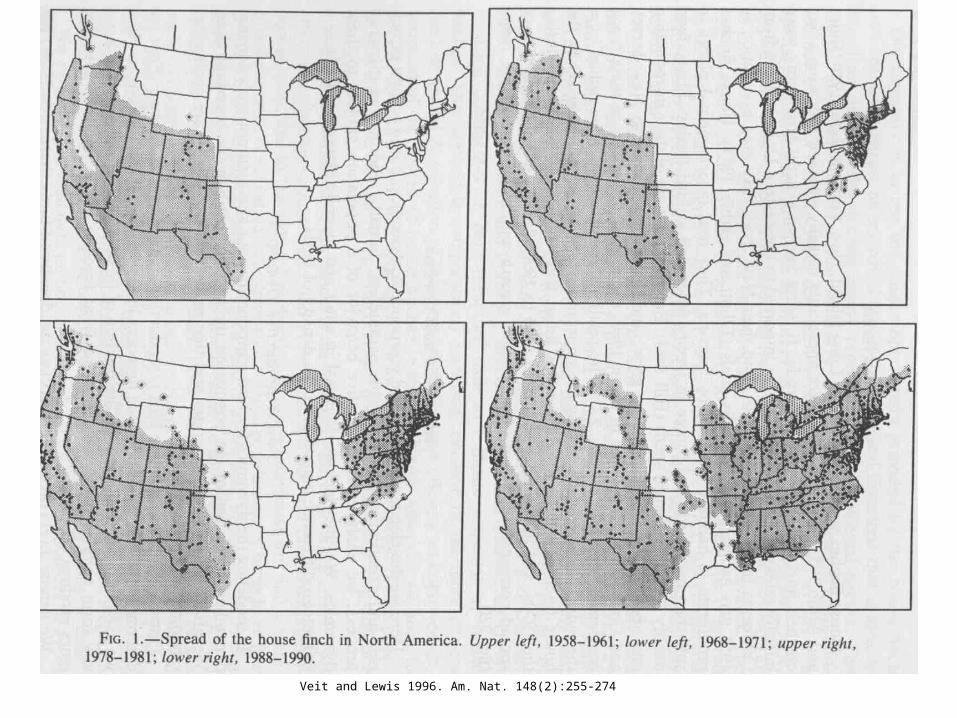
Sea Turtle Management
Eggs, Hatchlings
Novice Breeders
Juveniles
Mature Breeders
Sub-Adults

Sea Turtle Management
Eggs, Hatchlings
Novice Breeders
Juveniles
Mature Breeders
Sub-Adults
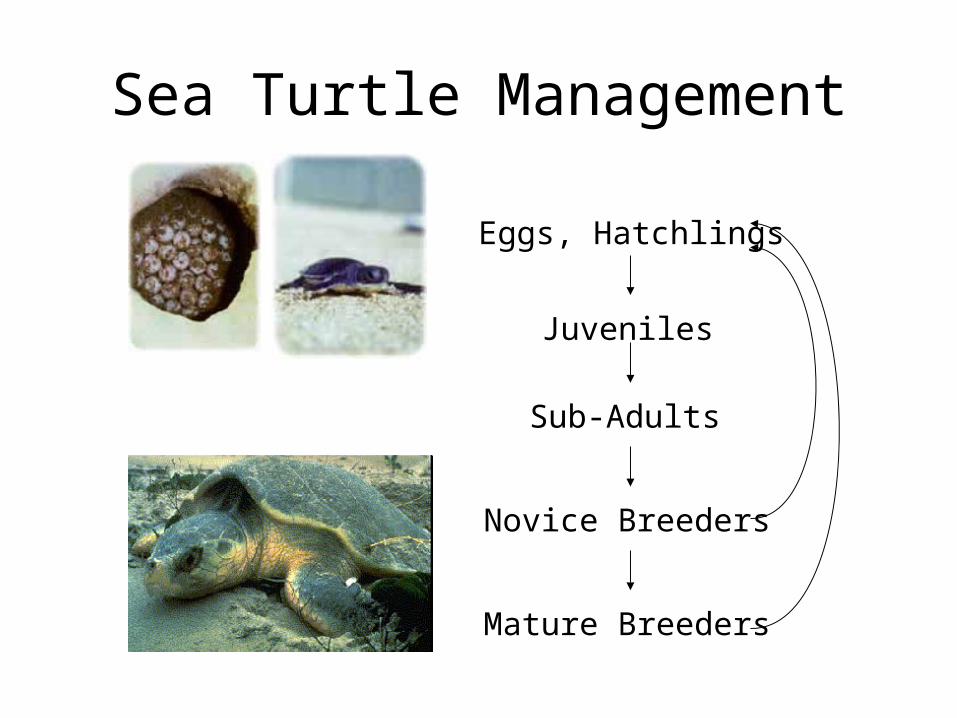
Snow Goose Management
Eggs, Hatchlings
Juveniles
Breeders (Age > 2)
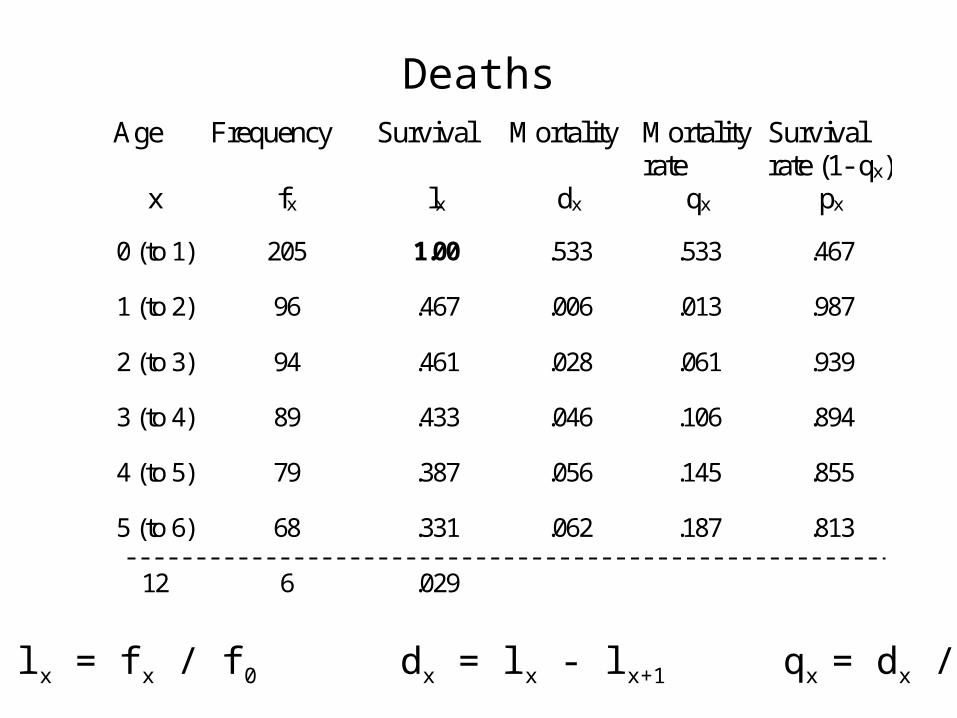
DeathsAge Frequency Survival Mortality Mortality
rate Survival rate (1- qx)
x fx lx dx qx px
0 (to 1) 205 1.00 .533 .533 .467
1 (to 2) 96 .467 .006 .013 .987
2 (to 3) 94 .461 .028 .061 .939
3 (to 4) 89 .433 .046 .106 .894
4 (to 5) 79 .387 .056 .145 .855
5 (to 6) 68 .331 .062 .187 .813
12 6 .029
lx = fx / f0 dx = lx - lx+1 qx = dx / lx
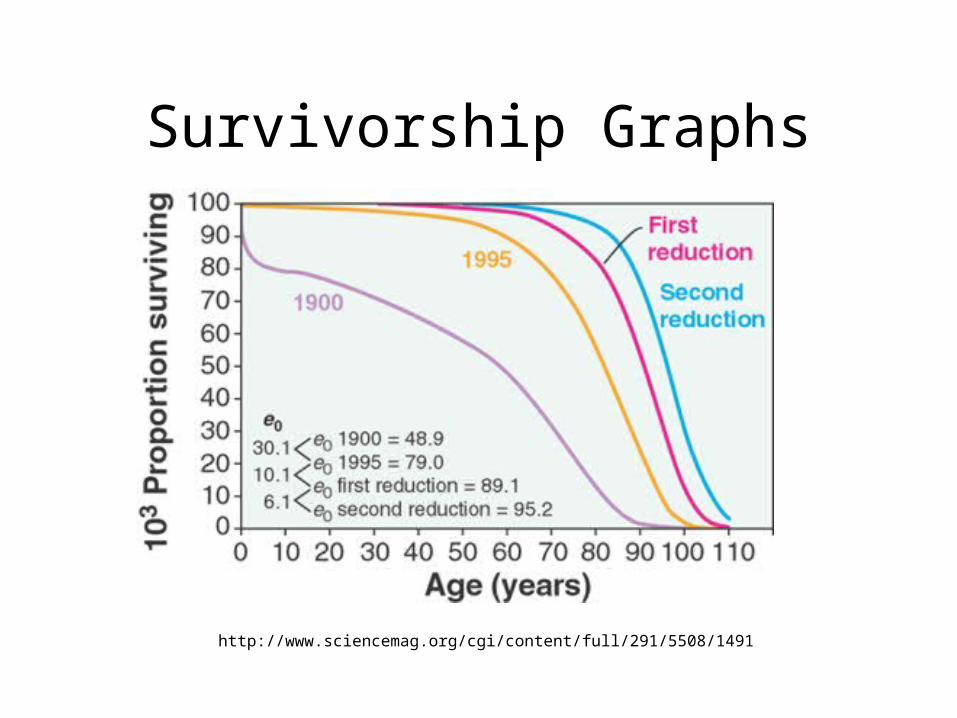
Survivorship Graphs
http://www.sciencemag.org/cgi/content/full/291/5508/1491
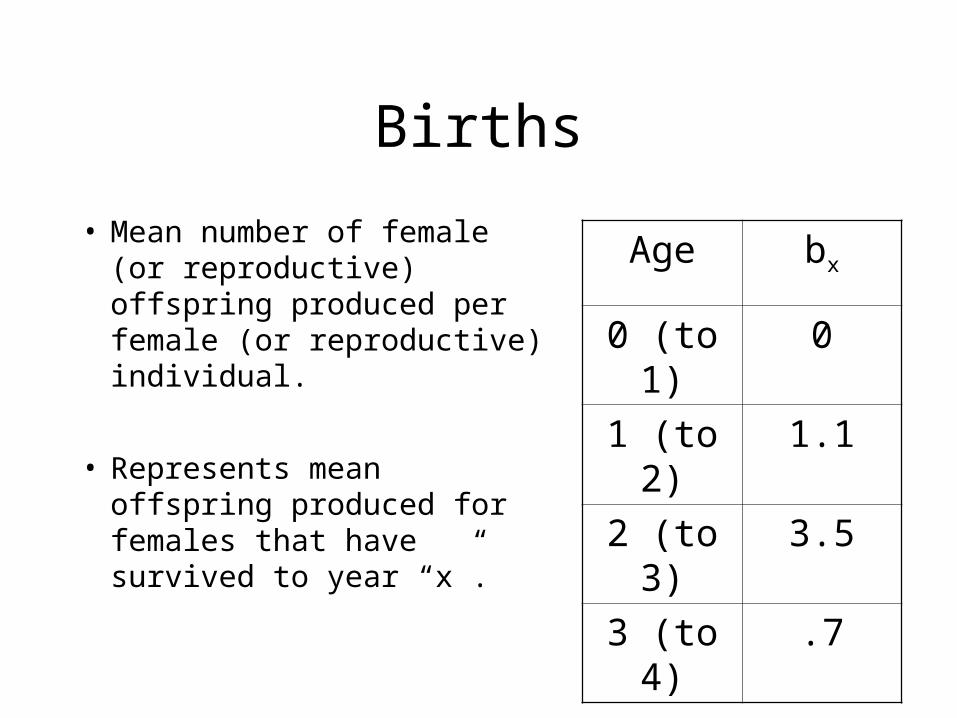
Births
• Mean number of female (or reproductive) offspring produced per female (or reproductive) individual.
• Represents mean offspring produced for females that have survived to year “x”.
Age bx
0 (to 1) 0
1 (to 2) 1.1
2 (to 3) 3.5
3 (to 4) .7

Births
• What would the birth schedule look like for Pacific salmon?
Age bx
0 (to 1)
1 (to 2)
2 (to 3)
3 (to 4)
Births
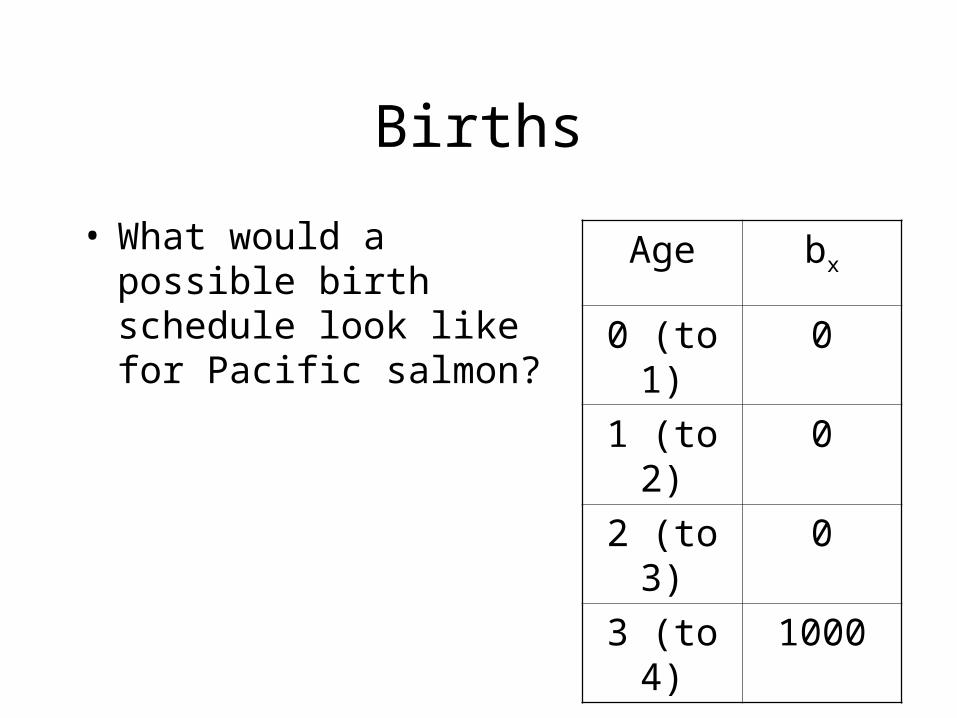
• What would a possible birth schedule look like for Pacific salmon?
Age bx
0 (to 1) 0
1 (to 2) 0
2 (to 3) 0
3 (to 4) 1000

R0
• “Net reproductive rate”
• Mean number of female offspring produced per female over her lifetime
• Mean number of reproductive offspring produced per reproductive individual over its lifetime

Can We Calculate R0 From bx
• Mean number of female offspring produced per female golden lion tamarin.
Age bx
0 (to 1) 0
1 (to 2) 1.1
2 (to 3) 3.5
3 (to 4) .7
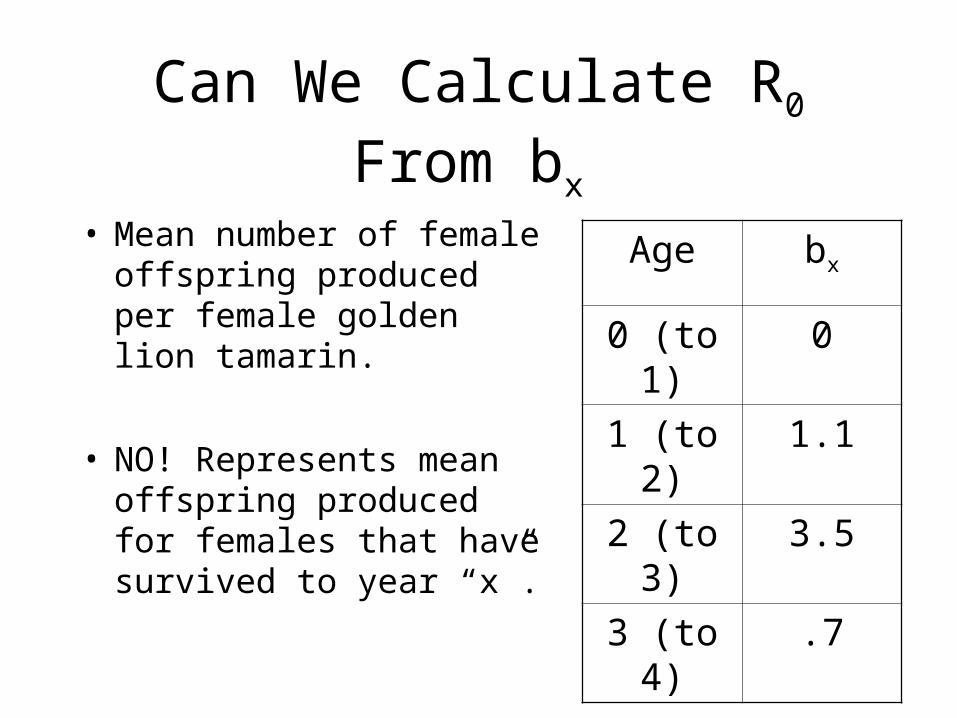
Can We Calculate R0 From bx
• Mean number of female offspring produced per female golden lion tamarin.
• NO! Represents mean offspring produced for females that have survived to year “x”.
Age bx
0 (to 1) 0
1 (to 2) 1.1
2 (to 3) 3.5
3 (to 4) .7
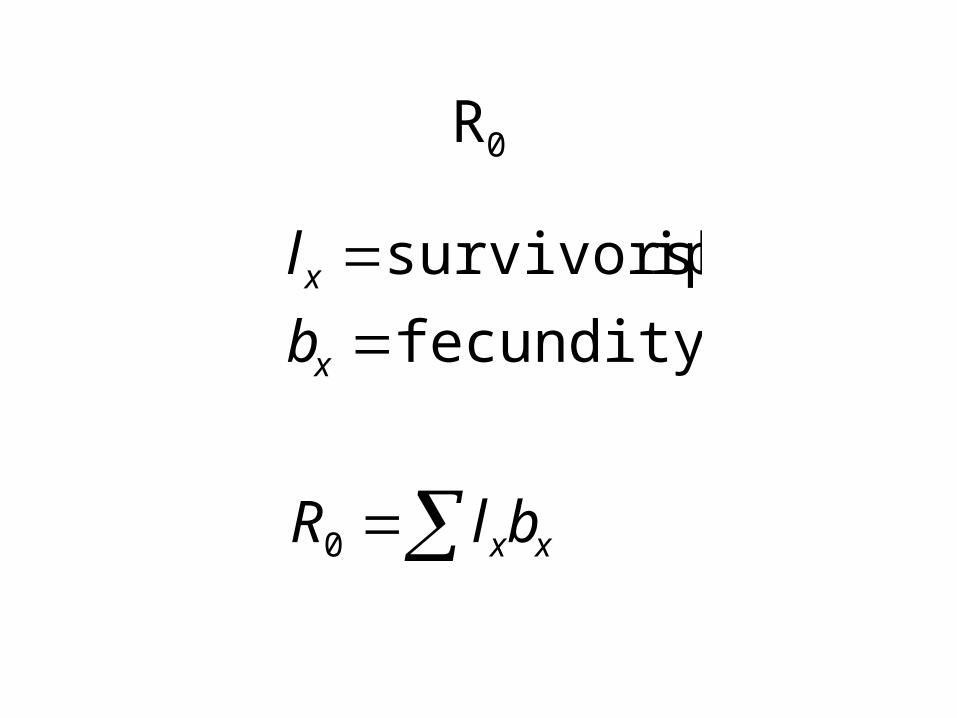
R0
xx
x
x
blR
b
l
0
fecundity
ipsurvivorsh

Calculate R0 for a population of tamarins in which 50% of the females survive to the breeding season each year, starting one year after birth, and then produces 6 offspring (3 females) per year. This continues until the end of their 3rd breeding season, at which time all survivors die of old age.
x lx bx lxbx
0
1
2
3
4
R0
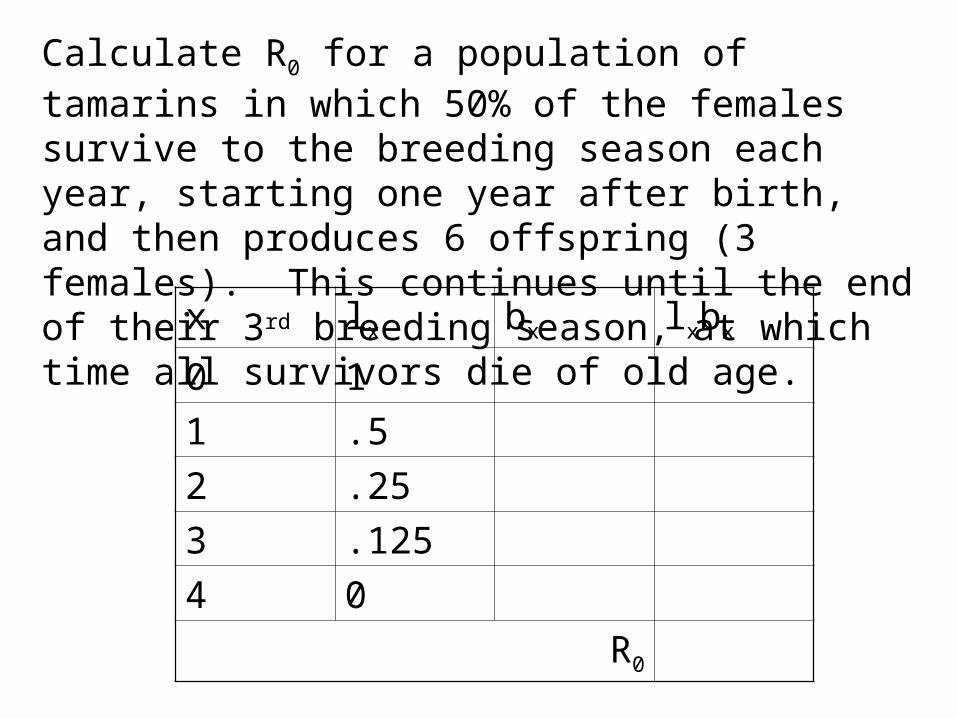
Calculate R0 for a population of tamarins in which 50% of the females survive to the breeding season each year, starting one year after birth, and then produces 6 offspring (3 females). This continues until the end of their 3rd breeding season, at which time all survivors die of old age.
x lx bx lxbx
0 1
1 .5
2 .25
3 .125
4 0
R0
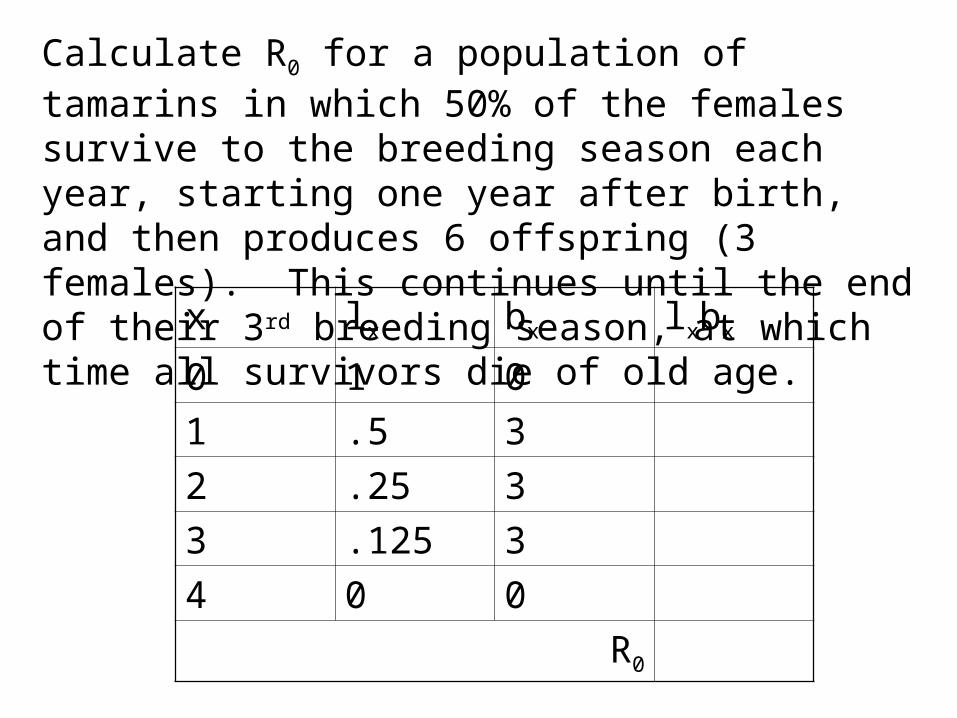
Calculate R0 for a population of tamarins in which 50% of the females survive to the breeding season each year, starting one year after birth, and then produces 6 offspring (3 females). This continues until the end of their 3rd breeding season, at which time all survivors die of old age.
x lx bx lxbx
0 1 0
1 .5 3
2 .25 3
3 .125 3
4 0 0
R0
Calculate R0 for a population of tamarins in which 50% of the females survive to the breeding season each year, starting one year after birth, and then produces 6 offspring (3 females). This continues until the end of their 3rd breeding season, at which time all survivors die of old age.
x lx bx lxbx
0 1 0 0
1 .5 3 1.5
2 .25 3 .75
3 .125 3 .375
4 0 0 0
R0

Calculate R0 for a population of tamarins in which 50% of the females survive to the breeding season each year, starting one year after birth, and then produces 6 offspring (3 females). This continues until the end of their 3rd breeding season, at which time all survivors die of old age.
x lx bx lxbx
0 1 0 0
1 0.5 3 1.5
2 0.25 3 0.75
3 0.125 3 0.375
4 0 0 0
R0 = 2.625
Growth Rates
• Population increases if r > 0, lambda >1, R0 > ?
• Population is constant if r = 0, lambda =1, R0 = ?
• Population declines if r < 0, lambda < 1, or R0 < ?
R0 vs. λ
• R0 defines population growth per generation.
• λ defines population growth for a given time step.
• R0 = λ where 1 time step = 1 generation.
Mean Generation Time (G) and r
• Mean age of all reproducing females
• Mean age of mothers of all newborn females
• Mean time between birth of a mother and all her offspring
xx
xx
bl
xblG
G
Rr
)ln( 0