VEHICLE OVERHEAT PREVENTION SYSTEM: COOLING FAN...
77
VEHICLE OVERHEAT PREVENTION SYSTEM: COOLING FAN FAILURE ALERT SYSTEM TAN KOK HOE UNIVERSITI TUNKU ABDUL RAHMAN
Transcript of VEHICLE OVERHEAT PREVENTION SYSTEM: COOLING FAN...

VEHICLE OVERHEAT PREVENTION
SYSTEM: COOLING FAN FAILURE
ALERT SYSTEM
TAN KOK HOE
UNIVERSITI TUNKU ABDUL RAHMAN
VEHICLE OVERHEAT PREVENTION SYSTEM:
COOLING FAN FAILURE ALERT SYSTEM
TAN KOK HOE
A project report submitted in partial fulfilment of the
requirements for the award of Bachelor of Engineering
(Hons.) Electrical and Electronic
Lee Kong Chian Faculty of Engineering and Science
Universiti Tunku Abdul Rahman
May 2016
ii
DECLARATION
I hereby declare that this project report is based on my original work except for
citations and quotations which have been duly acknowledged. I also declare that it
has not been previously and concurrently submitted for any other degree or award at
UTAR or other institutions.
Signature :
Name : Tan Kok Hoe
ID No. : 12UEB02073
Date :
iii
APPROVAL FOR SUBMISSION
I certify that this project report entitled “VEHICLE OVERHEAT PREVENTION
SYSTEM: COOLING FAN FAILURE ALERT SYSTEM” was prepared by
TAN KOK HOE has met the required standard for submission in partial fulfilment
of the requirements for the award of Bachelor of Engineering (Hons.) Electrical and
Electronic at Universiti Tunku Abdul Rahman.
Approved by,
Signature :
Supervisor : Dr. Chew Kuew Wai
Date :

iv
The copyright of this report belongs to the author under the terms of the
copyright Act 1987 as qualified by Intellectual Property Policy of Universiti Tunku
Abdul Rahman. Due acknowledgement shall always be made of the use of any
material contained in, or derived from, this report.
© 2016, Tan Kok Hoe. All right reserved.

v
ACKNOWLEDGEMENTS
Firstly, I would like to express my sincere gratitude towards my final year project
supervisor, Dr. Chew Kuew Wai for giving me an opportunity to take his final year
project title. His guidance, encouragement, and constructive feedback throughout the
entire duration of the final year project has made this project successfully completed.
I also would like to thank everyone who had contributed during the process of
the project especially my course mates, lecturer and all the lab assistants. The
suggestions, advice, and help have lead to the completion of my project. Besides that,
thanks to the University for providing an opportunity for me to do this project as a
partial fulfilment of the requirement for the degree of Bachelor of Engineering.
Finally, I would like to thank my parent for their support and encouragement
which has led me to achieve this milestone.
vi
VEHICLE OVERHEAT PREVENTION SYSTEM:
COOLING FAN FAILURE ALERT SYSTEM
ABSTRACT
There are many causes which led to vehicle overheat and one of the common causes
is the cooling fan failure. In this project, the failure of the cooling fan system will be
throughout investigated. Most of the time, the failure of the cooling fan is unknown
by the vehicle driver and when the failure is detected, it might be too late and cost a
lot to repair. Heat generated by the engine needed to be dissipated and if fail to do so,
the engine might be seriously damaged due to overheating. Therefore, the cooling
fan in vehicle cooling system is a crucial part which helps to dissipate the engine heat.
With this failure alert system, which serves as a prevention system, the vehicle driver
can take a necessary step before more damage are made to the engine due to
overheating The objective of this project is to develop and built a system which will
alert the vehicle driver when there is a failure on any component of the cooling fan
system. Research is done on engine cooling system and cooling fan in order to
develop the vehicle overheating prevention system. A few sensor are used to monitor
the health of the cooling fan system which will be processed by a controller and
appropriate action will be taken accordingly. The health of the cooling fan system
such as temperature and RPM of the cooling fan will be displayed to the vehicle
driver. Component failure indicator will be illuminated with beeping sound when
there is any failure. A prototype is built to test the functionality of this system. All
the possible failure of the component of the cooling fan system such as relay, coolant
temperature sensor, and fan are tested using appropriated methods and the system is
working perfectly. This project is successfully done.
vii
TABLE OF CONTENTS
DECLARATION ii
APPROVAL FOR SUBMISSION iii
ACKNOWLEDGEMENTS v
ABSTRACT vi
TABLE OF CONTENTS vii
LIST OF TABLES x
LIST OF FIGURES xi
LIST OF SYMBOLS / ABBREVIATIONS xiv
LIST OF APPENDICES xv
CHAPTER
1 INTRODUCTION 1
1.1 General Introduction 1
1.2 Aim and Objective 2
2 LITERATURE REVIEW 3
2.1 Internal Combustion Engine 3
2.2 Vehicle Cooling System 9
2.3 Electric Cooling Fan Circuit 11
2.4 DC Electric Fan 12
2.5 Problem Statement 14
3 METHODOLOGY 15
3.1 Overview 15
viii
3.2 Design of Cooling Fan Alert System 16
3.2.1 Voltage Divider Circuit 17
3.2.2 Hall Effect Current Sensor 19
3.2.3 Hall Effect Tachometer 20
3.2.4 Coolant Temperature Sensor (CTS) 21
3.2.5 Cooling Fan Relay Trigger Circuit 22
3.2.6 Display Design 23
4 RESULT AND DISCUSSION 26
4.1 Prototype 26
4.2 Input 28
4.2.1 Voltage Sensor 28
4.2.2 Current Sensor 29
4.2.3 Hall Effect Tachometer 32
4.2.4 Coolant Temperature Sensor 34
4.3 Output 36
4.3.1 Cooling Fan Relay Trigger Circuit 36
4.3.2 Display 37
4.4 Controller 39
4.4.1 Arduino 39
4.4.2 Program Flow Chart 41
4.5 Function Testing 43
5 ACHIEVEMENT 45
5.1 Competition Participation 45
6 CONCLUSION AND RECOMMENDATION 47
6.1 Conclusion 47
6.2 Future Improvements and Recommendations 48
6.2.1 PIC Microcontroller 48
6.2.2 Enhancing Detection of Cooling System Failure 48
6.2.3 More Precise Tachometer 49

ix
REFERENCES 50
APPENDICES 51
x
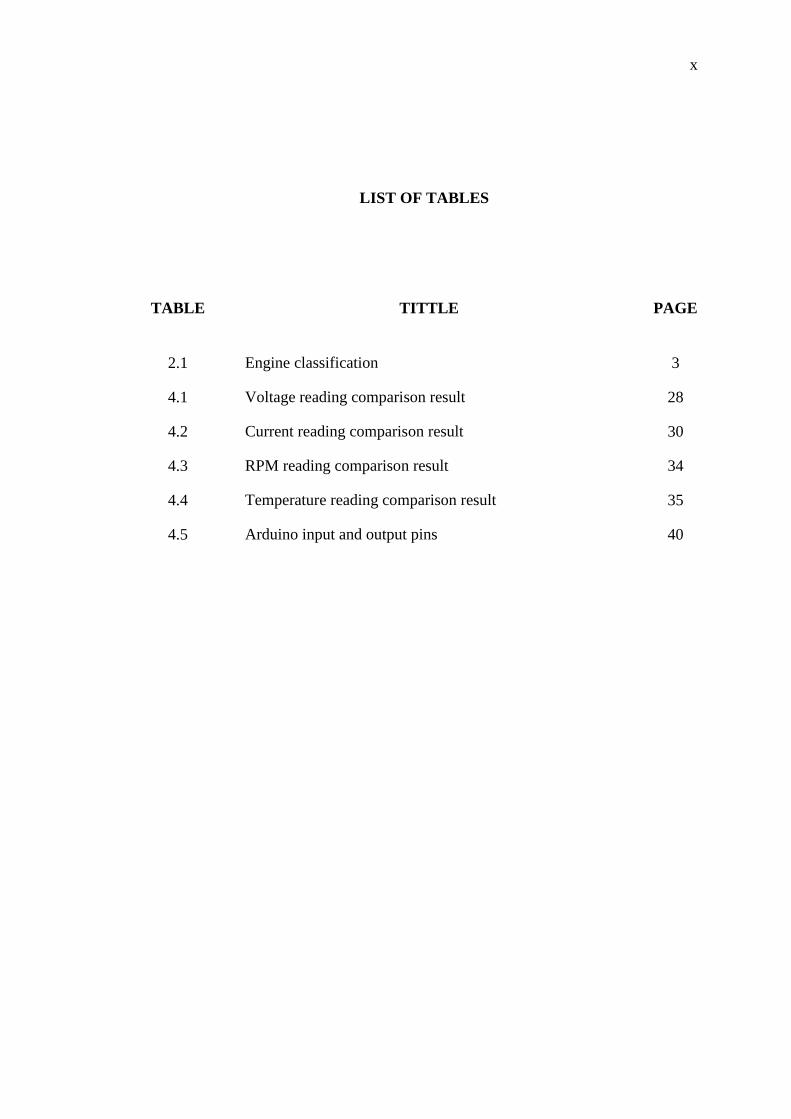
LIST OF TABLES
TABLE TITTLE PAGE
2.1 Engine classification 3
4.1 Voltage reading comparison result 28
4.2 Current reading comparison result 30
4.3 RPM reading comparison result 34
4.4 Temperature reading comparison result 35
4.5 Arduino input and output pins 40
xi
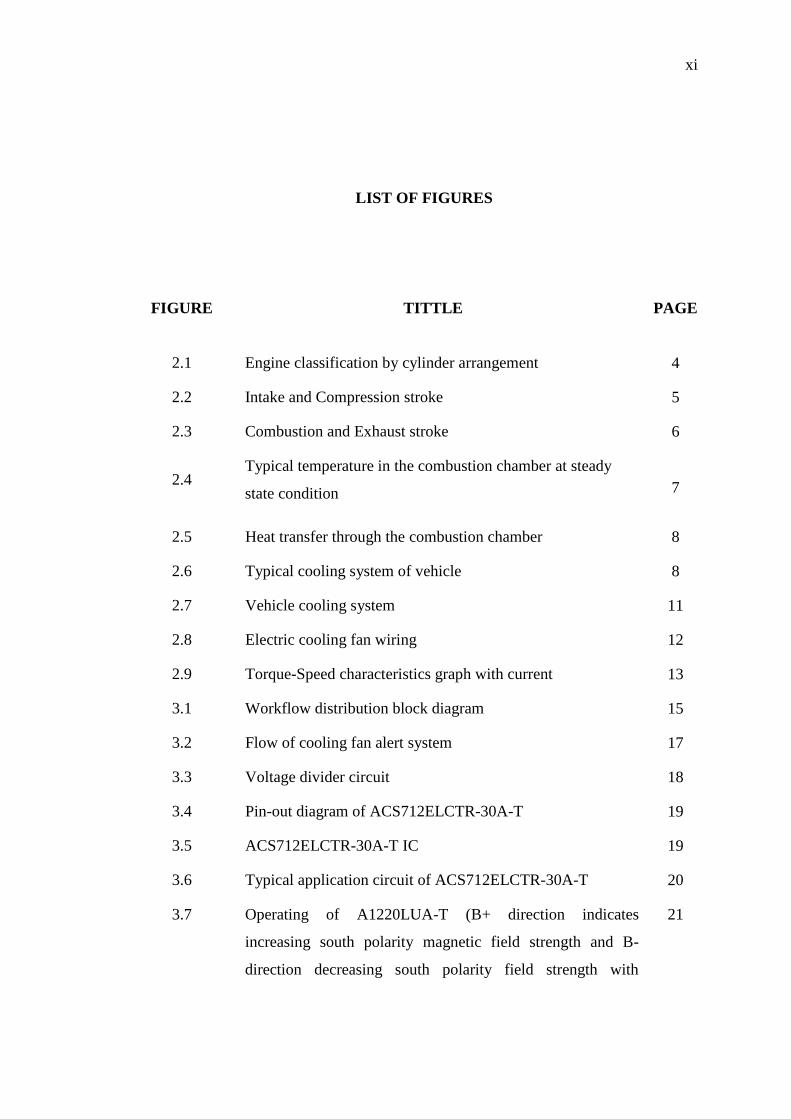
LIST OF FIGURES
FIGURE TITTLE PAGE
2.1 Engine classification by cylinder arrangement 4
2.2 Intake and Compression stroke 5
2.3 Combustion and Exhaust stroke 6
2.4 Typical temperature in the combustion chamber at steady
state condition 7
2.5 Heat transfer through the combustion chamber 8
2.6 Typical cooling system of vehicle 8
2.7 Vehicle cooling system 11
2.8 Electric cooling fan wiring 12
2.9 Torque-Speed characteristics graph with current 13
3.1 Workflow distribution block diagram 15
3.2 Flow of cooling fan alert system 17
3.3 Voltage divider circuit 18
3.4 Pin-out diagram of ACS712ELCTR-30A-T 19
3.5 ACS712ELCTR-30A-T IC 19
3.6 Typical application circuit of ACS712ELCTR-30A-T 20
3.7 Operating of A1220LUA-T (B+ direction indicates
increasing south polarity magnetic field strength and B-
direction decreasing south polarity field strength with
21
xii
increasing north polarity)
3.8 Typical three-wire application circuit of A1220LUA-T 21
3.9 CTS circuit 22
3.10 CTS 22
3.11 Relay trigger circuit 23
3.12 Automotive relay connection 23
3.13 Cooling fan failure alert system display 24
3.14 Display circuit diagram 25
4.1 Cooling fan failure alert system prototype 26
4.2 Circuit board 27
4.3 Arduino unit 27
4.4 Arduino calculated voltage 29
4.5 Multimeter measured voltage 29
4.6 Arduino calculated current 30
4.7 Multimeter measured current 31
4.8 Multimeter measured starting current 32
4.9 Arduino calculated stall current 32
4.10 Implementation of Hall Effect sensor 33
4.11 Measurement of Tachometer and Hall Effect sensor (Green
LED)
34
4.12 Measurement method of CTS 35
4.13 Cooling fan relay 36
4.14 Cooling fan failure alert system display 37
4.15 Cooling fan ON (Left) and OFF (Right) 37
4.16 Coolant temperature logo colour (From top to bottom – Hot,
Warm, Cold)
38
xiii
4.17 Failure indication (From left to right – Relay Fail, CTS Fail,
Fan Fail)
38
4.18 Display circuit mounted on Perspex 39
4.19 Flow chart of cooling fan failure alert system program 41
4.20 Relay detached 43
4.21 Locking of cooling fan motor 44
4.22 Cable replacement 44
5.1 Author champion prize 45
5.2 FYP competition poster 46
5.3 Author first Runner up prize 46

xiv
LIST OF SYMBOLS / ABBREVIATIONS
V Voltage, volt
A Current, ampere
R Resistance, ohm
psi Pounds per square inch
LED Light Emitting Diode
PMDC Permanent Magnet DC
CTS Coolant Temperature Sensor
RPM Rotation per Minutes
IC Integrated Circuit
ADC Analog to Digital Converter
PWM Pulse Width Modulation
PIC Peripheral Interface Controller
xv
LIST OF APPENDICES
APPENDIX TITTLE PAGE
A Full Arduino source codes 51
B MAX7221 IC datasheet 58
C ACS712ELCTR-30A-T datasheet 59
D A1220 datasheet 60
E Display PCB copper layout 61
CHAPTER 1
1 INTRODUCTION
1.1 General Introduction
Most of the time, car driver did not know what has caused their vehicle to overheat
suddenly in the middle of traffics jam or driving along the hills. Some of the car
drivers might stop at the roadside and waited for the vehicle to cold down and check
on the water level of the radiator water tank. After that, the car driver continues their
journey without knowing actually the cooling fan had failed. Some of the car drivers
might not even notice the dashboard of their vehicle showing a “hot” on meter or
indicator which their vehicle is actually overheating and then broke down in the
middle of the road. The engine may be seriously damaged due to engine overheat and
will cost a lot in repairing it.
There are many factors which lead to vehicle overheat such as cooling system
leak, leaky head gasket, leaky water pump, slipping water pump, lower radiator hose
collapsing, plugging or dirty radiator, overworking of the engine and electric cooling
fan failure. However, the vehicle overheat prevention system which to be developed
and built are based on the failure of the electric cooling fan. There are many
prevention methods to avoid vehicle overheat but there is no such integrated solution
yet to be installed in any vehicle to detect failure of cooling fans.
Hence, by developing cooling fan failure alert system helps to provide health
of the cooling fan system and initiate warning on the panel with sound when it fails.
This system also alert car driver whenever there is abnormal of the cooling fan and
2
others related parts such as slow fan speed, temperature sensor failure, and relay
failure. This system gives a prevention measure for the car driver on the cooling fan
failure before it cause serious damage to the engine.
1.2 Aim and Objective
The purpose of this research is to;
Investigate the possible failure of the cooling fan system.
Determine the characteristic of the electric cooling fan.
Determine different specification of the electric cooling fan.
Design and built a system which alerts the car driver on types of failure
which will lead to cooling fan failure.
3
CHAPTER 2
2 LITERATURE REVIEW
2.1 Internal Combustion Engine
Internal Combustion engine is a heat engine which used fuel as chemical energy to
convert into mechanical energy and output as a rotating output shaft (Pulkrabek,
1997). Fuel chemical energy is converted into thermal energy by combustion method
with the mixture of air. The thermal energy is use to drive the piston in the engine
thus convert thermal energy into mechanical energy which is the output of the engine
to drive a system such as a vehicle. There are various types of classification of
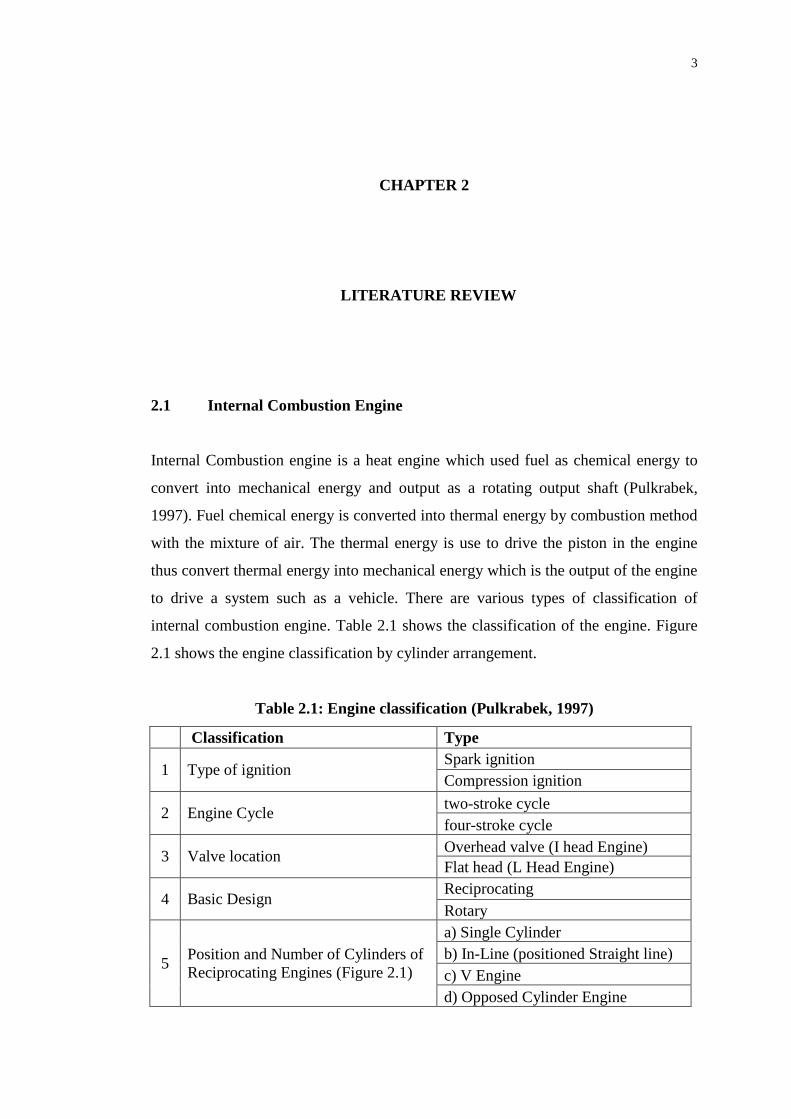
internal combustion engine. Table 2.1 shows the classification of the engine. Figure
2.1 shows the engine classification by cylinder arrangement.
Table 2.1: Engine classification (Pulkrabek, 1997)
Classification Type
1 Type of ignition Spark ignition
Compression ignition
2 Engine Cycle two-stroke cycle
four-stroke cycle
3 Valve location Overhead valve (I head Engine)
Flat head (L Head Engine)
4 Basic Design Reciprocating
Rotary
5 Position and Number of Cylinders of
Reciprocating Engines (Figure 2.1)
a) Single Cylinder
b) In-Line (positioned Straight line)
c) V Engine
d) Opposed Cylinder Engine
4
e) W Engine
f) Opposed Piston Engine
g) Radial Engine
6 Air Intake Process
Naturally Aspirated
Supercharged
Turbocharged
Crankcase Compressed
7 Method of Fuel Input for Spark
Ignited Engines
Carbureted
Multipoint Port Fuel Injection.
Throttle Body Fuel Injection
8 Fuel Used
Gasoline
Diesel Oil or Fuel Oil
Gas, Natural Gas, Methane
LPG.
Alcohol-Ethyl, Methyl
Dual Fuel (gasoline-alcohol)
9 Application
Automobile, Truck, Bus.
Locomotive
Stationary
Marine
Aircraft
10 Type of Cooling Air Cooled
Liquid Cooled, Water Cooled
Figure 2.1: Engine classification by cylinder arrangement (Pulkrabek, 1997)
5
The most common use internal combustion engines in the vehicle today are
four-stroke cycle engines, spark ignited and water cooled. A four-stroke cycle engine
is also known as Otto cycle, in honor of Nikolaus Otto, who invented it in 1967
(Marshall Brain, 2015). The working principle of the four-stroke cycle engine is
explained below.
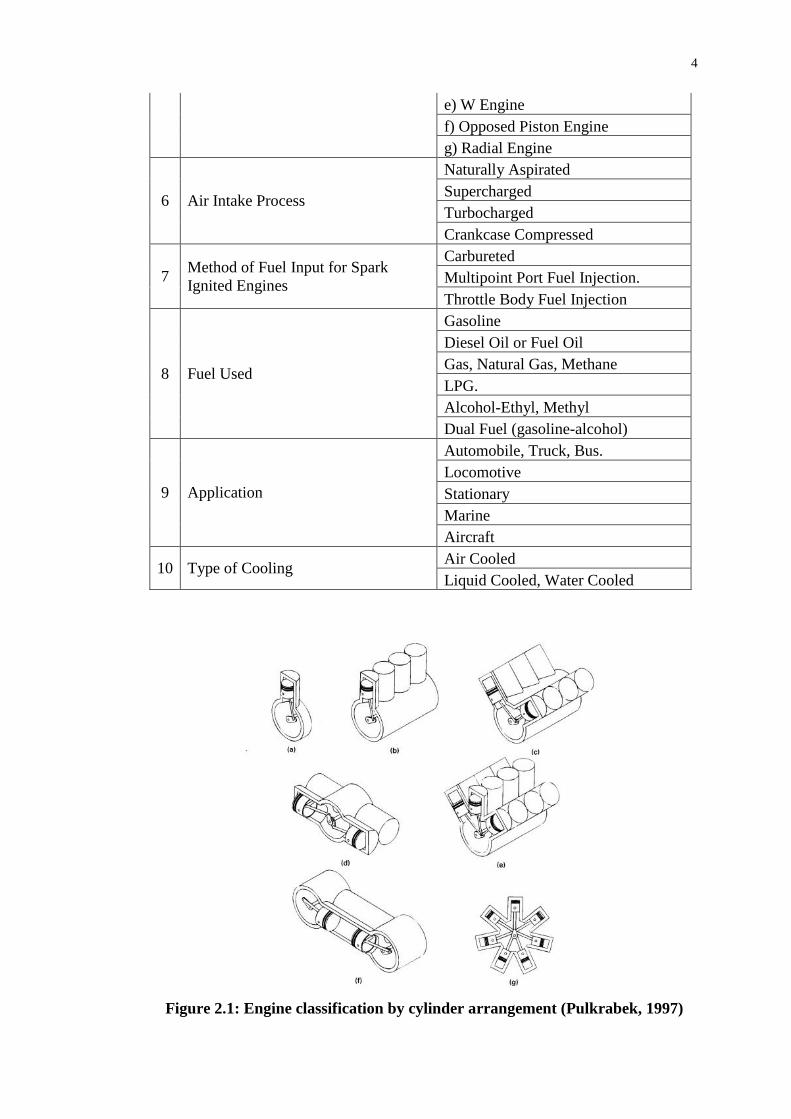
In the first stroke, the intake process takes place. The intake valve is open and
the exhaust valve is closed. The input air is mixed with the desired amount of fuel
and channel into the combustion chamber. The piston moving downward to allow
suction of the mixture of fuel and air into the combustion chamber. After that, the
second stroke takes place, which is compression process. In this process, the mixture
of air and fuel are compressed by the piston moving upward, thus raising the
temperature and pressure in the combustion chamber. Both intake and exhaust valve
are closed at this process. When the piston moved to the peak of the stroke, the spark
parks is fired and ignited the fuel mixture. Explosions in the cylinder are more
powerful due to compression. The stroke one and two of the four-stroke cycle engine
is shown in Figure 2.2.
Figure 2.2: Intake and Compression stroke (Marshall Brain, 2015)
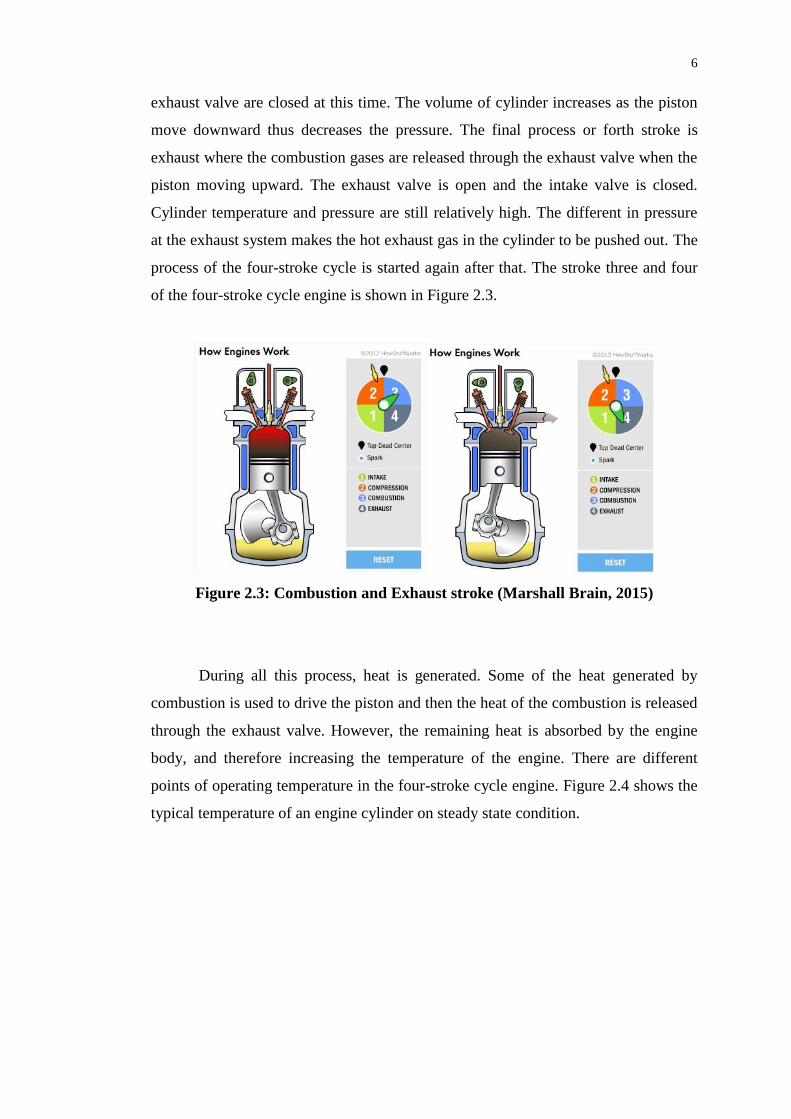
Then, the third stroke takes place. The ignited fuel creates combustion gases
and the high pressure pushed the piston downward. This process is known as
combustion or work as is create work output to move the engine. Both the intake and
6
exhaust valve are closed at this time. The volume of cylinder increases as the piston
move downward thus decreases the pressure. The final process or forth stroke is
exhaust where the combustion gases are released through the exhaust valve when the
piston moving upward. The exhaust valve is open and the intake valve is closed.
Cylinder temperature and pressure are still relatively high. The different in pressure
at the exhaust system makes the hot exhaust gas in the cylinder to be pushed out. The
process of the four-stroke cycle is started again after that. The stroke three and four
of the four-stroke cycle engine is shown in Figure 2.3.
Figure 2.3: Combustion and Exhaust stroke (Marshall Brain, 2015)
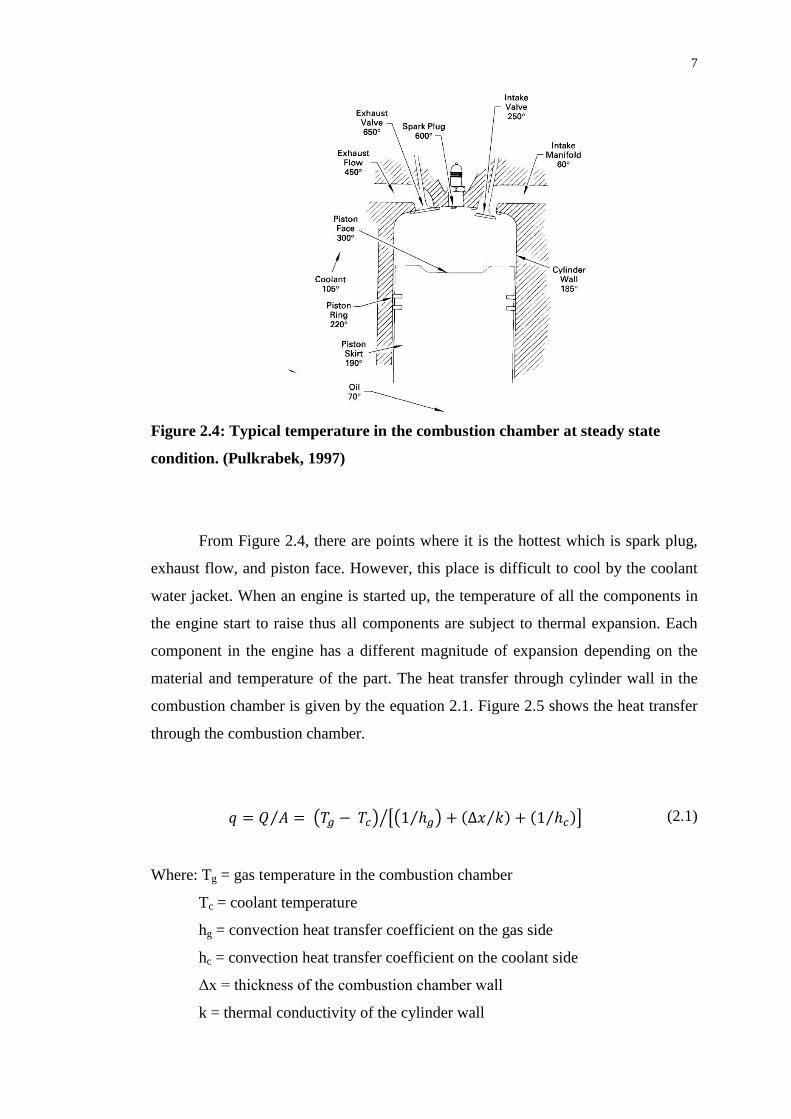
During all this process, heat is generated. Some of the heat generated by
combustion is used to drive the piston and then the heat of the combustion is released
through the exhaust valve. However, the remaining heat is absorbed by the engine
body, and therefore increasing the temperature of the engine. There are different
points of operating temperature in the four-stroke cycle engine. Figure 2.4 shows the
typical temperature of an engine cylinder on steady state condition.
7
Figure 2.4: Typical temperature in the combustion chamber at steady state
condition. (Pulkrabek, 1997)
From Figure 2.4, there are points where it is the hottest which is spark plug,
exhaust flow, and piston face. However, this place is difficult to cool by the coolant
water jacket. When an engine is started up, the temperature of all the components in
the engine start to raise thus all components are subject to thermal expansion. Each
component in the engine has a different magnitude of expansion depending on the
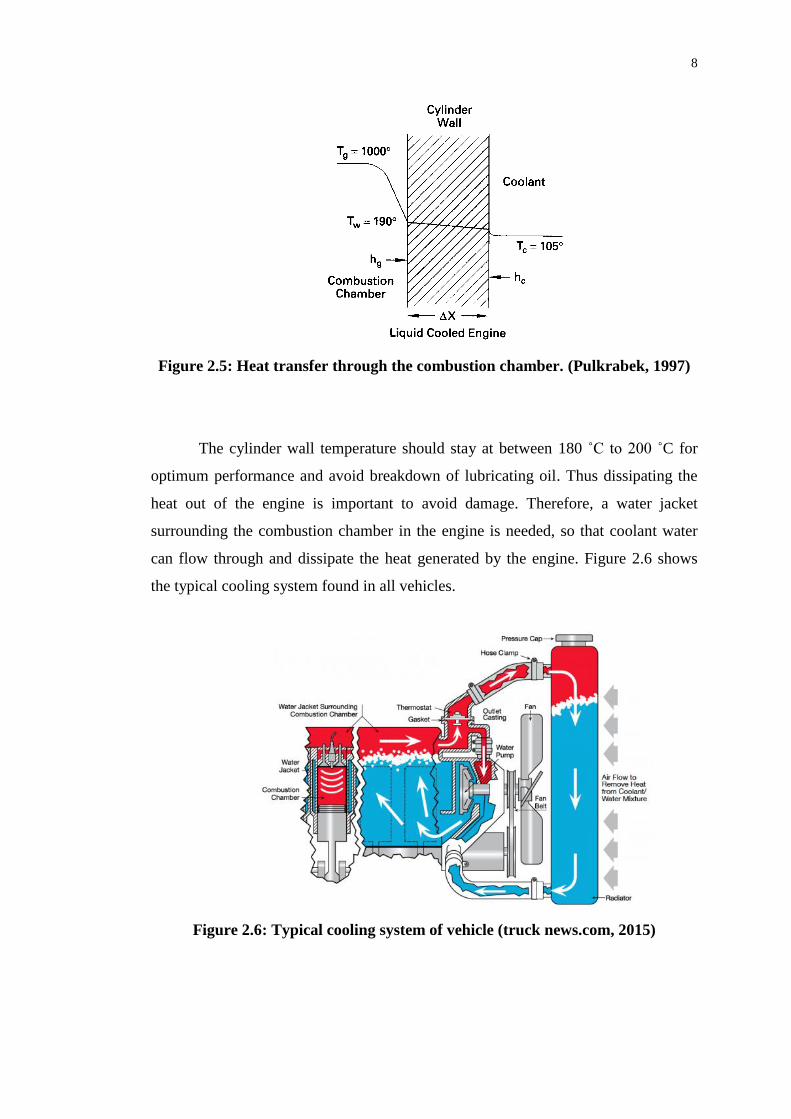
material and temperature of the part. The heat transfer through cylinder wall in the
combustion chamber is given by the equation 2.1. Figure 2.5 shows the heat transfer
through the combustion chamber.
(2.1)
Where: Tg = gas temperature in the combustion chamber
Tc = coolant temperature
hg = convection heat transfer coefficient on the gas side
hc = convection heat transfer coefficient on the coolant side
Δx = thickness of the combustion chamber wall
k = thermal conductivity of the cylinder wall
8
Figure 2.5: Heat transfer through the combustion chamber. (Pulkrabek, 1997)
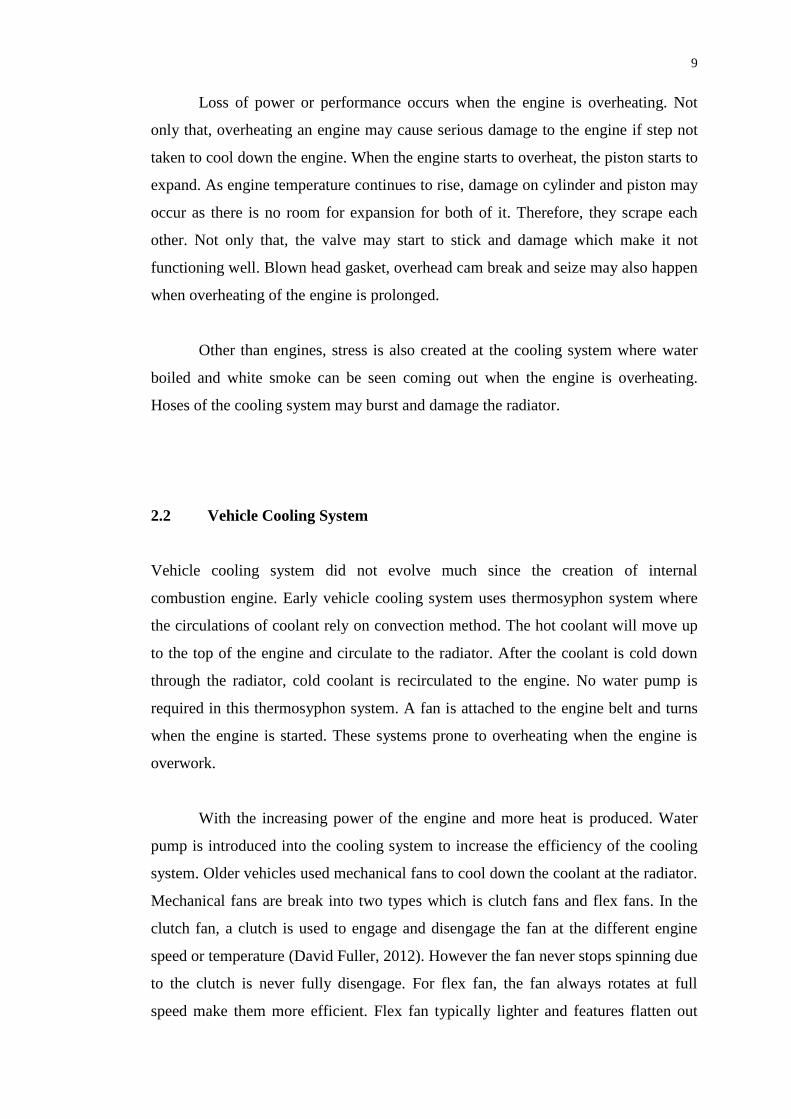
The cylinder wall temperature should stay at between 180 ˚C to 200 ˚C for
optimum performance and avoid breakdown of lubricating oil. Thus dissipating the
heat out of the engine is important to avoid damage. Therefore, a water jacket
surrounding the combustion chamber in the engine is needed, so that coolant water
can flow through and dissipate the heat generated by the engine. Figure 2.6 shows
the typical cooling system found in all vehicles.
Figure 2.6: Typical cooling system of vehicle (truck news.com, 2015)
9
Loss of power or performance occurs when the engine is overheating. Not
only that, overheating an engine may cause serious damage to the engine if step not
taken to cool down the engine. When the engine starts to overheat, the piston starts to
expand. As engine temperature continues to rise, damage on cylinder and piston may
occur as there is no room for expansion for both of it. Therefore, they scrape each
other. Not only that, the valve may start to stick and damage which make it not
functioning well. Blown head gasket, overhead cam break and seize may also happen
when overheating of the engine is prolonged.
Other than engines, stress is also created at the cooling system where water
boiled and white smoke can be seen coming out when the engine is overheating.
Hoses of the cooling system may burst and damage the radiator.
2.2 Vehicle Cooling System
Vehicle cooling system did not evolve much since the creation of internal
combustion engine. Early vehicle cooling system uses thermosyphon system where
the circulations of coolant rely on convection method. The hot coolant will move up
to the top of the engine and circulate to the radiator. After the coolant is cold down
through the radiator, cold coolant is recirculated to the engine. No water pump is
required in this thermosyphon system. A fan is attached to the engine belt and turns
when the engine is started. These systems prone to overheating when the engine is
overwork.
With the increasing power of the engine and more heat is produced. Water
pump is introduced into the cooling system to increase the efficiency of the cooling
system. Older vehicles used mechanical fans to cool down the coolant at the radiator.
Mechanical fans are break into two types which is clutch fans and flex fans. In the
clutch fan, a clutch is used to engage and disengage the fan at the different engine
speed or temperature (David Fuller, 2012). However the fan never stops spinning due
to the clutch is never fully disengage. For flex fan, the fan always rotates at full
speed make them more efficient. Flex fan typically lighter and features flatten out
10
blades which make it greater in efficiency. Mechanical fans are rarely used in the
modern vehicle because mechanical fans have parasitic horsepower loss (David
Fuller, 2012).
In the modern vehicle cooling system, it consists of water pump, radiator,
thermostat, coolant temperature sensor (CTS), coolant, and electric cooling fan.
Water pump, usually driven by the engine belt through a pulley, and it is the heart of
the cooling system where it pumps the coolant. Radiator or also known as heat
exchanger is used to transfer out heats of the heated coolant to the atmosphere.
Thermostat is a valve which controls the flow of the coolant base on the temperature.
CTS is a device to monitor the temperature of the engine and the data is used to
control the electric cooling fan. Most of the CTS used in vehicles are Negative
Temperature Coefficient type where resistance decreases when the temperature
increases (Autoelectrics, 2015).
Inside an engine, it consists of a safe passage through or water jacket which
the coolant can flow through without mixing the engine oil or leakage to the cylinder.
The coolant is pumped by the water pump so that it circulates throughout the system.
When the engine is started, the engine is cold and so for the coolant. Therefore, the
bypass valve of the thermostat was open and the coolant bypassed the radiators and
circulates back to the engine through the bypass hose. As the engine heated up, the
coolant temperature increases and the bypass valve will start to close and main valve
started to open. The thermostat bypass valve usually started to close at the
temperature of 90 ˚C to 110 ˚C (aa1car, 2015).
The hot coolant from the engine flow to the radiator and the cold coolant
from the radiator circulate back to the engine. In most cars, CTS is located near to
the thermostat housing. If the high temperature was sense, it will trigger the electric
cooling fan to blow out the heat at the radiator to the atmosphere so that cold coolant
is circulated back to the engine.
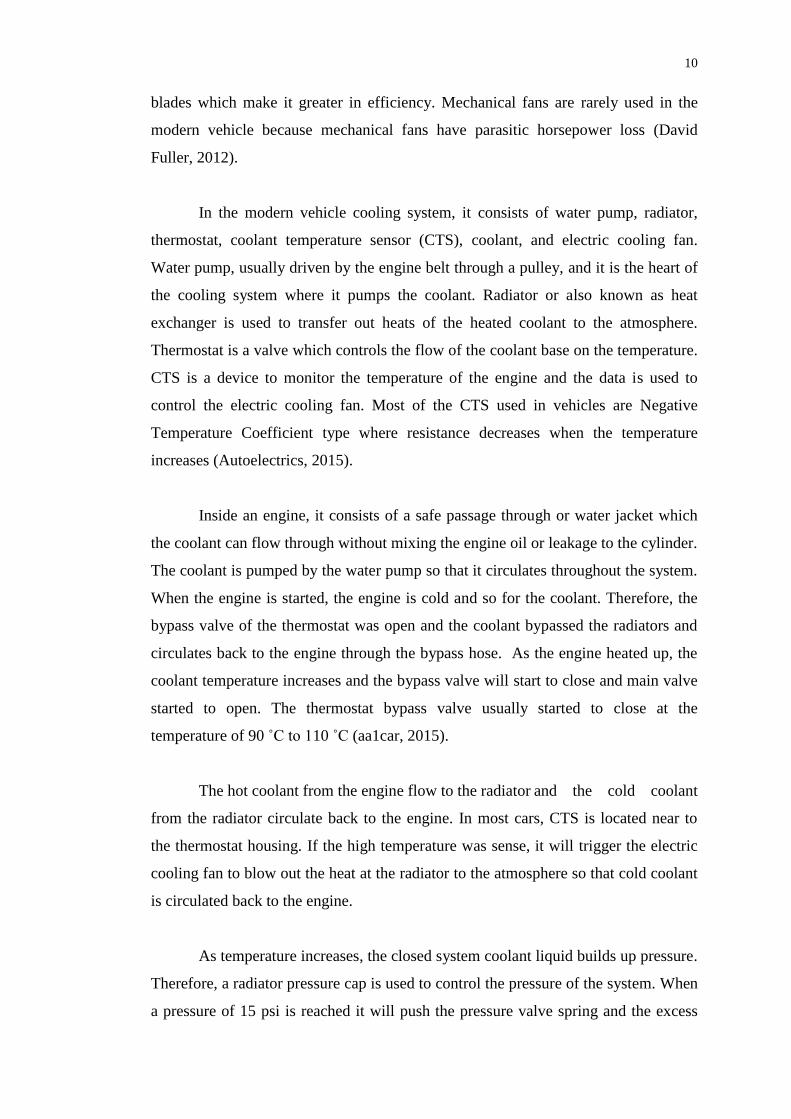
As temperature increases, the closed system coolant liquid builds up pressure.
Therefore, a radiator pressure cap is used to control the pressure of the system. When
a pressure of 15 psi is reached it will push the pressure valve spring and the excess
11
coolant will flow to the expansion tank. When the coolant cools down, the vacuum
inside the system will be sucked back the coolant from the expansion tank. Figure
2.7 shows the entire component in the vehicle cooling system.
Figure 2.7: Vehicle cooling system (How Engine Cooling System Works. 2015)
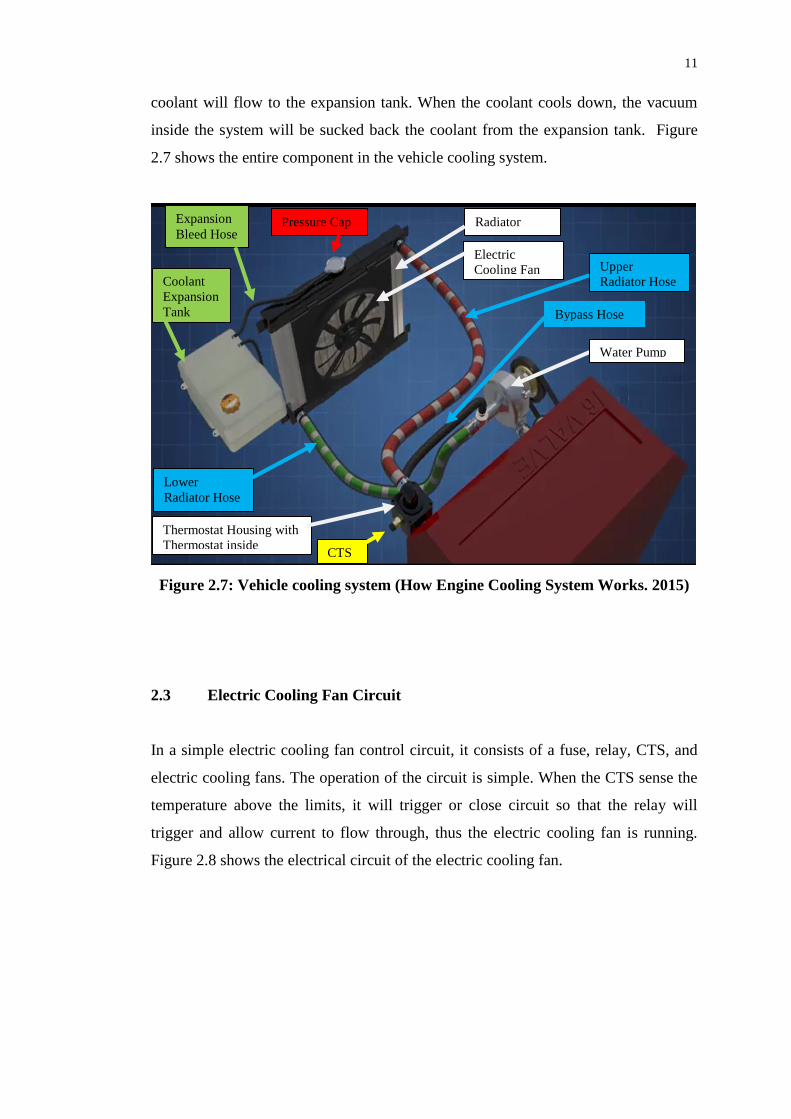
2.3 Electric Cooling Fan Circuit
In a simple electric cooling fan control circuit, it consists of a fuse, relay, CTS, and
electric cooling fans. The operation of the circuit is simple. When the CTS sense the
temperature above the limits, it will trigger or close circuit so that the relay will
trigger and allow current to flow through, thus the electric cooling fan is running.
Figure 2.8 shows the electrical circuit of the electric cooling fan.
Water Pump
Upper
Radiator Hose
Bypass Hose
Lower
Radiator Hose
Thermostat Housing with
Thermostat inside CTS
Electric
Cooling Fan Coolant
Expansion
Tank
Pressure Cap Radiator Expansion
Bleed Hose
12
Figure 2.8: Electric cooling fan wiring (Kevin R. Sullivan, 2015)
There are many possible of failures in these systems. Failures such as blow
fuse, bad relay, and bad CTS could happen. Apart of that, electric cooling fans
ageing and dead lead to the overheating of the engine as the circulated coolant did
not cold down. Component such as relay, CTS, and electric cooling fans need to be
replaced over time as it will fail.
2.4 DC Electric Fan
Most vehicle electric cooling fans used brushed DC electric fans. This type of fans
typically does not last long as there is carbon brush wear and tear applies as time go.
This is why electric cooling fan at the radiator will fail after a few years usage.
Brushed DC electric cooling fans consist of a brushed DC motor. The construction of
this brushed DC motor is simple, and consists of stator, armature (rotor), a
commutator and brushes.
The stator in an electric cooling fan is a permanent magnet rather than an
electromagnetics winding. One or more winding is wound around the highly
permeable steel layers which form the rotor. When electricity is applied, it generated
a magnetic field which cut the magnetics field of the magnet causing the rotor to turn.
A commutator or a split ring is placed at the end of the axle of the rotor. Commutator
13
acts like a switch which switches over the direction of current flow in the winding as
it rotates. The spring loaded carbon brush is contacted with the commutator to supply
electricity to the winding.
Due to the absent of excitation winding, PMDC motor is cheaper and smaller
in size. As there is no excitation winding, no power is consumed in this part thus
improve the efficiency of the motor. PMDC motor has good speed control
capabilities however the permanent magnet properties will lose over time which
causes the performance of the motor to decline.
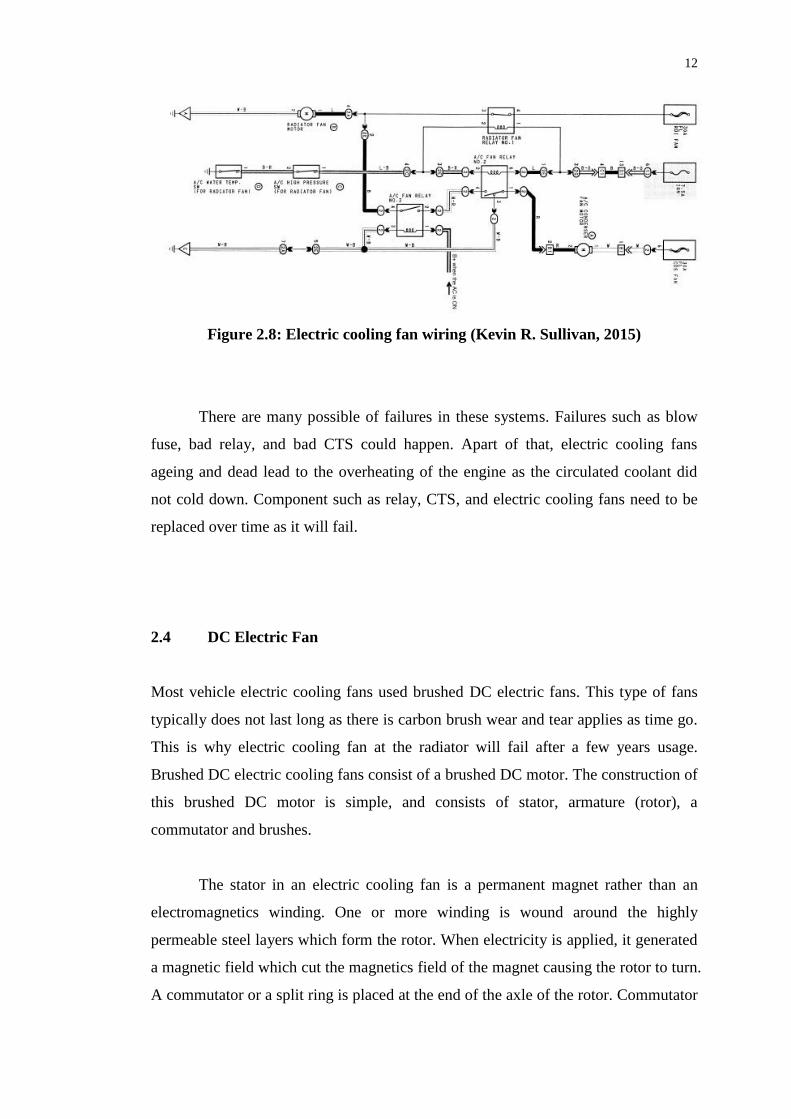
The torque-speed characteristics of the PMDC motor tend to have a much
linear characteristic than other types of DC motors (SDT Drive Technology, 2015).
PMDC output power is limited due to the characteristics of permanent magnet, thus,
the usage of PMDC are normally in motion instrumentation such as fans. At normal
operating condition, PMDC motor rotates at the designed speed, however as the
torque applied to the motor, the speed decreases. At very high torque the speed of the
motor will be stalled. As the torque increases, the current increases steadily. Figure
2.9 shows the Torque- Speed characteristics graph with current.
Figure 2.9: Torque-Speed characteristics graph with current (SDT Drive
Technology, 2015)
DC electric fan airflow is measured in cubic feet per minutes (CFM). The
airflow needed to cold the coolant at the radiator is depends on the engine
14
horsepower and the heat generated. DC electric fan come in different size, mounting,
RPM and CFM depending on the manufacturer. Therefore, current draw by the DC
electric motor is different depending on the specification. Furthermore, these electric
fans have single or dual fans configuration.
2.5 Problem Statement
Existing systems of the vehicle cooling system tend to fail due to relay failure, CTS
failure, and cooling fan failure. This will cause the vehicle to overheat and if no
prevention measures are taken, it will cause serious damage to the engine. Heat
generated by the engine must be cold down via the cooling system. Without a proper
alert system to indicate the failure of the cooling fan which leads to overheating will
cost a lot to repair.
As an engine is the heart of the vehicle, preventing the engine from
overheating is a must. Therefore, cooling fan alert system will be built to help solve
the vehicle overheating issues. An Arduino microcontroller will be used as data
processing coupled with some input such as voltage and current of the cooling fan,
RPM of the cooling fan and temperature of the coolant. The output of this system is
to alert vehicle owner when any abnormality of the cooling fan and parts are detected.
Thus, early inspection can be done to prevent the vehicle from overheat.
15
CHAPTER 3
3 METHODOLOGY
3.1 Overview
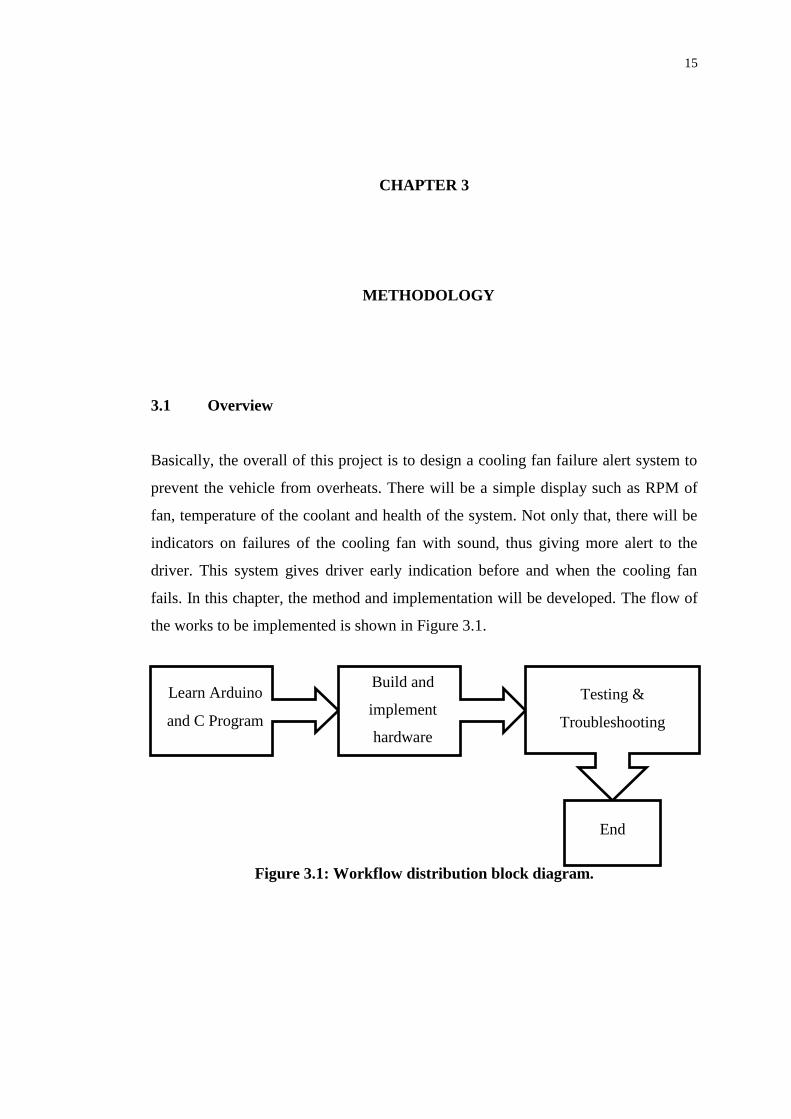
Basically, the overall of this project is to design a cooling fan failure alert system to
prevent the vehicle from overheats. There will be a simple display such as RPM of
fan, temperature of the coolant and health of the system. Not only that, there will be
indicators on failures of the cooling fan with sound, thus giving more alert to the
driver. This system gives driver early indication before and when the cooling fan
fails. In this chapter, the method and implementation will be developed. The flow of
the works to be implemented is shown in Figure 3.1.
Figure 3.1: Workflow distribution block diagram.
Learn Arduino
and C Program
Build and
implement
hardware
Testing &
Troubleshooting
End
16
3.2 Design of Cooling Fan Alert System
In the cooling fan alert system, there will be three parts which are data collection,
data processing and signal output. The electric cooling fan used in this project is
from typical sedan vehicle. The specification of this typical electric cooling fan is
used to helps data processing of the system based on the input. Among the data will
be collected are CTS output, cooling fans speed, and cooling fan voltage and current.
This data collected will be channel to Arduino through digital and analog input and
will be process to trigger appropriate output. Finally, the Arduino will give output
through digital port to display and relay circuit.
The working of this system is simple. The temperature of the coolant will be
known through the signal from the CTS. The cooling fans will be trigger when the
temperature is above 100 ˚C or when CTS is failed and stop when the temperature is
below 90 ˚C. A high or low signal will be sent to the relay circuit to trigger the
cooling fan. After the cooling fan is triggered, the RPM, voltage and current of the
cooling fans are monitors. Any abnormal on the RPM, voltage and current of the
cooling fan, alerts will be displayed to the vehicle driver to indicate the type of
failure. Through monitoring the input of all the sensors, the types of failure can be
detected.
To detect the failure of the relay, voltage is measured at the output of the
relay contactor when the relay circuit is triggered. If there is no voltage flow through
the output of the relay, the relay part fails or damaged. There are two methods to
detect fan failure. First of all is by detecting the current flow through the cooling fan
where if the current is two times higher than the nominal current then the cooling fan
is stuck or motor of the cooling fan is damaged. Secondly is by detecting the RPM of
the cooling fan where if the RPM of the cooling fan is below half of the typical RPM
then the cooling fan is going to dead.
The state of the temperature of cold, warm and hot are defined in below
30 °C, between 30 °C to 120 °C, and above 120 °C respectively. There are also two
methods to detect the failure of CTS. Firstly is by determining the temperature of the
CTS after the engine started for 2 minutes where the temperature should reach above
17
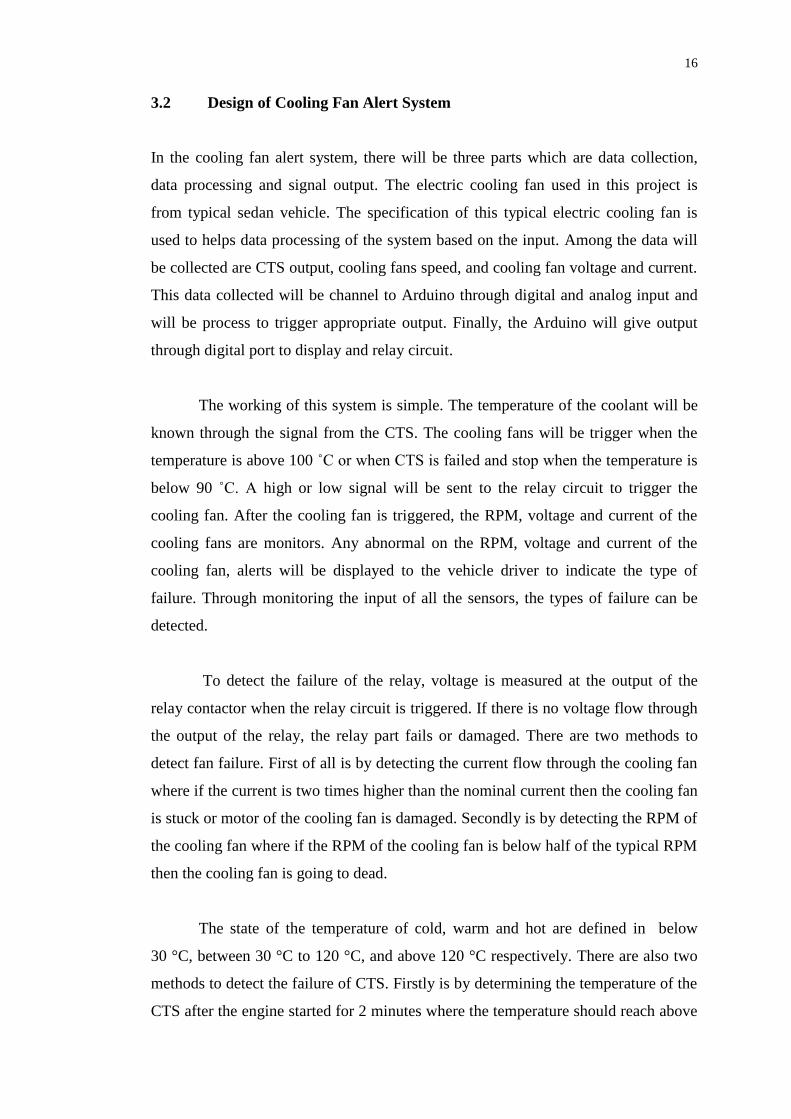
50 °C. If the temperature does not reach above 50 °C, CTS is consider failed and
need replacement. The second method is by determining the input voltage from the
voltage divider circuit of CTS where it should not give a maximum 5 V. If it happens
to give a maximum voltage of 5 V then the CTS is totally dead where there is no
more resistance from the CTS itself. Figure 3.2 shows the flow of the cooling fan
alert system.
Figure 3.2: Flow of cooling fan alert system.
Proper implementation of the hardware in the cooling fan failure alert system
is important to ensure the quality and reliability of the system. The hardware is
separated into few parts for easy assembly. There will be voltage detector circuit,
Hall Effect current sensor circuit, Hall Effect tachometer circuit, cooling fan relay
trigger circuit, and Arduino microcontroller.
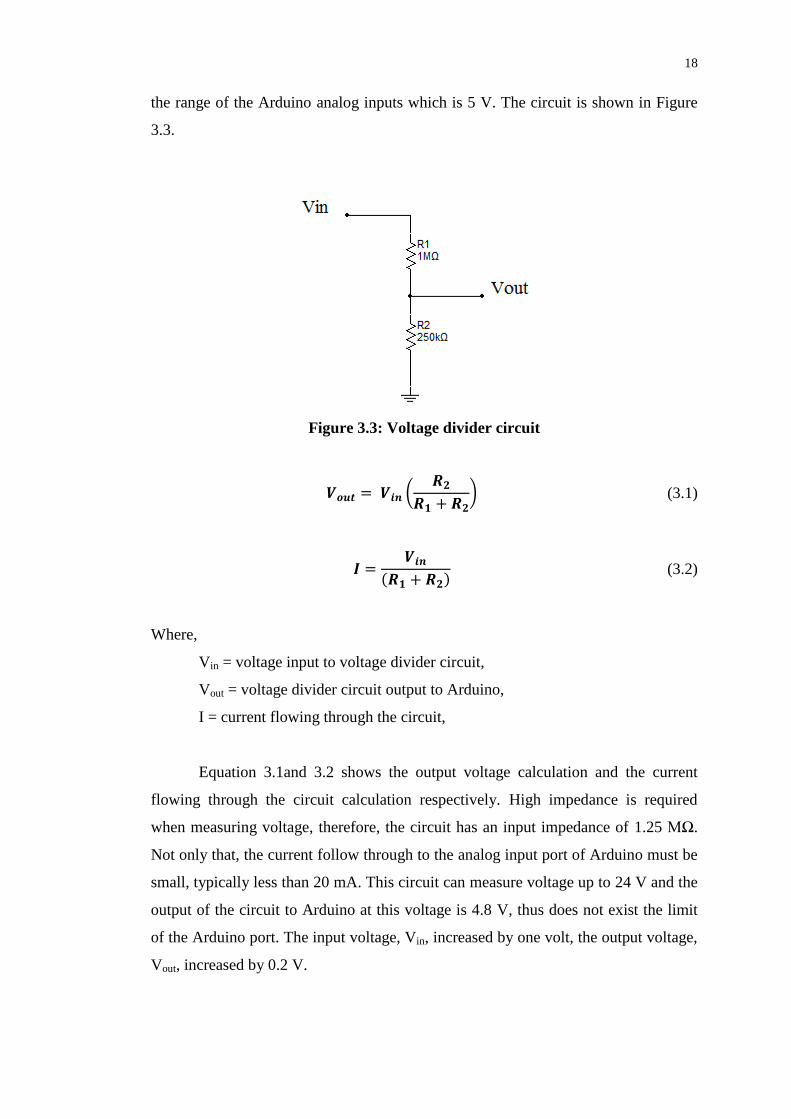
3.2.1 Voltage Divider Circuit
To measure the voltage of the cooling fan, a simple voltage divider circuit is used
which consist of two resistors in series so that the output of the voltage divider is at
18
the range of the Arduino analog inputs which is 5 V. The circuit is shown in Figure
3.3.
Figure 3.3: Voltage divider circuit
(3.1)
(3.2)
Where,
Vin = voltage input to voltage divider circuit,
Vout = voltage divider circuit output to Arduino,
I = current flowing through the circuit,
Equation 3.1and 3.2 shows the output voltage calculation and the current
flowing through the circuit calculation respectively. High impedance is required
when measuring voltage, therefore, the circuit has an input impedance of 1.25 MΩ.
Not only that, the current follow through to the analog input port of Arduino must be
small, typically less than 20 mA. This circuit can measure voltage up to 24 V and the
output of the circuit to Arduino at this voltage is 4.8 V, thus does not exist the limit
of the Arduino port. The input voltage, Vin, increased by one volt, the output voltage,
Vout, increased by 0.2 V.
19
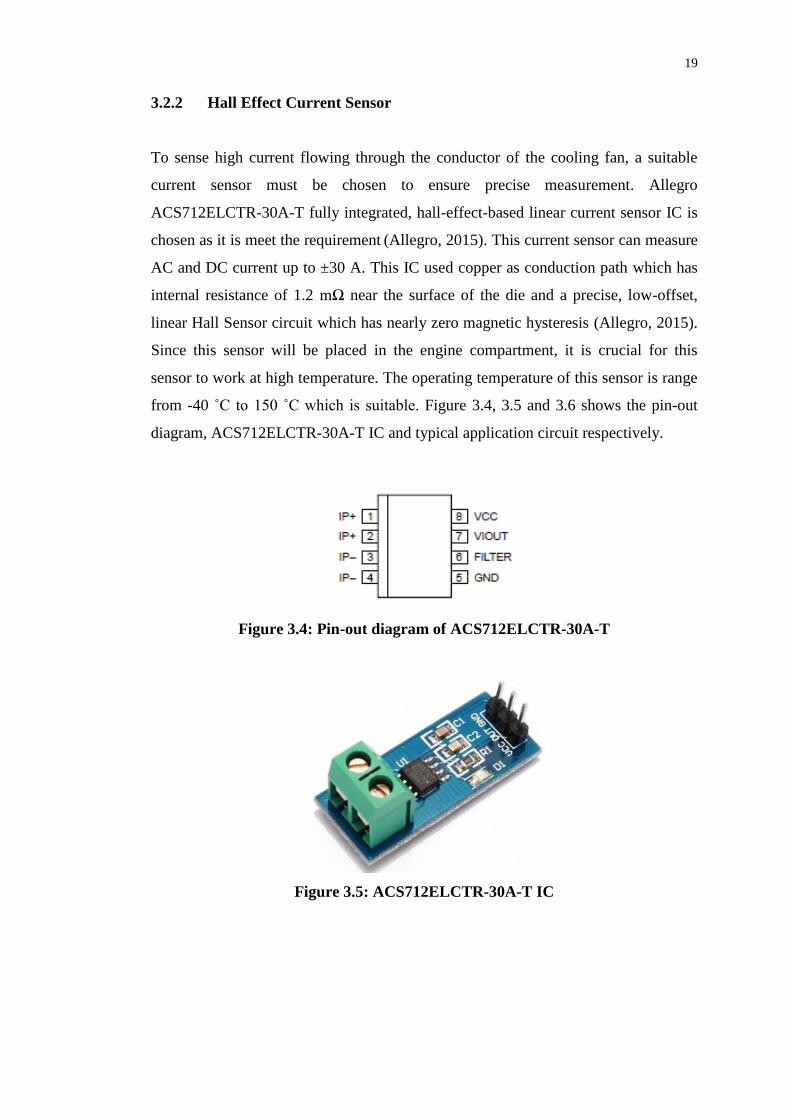
3.2.2 Hall Effect Current Sensor
To sense high current flowing through the conductor of the cooling fan, a suitable
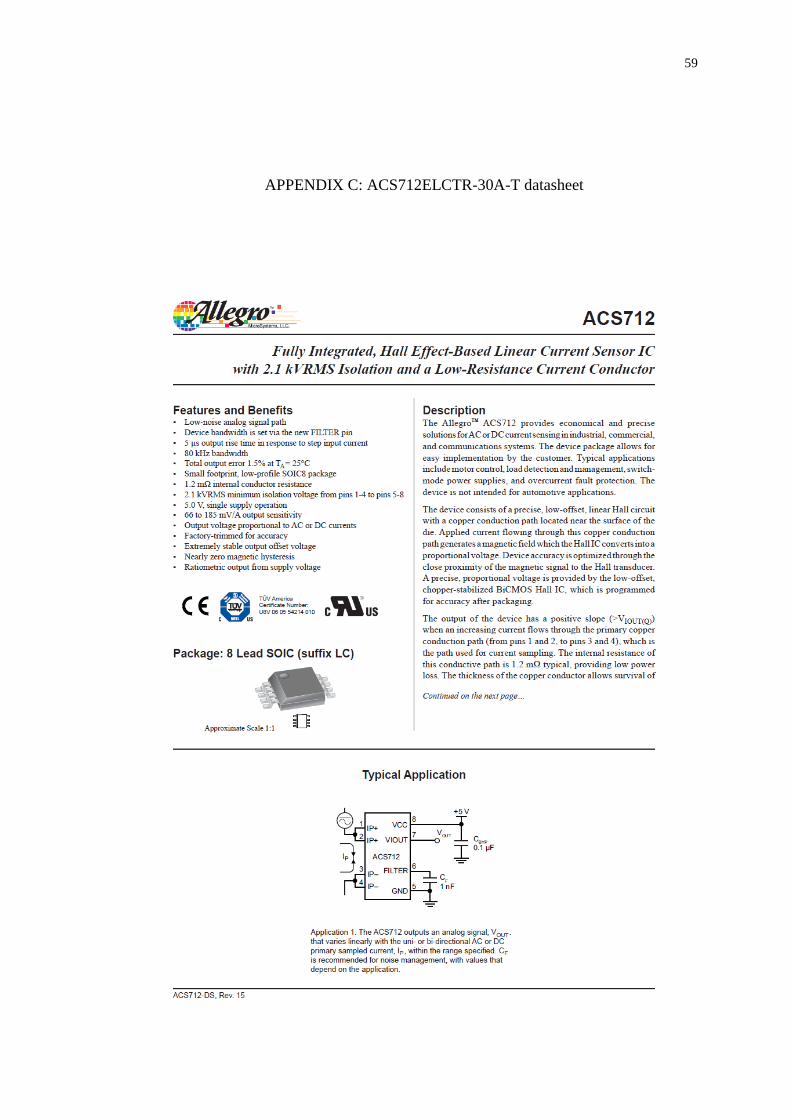
current sensor must be chosen to ensure precise measurement. Allegro
ACS712ELCTR-30A-T fully integrated, hall-effect-based linear current sensor IC is
chosen as it is meet the requirement (Allegro, 2015). This current sensor can measure
AC and DC current up to ±30 A. This IC used copper as conduction path which has
internal resistance of 1.2 mΩ near the surface of the die and a precise, low-offset,
linear Hall Sensor circuit which has nearly zero magnetic hysteresis (Allegro, 2015).
Since this sensor will be placed in the engine compartment, it is crucial for this
sensor to work at high temperature. The operating temperature of this sensor is range
from -40 ˚C to 150 ˚C which is suitable. Figure 3.4, 3.5 and 3.6 shows the pin-out
diagram, ACS712ELCTR-30A-T IC and typical application circuit respectively.
Figure 3.4: Pin-out diagram of ACS712ELCTR-30A-T
Figure 3.5: ACS712ELCTR-30A-T IC
20
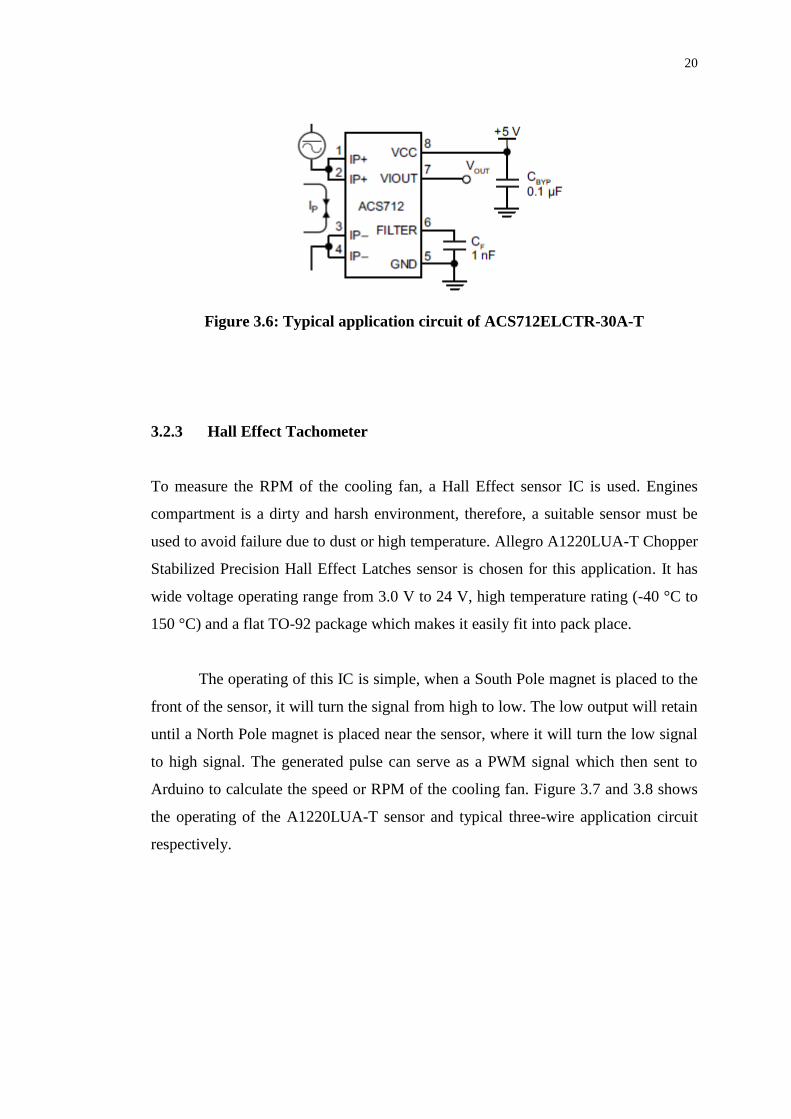
Figure 3.6: Typical application circuit of ACS712ELCTR-30A-T
3.2.3 Hall Effect Tachometer
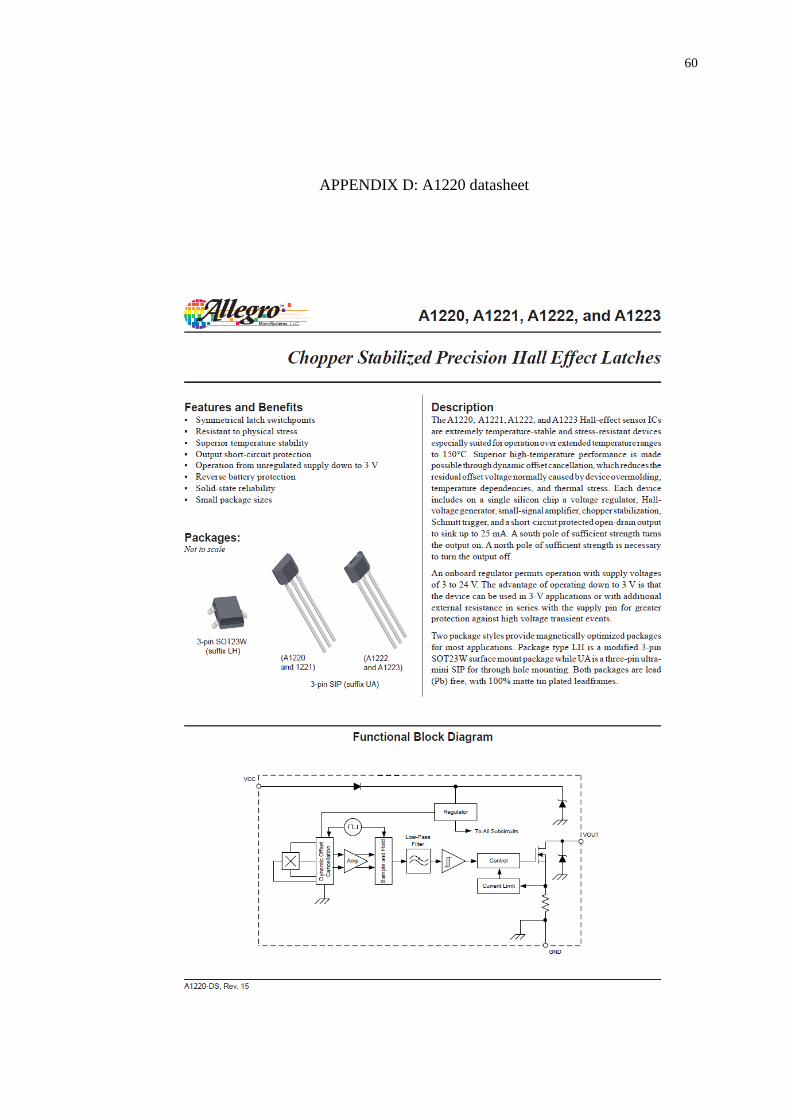
To measure the RPM of the cooling fan, a Hall Effect sensor IC is used. Engines
compartment is a dirty and harsh environment, therefore, a suitable sensor must be
used to avoid failure due to dust or high temperature. Allegro A1220LUA-T Chopper
Stabilized Precision Hall Effect Latches sensor is chosen for this application. It has
wide voltage operating range from 3.0 V to 24 V, high temperature rating (-40 °C to
150 °C) and a flat TO-92 package which makes it easily fit into pack place.
The operating of this IC is simple, when a South Pole magnet is placed to the
front of the sensor, it will turn the signal from high to low. The low output will retain
until a North Pole magnet is placed near the sensor, where it will turn the low signal
to high signal. The generated pulse can serve as a PWM signal which then sent to
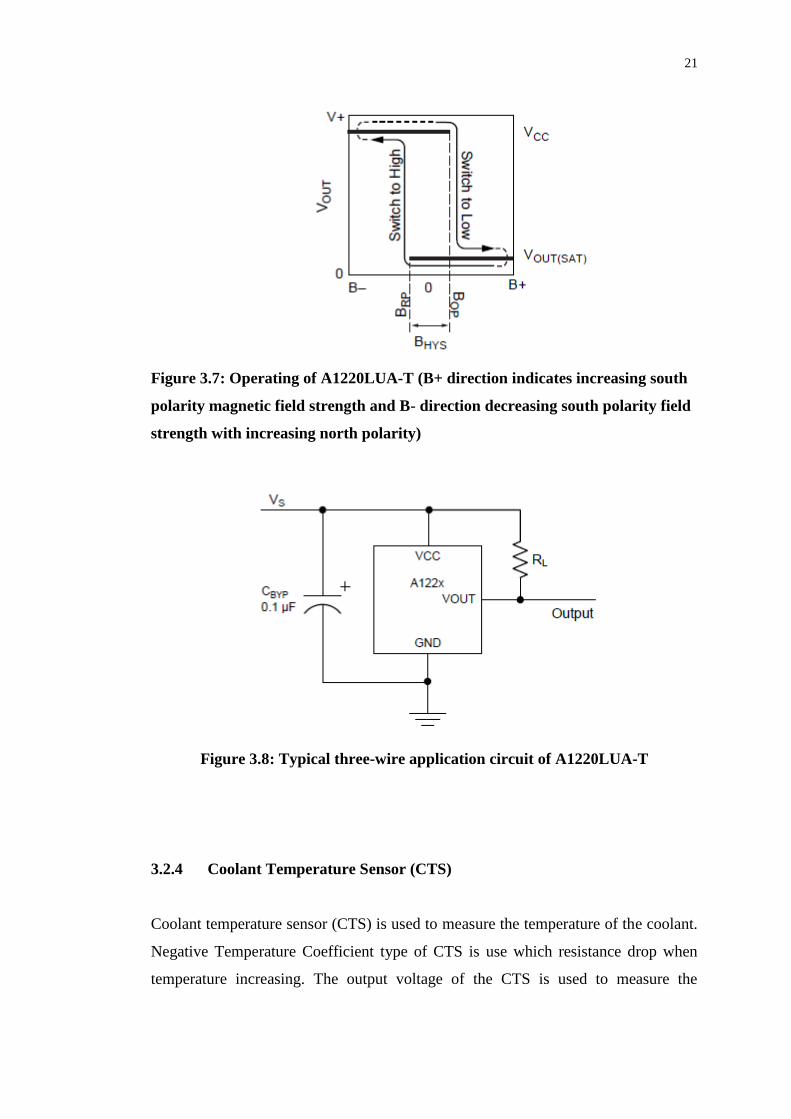
Arduino to calculate the speed or RPM of the cooling fan. Figure 3.7 and 3.8 shows
the operating of the A1220LUA-T sensor and typical three-wire application circuit
respectively.
21
Figure 3.7: Operating of A1220LUA-T (B+ direction indicates increasing south
polarity magnetic field strength and B- direction decreasing south polarity field
strength with increasing north polarity)
Figure 3.8: Typical three-wire application circuit of A1220LUA-T
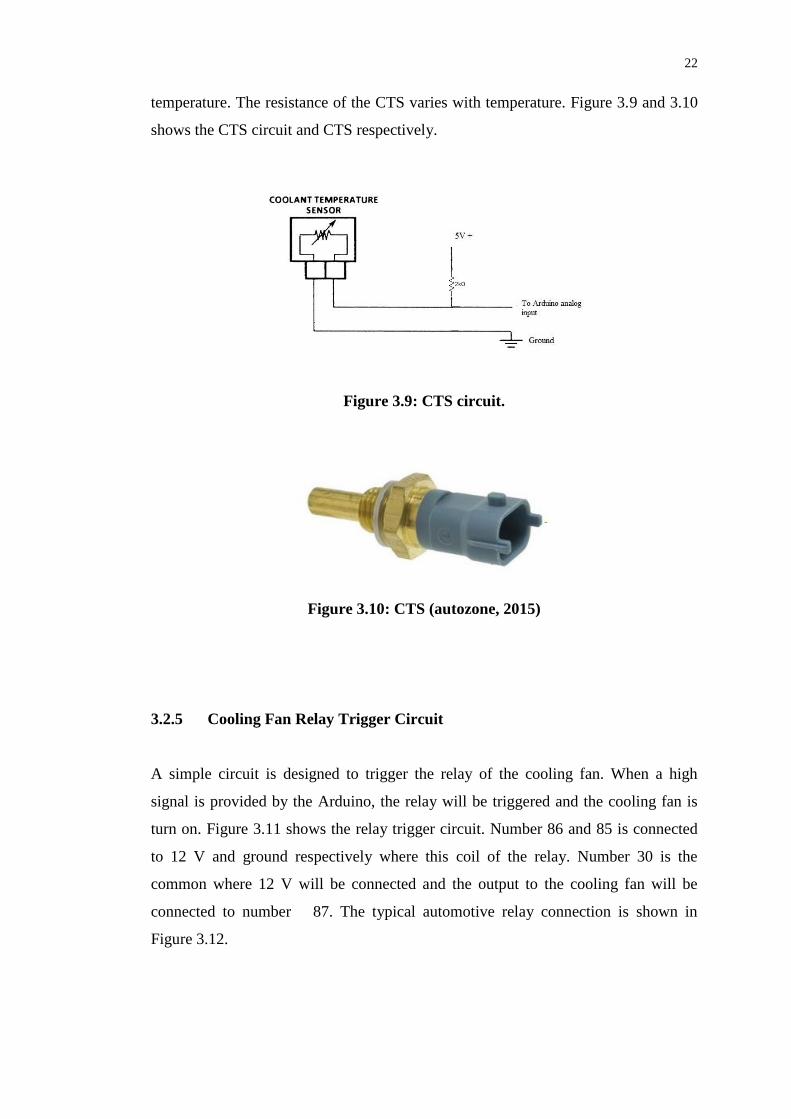
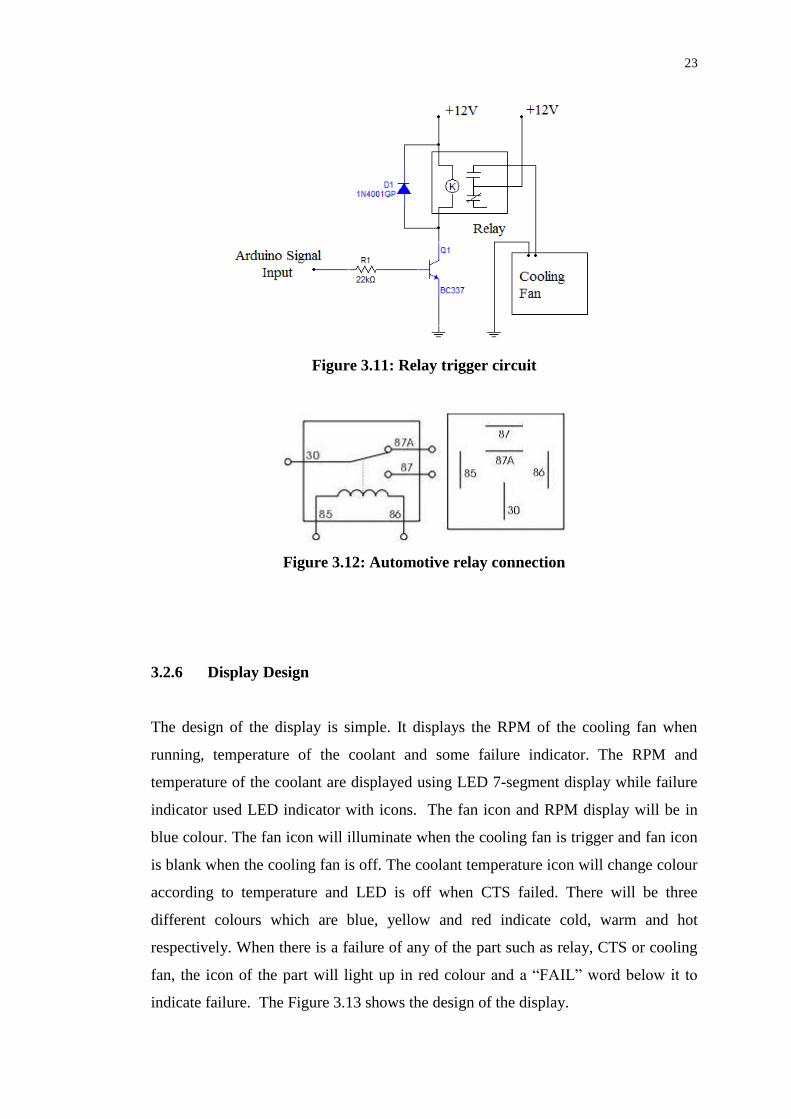
3.2.4 Coolant Temperature Sensor (CTS)
Coolant temperature sensor (CTS) is used to measure the temperature of the coolant.
Negative Temperature Coefficient type of CTS is use which resistance drop when
temperature increasing. The output voltage of the CTS is used to measure the
22
temperature. The resistance of the CTS varies with temperature. Figure 3.9 and 3.10
shows the CTS circuit and CTS respectively.
Figure 3.9: CTS circuit.
Figure 3.10: CTS (autozone, 2015)
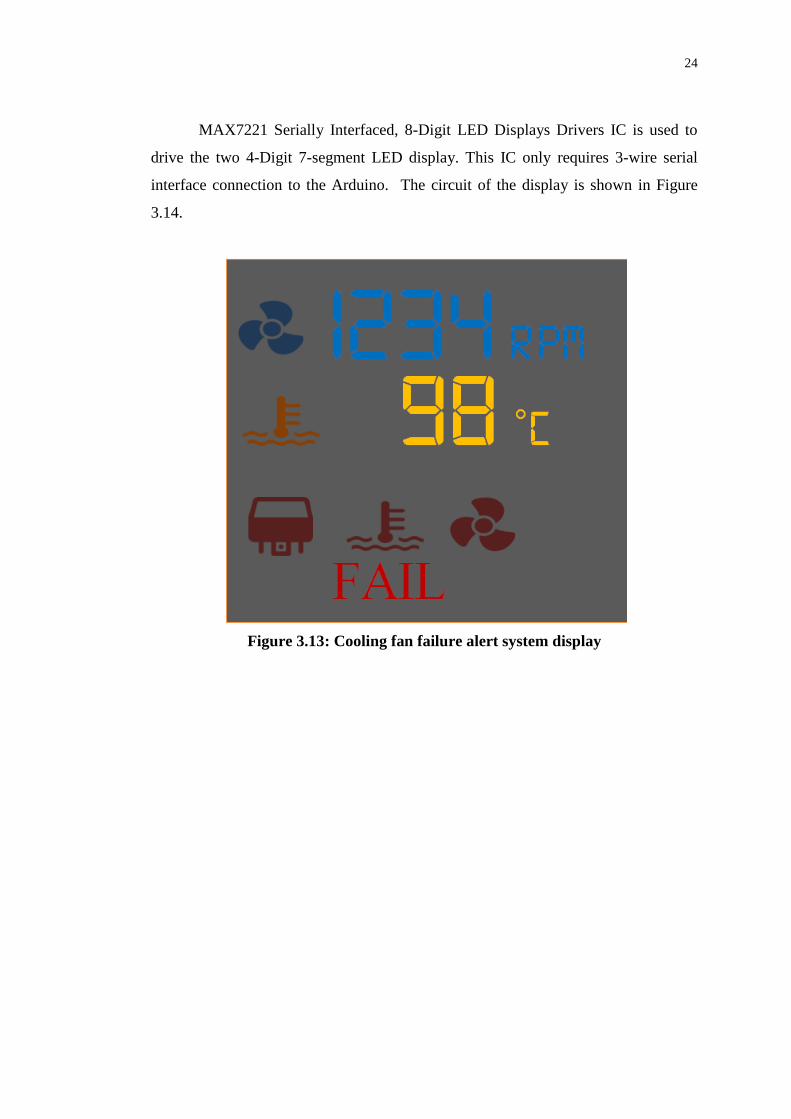
3.2.5 Cooling Fan Relay Trigger Circuit
A simple circuit is designed to trigger the relay of the cooling fan. When a high
signal is provided by the Arduino, the relay will be triggered and the cooling fan is
turn on. Figure 3.11 shows the relay trigger circuit. Number 86 and 85 is connected
to 12 V and ground respectively where this coil of the relay. Number 30 is the
common where 12 V will be connected and the output to the cooling fan will be
connected to number 87. The typical automotive relay connection is shown in
Figure 3.12.
23
Figure 3.11: Relay trigger circuit
Figure 3.12: Automotive relay connection
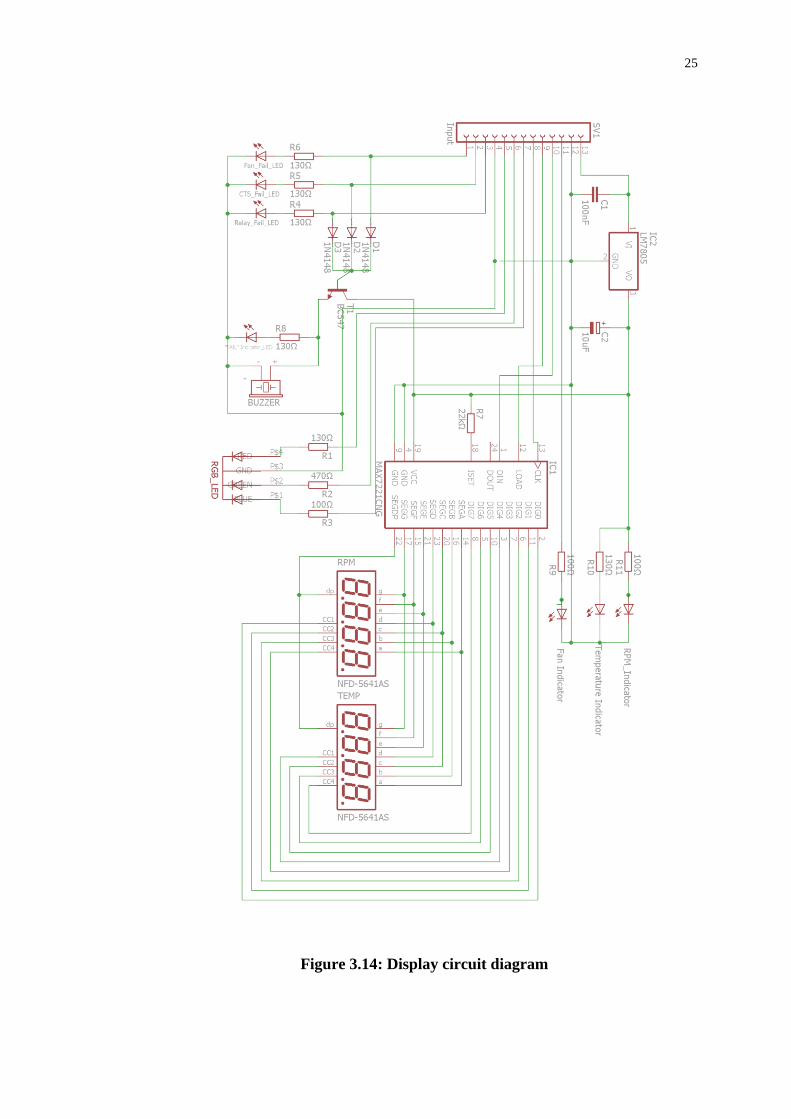
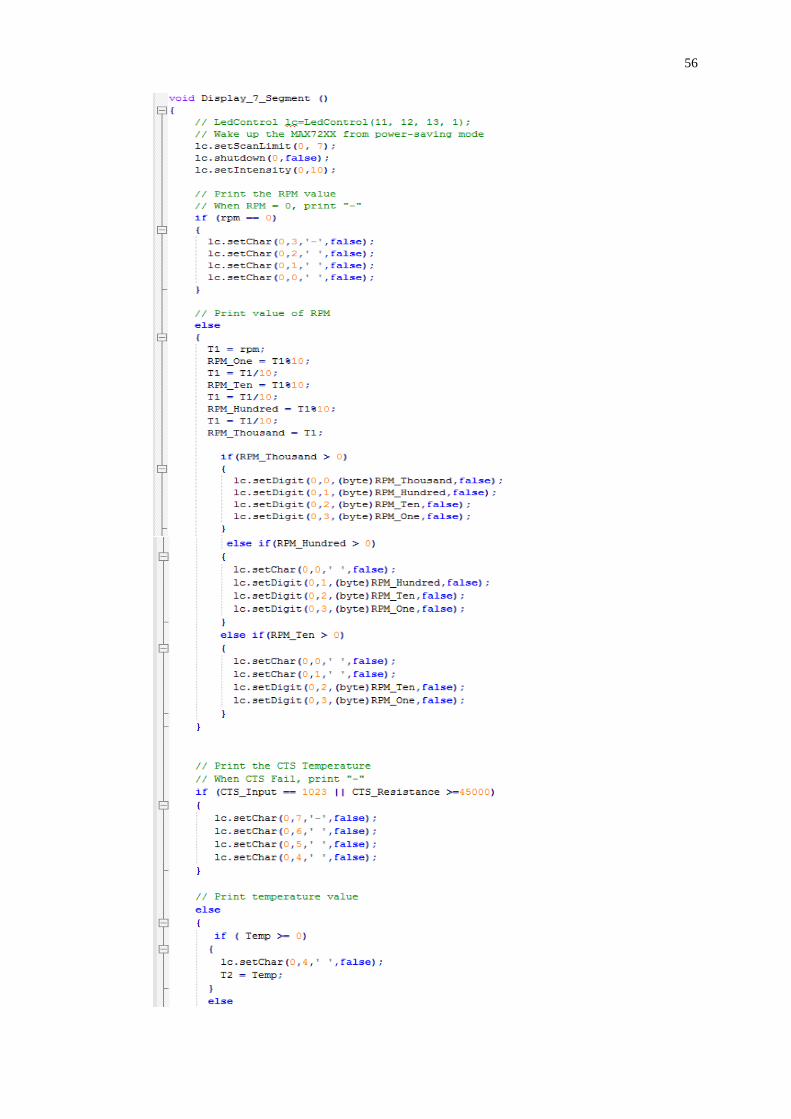
3.2.6 Display Design
The design of the display is simple. It displays the RPM of the cooling fan when
running, temperature of the coolant and some failure indicator. The RPM and
temperature of the coolant are displayed using LED 7-segment display while failure
indicator used LED indicator with icons. The fan icon and RPM display will be in
blue colour. The fan icon will illuminate when the cooling fan is trigger and fan icon
is blank when the cooling fan is off. The coolant temperature icon will change colour
according to temperature and LED is off when CTS failed. There will be three
different colours which are blue, yellow and red indicate cold, warm and hot
respectively. When there is a failure of any of the part such as relay, CTS or cooling
fan, the icon of the part will light up in red colour and a “FAIL” word below it to
indicate failure. The Figure 3.13 shows the design of the display.
24
MAX7221 Serially Interfaced, 8-Digit LED Displays Drivers IC is used to
drive the two 4-Digit 7-segment LED display. This IC only requires 3-wire serial
interface connection to the Arduino. The circuit of the display is shown in Figure
3.14.
Figure 3.13: Cooling fan failure alert system display
25
Figure 3.14: Display circuit diagram
26
CHAPTER 4
4 RESULT AND DISCUSSION
4.1 Prototype
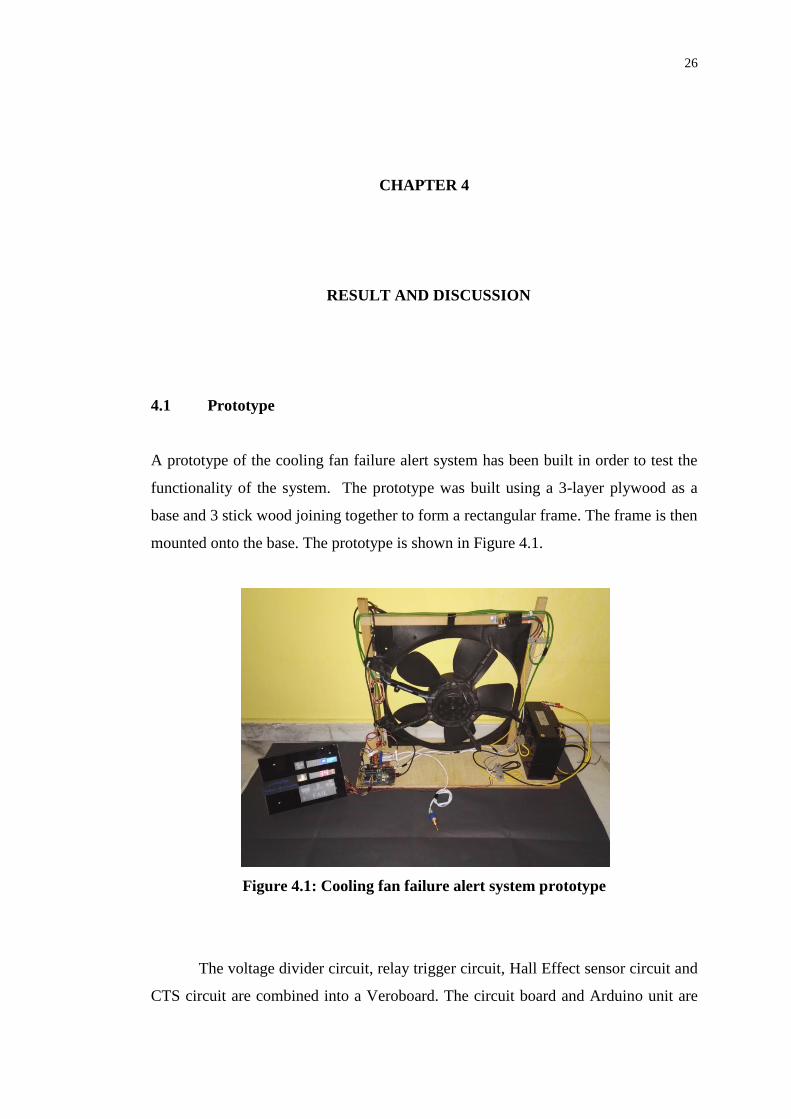
A prototype of the cooling fan failure alert system has been built in order to test the
functionality of the system. The prototype was built using a 3-layer plywood as a
base and 3 stick wood joining together to form a rectangular frame. The frame is then
mounted onto the base. The prototype is shown in Figure 4.1.
Figure 4.1: Cooling fan failure alert system prototype
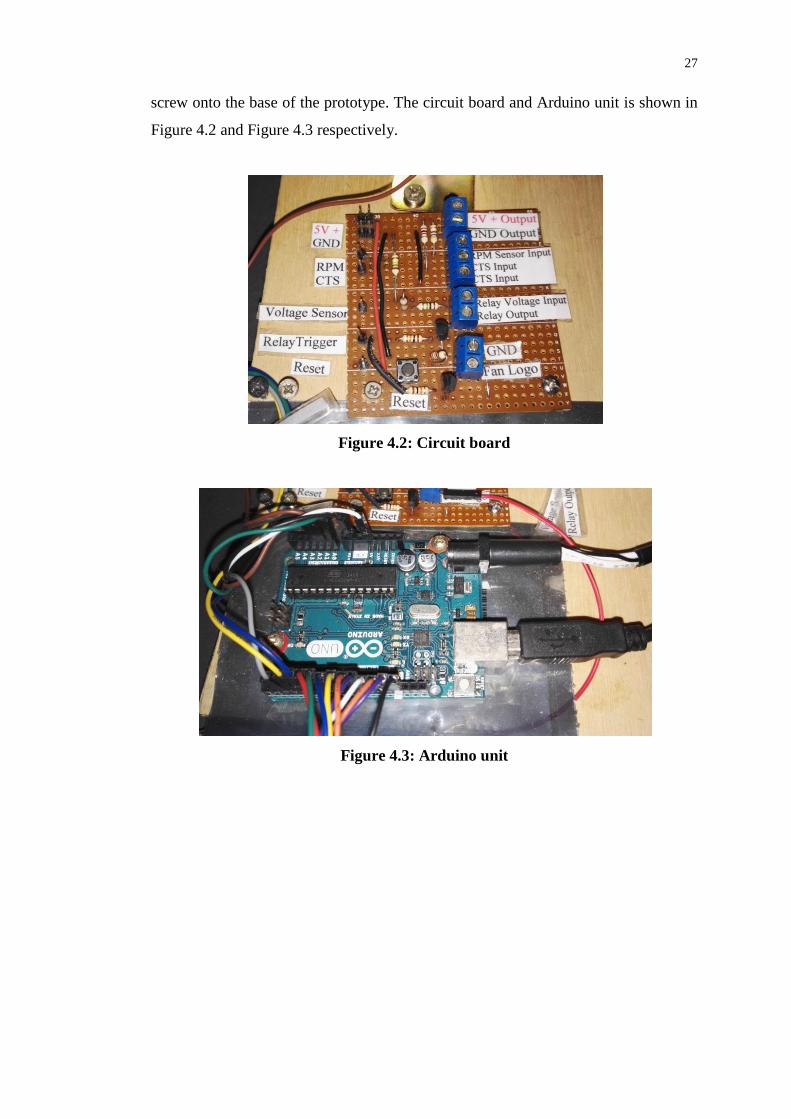
The voltage divider circuit, relay trigger circuit, Hall Effect sensor circuit and
CTS circuit are combined into a Veroboard. The circuit board and Arduino unit are
27
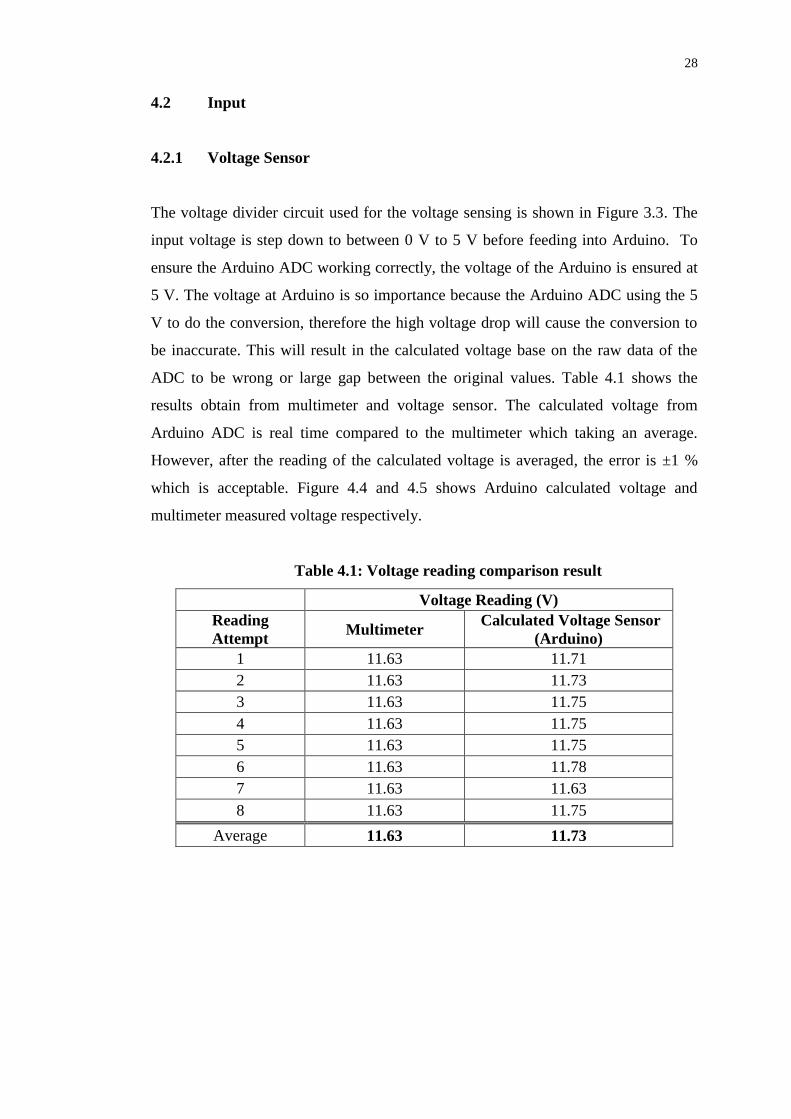
screw onto the base of the prototype. The circuit board and Arduino unit is shown in
Figure 4.2 and Figure 4.3 respectively.
Figure 4.2: Circuit board
Figure 4.3: Arduino unit
28
4.2 Input
4.2.1 Voltage Sensor
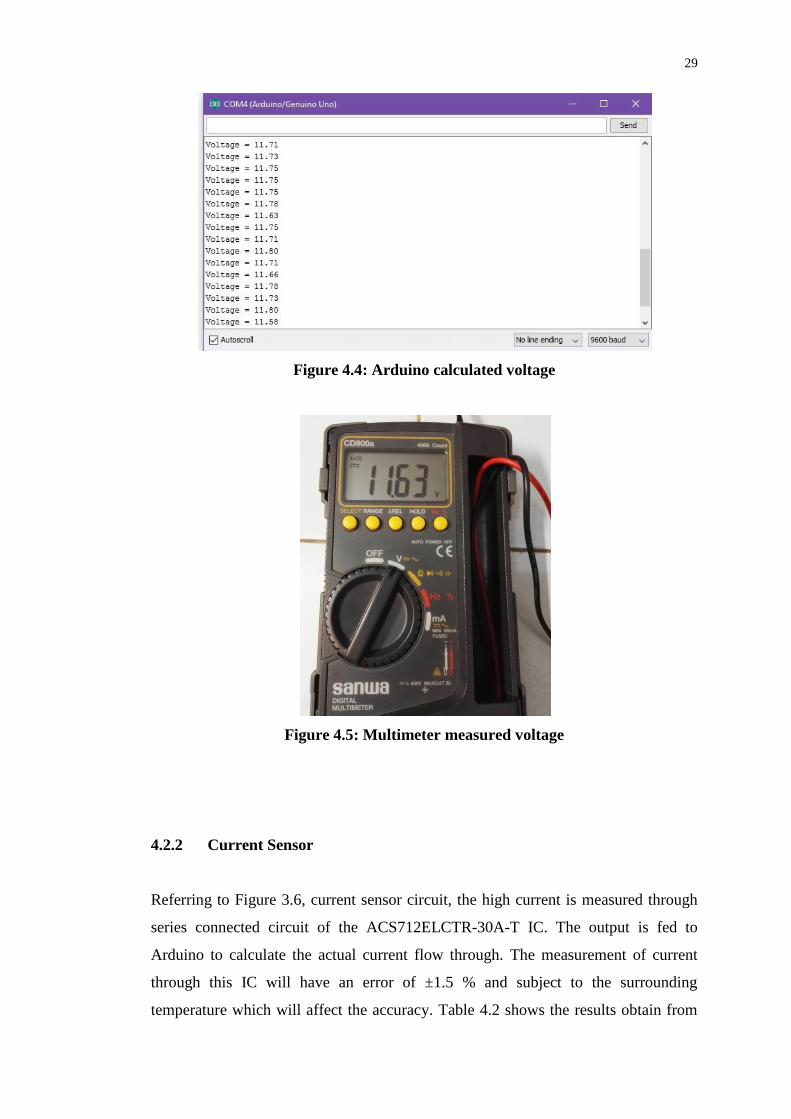
The voltage divider circuit used for the voltage sensing is shown in Figure 3.3. The
input voltage is step down to between 0 V to 5 V before feeding into Arduino. To
ensure the Arduino ADC working correctly, the voltage of the Arduino is ensured at
5 V. The voltage at Arduino is so importance because the Arduino ADC using the 5
V to do the conversion, therefore the high voltage drop will cause the conversion to
be inaccurate. This will result in the calculated voltage base on the raw data of the
ADC to be wrong or large gap between the original values. Table 4.1 shows the
results obtain from multimeter and voltage sensor. The calculated voltage from
Arduino ADC is real time compared to the multimeter which taking an average.
However, after the reading of the calculated voltage is averaged, the error is ±1 %
which is acceptable. Figure 4.4 and 4.5 shows Arduino calculated voltage and
multimeter measured voltage respectively.
Table 4.1: Voltage reading comparison result
Voltage Reading (V)
Reading
Attempt Multimeter
Calculated Voltage Sensor
(Arduino)
1 11.63 11.71
2 11.63 11.73
3 11.63 11.75
4 11.63 11.75
5 11.63 11.75
6 11.63 11.78
7 11.63 11.63
8 11.63 11.75
Average 11.63 11.73
29
Figure 4.4: Arduino calculated voltage
Figure 4.5: Multimeter measured voltage
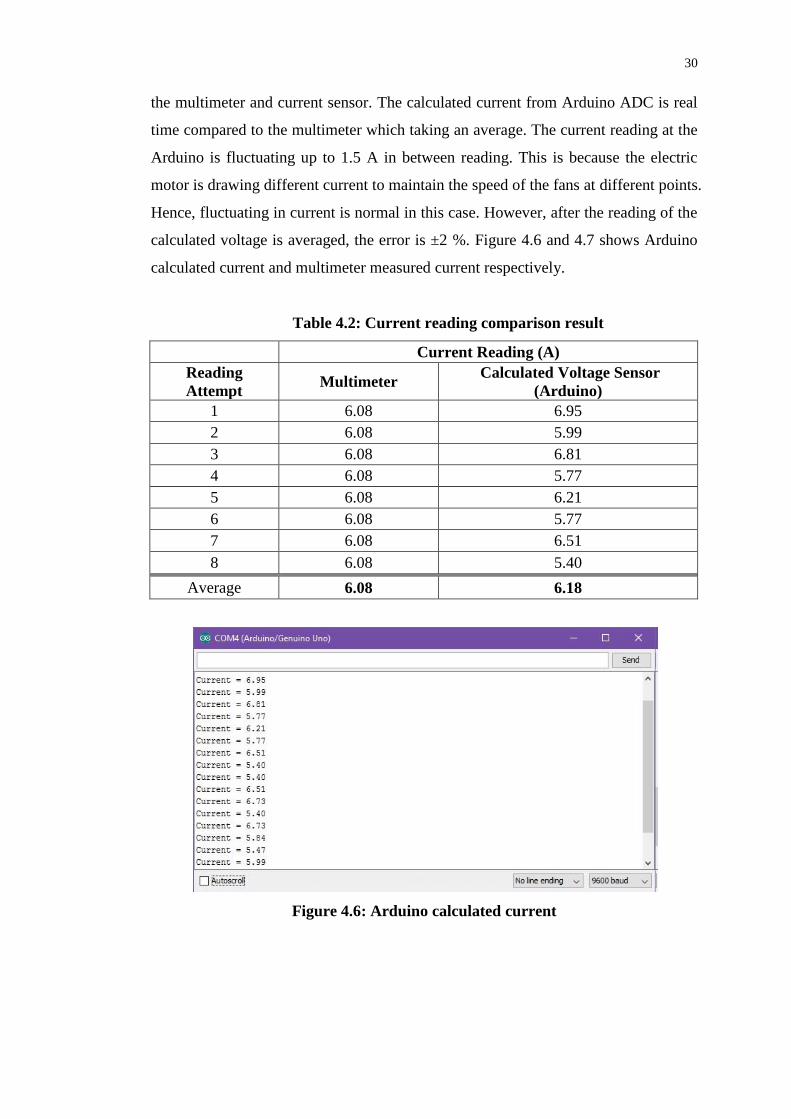
4.2.2 Current Sensor
Referring to Figure 3.6, current sensor circuit, the high current is measured through
series connected circuit of the ACS712ELCTR-30A-T IC. The output is fed to
Arduino to calculate the actual current flow through. The measurement of current
through this IC will have an error of ±1.5 % and subject to the surrounding
temperature which will affect the accuracy. Table 4.2 shows the results obtain from
30
the multimeter and current sensor. The calculated current from Arduino ADC is real
time compared to the multimeter which taking an average. The current reading at the
Arduino is fluctuating up to 1.5 A in between reading. This is because the electric
motor is drawing different current to maintain the speed of the fans at different points.
Hence, fluctuating in current is normal in this case. However, after the reading of the
calculated voltage is averaged, the error is ±2 %. Figure 4.6 and 4.7 shows Arduino
calculated current and multimeter measured current respectively.
Table 4.2: Current reading comparison result
Current Reading (A)
Reading
Attempt Multimeter
Calculated Voltage Sensor
(Arduino)
1 6.08 6.95
2 6.08 5.99
3 6.08 6.81
4 6.08 5.77
5 6.08 6.21
6 6.08 5.77
7 6.08 6.51
8 6.08 5.40
Average 6.08 6.18
Figure 4.6: Arduino calculated current
31
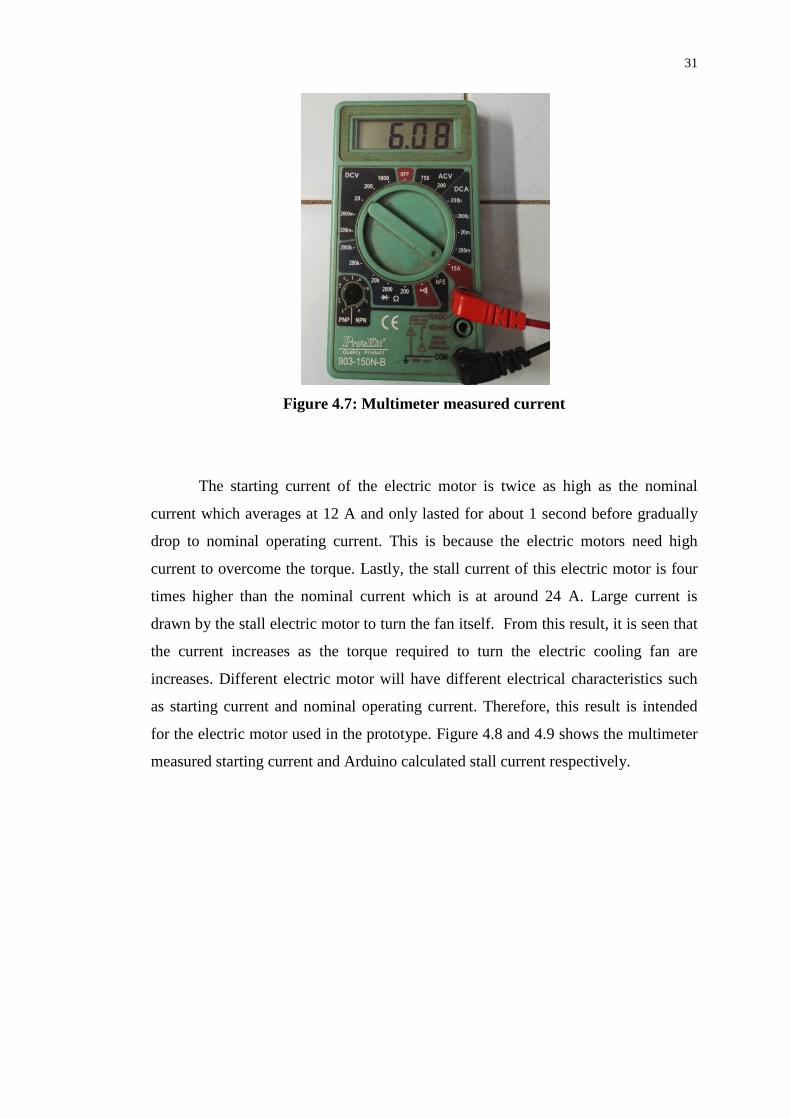
Figure 4.7: Multimeter measured current
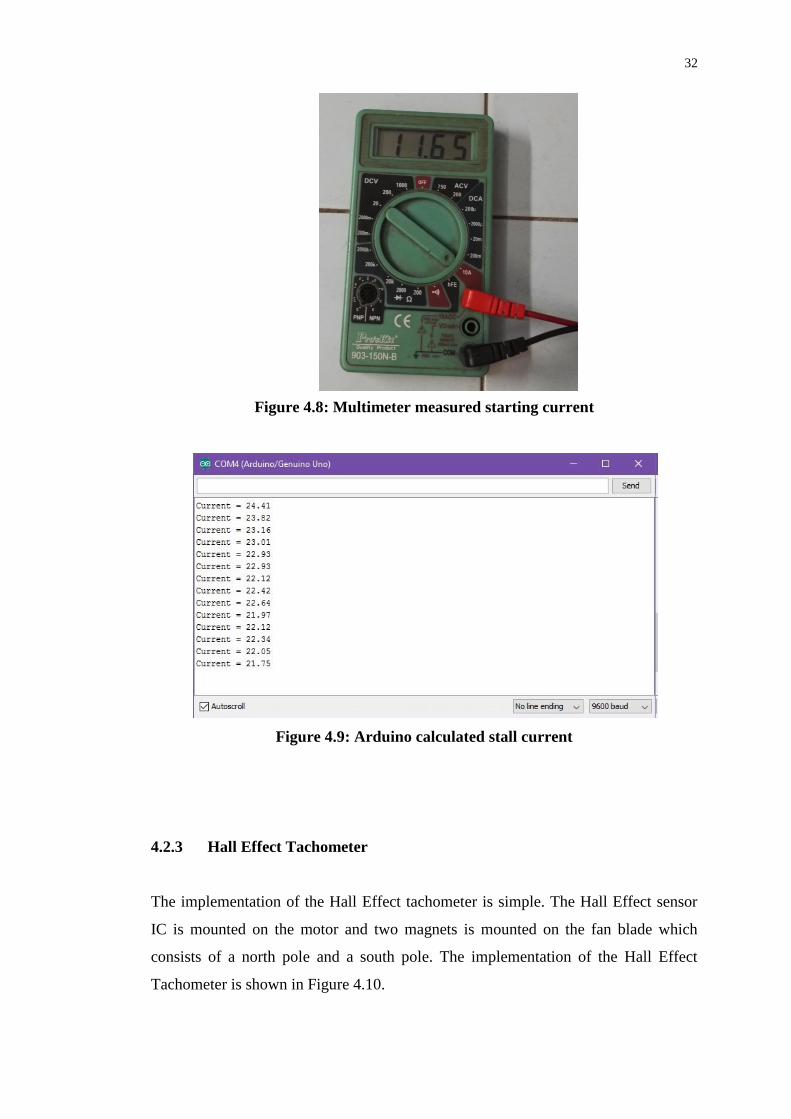
The starting current of the electric motor is twice as high as the nominal
current which averages at 12 A and only lasted for about 1 second before gradually
drop to nominal operating current. This is because the electric motors need high
current to overcome the torque. Lastly, the stall current of this electric motor is four
times higher than the nominal current which is at around 24 A. Large current is
drawn by the stall electric motor to turn the fan itself. From this result, it is seen that
the current increases as the torque required to turn the electric cooling fan are
increases. Different electric motor will have different electrical characteristics such
as starting current and nominal operating current. Therefore, this result is intended
for the electric motor used in the prototype. Figure 4.8 and 4.9 shows the multimeter
measured starting current and Arduino calculated stall current respectively.
32
Figure 4.8: Multimeter measured starting current
Figure 4.9: Arduino calculated stall current
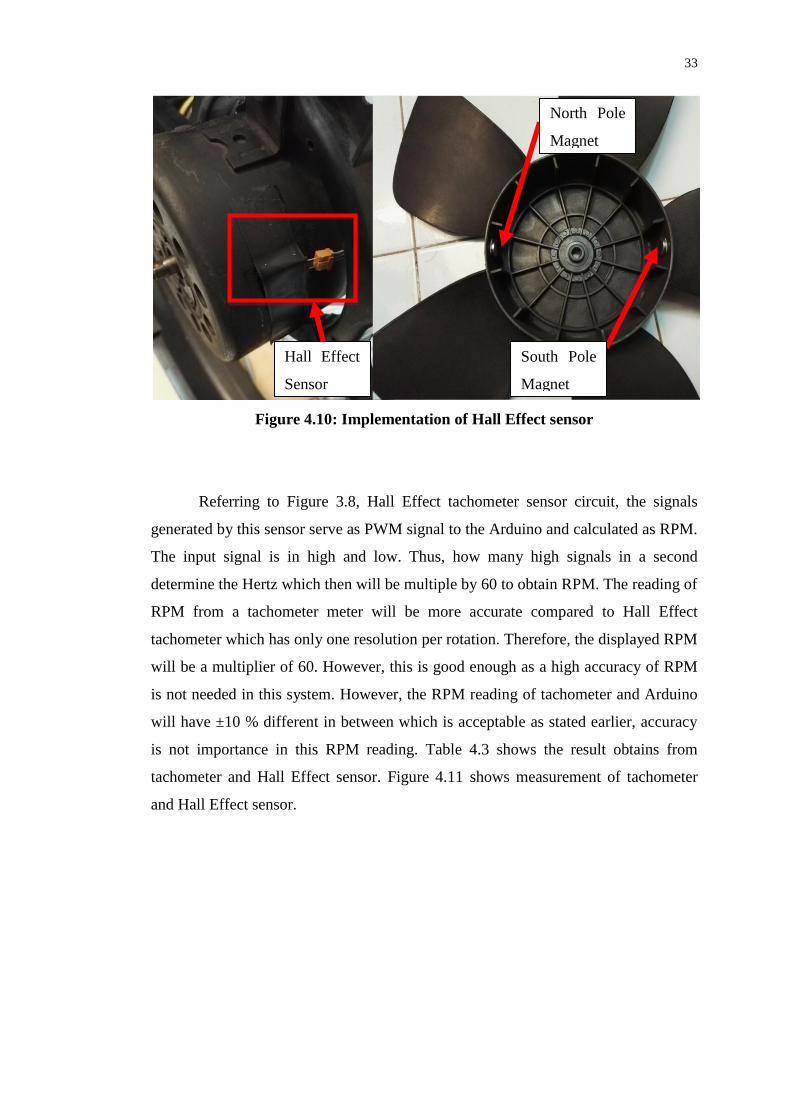
4.2.3 Hall Effect Tachometer
The implementation of the Hall Effect tachometer is simple. The Hall Effect sensor
IC is mounted on the motor and two magnets is mounted on the fan blade which
consists of a north pole and a south pole. The implementation of the Hall Effect
Tachometer is shown in Figure 4.10.
33
Figure 4.10: Implementation of Hall Effect sensor
Referring to Figure 3.8, Hall Effect tachometer sensor circuit, the signals
generated by this sensor serve as PWM signal to the Arduino and calculated as RPM.
The input signal is in high and low. Thus, how many high signals in a second
determine the Hertz which then will be multiple by 60 to obtain RPM. The reading of
RPM from a tachometer meter will be more accurate compared to Hall Effect
tachometer which has only one resolution per rotation. Therefore, the displayed RPM
will be a multiplier of 60. However, this is good enough as a high accuracy of RPM
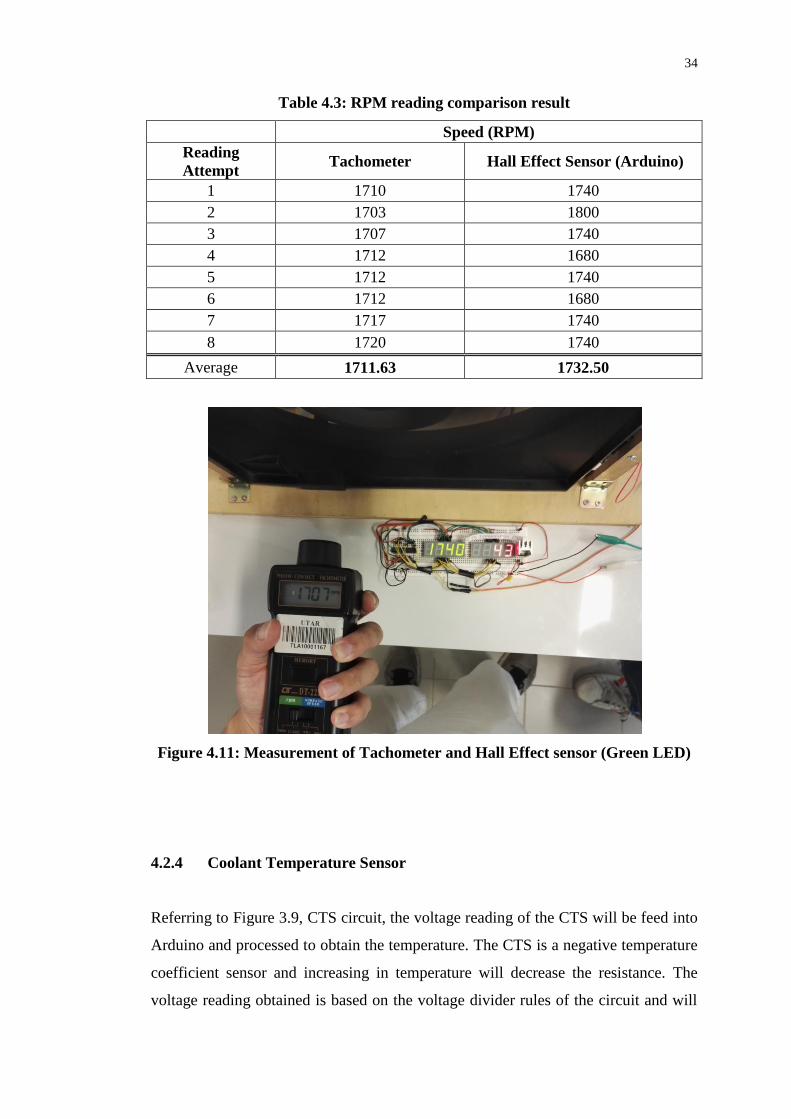
is not needed in this system. However, the RPM reading of tachometer and Arduino
will have ±10 % different in between which is acceptable as stated earlier, accuracy
is not importance in this RPM reading. Table 4.3 shows the result obtains from
tachometer and Hall Effect sensor. Figure 4.11 shows measurement of tachometer
and Hall Effect sensor.
Hall Effect
Sensor
North Pole
Magnet
South Pole
Magnet
34
Table 4.3: RPM reading comparison result
Speed (RPM)
Reading
Attempt Tachometer Hall Effect Sensor (Arduino)
1 1710 1740
2 1703 1800
3 1707 1740
4 1712 1680
5 1712 1740
6 1712 1680
7 1717 1740
8 1720 1740
Average 1711.63 1732.50
Figure 4.11: Measurement of Tachometer and Hall Effect sensor (Green LED)
4.2.4 Coolant Temperature Sensor
Referring to Figure 3.9, CTS circuit, the voltage reading of the CTS will be feed into
Arduino and processed to obtain the temperature. The CTS is a negative temperature
coefficient sensor and increasing in temperature will decrease the resistance. The
voltage reading obtained is based on the voltage divider rules of the circuit and will
35
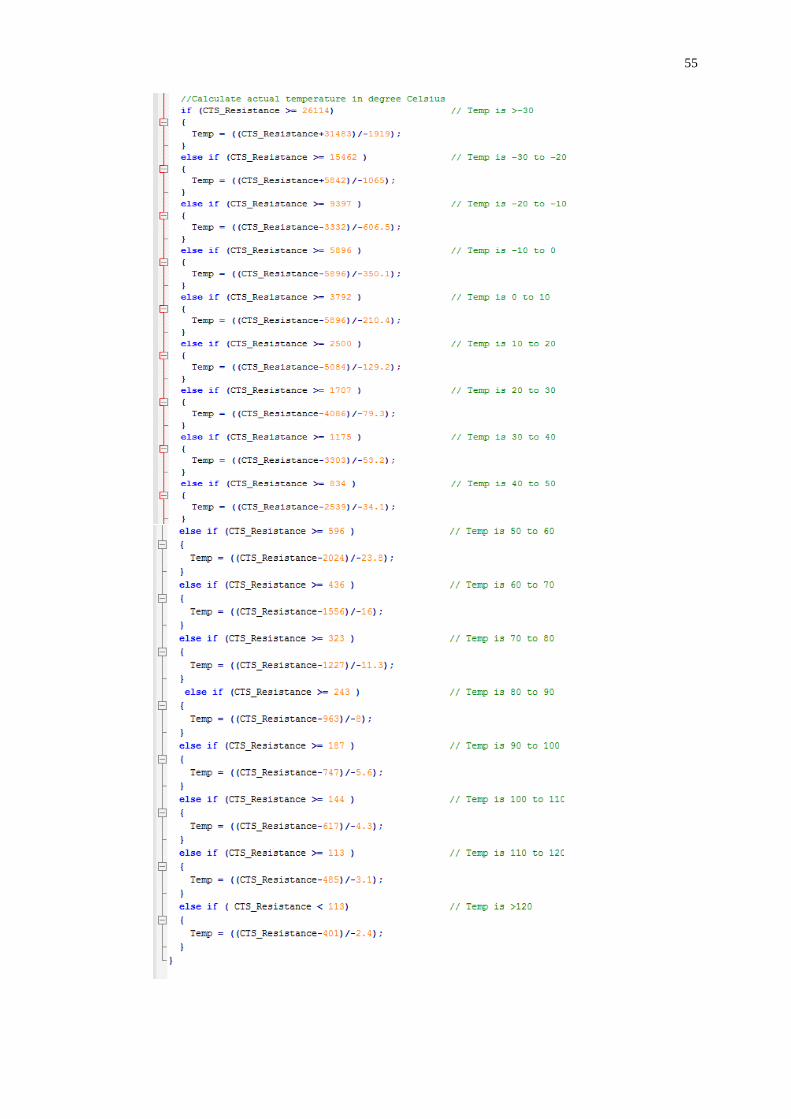
be feed into Arduino ADC and converted into resistance using formula. Every 10 °C
of temperature step will have different characteristics equation. Thus to obtain
accuracy of CTS, every 10 °C step will have a different formula for obtaining the
temperature. The resistance obtained earlier will be compared in a range of resistance
in each 10 °C. The temperature will only be calculated when it hit the right range of
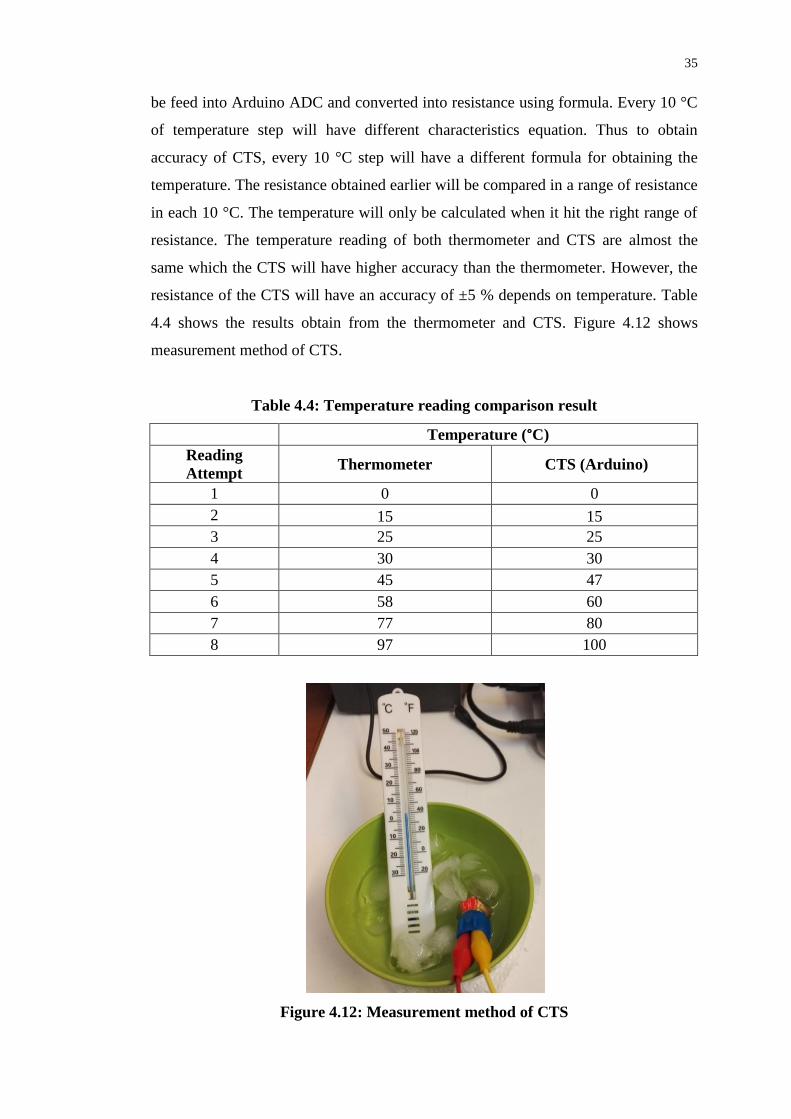
resistance. The temperature reading of both thermometer and CTS are almost the
same which the CTS will have higher accuracy than the thermometer. However, the
resistance of the CTS will have an accuracy of ±5 % depends on temperature. Table
4.4 shows the results obtain from the thermometer and CTS. Figure 4.12 shows
measurement method of CTS.
Table 4.4: Temperature reading comparison result
Temperature (°C)
Reading
Attempt Thermometer CTS (Arduino)
1 0 0
2 15 15
3 25 25
4 30 30
5 45 47
6 58 60
7 77 80
8 97 100
Figure 4.12: Measurement method of CTS
36
4.3 Output
4.3.1 Cooling Fan Relay Trigger Circuit
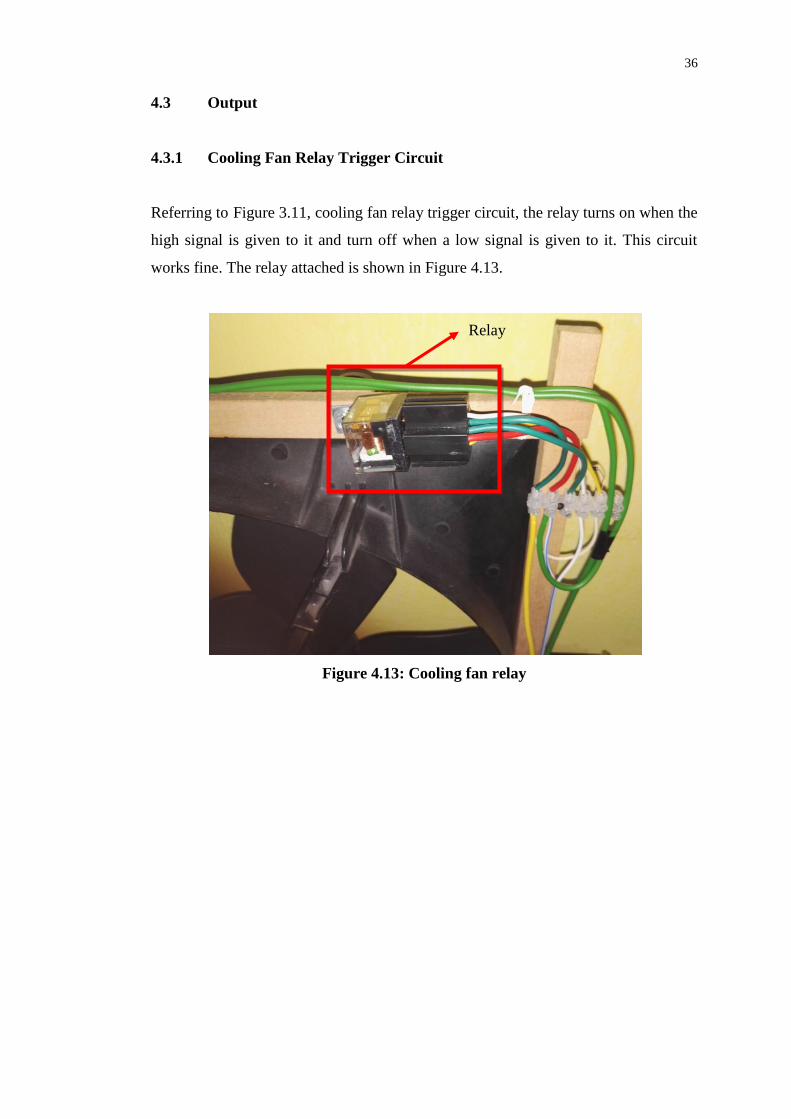
Referring to Figure 3.11, cooling fan relay trigger circuit, the relay turns on when the
high signal is given to it and turn off when a low signal is given to it. This circuit
works fine. The relay attached is shown in Figure 4.13.
Figure 4.13: Cooling fan relay
Relay
37
4.3.2 Display
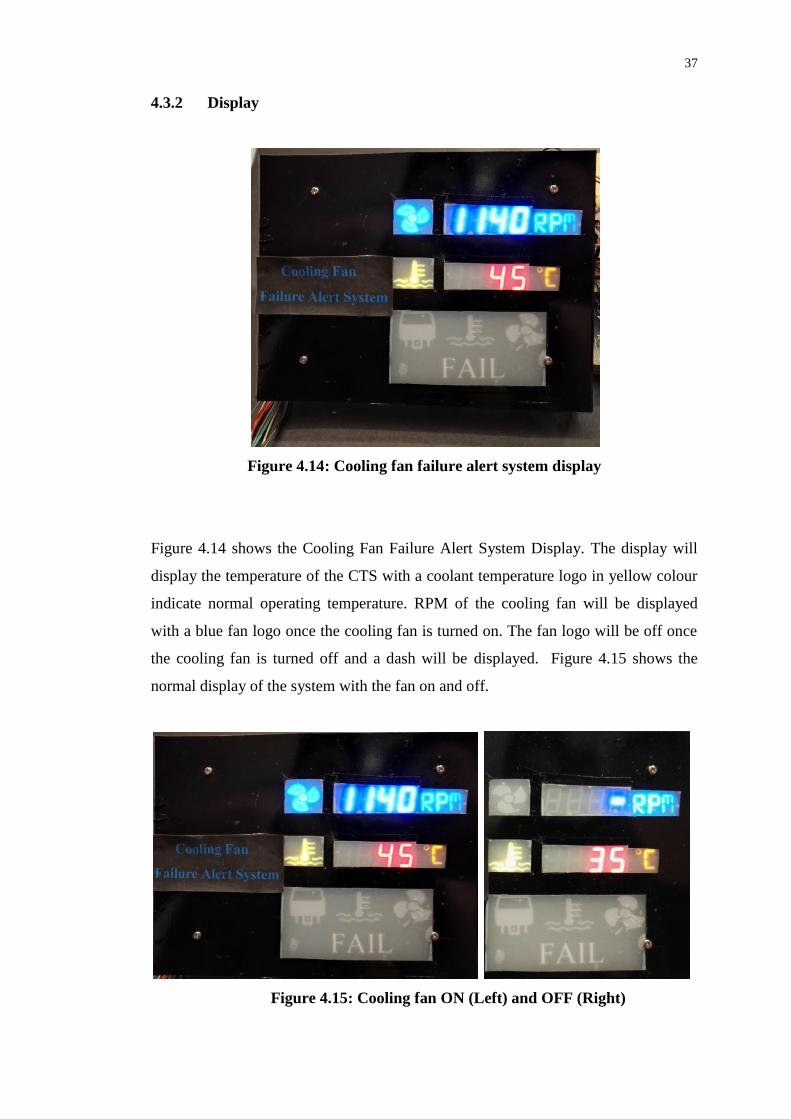
Figure 4.14: Cooling fan failure alert system display
Figure 4.14 shows the Cooling Fan Failure Alert System Display. The display will
display the temperature of the CTS with a coolant temperature logo in yellow colour
indicate normal operating temperature. RPM of the cooling fan will be displayed
with a blue fan logo once the cooling fan is turned on. The fan logo will be off once
the cooling fan is turned off and a dash will be displayed. Figure 4.15 shows the
normal display of the system with the fan on and off.
Figure 4.15: Cooling fan ON (Left) and OFF (Right)
38
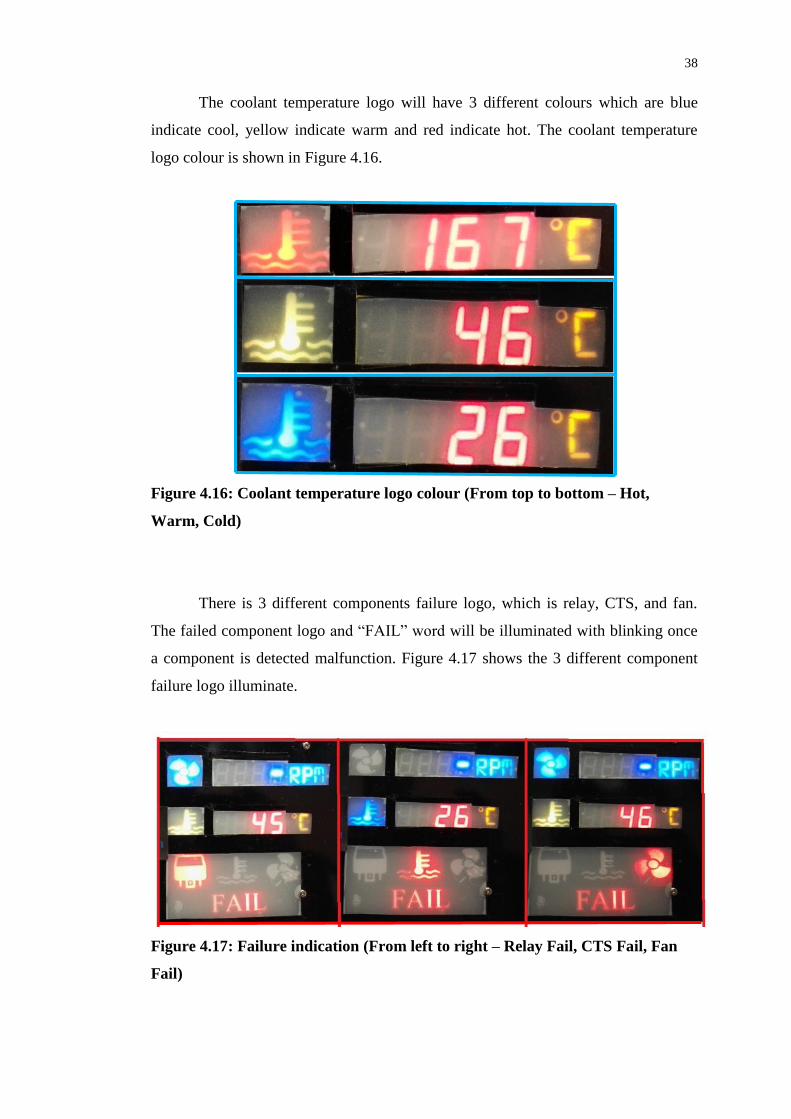
The coolant temperature logo will have 3 different colours which are blue
indicate cool, yellow indicate warm and red indicate hot. The coolant temperature
logo colour is shown in Figure 4.16.
Figure 4.16: Coolant temperature logo colour (From top to bottom – Hot,
Warm, Cold)
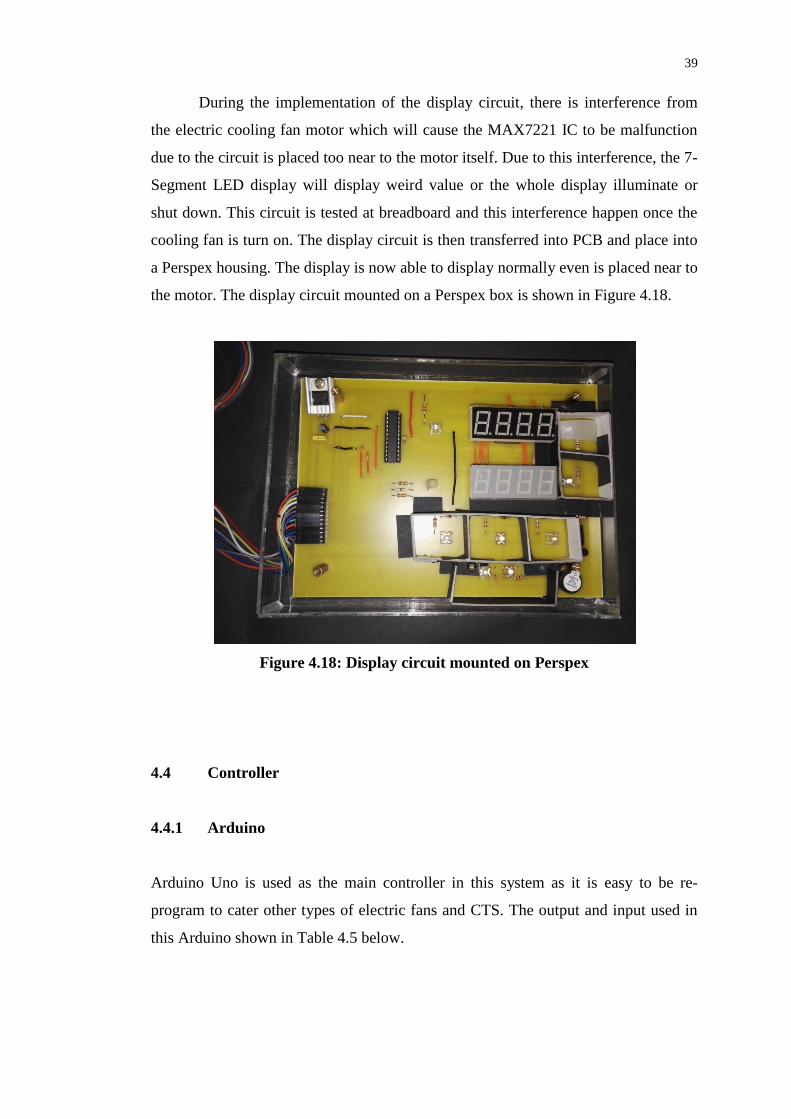
There is 3 different components failure logo, which is relay, CTS, and fan.
The failed component logo and “FAIL” word will be illuminated with blinking once
a component is detected malfunction. Figure 4.17 shows the 3 different component
failure logo illuminate.
Figure 4.17: Failure indication (From left to right – Relay Fail, CTS Fail, Fan
Fail)
39
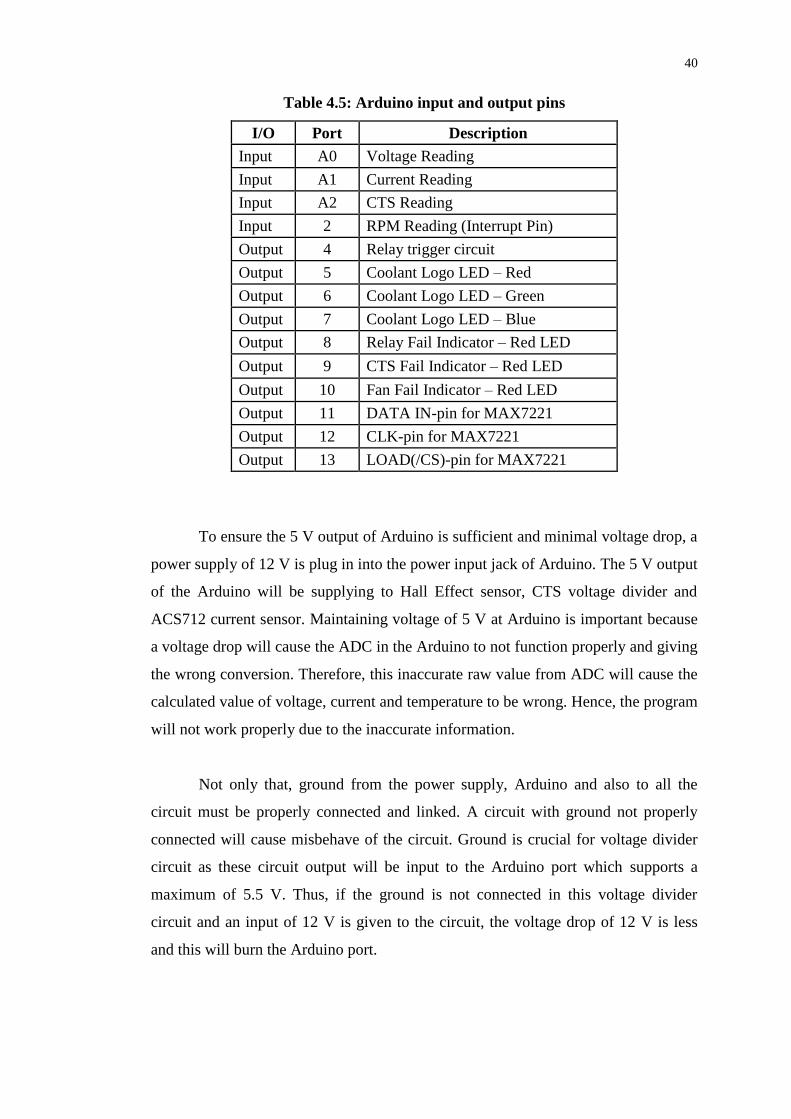
During the implementation of the display circuit, there is interference from
the electric cooling fan motor which will cause the MAX7221 IC to be malfunction
due to the circuit is placed too near to the motor itself. Due to this interference, the 7-
Segment LED display will display weird value or the whole display illuminate or
shut down. This circuit is tested at breadboard and this interference happen once the
cooling fan is turn on. The display circuit is then transferred into PCB and place into
a Perspex housing. The display is now able to display normally even is placed near to
the motor. The display circuit mounted on a Perspex box is shown in Figure 4.18.
Figure 4.18: Display circuit mounted on Perspex
4.4 Controller
4.4.1 Arduino
Arduino Uno is used as the main controller in this system as it is easy to be re-
program to cater other types of electric fans and CTS. The output and input used in
this Arduino shown in Table 4.5 below.
40
Table 4.5: Arduino input and output pins
I/O Port Description
Input A0 Voltage Reading
Input A1 Current Reading
Input A2 CTS Reading
Input 2 RPM Reading (Interrupt Pin)
Output 4 Relay trigger circuit
Output 5 Coolant Logo LED – Red
Output 6 Coolant Logo LED – Green
Output 7 Coolant Logo LED – Blue
Output 8 Relay Fail Indicator – Red LED
Output 9 CTS Fail Indicator – Red LED
Output 10 Fan Fail Indicator – Red LED
Output 11 DATA IN-pin for MAX7221
Output 12 CLK-pin for MAX7221
Output 13 LOAD(/CS)-pin for MAX7221
To ensure the 5 V output of Arduino is sufficient and minimal voltage drop, a
power supply of 12 V is plug in into the power input jack of Arduino. The 5 V output
of the Arduino will be supplying to Hall Effect sensor, CTS voltage divider and
ACS712 current sensor. Maintaining voltage of 5 V at Arduino is important because
a voltage drop will cause the ADC in the Arduino to not function properly and giving
the wrong conversion. Therefore, this inaccurate raw value from ADC will cause the
calculated value of voltage, current and temperature to be wrong. Hence, the program
will not work properly due to the inaccurate information.
Not only that, ground from the power supply, Arduino and also to all the
circuit must be properly connected and linked. A circuit with ground not properly
connected will cause misbehave of the circuit. Ground is crucial for voltage divider
circuit as these circuit output will be input to the Arduino port which supports a
maximum of 5.5 V. Thus, if the ground is not connected in this voltage divider
circuit and an input of 12 V is given to the circuit, the voltage drop of 12 V is less
and this will burn the Arduino port.
41
4.4.2 Program Flow Chart
Initialization
Read Temperature
from CTS
CTS Fail? CTS Fail
LED ON
7-Segment LED
Display Output
Is Temperature >
100°C? or CTS Fail?
Turn ON Fan &
Counter++
Turn OFF Fan &
Reset Counter
Read Voltage
and Current
Is Voltage Present?Relay Fail
LED ON
Fan Fail LED
ON
Is Current > 12A or
RPM < 1000 ?
YES
NO
YES
YES
YES
NO
NO
NO
Counter < 6? YESNO
Is Temperature < 90°C NOYES
Interrupt
(Every 1 Seconds)
Update RPM
Blink Function for
FAIL LEDs
Return to
routine
Coolant Logo LED
Display Output
Interrupt
when pin 2 is LOW
RPM ++
Return to
routine
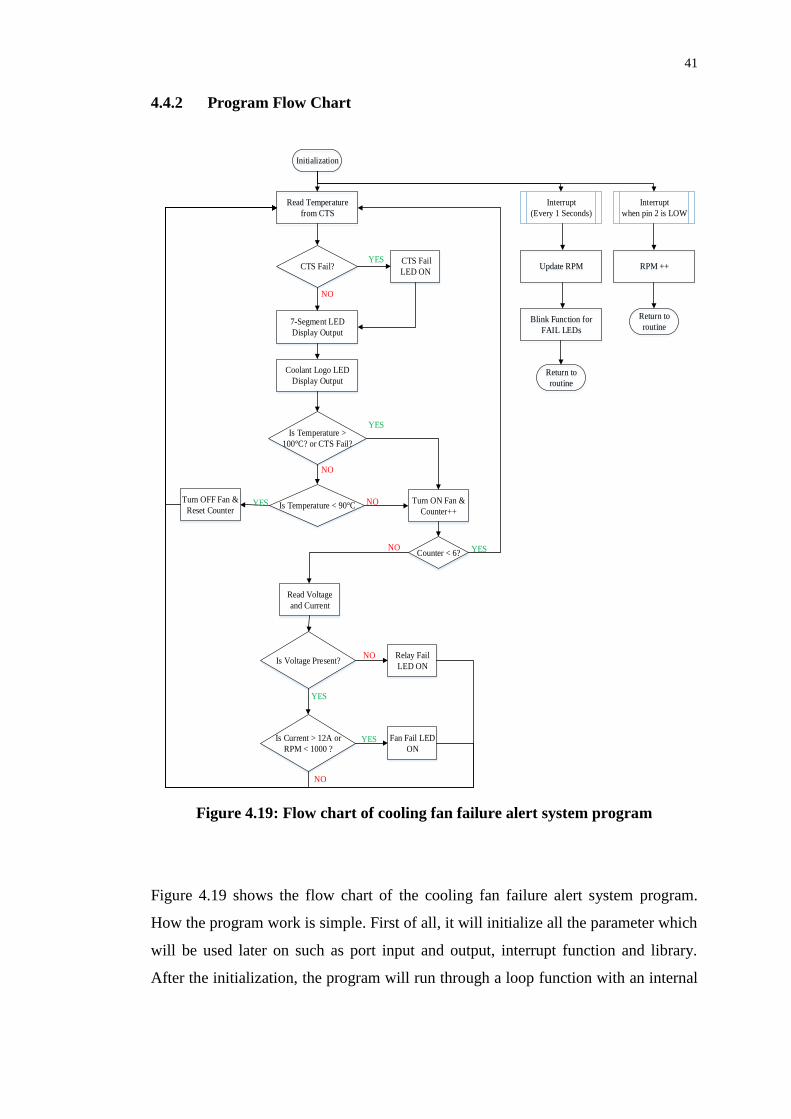
Figure 4.19: Flow chart of cooling fan failure alert system program
Figure 4.19 shows the flow chart of the cooling fan failure alert system program.
How the program work is simple. First of all, it will initialize all the parameter which
will be used later on such as port input and output, interrupt function and library.
After the initialization, the program will run through a loop function with an internal
42
interrupt function which will interrupt every second and external interrupt function
which will interrupt every time there is a low signal detected from the digital pin.
When the internal interrupt happens, it will update the RPM and also the
blink state of the fail LED whether on or off, if applicable. After all this is done, it
will resume to where the program has stopped. In external interrupt, it will increase
the RPM temporary data value by one every time this interrupt happen. Same as
external interrupt function, it will resume to where the program has stopped.
In the loop function, it starts with reading of CTS voltage and then calculates
to convert to temperature. The temperature will be monitor and any abnormal will
trigger the fail LED on. After that, it will call the 7-Segement LED display function
where here the data of RPM and temperature will be sent to the MAX7221 IC to
display these data. Next, the coolant logo LED display output function will be called
where here the colour of coolant logo will be updated accordingly.
Then, it will check the temperature if it has reach 100 °C or is CTS failed. If
any of it is true, the cooling fan will be turn on. There will be a counter to check it
has reached more than 2 seconds. The program will loop back to the beginning if it is
less than 2 seconds and proceed to the reading of voltage and current. The voltage
and current will be converted to real current and voltage through calculation from
raw value. After that, the voltage will be check and if it is less than 10 V, then the
relay fail LED will be triggered. The program will loop back to the beginning and
will not check current and RPM. However, if the voltage is more than 10 V, it will
then check current and RPM. When the current is more than 12 A or RPM is less
than 900, then the fan fail LED will be triggered. Same as above the program will
loop back to the beginning.
When the temperature has drop below 100 °C, then the next condition will be
check which is less than 90 °C. If false, then it will continue to turn on the cooling
fan and check voltage and current. If true, the cooling fan will be turn off and loop
back to beginning of the program. This is how the whole program works.
43
4.5 Function Testing
To test the functionality of the system, the CTS is replaced with a variable resistor
for testing purposed as the CTS is tested separately and the temperature found to be
accurate. The cooling fan turn on temperature is also adjusted to 40 °C and turn off
temperature to 35 °C for testing purposes. Other than that, the CTS minimum
temperature after 2 minutes is set to less than 30 °C for testing purpose. First of all,
the variable is varies until the temperature shows 25 °C. The reset button on the
Arduino is pressed to restart the program and the stopwatch started. After 2 minutes
the coolant temperature logo is illuminated and blinking indicates the system work.
For every new test, the Arduino will be restart and wait for 2 minutes. Next, the
variable resistor is detached and the coolant temperature logo is illuminated and
blinking.
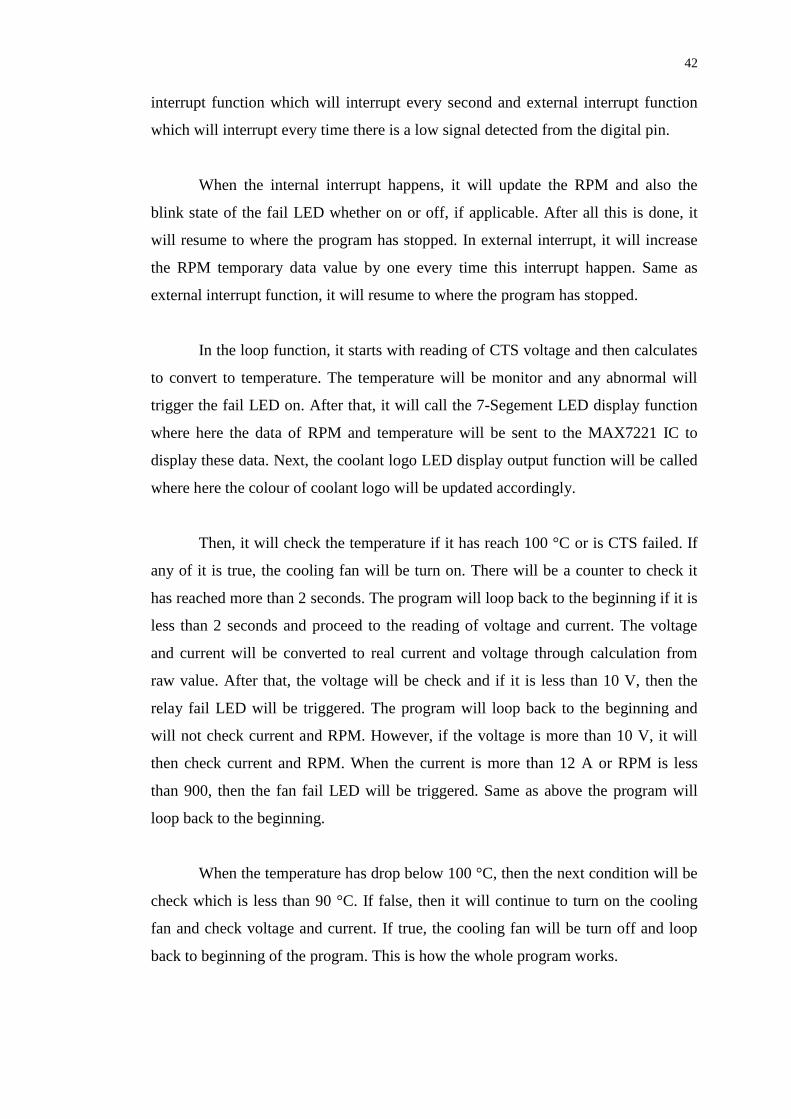
After that, to test the relay fail, the relay is detached and the temperature is set
to 45 °C which the system will trigger the relay. The detached relay is same as a
damaged relay which the contactor will not work even after the voltage is applied to
the coil. After a while, the relay logo is illuminated and blinking. The relay detached
is shown in Figure 4.20.
Figure 4.20: Relay detached
Detached Relay
44
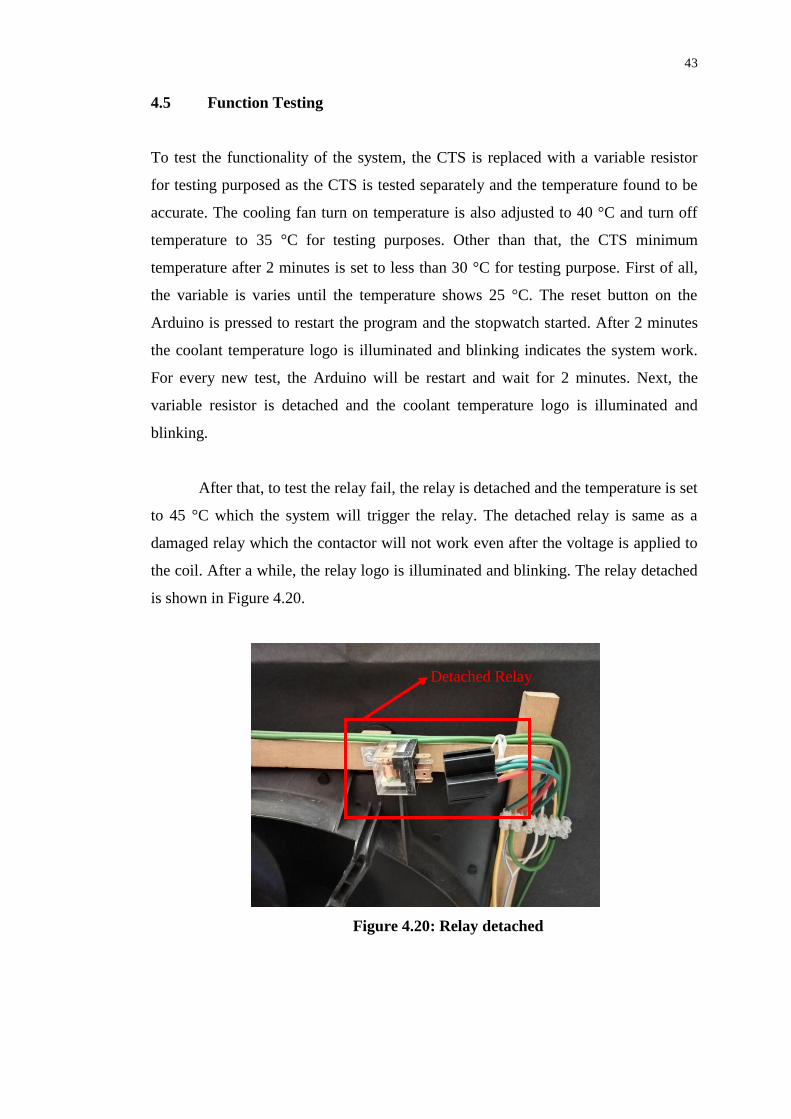
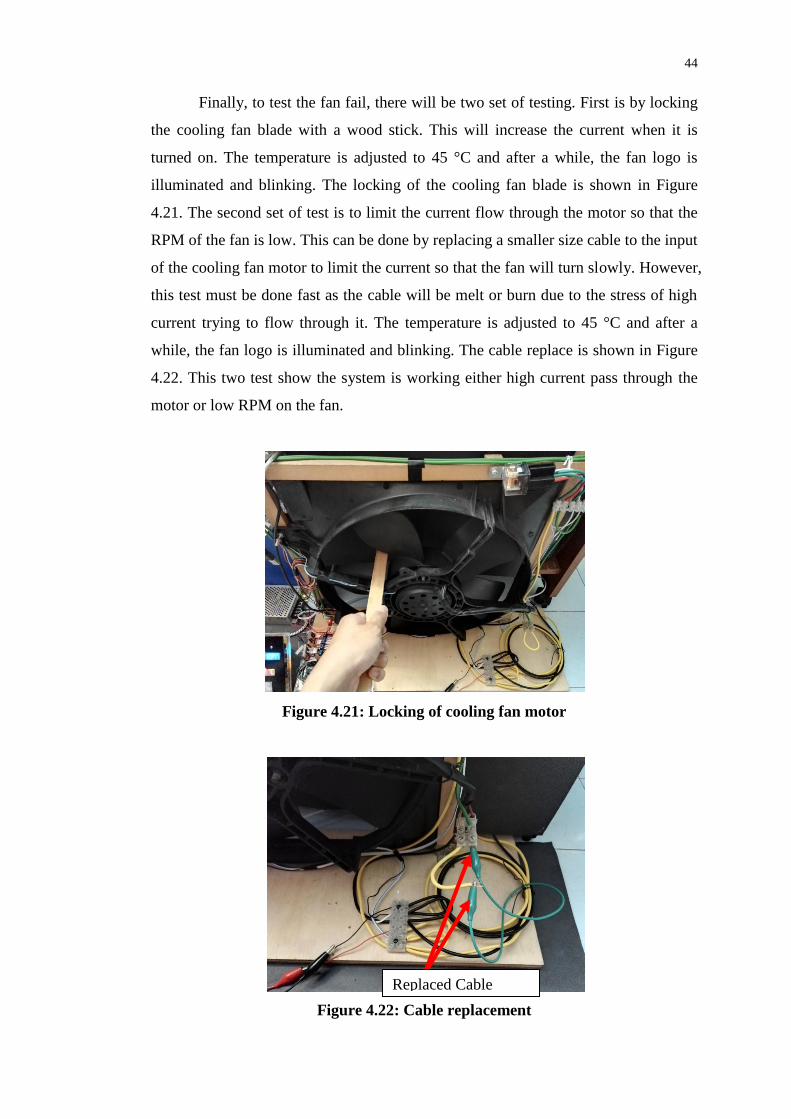
Finally, to test the fan fail, there will be two set of testing. First is by locking
the cooling fan blade with a wood stick. This will increase the current when it is
turned on. The temperature is adjusted to 45 °C and after a while, the fan logo is
illuminated and blinking. The locking of the cooling fan blade is shown in Figure
4.21. The second set of test is to limit the current flow through the motor so that the
RPM of the fan is low. This can be done by replacing a smaller size cable to the input
of the cooling fan motor to limit the current so that the fan will turn slowly. However,
this test must be done fast as the cable will be melt or burn due to the stress of high
current trying to flow through it. The temperature is adjusted to 45 °C and after a
while, the fan logo is illuminated and blinking. The cable replace is shown in Figure
4.22. This two test show the system is working either high current pass through the
motor or low RPM on the fan.
Figure 4.21: Locking of cooling fan motor
Figure 4.22: Cable replacement
Replaced Cable
45
CHAPTER 5
5 ACHIEVEMENT
5.1 Competition Participation
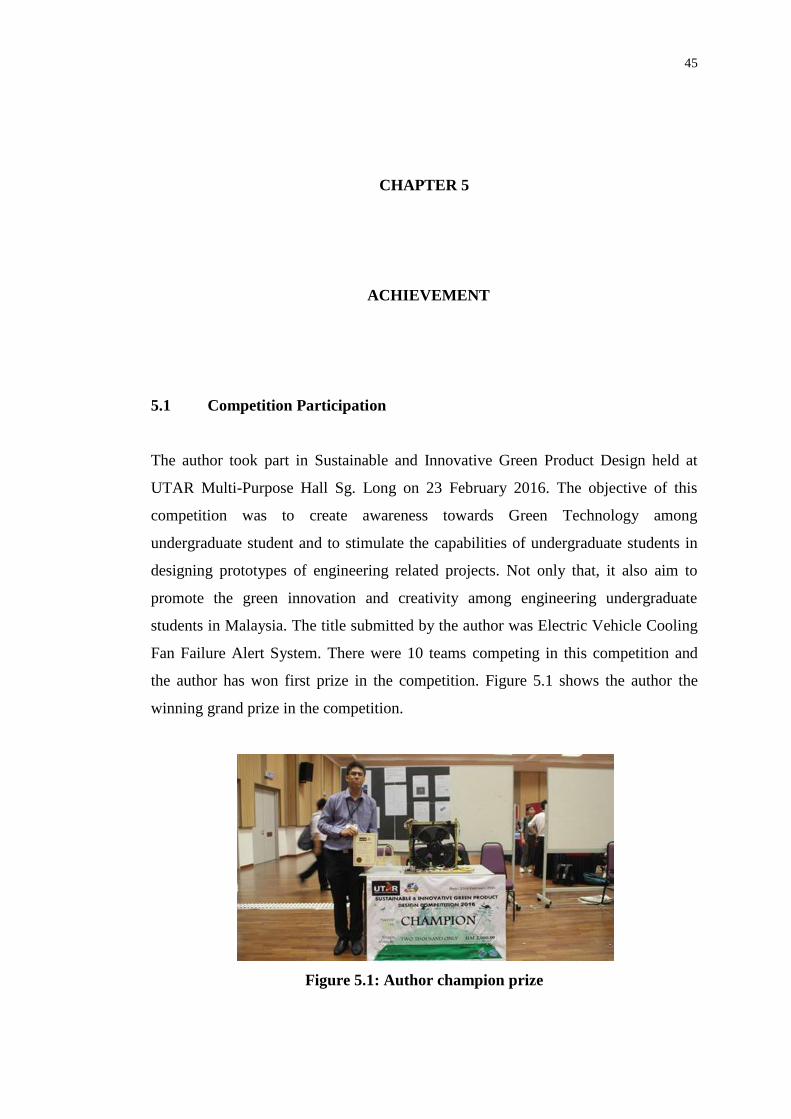
The author took part in Sustainable and Innovative Green Product Design held at
UTAR Multi-Purpose Hall Sg. Long on 23 February 2016. The objective of this
competition was to create awareness towards Green Technology among
undergraduate student and to stimulate the capabilities of undergraduate students in
designing prototypes of engineering related projects. Not only that, it also aim to
promote the green innovation and creativity among engineering undergraduate
students in Malaysia. The title submitted by the author was Electric Vehicle Cooling
Fan Failure Alert System. There were 10 teams competing in this competition and
the author has won first prize in the competition. Figure 5.1 shows the author the
winning grand prize in the competition.
Figure 5.1: Author champion prize

46
Besides that, the author also took part FYP poster competition held at UTAR
5th
floor KB Block Sg. Long on 13 April 2016. The objective of this competition was
to provide an opportunity for FYP II students to demonstrate their independence,
originality and ethics. The chosen track for the competition was track 2, applied
science. There were 4 different tracks in the competition and track 2 has 17
competitors. Figure 5.2 shows the FYP competition poster. The author has won 1st
runner up in the competition. Figure 5.3 shows the author won the 1st runner-up prize.
Figure 5.2: FYP competition poster
Figure 5.3: Author first Runner-up prize
47
CHAPTER 6
6 CONCLUSION AND RECOMMENDATION
6.1 Conclusion
In conclusion, vehicle overheat prevention system: cooling fan failure alert system is
a system which helps serve as a prevention measure to the cooling system before it
damages the engine or collapsing the entire cooling system. This system does not
cost too expensive to be install. Thus, installing this system serve like buying
insurance for the engine and cooling system. From the result and discussion, all the
expected systems work and operating well. Besides that, to make sure the system run
well, deciding the right component to use in this system is critical as the system will
be placed in the harsh and hot environment.
All the objective of this project is achieved and accomplished. The possible
failure of the engine cooling system is determined and the characteristic of an electric
DC motor is also determined. The prototype of this system is built out and tested
working perfectly.
The main problem encounter during the implementation of this project is the
accuracy and functionality of the program. By debugging the problem, the accuracy
and desired working condition is achieved. Other than that, selecting the right
component to use in this project is crucial as it involves high current. Component
whenever has lower current rating than the rated current should not be selected in
order to avoid the component from burning. Besides that, overloading is also needed
48
to be considered in selecting the component. Hence, some of the component used in
this project such as cable, relay and current sensor are high current rated.
Although this project is successfully built and works perfectly, there is still a
lot of improvement can be done to it.
6.2 Future Improvements and Recommendations
Several improvements are recommended in this project to further enhance the system
failure detection system and also lower cost of implementation.
6.2.1 PIC Microcontroller
Instate of using Arduino as the main controller, PIC Microcontroller is recommended
to be implemented into this system. Although the programming of this PIC
microcontroller is much harder than the Arduino but the cost of the controller will be
cheaper by at least 4 times. The low cost is an added advantage to the PIC
microcontroller. However, to do a modification of code to cater different type of
electric cooling fan and CTS will be much harder. Modification of code will be done
once but the system to be implement into the vehicle is in high volume. Therefore,
cheaper systems still the biggest advantage.
6.2.2 Enhancing Detection of Cooling System Failure
To enhance this system to more reliable, instead of focusing only on the electric
cooling fan, it should focus on the entire vehicle cooling system. Since, the entire
system will consist of more failure part such as water pump, thermostat, and water
49
level of the cooling system. With this system, the vehicle overheat prevention
system is complete.
6.2.3 More Precise Tachometer
To enhance the precision of the tachometer, more magnets can be placed on the fan
blade. This is to ensure the RPM display is more precise and the value is updated
more quickly. Since the RPM display only update once a second, by enhancing the
tachometer precision, the RPM display can be updated every quarter of second.
50
REFERENCES
aa1car, 2015. Troubleshooting Electric Cooling Fan. [online] Available at:
<http://www.aa1car.com/library/electric_cooling_fan.htm> [Accesses 8 August
2015].
Allegro, 2015. ACS714: Automotive Grade, Fully Integrated, Hall-Effect Based
Linear Current Sensor IC with 2.1kVRMS Voltage Isolation and a Low-Resistance
Current Conductor. [online] Available at:
<http://www.allegromicro.com/en/Products/Current-Sensor-ICs/Zero-To-Fifty-
Amp-Integrated-Conductor-Sensor-ICs/ACS712.aspx> [Accesses 31 August
2015].
Autoelectrics, 2015. Typical engine management parameters that can be checked
using a scantool.[online] Available at: <http://autoelectrics.net/tuneup.html>
[Accesses 15 August 2015].
David Fuller, 2012. Mechanical vs. Electrical Fans: Which is Best for Your Vehicle?.
[online] Available at: <http://www.onallcylinders.com/2012/07/24/mechanical-vs-
electric-fans-which-best-your-vehicle/> [Accesses 29 August 2015].
How Engine Cooling System Works. 2015. [Video] Directed by Auto Tech Lab.
Kevin R. Sullivan, 2015. Toyota Electrical Wiring Diagram Workbook. [online]
Available at: <http://www.autoshop101.com> [Accesses 16 August 2015].
Marshall Brain, 2015. How Car Engines Work. [online] Available at:
<http://auto.howstuffworks.com/engine1.htm> [Accesses 9 August 2015].
Pulkrabek, Willard W. (1997). Engineering Fundamentals of the Internal
Combustion Engine. Prentice Hall. p. 2. ISBN 9780135708545.
SDT Drive Technology, 2015. DC Motor. [online] Available at:
<http://www.sdtdrivetechnology.co.uk/motors-and-drives/> [Accesses 8 August
2015].
trucknews.com, 2015. How to maintain your HD engine coolant system. [online]
Available at: <http://www.trucknews.com/features/maintain-heavy-duty-engine-
coolant-system/> [Accesses 9 August 2015].
51
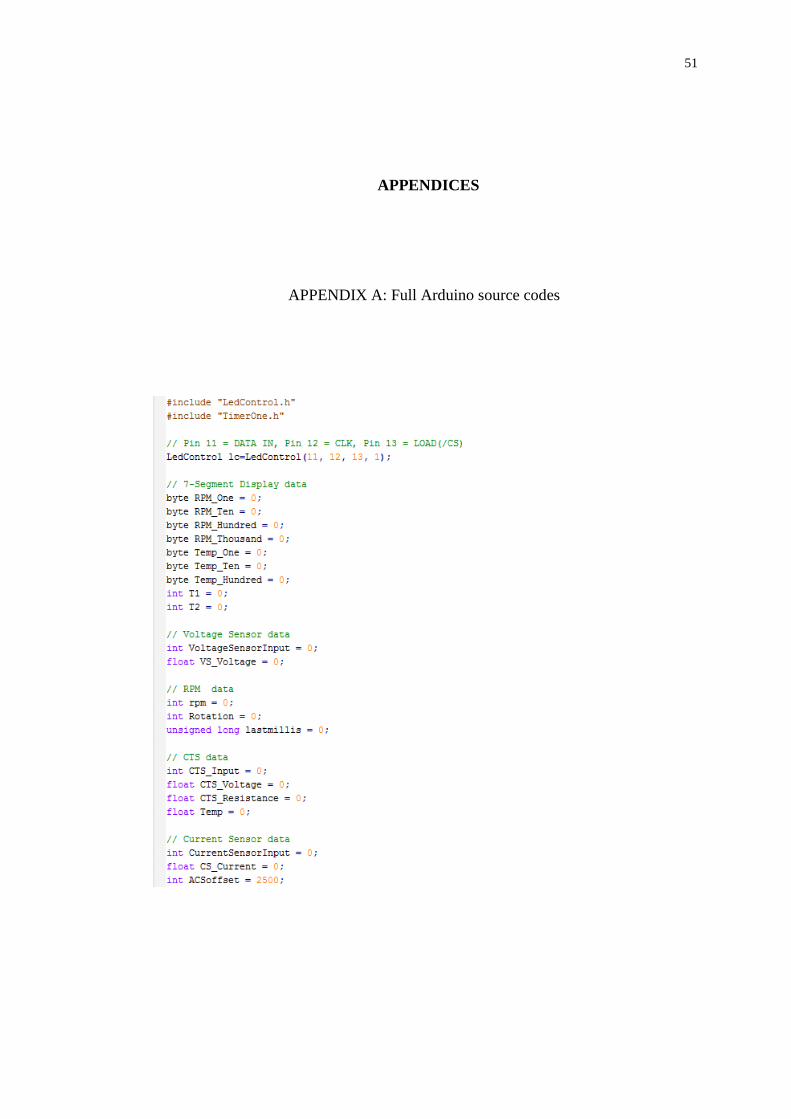
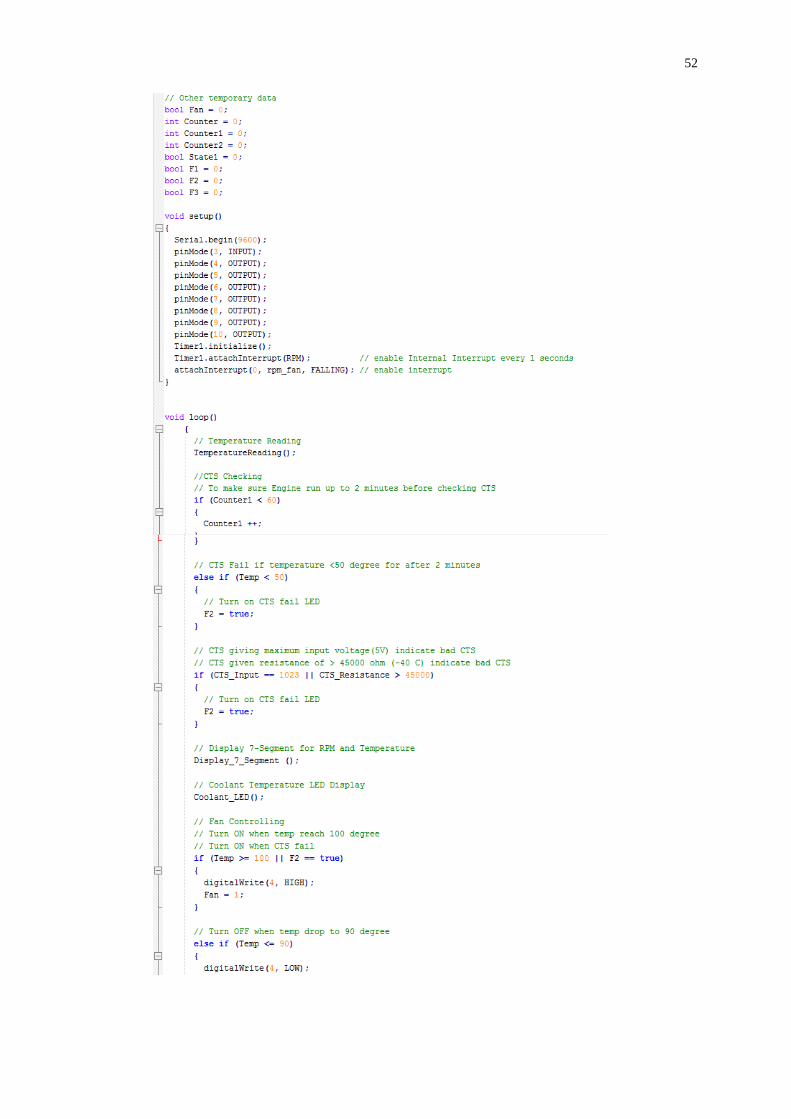
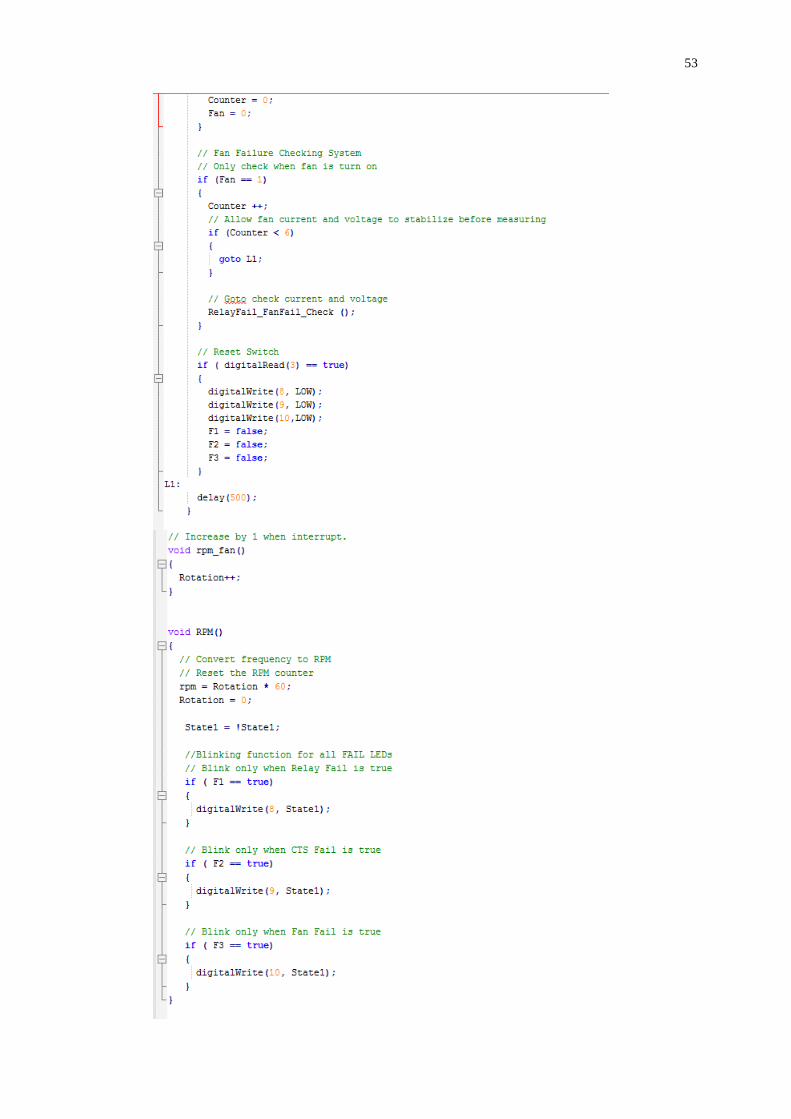
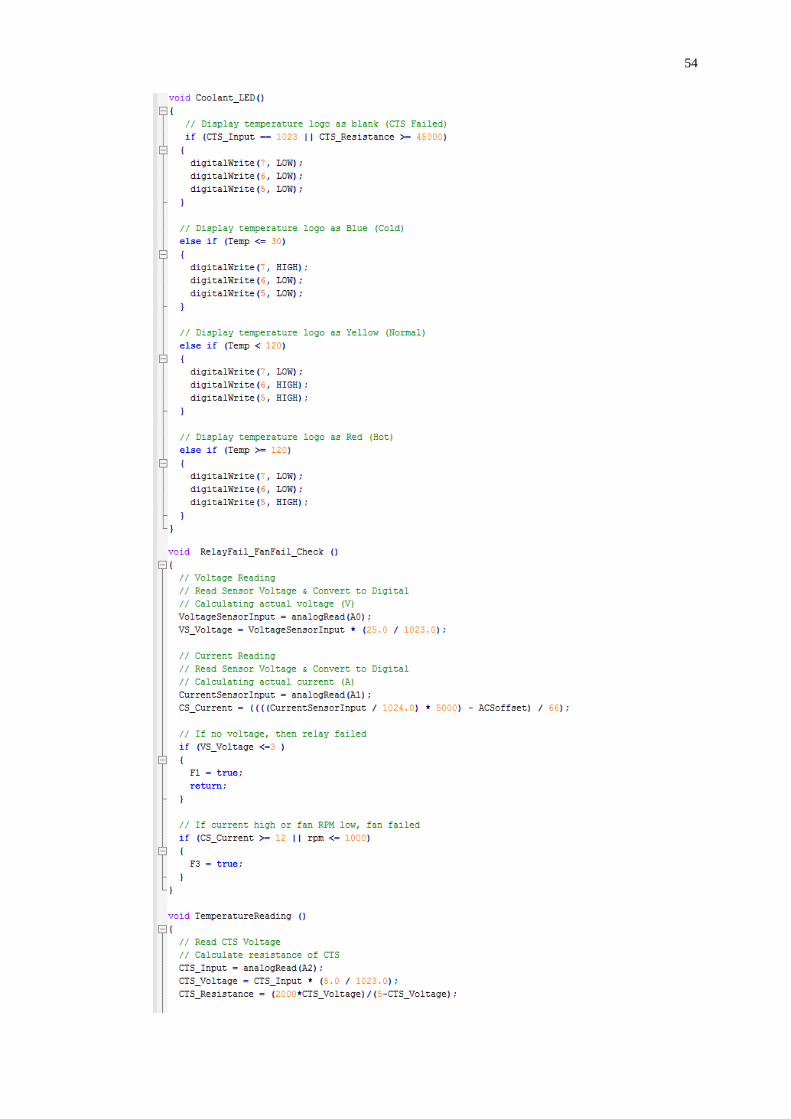
6 APPENDICES
APPENDIX A: Full Arduino source codes
52
53
54
55
56

57

58
APPENDIX B: MAX7221 IC datasheet
59
APPENDIX C: ACS712ELCTR-30A-T datasheet
60
APPENDIX D: A1220 datasheet
61
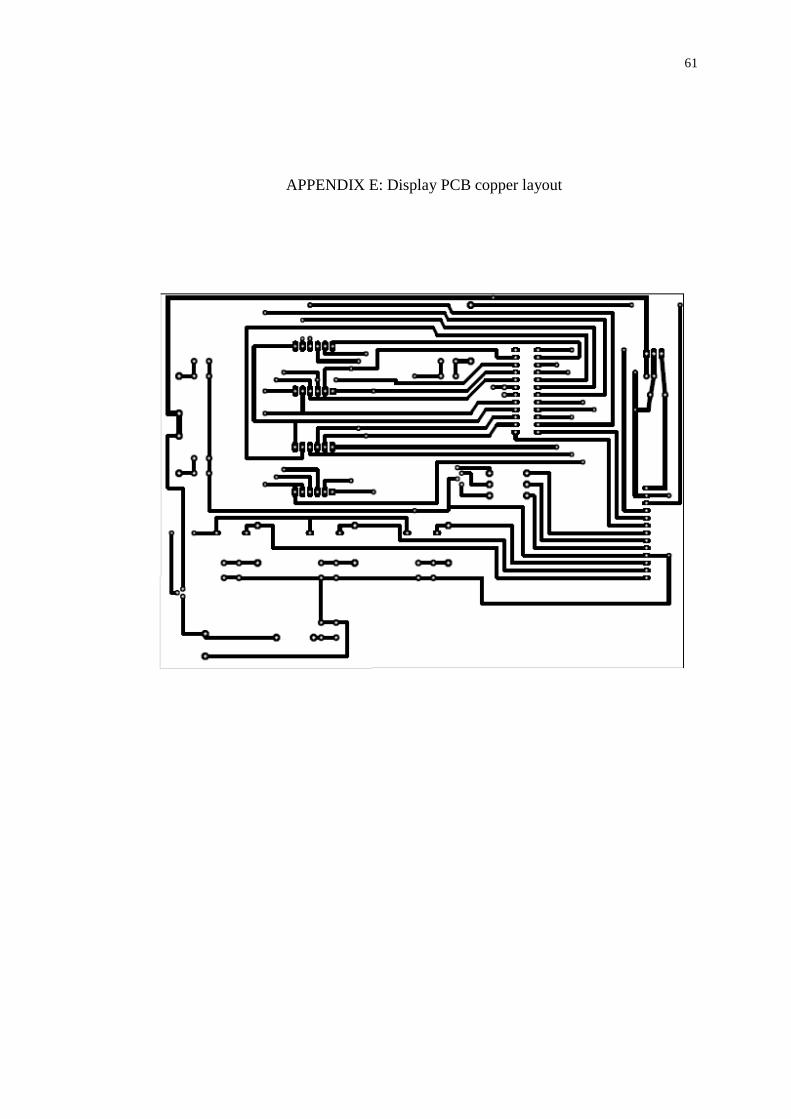
APPENDIX E: Display PCB copper layout