~VECTREN - IN.gov Vectren South Electric_2017 Rate CSP.pdfVERIFICATION The undersigned, J. Cas Swiz,...
24
Live Smart February 28, 2017 Mary M. Becerra Secretary to the Commission Indiana Utility Regulatory Commission PNC Center 101 W. Washington Street, Suite 1500 East Indianapolis, IN 46204 Vectren Cor poration One Vectren S quare Eva nsvill e, IN 47708 RE: Southern Indiana Gas and Electric Company (SIGECO) 30-Day Filing for Rate CSP Dear Ms. Becerra: This filing is being made on behalf of Southern Indiana Gas and Electric Company d/b/a Vectren Energy Delivery of Indiana, Inc. ("Company") under the Commission's Thirty-Day Administrative Filing Procedures and Guidelines ("Guidelines") in compliance with Commission's Rules and Regulations with respect to Cogeneration and Alternative Energy Production Facilities. Enclosed is the proposed tariff sheet covering rates for purchase of energy and capacity as required by 170 IAC 4-4.1-8, 170 IAC 4-4.1-9, and 170 IAC 4-4.1-10, and the supporting data for the rates and rate filing as required by 170 IAC 4-4.1-4. The Company's filing is an allowable filing under 170 IAC 1-6-3 because the proposal is a filing for which the Commission has already approved or accepted the procedure for the change. Proof of Publication of the legal notice for this filing from the Evansville Courier & Press, a newspaper of general circulation in Vanderburgh County that has a circulation encompassing the highest number of the ·company's customers affected by the filing, is included. The Company also affirms that the notice has been posted on its website. The Company does not have a local customer service office in which to post the notice.
Transcript of ~VECTREN - IN.gov Vectren South Electric_2017 Rate CSP.pdfVERIFICATION The undersigned, J. Cas Swiz,...

~VECTREN ~ Live Smart
February 28, 2017
Mary M. Becerra Secretary to the Commission Indiana Utility Regulatory Commission PNC Center 101 W. Washington Street, Suite 1500 East Indianapolis, IN 46204
Vectren Corporation
One Vectren Square
Evansville, IN 47708
RE: Southern Indiana Gas and Electric Company (SIGECO) 30-Day Filing for Rate CSP
Dear Ms. Becerra:
This filing is being made on behalf of Southern Indiana Gas and Electric Company d/b/a
Vectren Energy Delivery of Indiana, Inc. ("Company") under the Commission's Thirty-Day
Administrative Filing Procedures and Guidelines ("Guidelines") in compliance with
Commission's Rules and Regulations with respect to Cogeneration and Alternative Energy
Production Facilities. Enclosed is the proposed tariff sheet covering rates for purchase of energy
and capacity as required by 170 IAC 4-4.1-8, 170 IAC 4-4.1-9, and 170 IAC 4-4.1-10, and the
supporting data for the rates and rate filing as required by 170 IAC 4-4.1-4.
The Company's filing is an allowable filing under 170 IAC 1-6-3 because the proposal is
a filing for which the Commission has already approved or accepted the procedure for the
change.
Proof of Publication of the legal notice for this filing from the Evansville Courier & Press,
a newspaper of general circulation in Vanderburgh County that has a circulation encompassing
the highest number of the ·company's customers affected by the filing, is included. The
Company also affirms that the notice has been posted on its website. The Company does not
have a local customer service office in which to post the notice.
vlucas
30 Day Received

Any questions concerning this submission should be directed to J. Cas Swiz by using
the following contact information:
Enclosures cc: William Fine
J. Cas Swiz Director, Rates and Regulatory Analysis One Vectren Square 211 N.W. Riverside Drive Evansville, IN 47708 Tel.: 812.491.4033 Fax: 812.491.4138 Email: [email protected]
V\:
Matt McDowell Senior Regulatory Analyst
Indiana Office of Utility Consumer Counselor (w/ encl.)

VERIFICATION
The undersigned, J. Cas Swiz, being duly sworn, under penalty of perjury affirms that
the affected customers of the Southern Indiana Gas and Electric Company d/b/a Vectren
Energy Delivery of Indiana, Inc. Rate CSP filing have been notified by publication in the
Evansville Courier & Press, as required by 170 IAC 1-6-6. A copy of said legal notice of
publication is enclosed.
J. {;?s Swiz
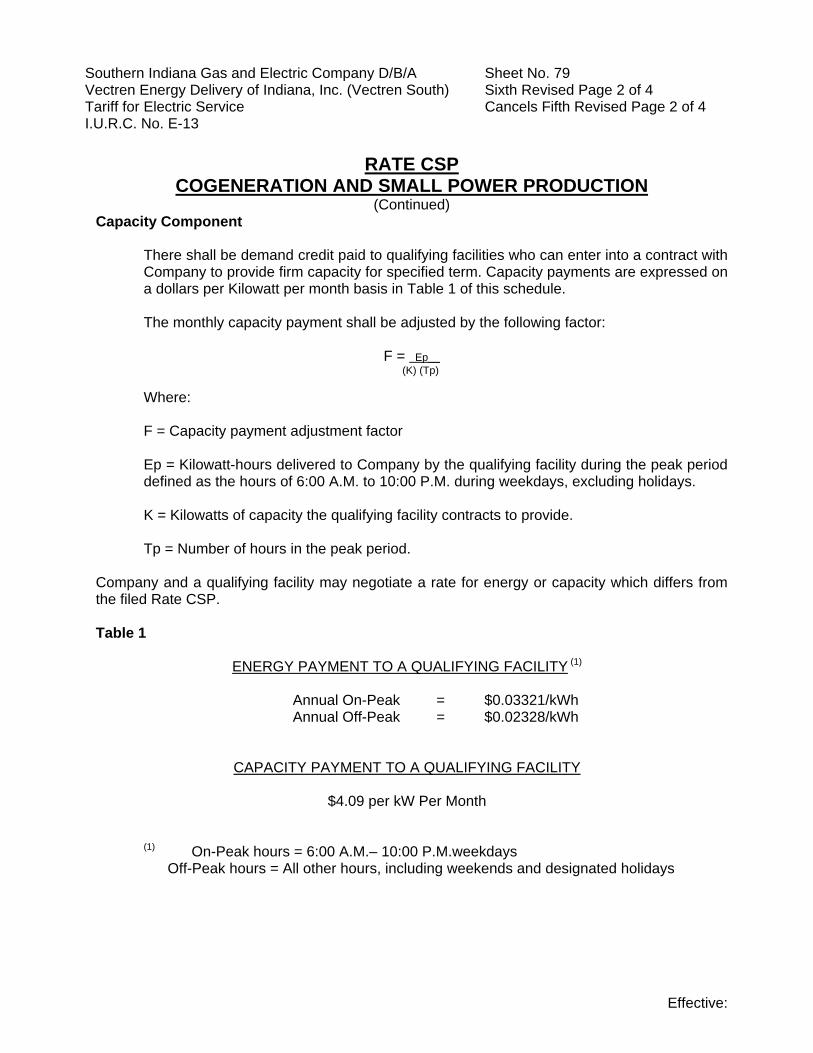
Southern Indiana Gas and Electric Company D/B/A Sheet No. 79 Vectren Energy Delivery of Indiana, Inc. (Vectren South) Sixth Revised Page 2 of 4 Tariff for Electric Service Cancels Fifth Revised Page 2 of 4 I.U.R.C. No. E-13
RATE CSP
COGENERATION AND SMALL POWER PRODUCTION (Continued)
Capacity Component There shall be demand credit paid to qualifying facilities who can enter into a contract with
Company to provide firm capacity for specified term. Capacity payments are expressed on a dollars per Kilowatt per month basis in Table 1 of this schedule.
The monthly capacity payment shall be adjusted by the following factor:
F = Ep__ (K) (Tp)
Where: F = Capacity payment adjustment factor Ep = Kilowatt-hours delivered to Company by the qualifying facility during the peak period
defined as the hours of 6:00 A.M. to 10:00 P.M. during weekdays, excluding holidays. K = Kilowatts of capacity the qualifying facility contracts to provide. Tp = Number of hours in the peak period. Company and a qualifying facility may negotiate a rate for energy or capacity which differs from the filed Rate CSP. Table 1
ENERGY PAYMENT TO A QUALIFYING FACILITY (1)
Annual On-Peak = $0.03321/kWh Annual Off-Peak = $0.02328/kWh
CAPACITY PAYMENT TO A QUALIFYING FACILITY $4.09 per kW Per Month (1) On-Peak hours = 6:00 A.M.– 10:00 P.M.weekdays Off-Peak hours = All other hours, including weekends and designated holidays
Effective:

Southern Indiana Gas and Electric Company D/B/A Sheet No. 79 Vectren Energy Delivery of Indiana, Inc. (Vectren South) FifthSixth Revised Page 2 of 4 Tariff for Electric Service Cancels Fourthifth Revised Page 2 of 4 I.U.R.C. No. E-13
RATE CSP
COGENERATION AND SMALL POWER PRODUCTION (Continued)
Capacity Component There shall be demand credit paid to qualifying facilities who can enter into a contract with
Company to provide firm capacity for specified term. Capacity payments are expressed on a dollars per Kilowatt per month basis in Table 1 of this schedule.
The monthly capacity payment shall be adjusted by the following factor:
F = Ep__ (K) (Tp)
Where: F = Capacity payment adjustment factor Ep = Kilowatt-hours delivered to Company by the qualifying facility during the peak period
defined as the hours of 6:00 A.M. to 10:00 P.M. during weekdays, excluding holidays. K = Kilowatts of capacity the qualifying facility contracts to provide. Tp = Number of hours in the peak period. Company and a qualifying facility may negotiate a rate for energy or capacity which differs from the filed Rate CSP. Table 1
ENERGY PAYMENT TO A QUALIFYING FACILITY (1)
Annual On-Peak = $0.0331821/kWh Annual Off-Peak = $0.02553328/kWh
CAPACITY PAYMENT TO A QUALIFYING FACILITY $4.0967 per kW Per Month (1) On-Peak hours = 6:00 A.M.– 10:00 P.M.weekdays Off-Peak hours = All other hours, including weekends and designated holidays
Effective: April 7, 2016
1
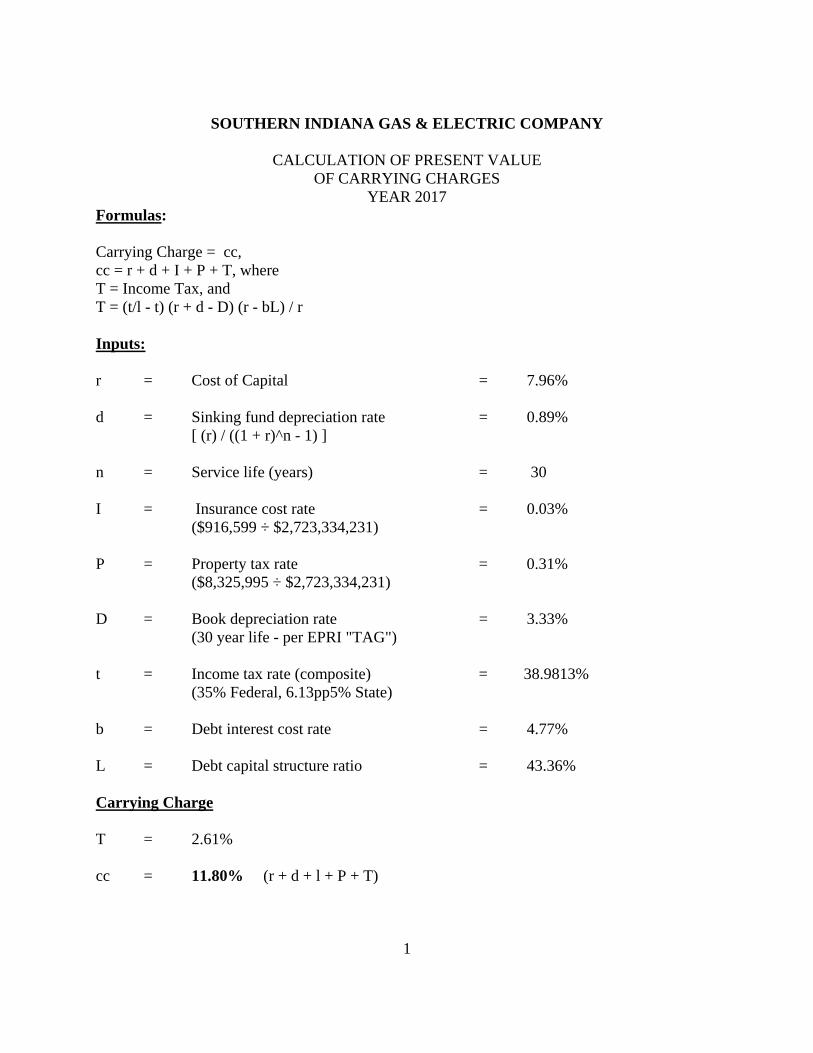
SOUTHERN INDIANA GAS & ELECTRIC COMPANY
CALCULATION OF PRESENT VALUE OF CARRYING CHARGES
YEAR 2017 Formulas: Carrying Charge = cc, cc = r + d + I + P + T, where T = Income Tax, and T = (t/l - t) (r + d - D) (r - bL) / r Inputs: r = Cost of Capital = 7.96% d = Sinking fund depreciation rate = 0.89%
[ (r) / ((1 + r)^n - 1) ] n = Service life (years) = 30
I = Insurance cost rate = 0.03%
($916,599 ÷ $2,723,334,231) P = Property tax rate = 0.31%
($8,325,995 ÷ $2,723,334,231) D = Book depreciation rate = 3.33%
(30 year life - per EPRI "TAG") t = Income tax rate (composite) = 38.9813%
(35% Federal, 6.13pp5% State) b = Debt interest cost rate = 4.77% L = Debt capital structure ratio = 43.36% Carrying Charge T = 2.61% cc = 11.80% (r + d + l + P + T)

2
SOUTHERN INDIANA GAS & ELECTRIC COMPANY
CALCULATION OF COGENERATION RATE FOR PURCHASE OF CAPACITY
YEAR 2017 Formula per 170 IAC 4-4.1-9:
)(11 YcYiripCCa Inputs: D = (cc) (1 + r)^n - 1 = (cc) * 11.6365 = 1.3731
(r) (1 + r)^n
cc = 11.80% (See Carrying Charge calculation) V = $722/ kW (See Burns & McDonnell Technical Assessment –Prototypes –
Alternative Technology Options, (including gas pipeline work and excl. AFUDC) inflated to 2020.
ip = 6.9% (Growth Rate in Handy Whitman Cost Index for Gas Turbogenerators) io = 2.5% (Growth Rate in Producer Price Index for Finished Goods) r = 7.96% (See Cost of New Capital) O = $12.09 / kW (Estimated Operating Cost for 2020) L = 4.30% (2015 FERC Form 1 data)
(261,039 ÷ 6,070,275) t = 1 n = 30 years (EPRI - TAG 1993)
211
1
11
1
11
1
11
12
1 11 L - io +
r +
io + O + ip +
r +
ip + -
r +
ip + -
DV = C -tt
n

3
Yi = 2020 (In service date of turbine) Yc = 2017 (Current Year) Rate: C = Unadjusted Capacity Payment = $4.21 per kW per month for year 2020 Ca = Adjusted Capacity Payment = $4.09 per kW per month for year 2017

4
SOUTHERN INDIANA GAS & ELECTRIC COMPANY
ESTIMATED CAPACITY CAPITAL COST YEAR 2017
Basis of Cost Based on SIGECO generic 220 MW simple cycle turbine. Capacity Cost Cost per kW (2020 $) =$722/kW

5
SOUTHERN INDIANA GAS & ELECTRIC COMPANY
CALCULATIONS OF COGENERATION RATE FOR PURCHASE OF ENERGY
YEAR 2017 Basis of Calculation: The system's energy cost was derived utilizing a simple average of two separate LMP forecasts provided by the 2016 IRP Model. Energy Rate: Values from dispatch model: Annual On-Peak avoided cost (1) = $0.03249 /kWh Annual Off-Peak avoided cost = $0.02278 /kWh Adjustment for losses (2) 1 = 1.02197 (1 - (0.043003/2)) Adjusted Energy Rates Annual On-Peak avoided cost = $0.03321 /kWh Annual Off-Peak avoided cost = $0.02328 /kWh Notes: (1) On-Peak hours = 6 am – 10 pm, weekdays
Off-Peak hours = All other hours, including weekends and designated holidays (2) Energy losses from 2015 FERC Form 1, page 401a.

6
SOUTHERN INDIANA GAS & ELECTRIC COMPANY
CALCULATION OF COST OF NEW CAPITAL YEAR 2017
Item Capital Structure (1) Cost Rate (1) Composite Rate
Debt 43.36% 4.77% 2.07%
Preferred Stock 0.00% 0.00% 0.00%
Common Equity 56.64% 10.40% 5.89%
100.00% 7.96%
Notes: (1) Capital structure and cost rates as of December 31, 2016. Common equity cost rate from Order in Cause No. 43839, page 32.

Capital Cost CompositeItem Structure Rate Cost
Debt 43.36% 4.77% 2.07% Balance 12-31-16
Preferred Stock 0.00% 0.00% 0.00% Balance 12-31-16
Common Equity 56.64% 10.40% 5.89% Rate Per Order in Cause No. 43839
100.00% 7.96%
Inputs:r = Cost of capital 7.96%
d = Sinking fund depreciation rate 0.89%[(r) / ((1+r)^n - 1)]
n = Service life (years) 30
I = Insurance cost rate 0.03% 2015 FERC 1 page 323, line 185 / page 200, line 13($916599/$2723334231)
P = Property tax rate 0.31% 2015 FERC 1 page 263, line 9 / page 200, line 13($8325995/$2723334231)
D = Book depreciation rate 3.33%(30 year life - per EPRI "TAG")
t = Income tax rate (composite) 38.9813%
b = Debt interest cost rate 4.77%
L = Debt capital structure ratio 43.36%
Carrying Charge
T = 2.61%
cc = 11.80% (r + d + I + P + T)
Southern Indiana Gas & Electric Company
WeightedCost of Capital
Year 2017

C = Unadjusted monthly capacity payment per-kilowatt of contracted 4.21 Unadjusted Capacity Ratecapacity year of completion of unit.
Ca = C * (((1 + Ip)/(1 + r))^(Yi-Yc)) 4.09 Adjusted Capacity Rate
D = Present value of carrying charges for one dollar of investment (cc)* 11.6365 = 1.3731 over n years with carrying charges assumed to be paid at end ofeach year.(1+r)^(n-1)/r(1+r)^n
cc 11.80%
V = Investment amount in year of completion, including allowance for 722 2016 IRP inflated to 2020 levelfunds used during construction, of the avoidable or deferrableunit, stated on a per-kilowatt basis and including rated share ofcommon costs.
n = Expected life of the avoidable or deferrable unit. 30
ip = Annual escalation rate associated with the avoidable or deferrable 6.9% From Handy Whitman
unit.
io = Annual escalation rate associated with the operation and 2.5% From Producer Price Index
maintenance expenses, less fuel and fuel-related expenses, of theavoidable or deferrable unit.
r = Purchasing utility's after tax cost of capital. 7.96%
O = Expected total fixed and variable yearly operating and maintenance 12.09 2016 IRP inflated to 2020 levelexpenses, less fuel and fuel-related expenses, in expected firstyear of avoidable or deferrable unit's operation stated on aper-kilowatt basis
L = Line losses, expressed as a percentage, for the previous year. 4.30% 2015 FERC 1 Page 401a, line 27/ line 28(261039/6070275)
t = Contract term in years, with t = 1 to t. 1
Yi = In service date of the avoidable or deferrable unit 2020Yc = Current Year 2017
For Purchase of CapacityYear 2017
Southern Indiana Gas & Electric Company
Calculation of Cogeneration Rate

Escalated Capital Cost
Capability, MW (nominal) 219.8
Fixed O&M, $/kW-yr 7.08
$/yr 1,556,184
Variable O&M, $/MWh 3.82$
MW (Technical Assessment) 219.8
hours in a year 8760
Capacity Factor (Assumption) 0.08
MWH (MW*Yearly Hours* CF) 154,035.84
Maintenance Cost per Start (TA) 15,000.00$
Starts (Assumption) 30
(Maintenance Cost per start*Starts) 450,000.00$
$/MWH 2.92$
$/MWH (Tech. Assessment Variable O&M) 0.90$
Total Variable O&M ($/MWH) 3.82$
Total O&M, $/kW 10.90
Capital Cost Estimate (2015 $)$/kW 650
[1] Source: Generation Technology Assessment SCGT F- Class (September 2015)
1.021Inflation Factor of 1.021 per EIA
Total O & M $/kW 2016 11.13$ Annual Energy Outlook 2016 Early Release, Table A202017 11.36$ 2018 11.60$ 2019 11.84$ 2020 12.09$ =O
capital cost estimate 2016 6642017 6782018 6922019 7072020 722 =V

Southern Indiana Gas & Electric CompanyCompound Growth Rate of
Handy-Whitman Cost Index for Gas Turbogenerators
AnnualYear Handy-Whitman Growth
Year Index Index Rate y = Year Index x = LN (H-W Index)
2004 1 428 1 6.05912 2005 2 420 (0.01869) 2 6.04025 2006 3 435 0.03571 3 6.07535 2007 4 511 0.17471 4 6.23637 2008 5 581 0.13699 5 6.36475 2009 6 619 0.06540 6 6.42811 2010 7 680 0.09855 7 6.52209 2011 8 683 0.00441 8 6.52649 2012 9 757 0.10835 9 6.62936 2013 10 797 0.05284 10 6.68085 2014 11 810 0.01631 11 6.69703 2015 12 847 0.04568 12 6.74170 2016 13 871 0.02834 13 6.76964
Log-Linear Growth 0.06713
Compound Growth Rate (Exponential of Log-Linear Growth) 0.06943
Stated as percentage 6.9%
Southern Indiana Gas & Electric CompanyCompound Growth Rate of
Producer Price Index
AnnualYear Producer Price Growth
Year Index Finished Goods Index Rate y = Year Index x = LN (H-W Index)
2004 1 143.3 1 4.96494 2005 2 155.7 0.08653 2 5.04793 2006 3 160.4 0.02987 3 5.07736 2007 4 166.6 0.03887 4 5.11550 2008 5 177.2 0.06343 5 5.17700 2009 6 172.5 (0.02606) 6 5.15059 2010 7 179.8 0.04197 7 5.19171 2011 8 190.7 0.06077 8 5.25070 2012 9 194.3 0.01892 9 5.26945 2013 10 196.7 0.01222 10 5.28159 2014 11 200.4 0.01911 11 5.30052 2015 12 193.9 (0.03280) 12 5.26717 2016 13 191.9 (0.01014) 13 5.25697
Log-Linear Growth 0.02486
Compound Growth Rate (Exponential of Log-Linear Growth) 0.02517
Stated as percentage 2.5%

Based on 2016 IRP Model Inputs 2017 CSPAll values shown in nominal dollars
month Average of onpk Average of offpkMar-17 30.53$ 22.98$ Apr-17 30.74$ 21.04$
May-17 32.31$ 20.02$ Jun-17 34.65$ 19.62$ Jul-17 36.36$ 23.39$
Aug-17 35.34$ 22.94$ Sep-17 32.67$ 21.70$ Oct-17 29.67$ 20.42$ Nov-17 29.21$ 23.32$ Dec-17 31.03$ 24.61$ Jan-18 34.00$ 26.88$ Feb-18 33.41$ 26.46$
12 month average 32.49$ 22.78$
ferc 1 line losses 4.30%Adjusted for losses 1.02197
On peak$/MWh
Off-Peak$/MWh
Adjusted Energy Rates 33.20726 23.28132
$ per kWh 0.03321$ 0.02328$
Data
Source: Scott Brown

Name of Respondent This Report Is:(1) An Original(2) A Resubmission
Date of Report(Mo, Da, Yr)
Year/Period of Report
End of
SUMMARY OF UTILITY PLANT AND ACCUMULATED PROVISIONS
Southern Indiana Gas and Electric CompanyX
04/18/20162015/Q4
Line No.
(b)(a)
Classification Electric
(c)
FOR DEPRECIATION. AMORTIZATION AND DEPLETION
Total Company for the Current Year/Quarter Ended
Report in Column (c) the amount for electric function, in column (d) the amount for gas function, in column (e), (f), and (g) report other (specify) and incolumn (h) common function.
Utility Plant 1
In Service 2
2,227,533,010 2,548,060,816Plant in Service (Classified) 3
Property Under Capital Leases 4
Plant Purchased or Sold 5
466,855,705 552,381,053Completed Construction not Classified 6
Experimental Plant Unclassified 7
2,694,388,715 3,100,441,869Total (3 thru 7) 8
Leased to Others 9
1,391,263 1,391,263Held for Future Use 10
27,554,253 31,918,626Construction Work in Progress 11
Acquisition Adjustments 12
2,723,334,231 3,133,751,758Total Utility Plant (8 thru 12) 13
1,253,912,010 1,409,256,836Accum Prov for Depr, Amort, & Depl 14
1,469,422,221 1,724,494,922Net Utility Plant (13 less 14) 15
Detail of Accum Prov for Depr, Amort & Depl 16
In Service: 17
1,253,912,010 1,409,256,836Depreciation 18
Amort & Depl of Producing Nat Gas Land/Land Right 19
Amort of Underground Storage Land/Land Rights 20
Amort of Other Utility Plant 21
1,253,912,010 1,409,256,836Total In Service (18 thru 21) 22
Leased to Others 23
Depreciation 24
Amortization and Depletion 25
Total Leased to Others (24 & 25) 26
Held for Future Use 27
Depreciation 28
Amortization 29
Total Held for Future Use (28 & 29) 30
Abandonment of Leases (Natural Gas) 31
Amort of Plant Acquisition Adj 32
1,253,912,010 1,409,256,836Total Accum Prov (equals 14) (22,26,30,31,32) 33
FERC FORM NO. 1 (ED. 12-89) Page 200

Name of Respondent This Report Is:(1) An Original(2) A Resubmission
Date of Report(Mo, Da, Yr)
Year/Period of Report
End of
TAXES ACCRUED, PREPAID AND CHARGED DURING YEAR (Continued)
Southern Indiana Gas and Electric CompanyX
04/18/20162015/Q4
Line No.(Taxes accrued
BALANCE AT END OF YEARPrepaid Taxes Electric
(Account 408.1, 409.1)Extraordinary Items
(Account 409.3)Adjustments to Ret. OtherEarnings (Account 439)
(g) (h) (i) (j) (k) (l)Account 236) (Incl. in Account 165)
DISTRIBUTION OF TAXES CHARGED
5. If any tax (exclude Federal and State income taxes)- covers more then one year, show the required information separately for each tax year, identifyingthe year in column (a).6. Enter all adjustments of the accrued and prepaid tax accounts in column (f) and explain each adjustment in a foot- note. Designate debit adjustmentsby parentheses.7. Do not include on this page entries with respect to deferred income taxes or taxes collected through payroll deductions or otherwise pendingtransmittal of such taxes to the taxing authority.8. Report in columns (i) through (l) how the taxes were distributed. Report in column (I) only the amounts charged to Accounts 408.1 and 409.1pertaining to electric operations. Report in column (l) the amounts charged to Accounts 408.1 and 109.1 pertaining to other utility departments andamounts charged to Accounts 408.2 and 409.2. Also shown in column (l) the taxes charged to utility plant or other balance sheet accounts.9. For any tax apportioned to more than one utility department or account, state in a footnote the basis (necessity) of apportioning such tax.
1
1,270,045 7,743,913 -30,401 2
3
337,356 42,802 4
-401,483 4,497,610 5
7,755 -941 6
7
5,973 6,263 8
1,142,119 8,325,995 9,807,810 9
10
2,361,765 20,567,518 9,825,533 11
12
13
22,197 -1,623 14
477,372 436,704 15
41,381 16
41,381 499,569 435,081 17
18
19
14,770 1,957 20
-6,497,827 23,907,809 5,111,278 21
-6,079 -36,636 22
6,117 37,578 -237 23
-6,483,019 23,908,751 5,112,998 24
25
26
27
28
29
30
31
32
33
34
35
36
37
38
39
40
FERC FORM NO. 1 (ED. 12-96) Page 263
41 44,975,838 -4,079,873 15,373,612

ELECTRIC OPERATION AND MAINTENANCE EXPENSES (Continued)
Name of Respondent This Report Is:(1) An Original(2) A Resubmission
Date of Report(Mo, Da, Yr)
Year/Period of Report
End ofSouthern Indiana Gas and Electric CompanyX
04/18/20162015/Q4
Line No.
Account Amount for
(c)(b)(a)Current Year Previous Year
Amount forIf the amount for previous year is not derived from previously reported figures, explain in footnote.
6. CUSTOMER SERVICE AND INFORMATIONAL EXPENSES 165
Operation 166
(907) Supervision 167
(908) Customer Assistance Expenses 168 80,714 107,553
(909) Informational and Instructional Expenses 169 38,304 15,073
(910) Miscellaneous Customer Service and Informational Expenses 170 472,950 200,123
TOTAL Customer Service and Information Expenses (Total 167 thru 170) 171 591,968 322,749
7. SALES EXPENSES 172
Operation 173
(911) Supervision 174 11,851 12,685
(912) Demonstrating and Selling Expenses 175 12,210,395 8,277,068
(913) Advertising Expenses 176 17
(916) Miscellaneous Sales Expenses 177 5,113 3,913
TOTAL Sales Expenses (Enter Total of lines 174 thru 177) 178 12,227,376 8,293,666
8. ADMINISTRATIVE AND GENERAL EXPENSES 179
Operation 180
(920) Administrative and General Salaries 181 15,933,065 13,774,963
(921) Office Supplies and Expenses 182 5,086,009 4,967,264
(Less) (922) Administrative Expenses Transferred-Credit 183 1,769,532 2,396,160
(923) Outside Services Employed 184 12,443,765 12,966,825
(924) Property Insurance 185 949,574 916,599
(925) Injuries and Damages 186 1,512,346 1,431,286
(926) Employee Pensions and Benefits 187 16,981 12,950
(927) Franchise Requirements 188
(928) Regulatory Commission Expenses 189 1,245,526 1,102,376
(929) (Less) Duplicate Charges-Cr. 190
(930.1) General Advertising Expenses 191
(930.2) Miscellaneous General Expenses 192 4,206,235 3,700,629
(931) Rents 193 45,875 28,089
TOTAL Operation (Enter Total of lines 181 thru 193) 194 39,669,844 36,504,821
Maintenance 195
(935) Maintenance of General Plant 196 206,183 231,473
TOTAL Administrative & General Expenses (Total of lines 194 and 196) 197 39,876,027 36,736,294
TOTAL Elec Op and Maint Expns (Total 80,112,131,156,164,171,178,197) 198 369,793,391 342,919,667
FERC FORM NO. 1 (ED. 12-93) Page 323

Name of Respondent This Report Is:(1) An Original(2) A Resubmission
Date of Report(Mo, Da, Yr)
Year/Period of Report
End of
ELECTRIC ENERGY ACCOUNT
Southern Indiana Gas and Electric CompanyX
04/18/20162015/Q4
Line No.
Item
(a)(b)(a) (b)
Line No.
MegaWatt Hours Item MegaWatt Hours
Report below the information called for concerning the disposition of electric energy generated, purchased, exchanged and wheeled during the year.
SOURCES OF ENERGY1
Generation (Excluding Station Use):2
4,825,473Steam3
Nuclear4
Hydro-Conventional5
Hydro-Pumped Storage6
56,289Other7
Less Energy for Pumping8
4,881,762Net Generation (Enter Total of lines 3
through 8)
9
1,094,924Purchases10
Power Exchanges:11
5,165,575Received12
5,071,986Delivered13
93,589Net Exchanges (Line 12 minus line 13)14
Transmission For Other (Wheeling)15
Received16
Delivered17
Net Transmission for Other (Line 16 minus
line 17)
18
Transmission By Others Losses19
6,070,275TOTAL (Enter Total of lines 9, 10, 14, 18
and 19)
20
DISPOSITION OF ENERGY21
5,458,157Sales to Ultimate Consumers (Including
Interdepartmental Sales)
22
3,158Requirements Sales for Resale (See
instruction 4, page 311.)
23
334,603Non-Requirements Sales for Resale (See
instruction 4, page 311.)
24
Energy Furnished Without Charge25
13,318Energy Used by the Company (Electric
Dept Only, Excluding Station Use)
26
261,039Total Energy Losses27
6,070,275TOTAL (Enter Total of Lines 22 Through
27) (MUST EQUAL LINE 20)
28
FERC FORM NO. 1 (ED. 12-90) Page 401a

E-3 COST TRENDS OF ELECTRIC UTILITY CONSTRUCTION
NORTH CENTRAL REGION (1973=100)
2003 2004 2005 2006 2008 2009 2010
Line
CONSTRUCTION AND EQUIPMENTJan.
1Jul.1
Jan.1
Jul.1
Jan.1
Jul.1
Jan.1
Jul.1
Jan.1
Jul.1
Jan.1
Jul.1
Jan.1
Jul.1
Jan.1
Jul.1
Jan.1
Jul.1
Jan.1
Jul.1
Jan.1
Jul.1
Jan.1
Jul.1
Jan.1
Jul.1
Jan.1
Jul. 1Jan.
1Jul.1
1 Total Plant-All Steam Generation 411 410 418 434 453 460 481 495 518 529 561 580 585 564 579 587 599 616 622 628 650 641 648 657 668 678 679 6832 Total Plant-All Steam & Nuclear Gen. 409 409 417 433 452 459 480 494 517 527 559 578 583 561 577 585 597 614 620 626 648 639 646 655 666 676 678 6823 Total Plant-All Steam & Hydro Gen. 409 409 417 433 452 459 479 493 516 527 559 578 583 561 577 585 597 613 620 625 647 639 645 654 666 675 677 68045 Steam Production Plant6 Total Steam Production Plant 438 436 446 456 477 481 495 503 520 531 547 576 570 554 566 577 586 602 614 616 647 624 628 640 650 668 670 6777 Structures & Improvements-Indoor 389 386 398 413 435 438 451 458 474 482 501 530 532 518 528 535 547 561 574 578 596 587 597 608 617 623 626 6318 Structures & Improvements-Semi-Outdoor 369 369 396 404 418 425 438 445 457 483 501 513 514 490 495 498 509 512 523 527 535 534 544 545 555 548 548 5539 Boiler Plant Equipment-Coal Fired 458 454 459 475 495 499 514 521 534 543 557 585 591 577 589 597 607 625 636 639 669 645 647 662 670 690 694 70010 Boiler Plant Equipment-Gas Fired - - - - - - - - - - - - - - - - - - - - - - - - - - - -11 Boiler Plant Piping Installed 373 370 381 394 439 443 460 465 477 475 491 530 545 529 538 550 564 578 597 601 612 603 611 617 619 623 623 62712 Turbogenerator Units 433 434 438 441 464 461 471 483 499 501 513 559 514 489 502 525 525 547 551 547 596 551 550 562 570 605 605 61713 Accessory Electrical Equipment 505 504 513 522 562 572 596 616 661 682 719 744 774 793 812 828 855 883 917 938 971 973 987 1010 1042 1055 1065 106614 Misc. Power Plant Equipment 457 453 465 479 511 513 531 538 540 544 555 593 595 587 597 603 620 632 652 660 675 670 669 683 686 691 684 6871516 Nuclear Production Plant17 Total Nuclear Production Plant 404 405 410 422 447 449 462 471 486 489 502 530 521 510 521 532 539 557 565 568 606 575 580 590 597 626 628 63718 Structures & Improvements 370 367 378 388 406 410 420 427 438 433 447 462 462 455 461 466 471 478 487 493 509 499 508 512 520 524 526 53219 Reactor Plant Equipment 391 393 396 413 439 441 455 463 476 480 489 518 512 502 513 521 530 549 554 556 603 562 566 576 579 620 622 6332021 Hydro Production Plant22 Total Hydraulic Production Plant 367 368 382 384 397 400 410 417 432 442 454 471 469 461 467 475 483 488 498 500 518 507 513 518 527 538 538 54423 Structures & Improvements 389 386 398 413 435 438 451 458 474 482 501 530 532 518 528 535 547 561 574 578 596 587 597 608 617 623 626 63124 Reservoirs, Dams & Waterways 348 348 364 370 384 388 399 404 417 428 439 446 447 441 445 449 462 464 476 481 487 488 495 500 511 510 511 51425 Water Wheels, Turbines & Generators 396 402 410 393 399 397 406 416 436 444 455 493 481 469 478 496 491 499 501 494 542 498 499 499 504 552 548 5602627 Other Production Plant28 Total Other Production Plant 436 439 430 437 428 435 445 456 516 529 582 603 620 655 675 688 681 702 751 768 790 786 803 819 840 843 862 87729 Fuel Holders, Producers & Accessories 397 397 402 427 454 460 469 478 494 497 512 548 554 537 541 540 554 563 582 587 596 590 606 615 621 623 626 63230 Gas Turbogenerators 437 439 428 434 420 427 435 447 511 524 581 602 619 659 680 693 683 704 757 775 797 792 810 827 847 851 871 8883132 Transmission Plant33 Total Transmission Plant 418 417 427 454 471 485 512 528 553 568 603 631 640 591 617 619 631 650 646 653 667 666 673 680 690 692 696 69934 Station Equipment 428 424 427 466 483 495 517 533 567 583 604 627 640 641 658 665 682 699 709 718 736 728 735 746 759 764 766 76835 Towers & Fixtures 389 390 417 424 436 439 454 457 468 494 513 515 523 500 506 506 524 525 541 543 558 549 560 562 572 574 579 58336 Poles & Fixtures 442 444 453 457 476 493 502 515 526 529 561 570 583 587 596 574 581 584 588 591 595 598 591 593 599 594 592 59537 Overhead Conductors & Devices 447 448 455 487 511 542 605 643 678 695 753 828 831 580 669 677 662 725 650 658 673 690 691 698 705 706 721 72138 Underground Conduit 377 376 388 404 436 436 454 458 477 472 494 527 536 519 520 526 540 544 566 568 569 567 591 588 596 593 589 59139 Underground Conductors & Devices 467 469 473 523 529 547 590 594 605 610 790 828 829 840 836 828 893 897 906 937 948 970 997 1008 1019 1024 1027 10274041 Distribution Plant42 Total Distribution Plant 367 369 373 391 408 417 446 466 499 507 563 562 581 567 583 591 606 621 627 637 649 659 670 676 690 691 689 68943 Station Equipment 387 386 391 441 457 464 492 503 537 555 573 595 606 608 629 637 653 662 669 677 679 683 693 696 703 698 696 69744 Poles, Towers & Fixtures 419 423 425 434 453 457 470 480 496 497 511 525 537 538 547 545 548 552 558 562 567 570 568 569 577 572 570 57245 Overhead Conductors & Devices 439 442 449 468 489 512 555 579 609 624 670 715 725 612 666 679 690 732 699 710 729 744 757 770 789 791 795 79546 Underground Conduit 383 380 393 395 420 422 449 451 471 468 487 495 509 507 501 504 517 518 537 539 541 542 556 555 564 562 558 56047 Underground Conductors & Devices 333 335 337 354 382 393 423 428 507 514 554 586 647 639 593 600 638 652 684 708 694 722 715 728 725 733 705 70548 Line Transformers 248 253 244 264 275 283 320 361 408 416 602 506 532 555 581 606 620 638 658 673 714 731 770 787 819 821 844 84249 Pad Mounted Transformers 359 359 387 457 492 541 562 653 689 820 642 759 728 665 668 646 650 706 708 708 710 688 691 674 677 694 720 65950 Services-Overhead 362 362 371 378 395 402 428 428 451 452 475 485 491 457 477 484 510 528 509 511 515 517 529 537 555 558 542 54151 Services-Underground 264 264 268 269 279 292 335 372 356 352 349 350 325 327 328 350 390 408 429 448 454 456 453 411 439 434 399 39452 Meters Installed 282 282 319 319 306 306 310 316 319 326 330 332 334 334 346 347 340 338 334 337 341 343 349 350 355 355 352 34553 Street Lighting-Overhead 467 471 474 480 499 508 526 594 617 627 641 672 738 751 771 719 732 755 766 781 775 783 743 744 743 761 740 73854 Mast Arms & Luminaires Installed 438 444 447 453 482 496 524 555 574 585 576 587 709 705 714 728 733 748 769 788 772 788 701 704 696 722 679 67955 Street Lighting-Underground 481 484 488 492 510 517 535 615 640 651 671 708 766 784 809 735 751 777 788 802 798 806 776 775 775 794 778 77556
COST TRENDS OF
COST INDEX NUMBERS
2007
NORTH
OST INDEX NUMBER
COST TRENDS OF ELECTRIC UTILITY CONSTRUC
NORTH CENTRAL REGION (1973=100)
2011 2012 2013 2014 2015 2016
COST INDEX NUMBERS
2017
E-3-1Handy-Whitman Bulletin No. 184

Bureau of Labor Statistics
Series Id:
Group:Item:Base Date:Years:
Year Jan Feb Mar Apr May Jun Jul Aug Sep Oct Nov Dec Annual
2006 159.9 158.0 159.1 160.7 161.2 161.8 161.7 162.3 160.3 158.9 159.8 160.5 160.4
2007 160.1 161.8 164.1 165.9 167.5 167.2 168.5 166.1 167.4 168.6 171.4 170.4 166.6
2008 172.0 172.3 175.1 176.5 179.8 182.4 185.1 182.2 182.2 177.4 172.0 168.8 177.2
2009 170.4 169.9 169.1 170.3 171.1 174.3 172.4 174.2 173.2 173.8 175.7 176.0 172.5
2010 178.0 176.9 179.1 179.5 179.9 179.0 179.5 180.0 180.0 181.2 181.6 182.6 179.8
2011 184.5 186.7 189.3 191.6 192.7 191.6 192.4 191.8 192.8 191.9 191.9 191.2 190.7
2012 192.1 193.0 194.5 195.0 193.8 192.9 193.3 195.5 196.9 196.4 194.5 193.8 194.3
2013 194.9 196.4 196.7 196.0 196.9 197.3 197.3 197.9 197.3 196.9 196.1 196.5 196.7
2014 198.1 198.9 200.3 202.1 201.8 202.9 203.0 202.5 201.7 200.4 198.2 195.4 200.4
2015 192.2 192.6 193.6 193.1 196.0 197.7 197.4 196.3 193.4 192.4 191.6 190.1 193.9
2016 189.9 188.8 189.2 190.3 191.7 193.8 193.5 192.6 193.2 193.5 192.6 193.7 191.9
Final demand
Finished goods
198200
2006 to 2016
Producer Price Index-CommoditiesOriginal Data Value
WPUFD49207
Not Seasonally Adjusted
Source: Bureau of Labor Statistics Generated on: February 6, 2017 (04:23:50 PM)

Macroeconomic Indicators, Reference case
(billion 2005 chain‐weighted dollars, unless otherwise noted)UPDATED 2016 Early Release data
Indicators 2015 2016 2017 2018 2019 2020 2021 2022 2023
Growth Rate
(2015‐2040)
Real Gross Domestic Product 16,349 16,841 17,335 17,740 18,155 18,555 18,928 19,337 19,811 2.2%
Components of Real Gross Domestic Product
Real Consumption 11,221 11,577 11,961 12,283 12,606 12,861 13,106 13,368 13,665 2.3% Real Investment 2,842 2,996 3,201 3,315 3,400 3,513 3,593 3,699 3,837 2.8% Real Government Spending 2,860 2,919 2,935 2,946 2,956 2,967 2,968 2,983 3,007 0.9% Real Exports 2,119 2,193 2,291 2,382 2,489 2,615 2,757 2,906 3,068 4.3% Real Imports 2,662 2,815 3,030 3,165 3,274 3,374 3,465 3,582 3,723 3.8%
Energy Intensity
(thousand Btu per 2009 dollar of GDP)
Delivered Energy 4.38 4.30 4.22 4.17 4.10 4.03 3.96 3.88 3.81 ‐1.7% Total Energy 5.92 5.79 5.69 5.60 5.52 5.42 5.33 5.22 5.12 ‐1.8%
Price Indices (Inflated at 1.021) 1.12136 1.14206 1.16608 1.18903 1.21278 1.23875 1.26811 1.2966 GDP Chain‐type Price Index (2009=1.000) 1.098 1.119 1.142 1.165 1.188 1.213 1.242 1.270 1.295 2.1% Consumer Price Index (1982‐84=1.00)
All‐urban 2.37 2.39 2.45 2.52 2.59 2.65 2.72 2.80 2.86 2.4% Energy Commodities and Services 2.02 1.82 1.95 2.09 2.28 2.41 2.52 2.61 2.70 3.4% Wholesale Price Index (1982=1.00)
All Commodities 1.91 1.89 1.95 2.01 2.08 2.14 2.19 2.24 2.29 2.0% Fuel and Power 1.60 1.49 1.64 1.78 1.96 2.10 2.18 2.26 2.36 3.7% Metals and Metal Products 2.01 1.97 2.03 2.08 2.11 2.15 2.20 2.24 2.29 1.7% Industrial Commodities excluding Energy 1.94 1.96 2.01 2.05 2.09 2.13 2.18 2.22 2.26 1.8%
Interest Rates (percent, nominal)
Federal Funds Rate 0.13 0.89 1.88 2.79 3.33 3.32 3.22 3.03 3.02 ‐ ‐ 10‐Year Treasury Note 2.14 2.57 2.72 3.27 3.86 3.83 3.77 3.64 3.60 ‐ ‐ AA Utility Bond Rate 4.01 4.53 4.74 5.30 5.87 5.87 5.74 5.49 5.35 ‐ ‐
Value of Shipments (billion 2009 dollars)
Non‐Industrial and Service Sectors 24,085 24,839 25,313 25,740 26,292 26,750 27,093 27,441 27,978 1.8% Total Industrial 7,229 7,506 7,783 7,977 8,174 8,351 8,513 8,645 8,841 1.9% Agriculture, Mining, and Construction 1,931 2,056 2,205 2,320 2,404 2,493 2,529 2,550 2,585 1.7% Manufacturing 5,299 5,450 5,578 5,657 5,770 5,858 5,984 6,095 6,256 1.9% Energy‐Intensive 1,704 1,728 1,759 1,800 1,853 1,892 1,927 1,954 1,986 1.4% Non‐Energy‐Intensive 3,594 3,722 3,819 3,857 3,917 3,967 4,057 4,141 4,271 2.1%Total Shipments 31,314 32,345 33,096 33,717 34,466 35,101 35,606 36,086 36,819 1.8%
Population and Employment (millions)
Population, with Armed Forces Overseas 321.9 324.5 327.1 329.8 332.4 335.0 337.6 340.2 342.8 0.7% Population, aged 16 and over 256.6 259.3 261.9 264.3 266.8 269.3 271.7 274.1 276.6 0.8% Population, aged 65 and over 48.1 49.7 51.3 53.0 54.8 56.7 58.6 60.5 62.4 2.2% Employment, Nonfarm 141.8 144.1 146.4 147.6 148.9 150.3 151.1 152.0 153.2 0.7% Employment, Manufacturing 12.5 12.7 12.9 13.0 13.1 13.1 13.2 13.3 13.3 ‐0.1%
Key Labor Indicators
Labor Force (millions) 157.3 159.7 161.9 163.8 165.4 166.6 167.7 168.7 169.6 0.7% Nonfarm Labor Productivity (2009=1.00) 1.06 1.08 1.09 1.11 1.13 1.15 1.16 1.19 1.21 1.7% Unemployment Rate (percent) 5.31 4.99 4.89 4.92 4.77 4.72 4.84 5.03 5.08 ‐ ‐
Key Indicators for Energy Demand
Real Disposable Personal Income 12,225 12,649 13,069 13,486 13,868 14,197 14,493 14,808 15,143 2.3% Housing Starts (millions) 1.18 1.36 1.54 1.64 1.70 1.74 1.73 1.72 1.72 1.3%
Commercial Floorspace (billion square feet) 83.8 84.7 85.6 86.6 87.7 88.7 89.8 90.8 91.9 1.1%
Unit Sales of Light‐Duty Vehicles (millions) 17.36 17.87 18.27 18.07 17.80 17.11 16.95 16.91 17.14 0.4%
Btu = British thermal unit.
‐ ‐ = Not applicable.
Sources: 2014 and 2015: IHS Economics, Industry and Employment models, November 2015.
Projections: U.S. Energy Information Administration, AEO2016 National Energy Modeling System run ref2016.d032416a.
GDP = Gross domestic product.

coUkIER&PREss Affidavit of Publication Gleaner THE ~vocATE
RE gill
VE
AC
PRODUCTS OF C&P MEDIA -------~
Affidavit
LEGAL NOTICE
Notice Is hereby given that on or about February 28, 2017d southern Indiana Gas an Electric Company d/b/a Vee· tren Energy Delivery of lndi· ana, Inc. ("Vectren South") will file a request with the Indiana Utility Regulatory Commission for approval to update its Rate CSP - Cogenerabon and Small Power Production, to estab· lish prices for the purchase of energy and capacity from owners of a qualifying facility, as defined by the Commission. The capacity component of Rate CSP will also impact the capacity charge for firm back· up power under Rate BAMP (Backup, Auxiliary and Mainte· nance Power Services), as well as capacity credits t o be paid to customers under Rider IC (Interruptible Contract Rider), Rider 10 (Interruptible Option Rider) and Rider IP·2 (Interruptible Power Service Rider), as applicable.
Vectren South anticipates approval of the filing by June 1, 2017, but no sooner than 30 days after receipt of the fi ling by the Commission. Objections to the filing should be made in writing addressed to:
Mary M. Becerra Secretary to the Commission Indiana Utility Regulatory Commission PNC Center 101 w. Washington Street , Suite 1500 East Indianapolis, Indiana 46204
William Fine Indiana Utility consumer Counselor Indiana Office of Utility Consumer Counselor PNC center 115 w. Washington St., Suite 1500 South Indianapolis, Indiana 46204
Scott E. Albertson Vice President, Regulatory Affairs & Gas Supply VECTREN UTILITY HOLDINGS, INC. (Courier & Press February 18, 2017)hspaxlp
y
PROOF OF PUBLICATION OF LEGAL ADVERTISEMENT
Account Number: EXV22 I 108836
STATE OF INDIANA VANDERBURGH COUNTY
I ~ who being sworn, is employee of van~pany, publisher of The Evansville Courier a daily n wspaper published in the city of Evansville, in said county and state and that the legal advertisement, of which the attached is a true copy, was printed in its issues of:
Ad ID: 1491269 EC-Evansville Courier & Press 02/18117 Sat
cl-r;xJ-f] Date
Subscribed and sworn to before me this date:
Date
~ 4 , _ ~d.d~~otaryPublic C R~sident of Vanderburgh County
My Commission expires: __ } ____ CJ_--___,l/,__-_L..2J~-~---------
65 lines@ 1 time(s) $458.74

![[Form] Declaration Under Penalty of Perjury for the ...](https://static.fdocuments.us/doc/165x107/620dbc6a65adab1c7b53a888/form-declaration-under-penalty-of-perjury-for-the-.jpg)