VECTO tool development: Completion of …Service contract CLIMA.C.2/SER/2012/0004 Draft final Report...
157
Service contract CLIMA.C.2/SER/2012/0004 Draft final Report 1 VECTO tool development: Completion of methodology to simulate Heavy Duty Vehicles' fuel consumption and CO 2 emissions Upgrades to the existing version of VECTO and completion of certification methodology to be incorporated into a Commission legislative proposal. Specific Contract N° 34020112014/695203/SERJCLIMA.C.2 Framework contract CLIMA.C.2/FRA/2013/0007 By order of EUROPEAN COMMISSION DG CLIMA Report No. I 15/17/Rex EM-I 2013/08 1670 from 30.10.2017 Heinz Steven
Transcript of VECTO tool development: Completion of …Service contract CLIMA.C.2/SER/2012/0004 Draft final Report...
Service contract CLIMA.C.2/SER/2012/0004 Draft final Report
1
VECTO tool development: Completion of methodology to simulate Heavy Duty Vehicles'
fuel consumption and CO2 emissions
Upgrades to the existing version of VECTO and completion of certification methodology to be
incorporated into a Commission legislative proposal.
Specific Contract N° 34020112014/695203/SERJCLIMA.C.2
Framework contract CLIMA.C.2/FRA/2013/0007
By order of
EUROPEAN COMMISSION
DG CLIMA
Report No. I 15/17/Rex EM-I 2013/08 1670 from 30.10.2017
Heinz Steven

Service contract CLIMA.C.2/SER/2012/0004 Draft final Report
2
Authors
Martin Rexeis TUG
Markus Quaritsch TUG
Stefan Hausberger TUG
Gérard Silberholz TUG
Antonius Kies TUG
Heinz Steven HS DAC
Martin Goschütz TNM
Robin Vermeulen TNO

Service contract CLIMA.C.2/SER/2012/0004 Draft final Report
3
Table of contents
Abbreviations ...................................................................................................... 6
1 Introduction ................................................................................................ 8
2 Overview on the outcome of the project and the content of the report . 9
3 Work description per task ....................................................................... 10
3.1 Task A.1: Methodology development ........................................................... 10
3.1.1 Task A.2: Development of VECTO software............................................. 11
3.1.2 Task A.3: Provide assistance to all potential VECTO users ...................... 11
3.1.3 Task A.4: Consultation with stakeholders ................................................. 12
3.2 Task B.1: VECTO 2015 upgrades ................................................................ 13
3.3 Task B.2: Review and amend engine map calculation approach ................. 15
3.4 Task B.3: Verification/Validation: finalise the procedure ............................... 16
3.5 Task B.4: VECTO 2015 upgrades: finalise the Technical annex .................. 17
3.6 Task B.5: Multistage vehicles: second stage certification procedure ............ 17
3.7 Task B.6: Demonstration test campaign ...................................................... 18
3.8 Task C.1: Validate the outcome of the current "auxiliaries" SR3 project ....... 19
3.9 Task C.2: Buses and coaches ..................................................................... 20
3.10 Task C.3: VECTO for intermediate-size vehicles ...................................... 20
3.11 Task C.4: Vehicles not covered in LOT3 and LOT4 .................................. 21
3.12 Task C.5: Make existing VECTO code testable, provide test cases ......... 22
3.13 Task C.6: Organisation - participation in demonstration test campaign .... 22
3.14 Task C.7: Prepare guidelines for overhauling VECTO as a forward looking
tool, using a vector-capable language .................................................................. 23
4 Description of methodologies ................................................................. 24
4.1 Introduction .................................................................................................. 24
4.2 Component test procedures ......................................................................... 24

Service contract CLIMA.C.2/SER/2012/0004 Draft final Report
4
4.2.1 Engine Test procedure ............................................................................. 24
4.2.2 Engine Pre-processing tool ...................................................................... 28
4.2.3 Air drag test procedure ............................................................................. 29
4.2.4 Air drag pre-processing tool (“VECTO Air Drag”) ..................................... 32
4.2.5 Transmission test procedure .................................................................... 33
4.2.6 Axle test procedure .................................................................................. 33
4.3 Software VECTO ......................................................................................... 35
4.3.1 Overview .................................................................................................. 35
4.3.2 Description ............................................................................................... 35
4.3.3 Development methods ............................................................................. 44
4.3.4 VECTO Testability and Code Quality ....................................................... 48
4.3.5 Generic data in VECTO for simulation of official CO2 values .................... 56
4.4 Ex-Post test procedure (EPTP) .................................................................... 82
4.5 Regulatory description ............................................................................... 100
5 Application of the VECTO method for HDV groups not covered by the
actual HDV CO2 legislation............................................................................. 101
5.1 Buses and coaches (M3 vehicles) ............................................................. 102
5.1.1 Further development of the VECTO AT model ....................................... 102
5.1.2 Implementation of the Ricardo AAUX module ........................................ 103
5.1.3 Bus and Coach workshop ...................................................................... 104
5.1.4 Preparation of baseline documents for the B&C pre-pilot phase............. 104
5.1.5 Open topics for a implementation of B&C into the HDV CO2 legislation . 105
5.2 Intermediate-size vehicles (M2 and N2 with max GVW from 3.5 to 7.49 tons)
106
5.2.1 Overview of vehicle models and current certification options for CO2 ..... 109
5.2.2 Analysis of the representativeness of test cycles ................................... 109
5.2.3 Outlook .................................................................................................. 115
5.3 Further HDV groups not considered yet ..................................................... 116
5.3.1 All-wheel-drive trucks ............................................................................. 117
5.3.2 Specific bodies, trailers and semi-trailers ............................................... 118
6 Main open work for follow up activities after SR7 ............................... 120
7 Summary and outlook ............................................................................ 124
8 Literature ................................................................................................. 127

Service contract CLIMA.C.2/SER/2012/0004 Draft final Report
5
Annex I: Documents for Planning of the Bus and Coach Pre-Pilot Phase
(PPP) ................................................................................................................ 129
Annex II: Guidelines how to use VECTO in the Bus and Coach Pre-Pilot
Phase (PPP) ..................................................................................................... 132

Service contract CLIMA.C.2/SER/2012/0004 Draft final Report
6
Abbreviations
AAUX Advanced auxiliary model as implemented in VECTO for buses and coaches
A/C Air conditioning
AMT Automated manual transmission, spur-gear design
API Application programming interface
AT Automated transmission, hydraulic element & planetary gearbox
avrg Average
B&C Buses and coaches
CH4 Methane
CNG Compressed natural gas, 200 bar, +20 °C
CO Carbon monoxide
CO2 Carbon dioxide
CO2e CO2 equivalents, warming potential of greenhouse gases, normed to CO2
CoP Conformity of Production
CS VECTO Construction cycle
DEA Data exchange API
DT Delivery truck
dyno Dynamometer
EC European Commission
ECU Electronic control unit
EGR Exhaust gas recirculation
EM Electrical machine
EPTP Ex Post Test Procedure; test for validation of VECTO input data related to axle, gear box and engine based on a complete vehicle test
ESC European Steady state Cycle, duty cycle for heavy-duty diesel engines
Eta bzw Efficiency, usually defined here as ratio from output work to input work of a component
FC Fuel consumption, usually ratio of (consumed fuel) to (driven distance)
FCMC Fuel consumption mapping cycle
FTP Federal Test Procedure, US duty cycle for heavy-duty diesel engines
GCWR Gross Combined Weight Rating, max. permitted weight of truck and trailer
GEM Greenhouse Gas Emissions Model, c/o USEPA
GHG Greenhouse gas
GUI Graphical user interface
GVW
Gross vehicle weight…..curb weight plus payload and driver. Curb weight… total weight of a vehicle in driving condition (i.e. all necessary operating consumables on board, such as fuel, motor oil, transmission oil, etc.), but without loading and without driver
GVWR Gross vehicle weight rating, max. permitted vehicle weight
HC Hydrocarbons
HDV Heavy-duty vehicle, maximum permitted vehicle mass > 3.5 t
HEV Hybrid electrical vehicle
HDV CO2 TA HDV CO2 legislation as adopted by the TCMV on the 11
th of May 2017 and
its technical annexes

Service contract CLIMA.C.2/SER/2012/0004 Draft final Report
7
HIL Hardware in the Loop (simulation with interface to physical components)
HUB VECTO Heavy Urban Bus cycle
HVAC Heating, Ventilation and Air Conditioning
ICE Internal combustion engine
LCV Light Commercial Vehicle (light buses and trucks <3.5t GVWR)
LH VECTO Long Haul cycle
LHV Lower heating value
LNG Liquefied natural gas, 6 bar, -140°C
MT Manual transmission
MU VECTO Municipal Utility cycle (refuse truck)
MY Model year
N2O Nitrogen dioxide
no. Number
NOx Nitrogen oxides, sum of nitrogen monoxide (NO) & dioxide (NO2)
OEM Original Equipment Manufacturer
ORC Organic Rankine cycle, steam power process
PHEM Passenger car and Heavy duty vehicle Emission Model
PM Particulate matter
RB Rigid bus
RD VECTO Regional Delivery cycle
SCR Selective catalytic reduction, process for denitrification of exhaust
SI Système international d’unités
SIL Software in the Loop (combination of independent software element into a single simulation, e.g. longitudinal simulated model with interface to blackbox controller software)
SOC State of charge, energy storage, battery or supercapacitor
SORT 1, 2, 3 Standardised OnRoad Test 1, 2, 3 bus cycle
SR7 “Service Request 7”, naming of the project/contract described in this report
SUB VECTO Suburban Bus cycle
TT Tractor-trailer
TTW Tank-to-wheel, referred only to the operation of the vehicle
UB VECTO Urban Bus cycle
UD VECTO Urban Delivery cycle
VECTO Vehicle Energy Consumption calculation Tool
w/o without
WHR Waste heat recovery
WHTC World Harmonized Transient cycle
WHVC World Harmonized Vehicle Cycle
WTT Well-to-tank, referred to the production process of the fuel
WTW Well-to-wheel, referred to the vehicle operation and the production process of the fuel

Service contract CLIMA.C.2/SER/2012/0004 Draft final Report
8
1 Introduction
Aiming for reductions of CO2 emissions from road transport, the European Commission
(EC) has prepared a methodology for certification of CO2 emissions from Heavy Duty
vehicles (HDV). The general approach of the new certification procedure is based on
tests of the individual components of the vehicle and a subsequent simulation of fuel
consumption and CO2 emissions of the entire HDV. This approach offers the possibility
to accurately capture the highly diverse characteristics of HDVs and their influence on
fuel consumption and CO2 emissions, without heavily increasing the complexity and the
costs for vehicle certification.
As one of the central parts in the development of the CO2 certification procedure the EC
launched the development of a “Vehicle Energy Consumption calculation Tool”
(VECTO). VECTO simulates CO2 emissions and fuel consumption based on vehicle
longitudinal dynamics using a driver model for backward simulation of target speed
cycles. The required load to be delivered by the internal combustion engine is calculated
based on the driving resistances, the power losses in the drivetrain system and the
power consumption of the vehicle auxiliary units. Engine speed is determined based on a
gear shift model, the gear ratios and the wheel diameter. Fuel consumption is then
interpolated from an engine fuel map. CO2 emissions are calculated based on fuel
consumption and reference fuel specifications.
The previous projects LOT2 [3] and LOT3 [4] have brought the method and
corresponding software and descriptions already on a high level. The objectives of the
work in the current project (“SR7”) were related to the finalisation of the entire CO2
certification method for trucks as basis for a legislative procedure. Furthermore other
open tasks should be brought forward which mainly meant inclusion of additional HDV
categories and technologies and an improvement of the software quality.
To obtain robust test procedures and supporting software the following tasks have been covered by the consortium during the SR7 project:
a) Development of proper methodologies for component tests, for validation tests and for the simulation
b) Development of the software necessary for a) c) Elaboration of the default input data and of generic values necessary for b) d) Provide assistance to all potential users of a) and b) e) Consultation with stakeholders
The work has been performed in close cooperation with industry and with JRC to ensure
an efficient use of resources and to guarantee a broad acceptance of the certification
procedure.

Service contract CLIMA.C.2/SER/2012/0004 Draft final Report
9
2 Overview on the outcome of the project and the content of the report
The project delivered as planned a complete package for the CO2 certification of trucks
based on the “VECTO method”. The deliverables of the SR7 project are:
The software VECTO (Vehicle Energy Consumption calculation Tool) for
simulating fuel consumption and CO2 emissions of HDV.
The software is suitable to be used as the backbone of the future European HDV
CO2 certification and meets professional software requirements as laid out in the
SR7 Service Request.
A complete set of generic data required for CO2 certification of trucks for the
vehicle groups 1, 2, 3, 4, 5, 9, 10, 11, 12 and 16 (all truck groups as currently
foreseen to be CO2 certified)
The generic data comprises driving cycles, driver model settings, generic gear
shift strategies for MT, AMT and AT vehicles, vehicle payloads, definitions for
standard bodies and standard (semi-)trailers, wheel specifications for all common
HDV tyre dimensions, data on power demand from truck auxiliary operation, data
on usage patterns of refuse trucks represented in the “municipal cycle”, fuel
properties for the six reference engine fuel types as defined in ECE R49 as well
as data on average European ambient conditions.
A user manual for VECTO in HTML format integrated in the graphical user
interface of the software
A document with VECTO software development guides (in Annex II to this final
report)
The software tool “VECTO Engine” for evaluation of the HDV CO2 engine test
procedure and for generation of VECTO input data for the engine component
A User manual for VECTO Engine distributed with the VECTO Engine software
The software tool “VECTO Air Drag” for evaluation of the HDV CO2 constant
speed test procedure and generation of VECTO input data for the air drag
component
A User manual for VECTO Air Drag distributed with the VECTO Air Drag software
This final report
The actual report describes first the budgetary situation in the project as requested by the contract (chapter Error! Reference source not found.).
In chapter 3 an overview on the activities in the single tasks as laid out in the Service
contract of SR7 is given.

Service contract CLIMA.C.2/SER/2012/0004 Draft final Report
10
Chapter 4 provides a complete description of the “VECTO method” by providing details
on methods for component and vehicle testing, on the VECTO simulation tool and on the
set of generic data relevant in the CO2 certification for trucks.
Chapter 6 reports all activities in SR7 related to the extension of the VECTO method to
other vehicle categories than currently foreseen in the HDV CO2 legislation.
Chapter 7 lists the topics as identified for follow up activities after SR7.
Finally chapter 8 contains a summary of the report.
3 Work description per task
In this chapter the status of each subtask listed in the Proposal for Service Request 7 is described.
3.1 Task A.1: Methodology development
The tasks A were ongoing tasks over the project. Below the activities are described in short.
Sub-task: A.1
Overview on content: In A.1 rules and methods are defined which are general valid in all tasks described later
Work to be performed
Description Status
Terms of reference for component,
vehicle and software testing by
OEMs or other organizations
Test plans for the pilot phase for trucks and for the pre pilot phase for buses were elaborated to provide all information needed from the test activities.
Completed
Provide assistance to OEMs for tests of the latest release of
VECTO
Support was given to all users of VECTO, VECTO Air Drag and VECTO Engine during the project.
Completed
Perform targeted validation activities or collaboration in
validation tests organized by other
organizations
Validation activities were performed based on TUG chassis dynamometer tests and support was given in validation activities performed at JRC and ACEA for trucks and buses.
Completed
Provide assistance to other contractors
or organizations working on similar
topics
The bus auxiliary software from Ricardo was implemented in the new VECTO version by TUG. No other relevant activities were necessary in this task.
Completed
Compare real The measurements from ACEA, JRC and TUG were all Completed

Service contract CLIMA.C.2/SER/2012/0004 Draft final Report
11
driving "proof of concept" fuel
consumption and CO2 emissions with
simulated fuel consumption
compared to VECTO results. Extensive comparisons with various other sources on real world fuel consumption were made which are described in detail in a Phd thesis [2]. All comparisons indicate that realistic fuel consumption values are provided by VECTO.
3.1.1 Task A.2: Development of VECTO software
Sub-task: A.2
Overview on content: In A.2 general valid rules and methods were defined for all tasks dealing with software development and with improving the reliability of existing code following the demands listed in the service request.A.2 also covers assistance to all potential VECTO users in the course of the project
Work to be performed Description Status
Elaborate guidelines for software development in VECTO family
Software development guidelines document is part of this final report (Annex II).
Completed
3.1.2 Task A.3: Provide assistance to all potential VECTO users
Sub-task: A.3
Overview on content: A.3 was running during the entire project and contained all kind of assistance to users of VECTO, VECTO Air Drag and VECTO Engine.
Work to be performed Description Status
Support and assistance for VECTO users
Support was provided by phone, by e-mail and in audioweb conferences.
Completed
Evaluation of test results
Support in evaluation of aerodynamic drag test (VECTO Air Drag); calculation of the engine input data (VECTO Engine), evaluation of the validation test (EPTP) and other evaluation tasks were provided (see tasks B and C).
Activities are to a large extent related to CITnet Jira requests if concerning the software while support in evaluation exercises is mainly given via phone and e-mail.
Completed
Provide training to end-users
Workshops for user support given are e.g.:
VECTO Air Drag on 23.04.2015
VECTO general 29/30.06.2015
VECTO Buses and Coaches 12.09.2016
Ex-Post Validation 14.12.2015
VECTO PTO 18.01.2017
The VECTO help desk is set up in CITnet Jira by JRC. TUG provided all user support forwarded by
Completed

Service contract CLIMA.C.2/SER/2012/0004 Draft final Report
12
Work to be performed Description Status
JRC from CITnet tickets
3.1.3 Task A.4: Consultation with stakeholders
Sub-task: A.4
Overview on content: Participation and organization of meetings with industry, member state authorities and NGOs to guarantee that all relevant stakeholders are adequately involved in the development process of the HDV-CO2 test procedure.
Work to be performed Description Status
Liaise with stakeholders TUG supported and participated in following number of meetings:
3 advisory board meetings
8 editing board meetings (budget from separate project) with manifold audioweb expert group meetings
10 meetings related to buses
5 N2/M2 meetings (4 as audioweb)
41 meetings on different topics (transmission, IT, etc.)
3 meetings related to Ex-Post Validation
31 Meetings within the expert groups for engine, air drag and auxiliaries
Completed
Participate in seminars and workshops
Preparation and organization of meetings
Participation in meetings

Service contract CLIMA.C.2/SER/2012/0004 Draft final Report
13
3.2 Task B.1: VECTO 2015 upgrades
Sub-task: B.1
Overview on content:
In B.1 all work necessary to finalise a first complete and robust VECTO version as basis for the legislative procedure was performed.
Work to be performed
Description Status
B.1-1: Complete the transmission
sub-model
The models for manual (MT) and automated transmission (AMT) implemented in VECTO have been adjusted according to feedback from the VECTO users and in agreement with ACEA and transmission suppliers.
Several versions of automatic transmission (AT) models for trucks and buses were released and tested The actual version was finally calibrated by TUG and released in July 2017.
Main issue was to reach a correct ranking between different transmission systems. TUG collected all available test data and further developed the AT model in VECTO based on this data. The actual physical AT model already reflects real ranking between the transmission systems. For buses validation tests by industry are ongoing and may show further demand for adjustments related to the generic gear shift strategy. The development of one generic model which works for all possible vehicle configurations sufficiently accurate to meet the real world ranking between different gear box models in all cases with almost no deviation proved to be a very demanding task. Since a few percent inaccuracy can already change the ranking between gear box models and thus would distort competition, industry is requesting a high accuracy in this field.
Completed as planned.
Adjustments of gear shift logics under discussion in industry
B.1-2: Complete the air drag test
definition
The technical annex for the air drag test is finalised describing the test procedure and evaluation methods.
Completed
B.1-3: Complete the calculation tool of air drag
(CSE) and fully integrate the
CSE tool within VECTO family
The VECTO-CSE tool is finalised. VECTO-CSE was renamed into “VECTO Air Drag” to fit into the VECTO family name concept.
Completed

Service contract CLIMA.C.2/SER/2012/0004 Draft final Report
14
Work to be performed
Description Status
B.1-4: Review and validate
HDV mission cycles
The review and validation of the HDV mission cycles was performed for all cycles which were elaborated and distributed by ACEA until the end of SR7. Amendments in the VECTO cycles proposed by Heinz Steven based on the review were implemented. Furthermore the Municipal cycle was updated to be compatible with the provisions of the DIN SPEC 30752-1 [6]. The actual versions of the cycles are agreed between industry and the LOT 4 consortium.
For the urban delivery cycle as well as the construction cycle ACEA will provide a proposal for new cycles based on new measurements and analysis. A validation of these cycles was not possible within the actual project since the cycles are yet not available.
Completed as planned.
ACEA may want to update the urban delivery and construction cycle
B.1-5: Carry out relevant tests in cooperation with OEMs and JRC
Vehicle testing at TUG concentrated on development and validation of different options for the Ex Post Validation test. Measurements on a Daimler and on a Scania truck have been performed on the chassis dynamometer at TUG.
Completed
B.1-6: Develop tools upon
request to cover other
input/output data analysis
and treatment
Following tools have been further developed in the actual project:
1) “VECTO Engine” tool for evaluation of the engine test procedure
2) “VECTO Air Drag” for air drag test evaluation.
3) A “EPTP” calculation routine in VECTO (“Pwheel mode”) for the validation test procedure.
Completed
B.1-7: Address open issues
related to the simulation of
bus auxiliaries
The bus auxiliary sub-model from the Ricardo project was transferred to the VECTO version 3.1 and obvious bugs in the sub-model were eliminated. The sub-model was kept running in all further VECTO releases. Since the input data structure elaborated in the Ricardo project seems to be complicated for a certification process, further efforts may be necessary on this topic before a CO2 certification for buses is introduced. Feedback on this topic is available from the bus board meeting on 29
th June 2017.
Completed as planned.
Amendments may be necessary in course of introducing hybrid drive trains in VECTO.
B1.8: Finalise the version
VECTO to be used as the
backbone for the Pilot phase 1 and the HDV CO2 emissions
certification legislation
The VECTO release version to be used in the pilot phase was finalised in 2015. Further improvements and refactoring of VECTO was an ongoing process until the end of SR7 in July 2017.
Completed
Output Deliverables
B.1-1 Final LOT 4 releases of the VECTO software (VECTO 3.2) (including VECTO Air Drag and VECTO Engine)
B.1-2 User manual for VECTO (delivered as html together with the VECTO software)

Service contract CLIMA.C.2/SER/2012/0004 Draft final Report
15
B.1-3 Set of CO2 test cycles and of generic input data necessary to run VECTO in the certification mode (included VECTO 3.2).
B.1-4 Set of generic HDV as VECTO input data as basis for testing future software updates (included VECTO 3.2 package)
B.1-5 User manual for VECTO Air Drag (delivered as pdf together with the software)
B.1-6 User manual for VECTO Engine (delivered as pdf together with the software)
3.3 Task B.2: Review and amend engine map calculation approach
Sub-task: B.2
Overview on content: An amendment for the engine test procedure was elaborated including improved accuracy requirements for fuel flow, torque and engine speed in engine tests for the fuel map test and for the WHTC test.
Work to be performed Description Status
B.2-1: Analysis of measurement equipment
accuracies
Final requirements on equipment accuracy have been defined in the corresponding technical annex. Major improvements were achieved against the requirements defined in the EURO VI legislation
Completed
B.2-2: Corrections regarding variable carbon
content in fuel
The method for the correction is elaborated and defined in the technical annex. The VECTO engine software can handle input on test fuel properties and correct for “standard fuel properties”. The correction is applicable for all test fuels except Diesel. For Diesel fuel it was concluded that the fuel analysis shows the same range of uncertainty compare to the spread in fuel specifications. Hence at the moment no correction for actual test fuel properties is applicable for Diesel. However, test fuel properties have to be reported in the certification documents.
Completed
B.2-3: Legislative implementation and
impacts
The technical annex for the engine test procedure is finalised. The elaboration of a commonly agreed process took longer than expected due to different preferences on many details from the single OEMs.
Completed
Option: B.2.4: Engine testing
No need for engine testing identified during the entire project.
Output Deliverables
B-2 Technical annex on engine testing and VECTO Engine

Service contract CLIMA.C.2/SER/2012/0004 Draft final Report
16
3.4 Task B.3: Verification/Validation: finalise the procedure
Sub-task: B.3
Overview on content:
Finalisation of the procedure for Verification and Validation (VV) of VECTO CO2 results including performing tests and implementing the routine in VECTO.
Work to be performed
Description Status
B.3-1: Review the proposed Lot3 VV
procedure
Based on a review on the method tested in LOT 3 (a constant speed test called “SiCo”) in the LOT 4 board it was concluded that the VECTO input data shall be made available for recalculation of the EPTP. Thus VECTO was adjusted not to calculate the SiCo results ex ante but ex post what allowed more complex test sequences.
Completed
B.3-2: Carry out targeted tests
required
Tests on 2 trucks have been performed on chassis dynamometers at TUG. Measurement equipment included beside standard on-board data also the torque measurement at the wheel rim. Further tests are carried out at OEMs and at JRC based on the proposal elaborated in B.3-3.
Completed
B.3-3: Make the necessary
adjustments in the procedure and
tests
After analysis of vehicle tests at TUG and JRC in transient cycles, the focus was put on real world transient test procedures on the road or on a chassis dyno (both options work similar and could be allowed). A draft for a technical annex was elaborated for the EPTP validation test and was released in January 2017. One iteration round with industry and stakeholder was made to collect comments and to adjust the procedure.
The OEMs are testing the procedure and shall give feedback in autumn 2017. Main issues under discussion are the tolerances to be allowed and boundaries for the driving conditions.
Completed from TUG. ACEA yet did not perform pilot phase tests until September 2017.
B.3-4: Develop a software tool for
the ex-post validation
VECTO includes now a functionality to calculate the fuel consumption based on wheel torque and speed measured during the EPTP (“Pwheel mode”). Demand for further amendments may be identified after feedback from the pilot phase from OEMs.
Completed
B.3-5: Produce/update
all relevant supporting
material, test-data and results
The VECTO results, the measurement data and the deviations between VECTO and measurements were collected and analysed systematically to identify the best test procedure and to have a data base to make an assessment of the possible accuracy of a test for the definition of thresholds for valid test results.
Completed
B.3-6: Propose a final procedure and integrate it into the overall
certification procedure
Based on all findings in tasks B.3-1 to B.3-5 the EPTP was updated and corresponding thresholds for deviations were proposed.
Completed as planned.
Methods still under discussion in industry.

Service contract CLIMA.C.2/SER/2012/0004 Draft final Report
17
Output Deliverables
B-3.1 Update of VECTO including the simulation of the EPTP (covered by actual VECTO 3.2 release)
B-3.2 Description of the test procedure and of validation results (chapter 4.4)
B-3.3 Draft technical annex for the Ex Post validation (delivered to COM as separate document).
3.5 Task B.4: VECTO 2015 upgrades: finalise the Technical annex
Sub-task: B.4
Overview on content:
Finalisation of the definition of components testing, of input values, and elaboration of the necessary generic input values for running the certification tool including the findings of tasks B.1 to B.3.
Work to be performed
Description Status
Updates related to open issues from
Lot 3
Finalised for all component tests and adopted by TCMV on 11
th of May 2017
Completed
Verification/Validation Procedure
Technical annex available as basis for a test phase. The test phase was initiated by OEMs.
Completed
Conformity of Production
The elaboration of methods for CoP testing as well as the related tolerances has been supported by providing technical and statistical analyses. The final provisions are included in the technical annexes
Completed
Output Deliverables
B-4 Updated technical annex delivered to COM
3.6 Task B.5: Multistage vehicles: second stage certification procedure
Sub-task: B.5
Overview on content: Elaboration of a simple method to customise values certified with the standard bodies or trailers to specific vehicles.
Liaise with the SR4 contractors to assess and fine-tune a possible optional second stage certification for multi-stage vehicles.

Service contract CLIMA.C.2/SER/2012/0004 Draft final Report
18
Work to be performed Description Status
B.5-1: Prepare and define tables as a
standard VECTO output, to be used by
body/trailer manufacturers to
customise certified values to their specific
vehicles
Examples for standard look up tables for two vehicle categories have been prepared and forwarded to CLCCR.
CLCCR is working on a CFD tool which shall be used to simulate changes in the air drag from alternative bodies against the standard bodies. Simulation is assumed to be the more cost efficient solution if a standardised tool and standard-truck and trailer models can be used by all body builders. The change in air drag, the mass and on case of trailers the tire RRC values could then be input into the look up table or into a specific VECTO application.
Further activities are postponed until the feasibility of the CFD approach is known.
Look up tables completed. Further activities postponed.
B.5-2: Liaise with SR4 contractors (Editing
board) to assess and fine-tune a possible
optional second stage certification for multi-
stage vehicles
See B.5-1: Further activities of the SR7 consortium have been postponed until the feasibility of the CFD approach is known.
In addition to the existing representative loading for each HDV group also the representative volume for cargo in each group was elaborated for the standard bodies and trailers as basis for providing the results also as gCO2/m³-km.
Deferred, unclear if needed.
Output Deliverables
B-5 Examples for look up tables to define effects of bodies and trailers on the fuel consumption delivered to CLCCR
3.7 Task B.6: Demonstration test campaign
Sub-task: B.6
Overview on content: Organisation of and participation on demonstration campaign related to the complete certification procedure incl. testing, simulation and reporting.
Work to be performed
Description Status
B.6-1: Organisation The demonstration test campaign was organised with all main OEMs as well as a number of Type-Approval Authorities and Technical Services participating.
TUG collected all feedback on issues with test procedures, simulation and responsibilities. Based on this list the pilots of each expert group (engine, air drag, transmission, axle, tyres, general) amended the technical annexes. TUG amended the VECTO source codes to eliminate reported bugs etc.
Completed
B-6-2: Participation
B.6-3: Documentation and Communication

Service contract CLIMA.C.2/SER/2012/0004 Draft final Report
19
Output Deliverables
B-6
Presentations and minutes from the Workshop on 23.03.2016: (TUG_LOT4_2016_03_23.pptx and Collection_Feed_Back_Pilot_Phase_1_2016_02_09.xlsx).
All input led to the final versions of the technical annexes and of the VECTO software.
3.8 Task C.1: Validate the outcome of the current "auxiliaries" SR3 project
Sub-task: C.1
Overview on content: Plan and perform test campaign to validate the new VECTO version for buses, test SR3 auxiliary methods also for other HDV classes; add software test cases for new auxiliary routines.
Work to be performed Description Status
C.1-1: Coordinate a test campaign to validate the
new version of VECTO with integrated
auxiliaries for all relevant categories of
HDVs
Testing for buses was planned for 2015 and for the pre-pilot phase in 2017. The auxiliary simulation tool from Ricardo was implemented into VECTO. A guideline was elaborated for component and vehicle test activities as well as for corresponding simulation with VECTO as basis for a coordinated test campaign.
Completed
C.1-2: Add software Test Cases with the
results from C.1-1
The auxiliary routines are included since VECTO 3.1 with the test cases from Ricardo. Results from C.1-1 were not provided by industry and cannot be used for test cases yet,
Completed
C.1-3: Address any shortcomings and introduce software
upgrades on the auxiliaries in VECTO
The auxiliary tool from Ricardo was tested and bugs were eliminated in cooperation with JRC and Ricardo. The code is running now and it provides results which have been checked by JRC.
Further feedback may be provided by industry based on the pre-pilot phase later in 2017.
Completed
C.1-4: Analyse the applicability of the
methods to simulate mild-hybrids and of
auxiliary components and technologies which
may be of interest for future applications.
Analysis showed, that the options may work for mild hybrids (brake energy recuperation by the alternators) but this depends on the way how the different hybrid architectures will be considered in the future CO2 certification.
For full hybrids the auxiliary software tool may not work properly if the HEV simulation is included in VECTO. A detailed analysis of possible issues is provided in a parallel project
1
Completed
1 CLIMA.C.4/ETU/2016/0005LV; Feasibility assessment regarding the development of VECTO for hybrid
heavy-duty vehicles

Service contract CLIMA.C.2/SER/2012/0004 Draft final Report
20
Output Deliverables
C-1.1 The actual VECTO version 3.2 includes the bus auxiliary tool. A set of bus input data was elaborated by TUG.
3.9 Task C.2: Buses and coaches
Sub-task: C.2
Overview on content: Prepare the ground for the inclusion of buses within the certification legislation at a later stage: validation of VECTO methods for buses and coaches (in cooperation with C.1), prepare the technical annex and a VECTO user guide for bus application.
Work to be performed Description Status
C.2-1: Validate results of C.1 through testing of buses and coaches in
cooperation with OEMs, Member State
authorities and NGOS.
Test activities shall be combined with C.1-1
The pre-pilot phase was designed and coordinated for buses and coaches. The pre-pilot phase covers component testing and VECTO simulation as planned in certification but does not involve type approval authorities and technical services. Additional vehicle tests are made as basis for the comparison between measured and simulated data. A final pilot phase was postponed since time for testing after finalisation of methods was too short for industry. Methods were discussed and amended until end of the project.
Completed 50%
C.2-2: Prepare complementary
technical handbooks and annexes for
subsequent legislative
amendments
A description of the procedures as well a baseline set of generic VECTO parameters for the pre-pilot phase have been elaborated.
Completed
Output Deliverables
C-2.1 VECTO update including bus auxiliaries and document describing test and simulation conditions for buses and coaches as basis for the pre-pilot phase.
3.10 Task C.3: VECTO for intermediate-size vehicles
Sub-task: C.3
Overview on content: Elaborate necessary adjustments in VECTO and in the corresponding methodologies to include M2 and N2 vehicles in the HDV CO2 legislation.
Work to be performed
Description Status
C.3-1: Consultation of manufacturers of
M2-N2 vehicles
5 meetings have been held on the N2/M2 topic with the stakeholders. 3 of them were WebEx meetings.
Completed

Service contract CLIMA.C.2/SER/2012/0004 Draft final Report
21
Work to be performed
Description Status
C.3-2: assessment of the accuracy of
VECTO, and possible
adjustments needed
Several N2/M2 vehicles have been simulated by TUG with VECTO for this task. A comparison of VECTO CO2-cycles, real world driving data of N2 vehicles and the WLTC was performed. As a result the WLTC seems not to be representative for N2/M2 mission profiles.
For the heavier N2/M2 the VECTO cycles seem to be representative and the VECTO methods can be applied from a physical point of view.
An open issue for a political decision is, how N2 vehicles below approx. 5.5 ton mass shall be handled, since a part of these vehicles can be certified for pollutant emissions according to WLTP as well as to the HDV engine certification procedure.
The different structure of OEMs and multistage vehicle shares compared to N3/M3 vehicles however, needs political discussions and decisions to define the next steps to be taken.
No final assessment of the accuracy of VECTO for N2 and M2 was possible since no complete data set for validation was available. Expert discussions suggest similar accuracy as for N3 and M3.
Completed 70%
C.3-3: if relevant, develop new
physical component models for VECTO
No extra demand for component models or test procedures identified yet.
No need identified yet
C.3-4:
Not relevant without , decisions on the basic procedures to handle small N2/M2 in WLTP and multistage vehicles in general.
Deferred C.3-5:
C.3-6:
Output Deliverables
C-3.1 VECTO update (VECTO 3.2 can handle N2 and M2 and was used for corresponding simulations at TUG)
3.11 Task C.4: Vehicles not covered in LOT3 and LOT4
Sub-task: C.4
Overview on content:
Analysis of demands and of options to include additional vehicle categories into the HDV CO2 test procedure.
Work to be performed
Description Status
Analysis of the relevance of vehicles not covered
Refuse trucks have small contribution to the overall CO2 emissions from HDV but information on their fuel efficiency is relevant for (public) call for tenders.
Completed
Service contract CLIMA.C.2/SER/2012/0004 Draft final Report
22
Work to be performed
Description Status
The option to simulate refuse trucks is now included in VECTO. In cooperation with industry basics for a standard to simulate fuel consumption and CO2-emissions with VECTO for specific refuse truck bodies and PTO components was elaborated.
Recommendations to the Commission
HDV classes not to be considered in the first step of the CO2 legislation are defined. A discussion on possible inclusions is given in chapter 5.
Completed
Output Deliverables
C-4 VECTO release 3.2 and final report
3.12 Task C.5: Make existing VECTO code testable, provide test cases
Sub-task: C.5
Overview on content: This task includes VECTO modifications in order to increase modularity, testability and more suitable for further possible upgrades.
Work to be performed Description Status
C.5 VECTO 3.2 fulfils requirements defined in C.5 Completed
3.13 Task C.6: Organisation - participation in demonstration test campaign
Sub-task: C.6
Overview on content: Carry out a pilot phase of VECTO with TAAs and TSs, OEMs, supply industry and NGOs (continuation of task B.6).
Work to be performed Description Status
C.6-1: Organisation
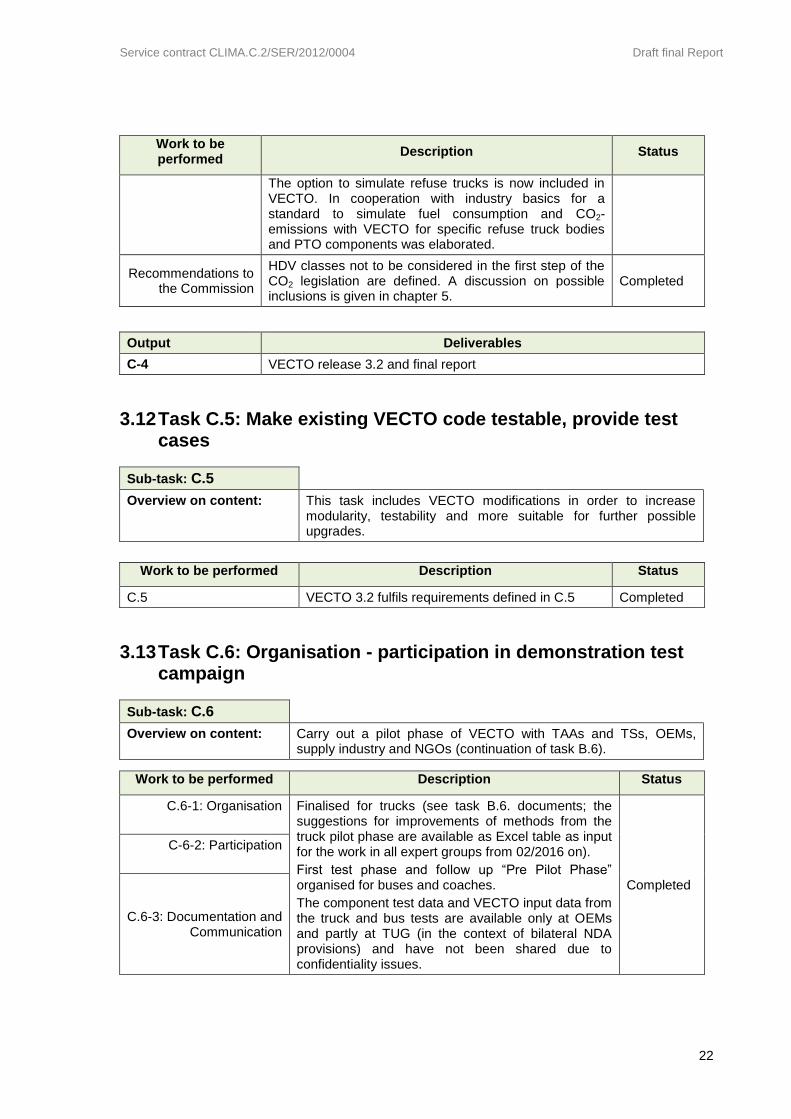
Finalised for trucks (see task B.6. documents; the suggestions for improvements of methods from the truck pilot phase are available as Excel table as input for the work in all expert groups from 02/2016 on).
First test phase and follow up “Pre Pilot Phase” organised for buses and coaches.
The component test data and VECTO input data from the truck and bus tests are available only at OEMs and partly at TUG (in the context of bilateral NDA provisions) and have not been shared due to confidentiality issues.
Completed
C-6-2: Participation
C.6-3: Documentation and Communication

Service contract CLIMA.C.2/SER/2012/0004 Draft final Report
23
3.14 Task C.7: Prepare guidelines for overhauling VECTO as a forward looking tool, using a vector-capable language
Sub-task: C.7
Overview on content: Review the code and propose guidelines for a future overhaul of the software.
Work to be performed
Description Status
C.7-1: Review of the actual VECTO
The review resulted in re-programming of the VECTO tool in 2014 and 2015 to fulfil all demands defined in tasks A, B and C. Further improvements lead to the actual VECTO 3.2 version. The VECTO structure was kept as “mainly backward simulation” with switches to forward simulation where necessary (e.g. coasting). The demands for robustness and computation time seemed not to be possible with a forward looking model at current state of art.
Completed
C.7-2: Assessment of future features of
VECTO
Features listed in the contract were analysed and - were possible and relevant for the first phase of CO2 certification - also introduced:
o Interface with automatic input creation tool: An API for managing data exchange between data base systems and VECTO was elaborated. This includes also clear input-output data handling.
o Improvements of the GUI and batch functionality (via command line application) were implemented
o Webservers possibilities are not implemented since the data security seemed to be critical and costs of such a solution would be high.
o The methods for error handling were improved and the method for simulation tool version management was defined
o Standard data formats are used
The corresponding features are described in chapter 4.3 of this report.
Completed

Service contract CLIMA.C.2/SER/2012/0004 Draft final Report
24
4 Description of methodologies
This chapter shall give a complete picture on the methodologies applied in the “VECTO approach” for simulation of fuel consumption and CO2-emissions of heavy duty vehicles in operation conditions representative for the European fleet. Focus of the description is set on the final status as elaborated by the end of the SR7 contract and as reflected in the technical annex as adopted by TCMV on the 11th of May 2017. Further information can be found in the presentations and minutes as distributed during the course of the SR7 project.
4.1 Introduction
The VECTO approach consists of the main elements:
1) component test procedures for the main relevant fuel efficiency components: engine, transmission and other torque transmitting components, axle, air drag and tyres,
2) standardised pre-processing tools for the evaluation of the engine component test (“VECTO Engine”) and for the constant speed test applied for the determination of air drag (“VECTO Air Drag”),
3) The simulation tool VECTO itself with its methods and embedded “generic” data on representative mission profiles, payloads, driver behaviour etc.,
4) The implementation of the methods 1) to 3) in the regulatory framework.
These main elements are described in the sections below.
4.2 Component test procedures
The methods for component test procedures have been matured during the SR7 project based on the experiences gained in the 2015 pilot phase and the extensive discussions in the various expert groups. The related regulatory provisions have been finalised starting from the draft technical annex as available after the LOT3 project to its actual version at the end of SR7.
4.2.1 Engine Test procedure
The engine test procedure determines the maximum power capabilities of the engine, the motoring torque necessary to drag the engine at a certain rotational speed and the fuel consumed by the engine when running at defined operation points. Since the fuel map to characterise the fuel consumption of the engine is determined at steady state operation, there is a set of correction factors used in addition to the map to consider the effect of transient operation on the fuel consumption. To produce all the necessary data, the following testruns are performed by the engine:
Service contract CLIMA.C.2/SER/2012/0004 Draft final Report
25
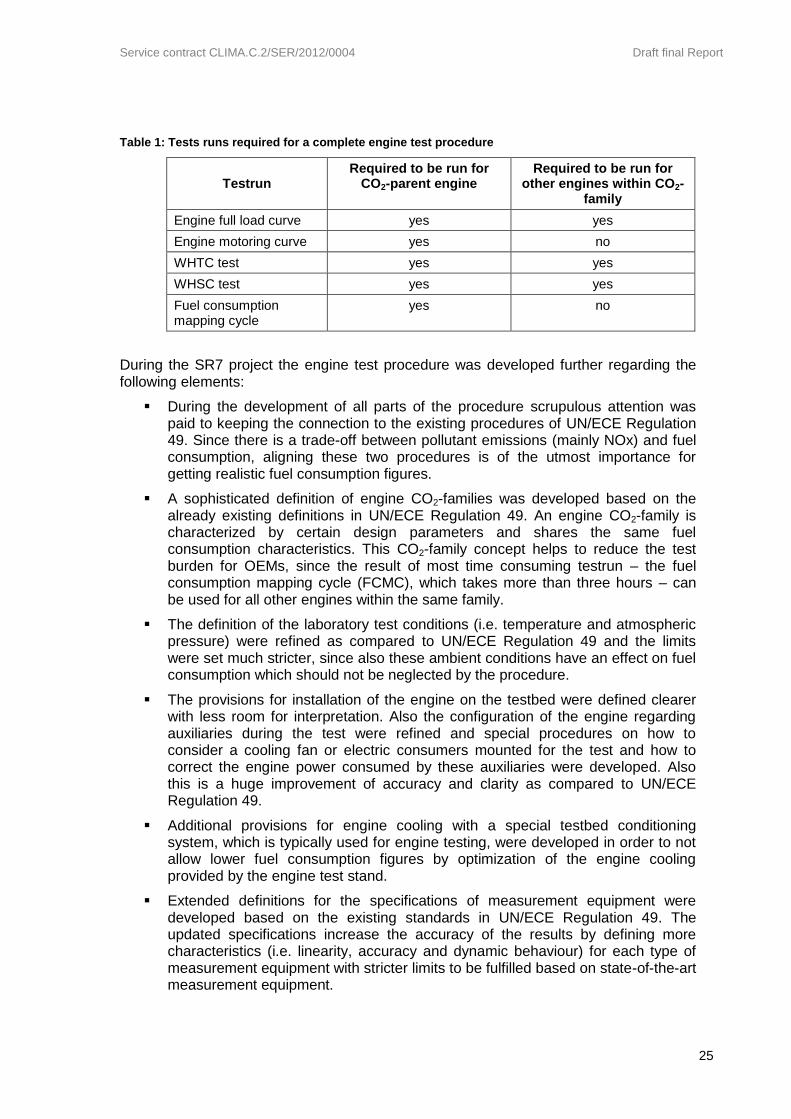
Table 1: Tests runs required for a complete engine test procedure
Testrun Required to be run for
CO2-parent engine Required to be run for
other engines within CO2-family
Engine full load curve yes yes
Engine motoring curve yes no
WHTC test yes yes
WHSC test yes yes
Fuel consumption mapping cycle
yes no
During the SR7 project the engine test procedure was developed further regarding the following elements:
During the development of all parts of the procedure scrupulous attention was paid to keeping the connection to the existing procedures of UN/ECE Regulation 49. Since there is a trade-off between pollutant emissions (mainly NOx) and fuel consumption, aligning these two procedures is of the utmost importance for getting realistic fuel consumption figures.
A sophisticated definition of engine CO2-families was developed based on the already existing definitions in UN/ECE Regulation 49. An engine CO2-family is characterized by certain design parameters and shares the same fuel consumption characteristics. This CO2-family concept helps to reduce the test burden for OEMs, since the result of most time consuming testrun – the fuel consumption mapping cycle (FCMC), which takes more than three hours – can be used for all other engines within the same family.
The definition of the laboratory test conditions (i.e. temperature and atmospheric pressure) were refined as compared to UN/ECE Regulation 49 and the limits were set much stricter, since also these ambient conditions have an effect on fuel consumption which should not be neglected by the procedure.
The provisions for installation of the engine on the testbed were defined clearer with less room for interpretation. Also the configuration of the engine regarding auxiliaries during the test were refined and special procedures on how to consider a cooling fan or electric consumers mounted for the test and how to correct the engine power consumed by these auxiliaries were developed. Also this is a huge improvement of accuracy and clarity as compared to UN/ECE Regulation 49.
Additional provisions for engine cooling with a special testbed conditioning system, which is typically used for engine testing, were developed in order to not allow lower fuel consumption figures by optimization of the engine cooling provided by the engine test stand.
Extended definitions for the specifications of measurement equipment were developed based on the existing standards in UN/ECE Regulation 49. The updated specifications increase the accuracy of the results by defining more characteristics (i.e. linearity, accuracy and dynamic behaviour) for each type of measurement equipment with stricter limits to be fulfilled based on state-of-the-art measurement equipment.
Service contract CLIMA.C.2/SER/2012/0004 Draft final Report
26
Standards for determining the net calorific value (NCV) of test fuels by testing of a fuel sample were elaborated as well as the corresponding standard NCV figures for each type of reference fuel used for testing. Based on these standards the test results are corrected to the standard values of the reference fuels (except for Diesel fuel)2 in order to prohibit the use of optimised fuels in the certification.
The test procedure for the FCMC was significantly improved by:
o Adding specific provisions for handling of interruptions during the test
o Adding specific provisions for preconditioning the engine system for the cycle
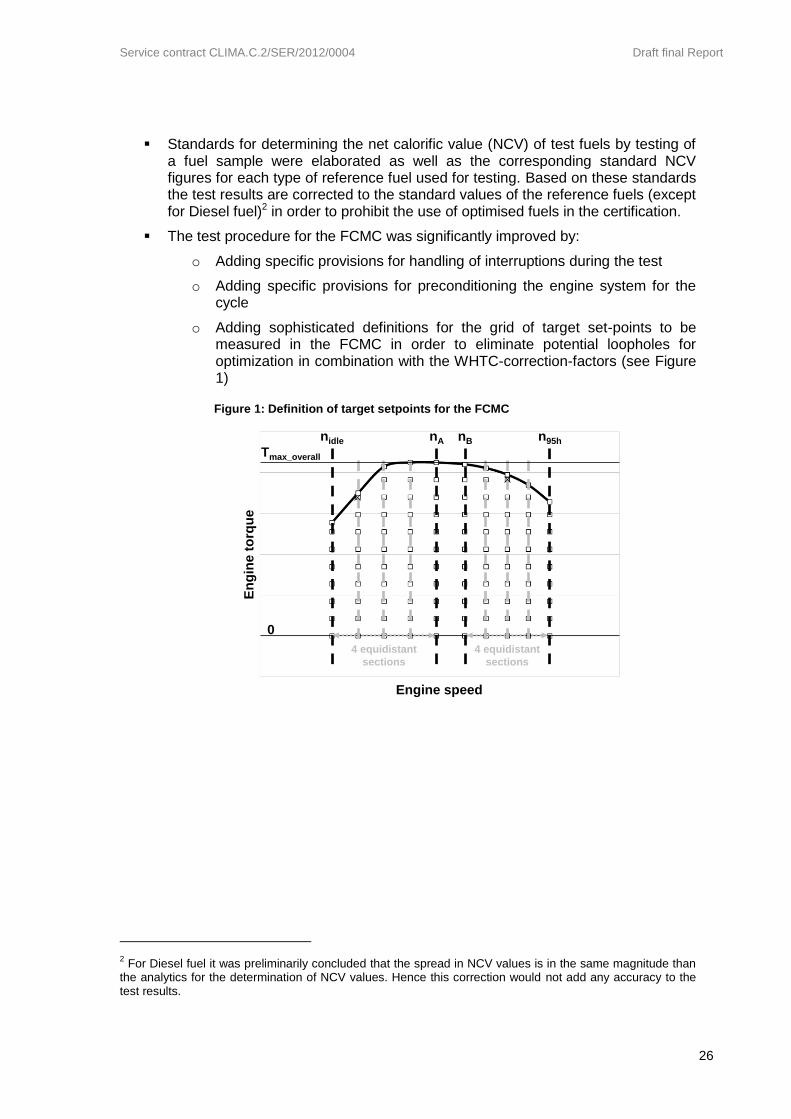
o Adding sophisticated definitions for the grid of target set-points to be measured in the FCMC in order to eliminate potential loopholes for optimization in combination with the WHTC-correction-factors (see Figure 1)
Figure 1: Definition of target setpoints for the FCMC
2 For Diesel fuel it was preliminarily concluded that the spread in NCV values is in the same magnitude than
the analytics for the determination of NCV values. Hence this correction would not add any accuracy to the test results.
nidle n95hnA nB
4 equidistant
sections
4 equidistant
sections
En
gin
e t
orq
ue
0
Tmax_overall
Engine speed

Service contract CLIMA.C.2/SER/2012/0004 Draft final Report
27
o Implementing a procedure for emission monitoring during the recording of the fuel consumption values. Therefore the specific mass emissions (grams per kWh engine work) are evaluated for specific grid cells in a control area defined based on the Not-To-Exceed provisions in UN/ECE Regulation 49. Figure 2 shows the definitions of the grid cells used for emission monitoring.
Figure 2: Definitions of grid cells in the control area
Also exact definitions on how to calculate both, fuel consumption over a test cycle as well as engine work over a test cycle were introduced, which are not available in UN/ECE Regulation 49. These definitions are needed for the exact and comparable calculation of specific fuel consumption figures used for determination of the correction factors as well as for the limit value in the COP procedure.
Specific correction factors (WHTC-correction-factor, Cold-Hot-Balancing-Factor) for each single engine are determined from the WHTC testruns performed. These correction factors are applied to the base fuel consumption values in the fuel map in order to better represent the effect of dynamic operation on fuel consumption as well as balancing different parameterization of the engine controls between the coldstart and hotstart WHTC cycle. The Cold-Hot-Balancing-Factor is not aiming to depict additional fuel consumption for a coldstart test, but rather closing the loophole of optimizing the fuel consumption for the hotstart test by raising it in the coldstart test to still be able to keep the emissions below the defined limits. In addition a correction factor for engines equipped with exhaust after-treatment systems that are regenerated on a periodic basis was introduced to consider the extra amount of fuel consumption for periodic regeneration of the DPF.
Provisions for COP testing were developed, where the amount of test runs to be performed is not depending on the actual definition of CO2-families of an OEM. This neutral approach does neither penalize OEMs that define rather small families nor the ones defining large families, since both would need to perform the same number of engine tests if they produce a similar number of engines per year. Again the connection to emission testing was kept, by applying the applicable emission limits and using the same concept for passing or failing a test
n30
En
gin
e t
orq
ue
0
Tmax_overall
Engine speed
nhi
original full load curve
of CO2-parent engine
upper boundary
(defined by increased
full load curve)
lower boundary
(based on full load
curve of lowest rating in
CO2-family)
1/3 1/3 1/3
1/3
1/3
1/3

Service contract CLIMA.C.2/SER/2012/0004 Draft final Report
28
based on a refined statistic approach. Furthermore, intensive analyses were performed to derive reasonable limit values for COP balanced for both, OEMs and legislator.
The main goals for all the improvements listed above were to increase the accuracy, repeatability and reproducibility of the test procedure, to improve the practical applicability on the testbed and to close loop-holes which could potentially be used in the context of vehicle certification.
4.2.2 Engine Pre-processing tool
The VECTO Engine pre-processing tool is mandatory to be applied to calculate the engine input data required for VECTO based on the data determined during the engine test. The tool was significantly improved and extended during the course of the SR7 project. The main updates are related to the following features:
Ongoing modifications over the project timeline necessary to ensure full compatibility with the latest version of the engine test procedure as described in the technical annex
Development of a more user-friendly version and consideration of specific issues for practical applicability in the process of engine certification
Automatic checks of all requirements for input data according to the definitions in the technical annex
Standardized extrapolation of the fuel map in order to cover “knees” of the engine full-load curve located between two target set-points for the engine speed
Standardized simulation of the WHTC engine cycle for calculation of the WHTC-correction-factors
Standardized calculation of Cold-Hot-Balancing-Factor
Standardized correction of the fuel consumption figures in the map towards standard NCV of the test fuel to eliminate the effect of variation in NCV within the specification for reference fuels
Conversion of the engine full-load and motoring curve to a lower logging frequency as required by VECTO
Figure 3 shows the graphical user interface (GUI) of the VECTO Engine pre-processing tool.

Service contract CLIMA.C.2/SER/2012/0004 Draft final Report
29
Figure 3: GUI of VECTO Engine pre-processing tool
4.2.3 Air drag test procedure
In the VECTO approach the vehicle’s air drag characteristics is determined using the constant speed test procedure. Scope of the methodology is to determine the aerodynamic drag of the vehicle given by the product of air drag coefficient (Cd) with the frontal area (Afr) of the vehicle at zero-wind conditions (yaw angle β=0).
To achieve this, the wheel torque of the driven wheels, the vehicle velocity, the actual air flow velocity (vehicle velocity plus wind) and the air flow direction are measured synchronously over straight motion on a test track. Measurements are performed at two different constant vehicle speeds (“low speed” and “high speed”) under defined conditions. The low speed test is performed with a target velocity in the range of 10 to 15 km/h while the high speed test is performed between 85 and 95 km/h. In case a vehicle cannot achieve the foreseen high speed, the maximum achievable vehicle speed with a certain tolerance is applied.
Service contract CLIMA.C.2/SER/2012/0004 Draft final Report
30
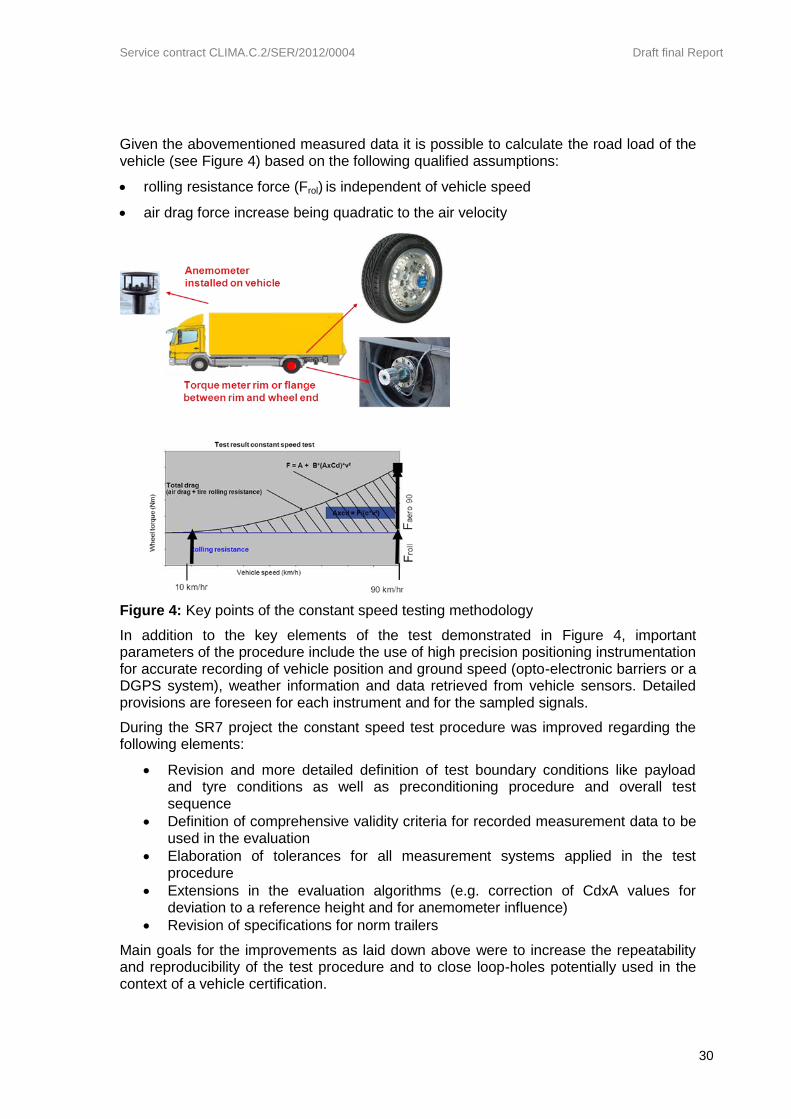
Given the abovementioned measured data it is possible to calculate the road load of the vehicle (see Figure 4) based on the following qualified assumptions:
rolling resistance force (Frol) is independent of vehicle speed
air drag force increase being quadratic to the air velocity
Figure 4: Key points of the constant speed testing methodology
In addition to the key elements of the test demonstrated in Figure 4, important parameters of the procedure include the use of high precision positioning instrumentation for accurate recording of vehicle position and ground speed (opto-electronic barriers or a DGPS system), weather information and data retrieved from vehicle sensors. Detailed provisions are foreseen for each instrument and for the sampled signals.
During the SR7 project the constant speed test procedure was improved regarding the following elements:
Revision and more detailed definition of test boundary conditions like payload and tyre conditions as well as preconditioning procedure and overall test sequence
Definition of comprehensive validity criteria for recorded measurement data to be used in the evaluation
Elaboration of tolerances for all measurement systems applied in the test procedure
Extensions in the evaluation algorithms (e.g. correction of CdxA values for deviation to a reference height and for anemometer influence)
Revision of specifications for norm trailers
Main goals for the improvements as laid down above were to increase the repeatability and reproducibility of the test procedure and to close loop-holes potentially used in the context of a vehicle certification.

Service contract CLIMA.C.2/SER/2012/0004 Draft final Report
31
One particular topic investigated during the course of the SR7 was the influence of specific characteristics of the test tyres regarding rolling resistance (influenced by on vehicle speed and ambient / ground temperatures) on the CdxA value as determined by the constant speed test procedure. This influence was investigated based on test drum data shared by tyre industry as well as by a series of test track tests performed by IPW on behalf of ACEA [5]. Main findings were:
In typical test conditions the tyre rolling resistance is about 15% lower in the low speed test compared to the high speed test (since the low speed is driven directly after the high speed, tire temperature and pressure are still on a high level but tire internal friction is lower due to the lower speed level)
If the CdxA values are determined based on the assumption on a speed independent rolling resistance, conservative CdxA values which are some 5% to 10% higher than evaluated with the known speed dependency are gained.
In test conditions with high tarmac temperatures (sunny conditions, >40°C surface temperature) the speed dependency of the rolling resistance changes to equal or higher rolling resistance in the low speed test compared to the high speed tests. This influence factor has a negative contribution to the repeatability and reproducibility of the constant speed test method.
After extensive discussions with industry the following decisions have been made for the actual version of the constant speed test procedure and the evaluation algorithms:
For valid tests the tarmac surface temperature is limited to a maximum of 40°C
The constant speed tests shall be evaluated based on the simplified assumption of a speed independent rolling resistance, as the influencing mechanisms are not fully understood and too less data from different tyres and test tracks is available to come up with a more detailed model. As already stated above this simplification in the test evaluation results in CdxA values which are some 5% to 10% higher than evaluated with the known speed dependency of the rolling resistance.
The prerequisites to introduce a more accurate method for test evaluation are already implemented in the VECTO Air Drag evaluation tool.3 This method can be easily incorporated into a later stage of legislation once more data on the speed dependency of the rolling resistance is available.
Data on constant speed tests performed multiple times with identical vehicles indicate a standard deviation of 2.5% for the repeatability of the test method. This value is compatible with the analysis performed by DG JRC which were however determined based on a preliminary version of the test procedure at the end of the LOT3 project.
A significant part of the SR7 work related to the air drag test procedure was dedicated to the elaboration of a family concept for CdxA values as well as to define the provisions for COP testing. Regarding the boundary conditions for the family concept, the “component air drag” is different to all other vehicle components, as from a pure scientifically point of view every single vehicle has its unique air drag characteristics. So the main focus in the
3 For the consideration of speed variability of the rolling resistance the gradient resistance has to be
subtracted from the total driving resistance in the low speed test. The according method is already implemented in VECTO Air Drag (option for “altitude correction”). Additionally the provisions how to determine the altitude profile of the test track are already specified in the technical annex.

Service contract CLIMA.C.2/SER/2012/0004 Draft final Report
32
elaboration of the family concept was to identify the main CdxA relevant vehicle characteristics, which shall also be the main field of aerodynamic optimisations in the future (cabin and roof geometry, special aerodynamic parts like spoilers, side panels etc.). Other vehicle parameters, which are less relevant for aerodynamic drag and/or mostly defined by the vehicle usage purpose like wheelbase, frame height or tires have been excluded from the family criteria to limit the test burden. The current family concept also bases on the fundamental principle that all certified CdxA values refer to standard body and trailer designs as exactly described in the HDV CO2 TA.
Also for provisions related to CoP testing air drag has a special status among all component tests. For the definition of the COP tolerance the crucial influence is the repeatability / reproducibility of the constant speed test procedure but not the production spread (quality issue). The final method for COP testing is based on repeating the full constant speed test procedure but with provisions to keep ambient conditions close to certification testing (to lower the uncertainty from the ambient conditions) and to apply a CoP tolerance of 3 time the assumed repeatability of the test procedure (3*2,5% = 7,5% CoP tolerance for CdxA).
4.2.4 Air drag pre-processing tool (“VECTO Air Drag”)
The VECTO Air Drag pre-processing tool, which is mandatory to be applied to calculate the CdxA value required for VECTO input based on the measurement data recorded during the constant speed test, was significantly improved and extended during the course of the SR7 project. The main updates are related to the following features:
Full compatibility with the latest version of the constant speed test procedure as described in the technical annex
Elaboration of a more user-friendly version including “direct start” option
Similar to VECTO, also VECTO Air Drag now provides the two modes “Declaration Mode” and “Engineering Mode”. In the “Declaration Mode” all evaluation settings and criteria for validity checks are fixed to the parameters as specified in the technical annex. Certified CdxA values shall only be calculated in this tool mode.4
Additionally an MS Excel pre-processing tool for generation of input data for VECTO Air Drag was elaborated. This pre-processing tool offers further features for visualisation of measurement data and performing pre-checks. This MS Excel tool is also distributed with the VECTO Air Drag code.
The VECTO Air Drag is extensively documented in a user manual.
4 In the SR9 Bridge contract it is planned to implement the hashing of VECTO input data into VECTO Air
Drag. This hashing functionality will only be available in the „Declaration Mode“ and if a valid CdxA values was calculated.
Service contract CLIMA.C.2/SER/2012/0004 Draft final Report
33
4.2.5 Transmission test procedure
The VECTO input data on transmission are the gear ratios, the loss maps (torque loss as a function of transmission input speed and input torque) as well as gear dependent input torque limits and input speed limits.
During the course of the SR7 project the three options defined for assessing the losses of transmissions as elaborated until the end of LOT3 in 2014 have been extensively refined. The calculation procedure for the standard torque loss values was separated from the testing procedure and has been moved to a separate appendix within the annex [1]. An additional procedure to determine the losses of a transmission has been defined within Option 2, which describes a combined procedure of loss measurement and interpolation.
Based on the work and feedback of the transmission expert group, the measurement procedures and calculations have been reworked and rendered more precisely.
• Option 1: Measurement of the torque independent losses, calculation of the torque dependent losses
A detailed description of the calculation of the torque dependent losses covering all different types of transmissions has been elaborated.
A concept for the consideration of the measurement uncertainty has been introduced.
The influence of smart lubrication systems and transmission unique electric auxiliaries has been taken into account.
• Option 2: Measurement of the torque independent losses, measurement of the torque loss at maximum torque and interpolation of the torque dependent losses based on a linear model
This procedure for the determination of the losses has been implemented as a well-balanced compromise between measurement effort and accuracy.
• Option 3: Measurement of the total torque loss
The most complex measurement procedure has been elaborated in more detail and the consideration of the measurement uncertainty and new technologies (e.g. smart lubrication systems) have been adopted.
In addition to the determination of transmission losses, separate methods describing the assessing of losses of torque converters, other torque transferring components (such as retarders) and additional driveline components (such as angle drives) have been elaborated and included into the technical annex.
The calculation procedures for the standard torque loss values for transmissions have been supplemented by calculated standard torque loss values for retarders, for geared angle drives and a generic torque converter model.
For transmissions there is no standardised evaluation tool for the generation of VECTO input data available. Hence the post-processing of test stand data as well as the generation of standard loss maps has to be performed by OEMs internal scripts.
4.2.6 Axle test procedure
In order to consider the torque losses from driven vehicle axles in terms of determination of their impact on the overall vehicle´s CO2 emission two options are available.

Service contract CLIMA.C.2/SER/2012/0004 Draft final Report
34
The first option does not require any physical test on an axle under laboratory conditions, but refers to generic values for a load depending efficiency and a low load considering the basic drag torque. These generic values were refined within SR7 and allocated to the specific axle categories in order to reflect the specific characteristics of single reduction (SR), single reduction tandem (SRT), single portal (SP), hub reduction (HR) or hub reduction tandem axles (HRT).
The final values assigned to the specific axle category were verified by physical testing by members of the expert group developing the axle data verifying procedure.
In order to incentivise component testing, the generic values are specified to have worse efficiencies compared to measured values from low efficient components.
The second option is based on a physical test, consisting of determining the difference between the output-torques of an axle by given input-torques. This test is conducted on one axle (parent axle) being representative for a certain group of axles (axle family). The definition of the axle family was simplified from former structuring into several sub-criteria. The parent axle is the one having the worst efficiency in accordance to its performance parameters.
The testing procedure was refined in terms of clear definitions for the testing conditions, the testing environment with its measurement accuracy and the measurement data post processing.
i. Testing conditions: The boundary conditions in terms of temperatures (axle´s oil and ambient air) were aligned to reasonable real live conditions, where upper limits were set in order to avoid too optimistic test results.
ii. Testing environment with measurement accuracy: The devices necessary for the test bench operation, like oil temperature conditioning systems, were described in terms of the installation and operating characteristics in order to provide realistic results.
iii. The test bench set-up was described in high detail to provide distinct conditions in order to avoid most of the parasitic forces influencing the torque measuring system. To consider the measurement uncertainty a calculation method was developed, counting in the effect of temperature, parasitic loads and calibration errors on the specific torque sensor signal. Depending of the test bench set-up and the installation of flexible coupling, different factors for the maximum influence of parasitic loads are applied.
iv. Measurement data post processing: A conversion method which will be applied to the measured torque map was developed in order to receive VECTO compatible data.
Similar to the situation for transmissions there is no standardised component test evaluation tool available for axles.

Service contract CLIMA.C.2/SER/2012/0004 Draft final Report
35
4.3 Software VECTO
4.3.1 Overview
VECTO is a tool for calculating the energy consumption and CO2 emissions of vehicles. It models the main CO2 relevant components of heavy-duty vehicles and simulates a virtual drive on different routes. In the course of SR7 the VECTO simulation tool has been significantly refactored from version 2.2 to version 3.2 as part of this project. The simulation core has been implemented from scratch in C# and the graphical user interface has been refactored to use the new simulation implementation. Individual modules are separated via interfaces to allow different implementations and exchanging modules. Moreover, the graphical user interface was separated from the simulation core. This allows integrating the simulation of heavy duty vehicles into automatized processes at the vehicle manufacturer. The basic simulation approach and functioning of VECTO was preserved and is described in more detail in the following sections.
4.3.2 Description
VECTO is a vehicle longitudinal dynamics simulation tool. The main energy consumption relevant powertrain components of heavy-duty vehicles are modelled in software and a virtual drive along on different routes is simulated. As a main principle the simulation follows the backward simulation approach. In the backward simulation the required engine speed and engine torque is computed from the given condition at the wheels, i.e., from speed and acceleration. The vehicle’s speed and acceleration is defined by the simulated driving cycle (target speed, road gradient) and the driver model (e.g. limiting the max. acceleration).
4.3.2.1 VECTO Software Modules and Architecture
The implementation of the VECTO simulation tool separates different concerns and splits it into separate components which interact via defined interfaces. The main modules are depicted in the following figure:
Figure 5: VECTO Software Modules
Service contract CLIMA.C.2/SER/2012/0004 Draft final Report
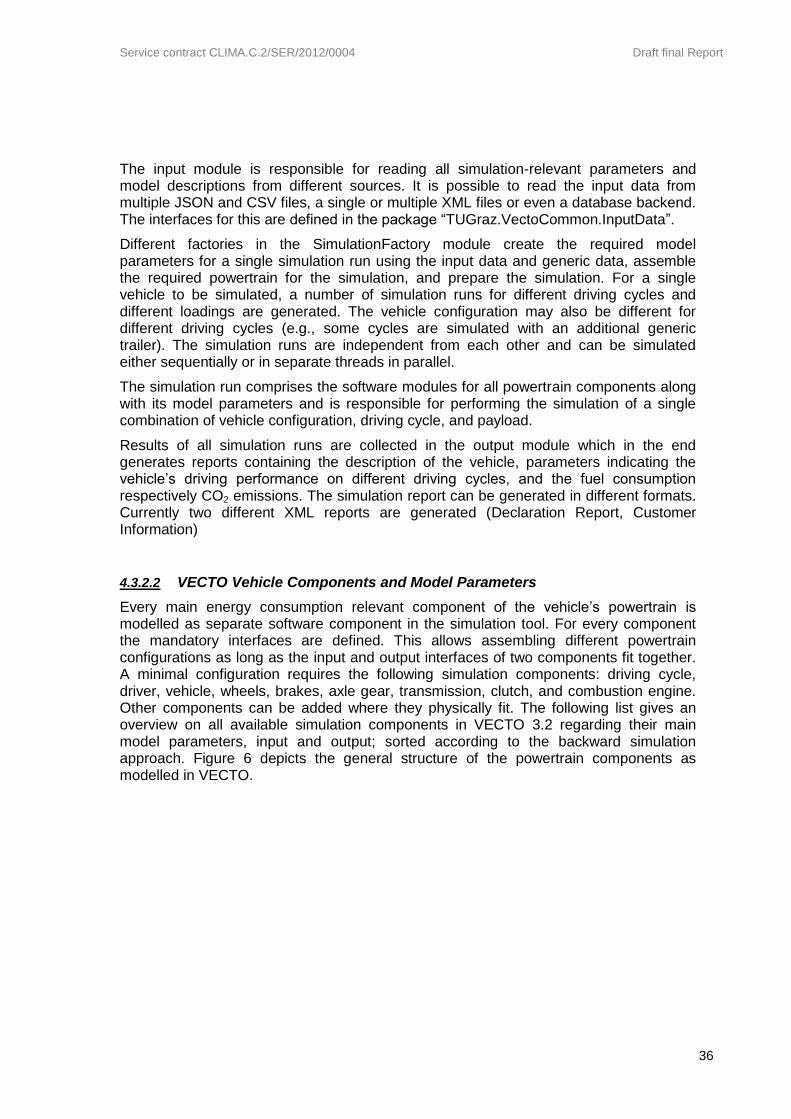
36
The input module is responsible for reading all simulation-relevant parameters and model descriptions from different sources. It is possible to read the input data from multiple JSON and CSV files, a single or multiple XML files or even a database backend. The interfaces for this are defined in the package “TUGraz.VectoCommon.InputData”.
Different factories in the SimulationFactory module create the required model parameters for a single simulation run using the input data and generic data, assemble the required powertrain for the simulation, and prepare the simulation. For a single vehicle to be simulated, a number of simulation runs for different driving cycles and different loadings are generated. The vehicle configuration may also be different for different driving cycles (e.g., some cycles are simulated with an additional generic trailer). The simulation runs are independent from each other and can be simulated either sequentially or in separate threads in parallel.
The simulation run comprises the software modules for all powertrain components along with its model parameters and is responsible for performing the simulation of a single combination of vehicle configuration, driving cycle, and payload.
Results of all simulation runs are collected in the output module which in the end generates reports containing the description of the vehicle, parameters indicating the vehicle’s driving performance on different driving cycles, and the fuel consumption respectively CO2 emissions. The simulation report can be generated in different formats. Currently two different XML reports are generated (Declaration Report, Customer Information)
4.3.2.2 VECTO Vehicle Components and Model Parameters
Every main energy consumption relevant component of the vehicle’s powertrain is modelled as separate software component in the simulation tool. For every component the mandatory interfaces are defined. This allows assembling different powertrain configurations as long as the input and output interfaces of two components fit together. A minimal configuration requires the following simulation components: driving cycle, driver, vehicle, wheels, brakes, axle gear, transmission, clutch, and combustion engine. Other components can be added where they physically fit. The following list gives an overview on all available simulation components in VECTO 3.2 regarding their main model parameters, input and output; sorted according to the backward simulation approach. Figure 6 depicts the general structure of the powertrain components as modelled in VECTO.

Service contract CLIMA.C.2/SER/2012/0004 Draft final Report
37
Figure 6: Powertrain Components Structure (Overview)
Every component has its internal model data, receives input parameters which are transformed according to the general model description and submits model data to the output (see Figure 7).5 Model parameters are e.g. measured loss-maps, fuel consumption maps, or generic values. Input parameters of a component e.g. are the power demand requested by the previous component, always represented as tuple, e.g., force and velocity, or torque and angular speed. This component-based representation of the powertrain allows assembling the simulation model in a modular way as long as the output of a component fits to the input of the next component.
Note, that due to the backward simulation approach, the “model input” is towards the “wheel side” while the “model output” is towards the “engine side”. The naming of the input and output parameters, however, is according to the direction of the power flow in normal driving conditions (engine providing positive propulsion). So for example the gearbox’ model input is ‘gearbox torque out’ and ‘gearbox angular speed out’, while the output parameters are ‘gearbox torque in’ and ‘gearbox angular speed in’. In addition to the specific input parameters listed in Table 2, the simulation time and the simulation interval are provided to each component.
Figure 7: Notation of a Simulation Component
5 Exceptions are the components “Driving Cycle”, which has no input because it is the first component, and
“Engine”, which is the last component.

Service contract CLIMA.C.2/SER/2012/0004 Draft final Report
38
Table 2: Model parameters and model input/output for all powertrain components
Component Model Input Model Parameters Model output
Driving Cycle None Target speed, stop
times and road gradient over distance
Current simulation distance
Current target speed
Current road gradient
Driver Simulation distance
Target speed
Road gradient (loop through)
Generic acceleration and deceleration curve
Acceleration
Road gradient
Vehicle Acceleration
Road gradient
Vehicle’s mass
Air drag coefficient Cd*A
Vehicle speed
Force
Wheels
Vehicle speed
Force
Dynamic tyre radius
Rolling resistance (all wheels, including generic trailer)
Angular speed
Torque
Brakes Angular speed
Torque None
Angular speed
Torque
Axle gear Angular speed
Torque
Gear ratio
Loss-map
Angular speed
Torque
Angle drive
Angular speed
Torque
Gear ratio
Loss-map
Angular speed
Torque
Retarder
Angular speed
Torque
Type of retarder
Idle loss-map
Angular speed
Torque
Transmission
Angular speed
Torque
Type of transmission
For every gear: o Gear ratio o Loss-map
Angular speed
Torque
Torque converter
Angular speed
Torque
Characteristic curves for input torque and torque ratio
Angular speed
Torque
Start-up Clutch
Angular speed
Torque None (generic model)
Angular speed
Torque
Auxiliaries
Angular speed
Torque
Technology for cooling fan, pneumatic system, steering pump, HVAC, electric system from generic list
Torque demand
Internal combustion engine
Angular speed
Torque
Torque demand of auxiliaries
Full-load curve
Drag curve
Fuel-consumption map
Fuel type
Fuel consumption and CO2 emissions

Service contract CLIMA.C.2/SER/2012/0004 Draft final Report
39
Figure 8 gives an example for virtual assembly of vehicle components in VECTO for an MT/AMT vehicle with transmission output retarder and the related power flows.
Figure 8: Example for virtual assembly of vehicle components in VECTO for an MT/AMT vehicle with transmission output retarder and related power flows (except from VECTO User Manual)
Simulation Container
The simulation container contains all powertrain components and allows the powertrain components to exchange data during the simulation. Therefore the component

Service contract CLIMA.C.2/SER/2012/0004 Draft final Report
40
implements an according information interface (e.g., IGearboxInfo, IEngineInfo) and the simulation container forwards requests to the according component.
4.3.2.3 VECTO Basic Simulation Approach
The driving cycle is defined as target speed over distance. In the simulation the vehicle has to follow the target speed as good as possible and it is important that every vehicle is simulated over exactly the same distance. Hence, the driving cycle is split into smaller simulation steps. The distance of a simulation step is adapted depending on the vehicle’s current speed such that a simulation step covers approximately 0.5 seconds. In the Driver component a transition from the space-domain to the time-domain takes place. Every simulation step simulates a small distance ds. In the powertrain, however, we need to compute in the time-domain. The driver sets the vehicle’s acceleration for the given simulation distance. With the vehicle’s current velocity and the acceleration for the current simulation interval the driver can compute the time required for the current simulation distance.
Figure 9: Sequence Diagram
Every simulation step is divided into two phases. In the first phase a valid operating point for all components of the powertrain has to be found. This means basically that the

Service contract CLIMA.C.2/SER/2012/0004 Draft final Report
41
vehicle’s acceleration has to be adjusted such that the engine speed and engine torque result in a valid operating point. The second phase is to finish (commit) the current simulation step, i.e., write the current simulation step to the simulation trace (modal results), update the internal state of every powertrain component, and advance to the next simulation step.
Searching for a valid operating point of the power train is done by issuing a request starting at the driving cycle to simulate a certain distance ds. This request is then passed along all components of the powertrain, where a component may transform the physical representation. For example the request issued to the Wheels component contains velocity and force which is transformed into angular velocity and torque for the next component. Every component typically adds its losses and forwards the request to the next component. Ideally, the request results in a valid operating point for all components and the engine acknowledges the request with a success message. However, if the torque demand for the engine is too high/low or any other component cannot fulfil the demanded operating point it responds with an according message.
Depending on the response, the driver (more precisely the driving strategy) has to decide how a valid operating point can be found. In case the torque demand is too high for the engine the acceleration can be reduced, or if the torque demand is too low for the engine the brakes have to be used. In both cases it is required to find acceleration or brake power such that the resulting engine operating point is exactly on the full-load curve or drag curve. For searching a valid operating point so-called dry-run requests are used and the response contains information how much the current request exceeds a valid operating point. After a successful search the same request is issued again which results in a success response.
For the simulation of an interval [si, si+1] (respectively [ti, ti+1]) the state of every component at the beginning of the simulation interval si is known. At the beginning of the simulation the vehicle typically stands still and the engine is idling. From this state the next state at si+1 is computed. For the calculation of a single simulation interval the general assumption is a constant acceleration. Thus, the vehicle’s speed is a linear function, the angular velocity along the powertrain is a linear function and the torque is constant. This assumption, however, is not true for every component. The air resistance force, as prominent example, depends on the vehicle’s velocity squared and since the velocity is a linear function the air resistance force is in general not constant within a simulation interval. For such components VECTO applies the ‘energy-equivalent average force’. This means that VECTO integrates the air-drag power loss (vveh * Faridrag) over the whole simulation interval and computes the average air-drag force using the vehicle’s average speed within the simulation interval. This can be done analytically since the relations are known. For other non-linear components such as the torque converter this is done in a similar way. If the relation cannot be analytically described a linear approximation is used. Losses applied by each component when propagating a request are computed or looked-up in a loss-map with the average power demand of the current simulation interval. Output for every simulation step is the average value (torque, speed, force, angular speed …) within the simulation interval (orange dots in Figure 10: Simulation Approach.

Service contract CLIMA.C.2/SER/2012/0004 Draft final Report
42
Figure 10: Simulation Approach (a…acceleration, v…velocity, F… force, N…speed, T….torque)
4.3.2.4 VECTO Driver Strategy
The driver component is split up into two parts. The first part is the driver itself which provides basic driving actions and the second part is the driver strategy containing the logic which driving actions to perform. The driver component receives the incoming request from the driving cycle and forwards it to the driver strategy. The driver strategy decides on the next driving action based on the current state of the vehicle, the requested target speed, as well as upcoming speed changes. The basic driving actions are:
Accelerate: the powertrain is closed (i.e., gear is engaged, clutch is closed), accelerate the vehicle to the given target velocity but limit the acceleration by the driver model (acceleration/deceleration curve). The acceleration is adjusted such that the engine is not overloaded. Brakes are not activated.
Coasting: the powertrain is closed, the engine is operating at the full drag load. adjust the acceleration such that this operating point is reached

Service contract CLIMA.C.2/SER/2012/0004 Draft final Report
43
Roll: the powertrain is open (i.e. no gear engaged), the vehicle rolls without motoring. Adjust the acceleration such that the torque at the gearbox' input torque (engine side) is zero
Brake: powertrain is open or closed, decelerate the vehicle by using the mechanical brakes to the next target speed, the deceleration is defined by the driver's acceleration/deceleration curve. Depending on whether a gear is engaged or not, either the torque at gearbox input side has to be 0 or the engine is operating at full drag load.
The driver strategy has to handle most of the responses from the powertrain components. If for example the gearbox shifts gears (indicated to the driving strategy via a dedicated response message) the driving strategy has to switch to the Roll action because no gear is engaged during traction interruption.
Handling all different cases of responses that can occur within a simulation interval makes the driving strategy rather complex.
The driver strategy has to look ahead in the driving cycle for upcoming speed changes. An increase in the target speed is the simpler case the driver starts accelerating not earlier than the new, higher target speed is effective. The driver only makes sure that a new simulation interval begins exactly at the speed change, thus prolonging or reducing the current simulation interval.
A decrease of the target speed is more difficult because the vehicle speed must not be higher than the target speed when the new, lower target speed is effective. This means that the driver has to decrease the vehicle’s velocity early enough, respecting the driver’s deceleration curve, so that the next target speed reached at a certain distance.
Decelerating to a lower target speed is in general done in two phases. First the driver releases the gas pedal and uses the engine drag for decelerating (coasting action) and then the driver activates the mechanical brakes, decelerating the vehicle with the driver’s maximum deceleration. The coasting phase is omitted if the vehicle’s velocity is below a certain threshold or the coasting acceleration would be greater than 0 or exceed the driver’s maximum deceleration.
The decision, how far before an upcoming decrease in target speed the driver starts coasting is described in the VECTO User Manual. This strategy has been implemented according to a proposal from the ACEA Whitebook 2016 [7]. The basic idea is to compare the vehicle’s energy (potential and kinetic) at the point of the speed change and the current state. If it exceeds a certain threshold the driver starts coasting.
During coasting, in every simulation interval the driver also computes the distance required to exactly reach the next target speed when decelerating with the driver’s maximum deceleration. When the vehicle reaches this distance the driver switches from the coasting phase to the braking phase to reach the next target speed.
4.3.2.5 MT/AMT Transmission
VECTO differentiates between two different basic gearbox types: manual or automated manual transmissions (MT/AMT) and automatic transmissions (AT). The main difference in the simulation component is the modelling of gear shifts.
MT and AMT transmissions require a traction interruption for shifting gears. During this period of time the engine is disconnected from the powertrain and cannot transmit torque to the wheels. During traction interruption, thus, a valid operating point (i.e., vehicle acceleration) results in zero torque at the gearbox input. This is handled in the search

Service contract CLIMA.C.2/SER/2012/0004 Draft final Report
44
operating point functions. In VECTO the gearbox disengages, the clutch only models the slipping at drive-off.
During traction interruption the engine’s speed is not related to the vehicle’s velocity. During these periods a dedicated controller takes over and controls the engine speed. When switching from one gear to another the engine speed is arranged to meet the estimated engine speed when engaging the next gear, which mimics a realistic driver behaviour. If the gearbox disengages because the vehicle stops then the engine speed goes down to idling speed, whereas the decrease in engine speed is determined by the engine’s drag torque.
The traction interruption time is a generic parameter, depending on the transmission type (1 second for AMTs, respectively 2 seconds for MTs). It is important to note that VECTO exactly simulates the traction interruption interval. If for example the current simulation interval would significantly exceed the traction interruption interval, the gearbox responds with an according message and the simulation interval is adjusted to match the traction interruption interval exactly.
4.3.2.6 AT Transmission
AT transmissions, in contrast, require no traction interruption. The engine can always transmit torque to the wheels. Shifting gears, however, causes additional losses in the transmission due to opening and closing clutches within the transmission. This is also modelled in VECTO. The losses during a power-shift (i.e., gearshift without traction interruption) are determined by the current torque, the difference in angular speed, and the time required to shift gears (0.8 seconds).
4.3.2.7 VECTO Gearshift Strategy
The decision when to shift gears is separated from the transmission model. The MT/AMT and AT transmission components model the component’s basic behaviour, while the decision for switching gears is delegated to the gearshift strategy.
The general rule is that the shift strategy can only initiate a gearshift after a valid operating point was found, i.e. when the engine responds back with a success message. Different shift strategies are implemented for MT/AMT transmissions and AT transmissions. The shifting rules for MT/AMT are implemented according to the ACEA WhiteBook 2016 [7]. The shifting rules for AT transmissions have been elaborated together with industry (gearbox OEMs and ACEA) over the course of the SR7 project. The algorithms are fully documented in the VECTO User Manual.
4.3.3 Development methods
A defined but lean software process and workflows were established roughly following the SPICE quality framework (ISO 15504, software lifecycle processes: ISO 12207). The relevant processes are the software ENG.4-ENG.8 processes (V-model) and the key supporting processes relevant for managing software engineering (not all Base Practices are implemented):

Service contract CLIMA.C.2/SER/2012/0004 Draft final Report
45
The main goal of the software development tasks was to produce maintainable and extensible code that gives reliable simulation results. This means a modular and well-structured software architecture, as well as defined processes for adding new features or incorporating changes.
4.3.3.1 Software Design
VECTO follows a modular, extensible software architecture for the following reasons:
Easy composition and reconfiguration of the simulation model based on simulation components
Easy integration of new simulation components, e.g. developed independently from the VECTO framework team by an aggregate supplier.
Common API for management and handling component parameterization and output data.
Common simulation framework, in particular simulation time control.
Architectural decoupling of the simulation engine and GUI
The feasibility of the simulation-based approach for CO2 certification has been demonstrated in the LOT3 project, which resulted in the implementation of VECTO 2.2. However, this implementation was intended as proof of concept and required significant refactoring so that it can be used for legislative purposes and also fulfils the stakeholder’s requirements. The refactoring goals were:
Separation of GUI and simulation
Allow integration of the simulation kernel in OEM-specific software
Introduce component model
Time and distance accurate simulation
Exact modelling of the physical and mechanical equations
All computations are done in SI units
Introduce software unit testing
Introduce sanity checks for model parameters
Introduce exceptions for error handling
Embed all generic data in the executable
4.3.3.2 Software Development Process
The software development process was set-up to be test-driven and all new or modified features are tracked in CITnet/Jira. Due to the significant refactoring work required some issues to be rather coarse-grained (e.g., refactoring of gearbox model, or refactoring of driver strategy) while bug reports and many other issues are rather fine-grained and cause only little changes in the source code.

Service contract CLIMA.C.2/SER/2012/0004 Draft final Report
46
In order to follow a uniform coding style and common coding standard project-wide ReSharper settings are used. The intention is to mainly follow a common naming scheme of classes, methods, and variables as well as common indentation and spacing. While most of the names follow the common naming scheme some methods or variables are named according to the respective technical meaning for better understanding.
The development process uses GIT as decentralized source control system and is based on the GITFlow development process. Every developer works in his own fork of the main repository and the forked developer repositories are automatically synchronized from the master. New features or bugfixes are implemented in a branch dedicated to this feature/bug. Working in separate repositories allows pushing changes to the server already during development without crowding the main repository and also allows developers to work together on new features. When a new feature is implemented (or a bug is fixed) the branch from the forked repository is merged into the development branch of the main repository. When a new release is ready, the development branch of the main repository is merged into the master branch. This allows on the one hand to continue development (in the development branch) and also to fix urgent bugs in the released version.
For an issue to be merged into the development tree it has to fulfil the following requirements:
Code meets the general coding standard and coding style
Code builds without warnings (in strict mode)
Unit tests written, test-data provided
All unit tests green
Source-code documentation (where necessary)
Update of the documentation (user manual)
4.3.3.3 Software Release Process
For every release of a new VECTO version an extensive checklists have to be worked off, including all unit tests, simulation time, and fuel consumption for certain vehicles. These checklists have evolved over time and examples of such a check lists is shown in Table 3 and Table 4.
Table 3: Checklist for preparation of release
Update Version Number
Check Project Version.cs (VectoCore, VectoConsole) ☒
Documentation updated
Version Number ☒
Date in Changelog ☒
New resp. changed features/models (Tickets, Commit-Messages) ☒
New/removed input fields ☒
Input Files (samples) ☒
Update Changelog
Changelog in PDF ☒

Service contract CLIMA.C.2/SER/2012/0004 Draft final Report
47
Changelog in User Manual ☒
Unit Tests
VECTO Core Tests: / successful Names of not successful Tests:
☒
VECTO UserBugs Tests: / successful Names of not successful Tests:
☒
VECTO Auxiliaries Tests: / successful Names of not successful Tests:
☒
ModelBased Tests: / successful Names of not successful Tests:
☐
Generic Vehicles simulate successful
Open Declaration Job File: Class 2 ☒
Save Declaration Vehicle, Engine, Gearbox, Job ☒
Check Declaration Files didn’t change except Date ☒
Declaration Mode: Class 2, exec. Time: , LH FC final l/100km: ☒
Declaration Mode: Class 5, exec. Time: , LH FC final l/100km: ☒
Open Engineering Job File: Class 2 ☒
Save Engineering Vehicle, Engine, Gearbox, Job ☒
Check Engineering Files didn’t change except Date ☒
Engineering Mode: Class 2, exec. Time: , RD FC final l/100km: ☒
Engineering Mode: Class 5, exec. Time: , LH FC final l/100km: ☒
Engineering Mode: Class 9 + PTO, exec. Time: , FC final l/100km: ☒
Engineering Mode: CityBus AT-S, exec. Time: , UD FC final l/100km: ☒
Engineering Mode: CityBus AT-P, exec. Time: , UD FC final l/100km: ☒
Engineering Mode: InterurbanBus AAUX, exec. Time: , FC final l/100km: ☒
Engineering Mode: Engine Only, exec. Time: , FC final g/h: ☒
VECTO API GUI Buttons are working ☒
VectoCMD: Declaration Class 2 works ☒
Create Vecto Release
Update License Header in Source Files ☒
Compile VECTO in RELEASE Mode ☒
Compile User Manual ☒
Create ZIP Archive ☒
Extract ZIP Archive and run VECTO, quick check ☒
Merge Development branch into Master Branch ☒
Tag Release / Build with Version Number ☒
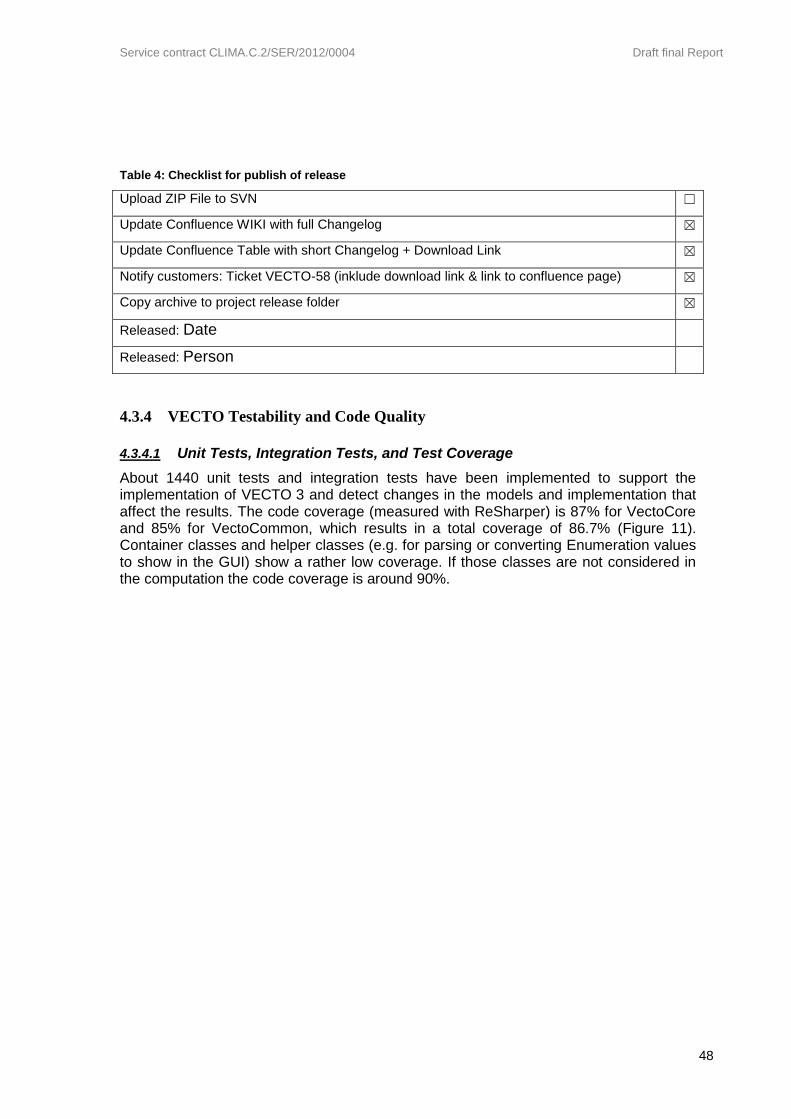
Service contract CLIMA.C.2/SER/2012/0004 Draft final Report
48
Table 4: Checklist for publish of release
Upload ZIP File to SVN ☐
Update Confluence WIKI with full Changelog ☒
Update Confluence Table with short Changelog + Download Link ☒
Notify customers: Ticket VECTO-58 (inklude download link & link to confluence page) ☒
Copy archive to project release folder ☒
Released: Date
Released: Person
4.3.4 VECTO Testability and Code Quality
4.3.4.1 Unit Tests, Integration Tests, and Test Coverage
About 1440 unit tests and integration tests have been implemented to support the implementation of VECTO 3 and detect changes in the models and implementation that affect the results. The code coverage (measured with ReSharper) is 87% for VectoCore and 85% for VectoCommon, which results in a total coverage of 86.7% (Figure 11). Container classes and helper classes (e.g. for parsing or converting Enumeration values to show in the GUI) show a rather low coverage. If those classes are not considered in the computation the code coverage is around 90%.
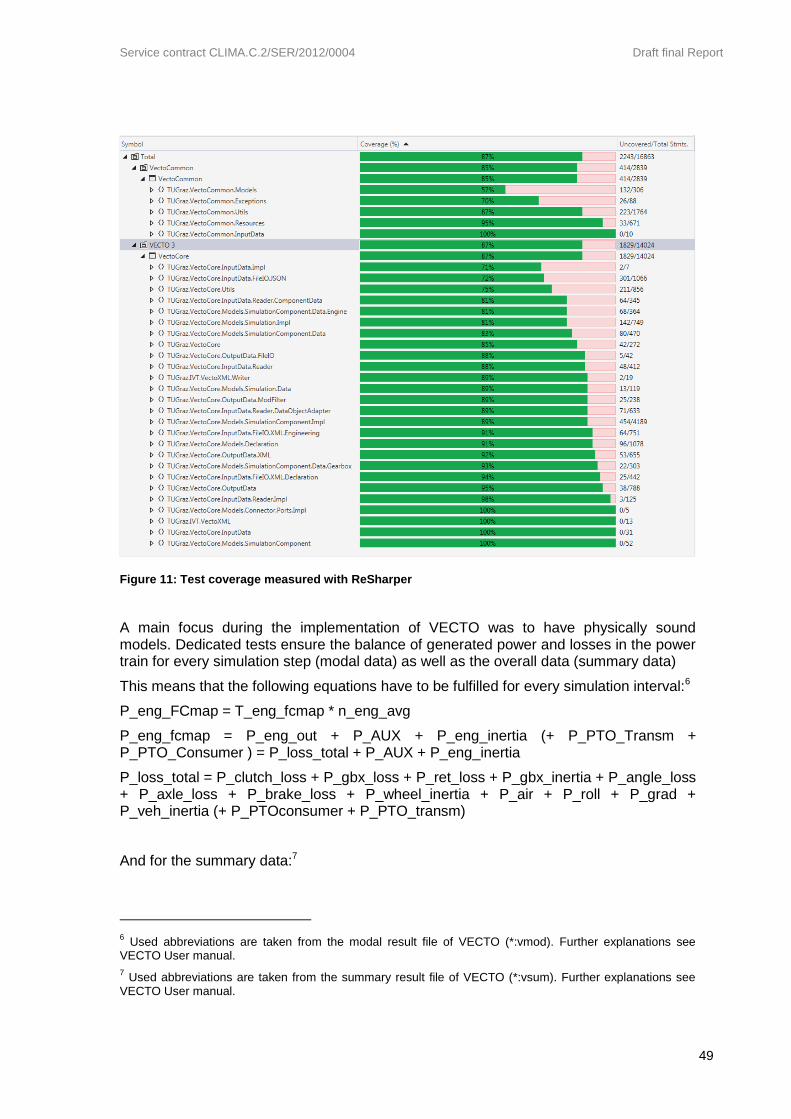
Service contract CLIMA.C.2/SER/2012/0004 Draft final Report
49
Figure 11: Test coverage measured with ReSharper
A main focus during the implementation of VECTO was to have physically sound models. Dedicated tests ensure the balance of generated power and losses in the power train for every simulation step (modal data) as well as the overall data (summary data)
This means that the following equations have to be fulfilled for every simulation interval:6
P_eng_FCmap = T_eng_fcmap * n_eng_avg
P_eng_fcmap = P_eng_out + P_AUX + P_eng_inertia (+ P_PTO_Transm + P_PTO_Consumer ) = P_loss_total + P_AUX + P_eng_inertia
P_loss_total = P_clutch_loss + P_gbx_loss + P_ret_loss + P_gbx_inertia + P_angle_loss + P_axle_loss + P_brake_loss + P_wheel_inertia + P_air + P_roll + P_grad + P_veh_inertia (+ P_PTOconsumer + P_PTO_transm)
And for the summary data:7
6 Used abbreviations are taken from the modal result file of VECTO (*:vmod). Further explanations see
VECTO User manual.
7 Used abbreviations are taken from the summary result file of VECTO (*:vsum). Further explanations see
VECTO User manual.
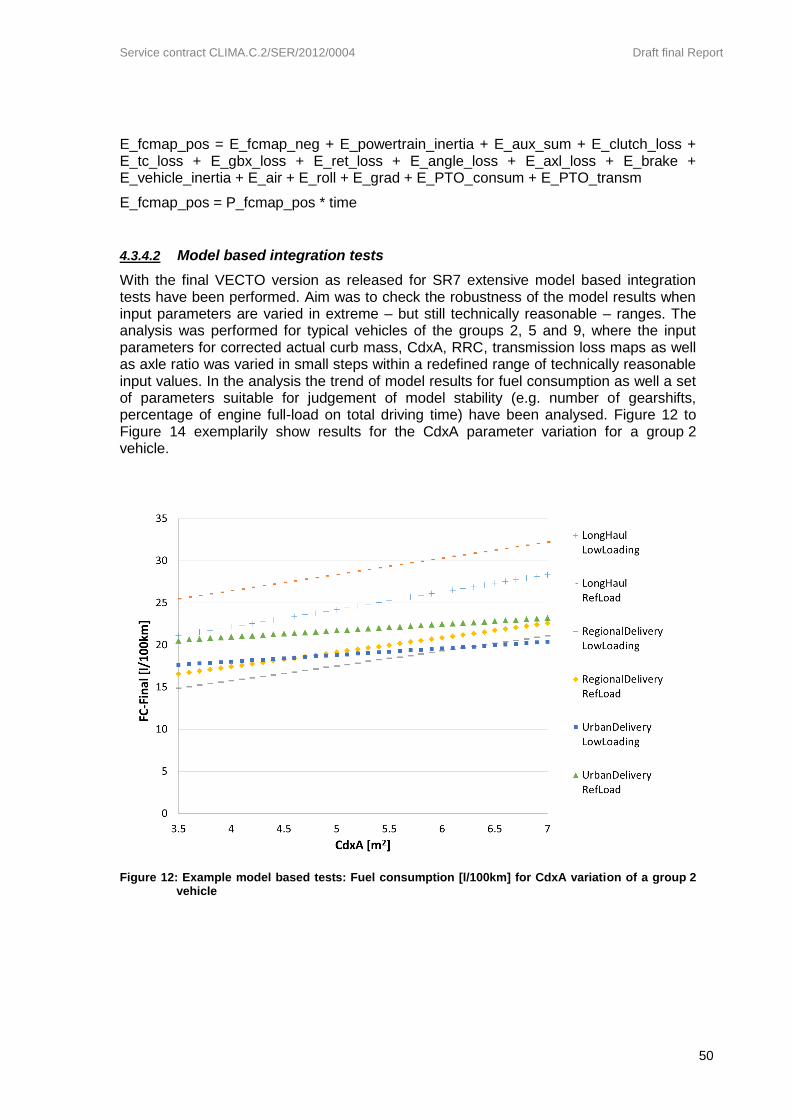
Service contract CLIMA.C.2/SER/2012/0004 Draft final Report
50
E_fcmap_pos = E_fcmap_neg + E_powertrain_inertia + E_aux_sum + E_clutch_loss + E_tc_loss + E_gbx_loss + E_ret_loss + E_angle_loss + E_axl_loss + E_brake + E_vehicle_inertia + E_air + E_roll + E_grad + E_PTO_consum + E_PTO_transm
E_fcmap_pos = P_fcmap_pos * time
4.3.4.2 Model based integration tests
With the final VECTO version as released for SR7 extensive model based integration tests have been performed. Aim was to check the robustness of the model results when input parameters are varied in extreme – but still technically reasonable – ranges. The analysis was performed for typical vehicles of the groups 2, 5 and 9, where the input parameters for corrected actual curb mass, CdxA, RRC, transmission loss maps as well as axle ratio was varied in small steps within a redefined range of technically reasonable input values. In the analysis the trend of model results for fuel consumption as well a set of parameters suitable for judgement of model stability (e.g. number of gearshifts, percentage of engine full-load on total driving time) have been analysed. Figure 12 to Figure 14 exemplarily show results for the CdxA parameter variation for a group 2 vehicle.
Figure 12: Example model based tests: Fuel consumption [l/100km] for CdxA variation of a group 2 vehicle

Service contract CLIMA.C.2/SER/2012/0004 Draft final Report
51
Figure 13: Example model based tests: Number of gear shifts for CdxA variation of a group 2 vehicle
Figure 14: Example model based tests: Percentage engine full-load on total driving time for CdxA variation of a group 2 vehicle

Service contract CLIMA.C.2/SER/2012/0004 Draft final Report
52
In total about 5.000 simulation runs with VECTO have been performed. All simulations have been executed by VECTO successfully and no unsteady or unreasonable phenomena have been identified.
4.3.4.3 Code Complexity
Another goal during the development was to significantly reduce the cyclomatic complexity of VECTO 2.2 and to keep the complexity of the implementation as low as possible. The aim was to have a cyclomatic complexity of at most 10 for every method. Unfortunately, for some methods this threshold has been exceeded, but this are mainly methods used only in Engineering Mode (e.g., measured speed mode, filters applied to the output of the modal data, handling CSV files, …) and different strategies (e.g., driver strategy, shifting strategies, ...) which are inherently complex because strategies need to handle and react to many different situations occurring during the simulation.
Figure 15 to Figure 20 as well as Table 5 show different cyclomatic complexity and code quality metrics over all VECTO releases, starting from Version 2.2 as baseline.
Figure 15: Maximum code complexity over all VECTO releases
0
50
100
150
200
250
300
Maximum Complexity

Service contract CLIMA.C.2/SER/2012/0004 Draft final Report
53
Figure 16: Maximum complexity per line over all VECTO releases
Figure 17: Average methods per class over all VECTO releases
0,00E+00
1,00E-04
2,00E-04
3,00E-04
4,00E-04
5,00E-04
6,00E-04
7,00E-04
8,00E-04
9,00E-04
1,00E-03
Maximum Complexity per Line
0,00
2,00
4,00
6,00
8,00
10,00
12,00
14,00
Average Methods per Class

Service contract CLIMA.C.2/SER/2012/0004 Draft final Report
54
Figure 18: Average statements per method over all VECTO releases
Figure 19: Number of Classes/Interfaces over all VECTO releases
0,00
2,00
4,00
6,00
8,00
10,00
12,00
14,00
16,00
18,00
20,00
Average Statements per Method
0
50
100
150
200
250
300
350
400
450
500
Number of Classes/Interfaces

Service contract CLIMA.C.2/SER/2012/0004 Draft final Report
55
Figure 20: Percentage of files with max. complexity > 11 over all VECTO releases
Table 5: Code quality metrics over all VECTO releases
VE
CT
O V
ers
ion
Num
ber
of
File
s
Lin
e C
ount
Num
ber
of
Meth
ods
Num
ber
of
Sta
tem
ents
Num
ber
of
Cla
sses/In
terf
aces
Avera
ge M
eth
ods p
er
Cla
ss
Avera
ge S
tate
ments
per
Meth
od
Max.
Co
mple
xity
Meth
ods w
ith m
ax.
Com
ple
xity >
11
Perc
enta
ge
of
File
s
with m
ax.
Co
mple
xity >
11
Maxim
um
Com
ple
xity
per
Lin
e
2.2 49 25383 863 13503 76 12.70 17.19 243 24 49.0% 8.74E-04
3.0.1.315 212 28055 1670 13387 369 5.25 4.54 20 9 4.2% 9.90E-05
3.0.2.434 236 41812 2038 16356 416 5.64 5.01 25 13 5.5% 7.34E-05
3.0.2.466 237 42002 2059 16507 418 5.69 5.01 25 13 5.5% 7.29E-05
3.0.3.495 172 26632 1488 9766 350 4.56 2.51 23 12 7.0% 1.32E-04
3.0.3.536 172 26676 1486 9770 350 4.54 2.52 23 12 7.0% 1.31E-04
3.0.4.544 180 28995 1617 10674 372 4.60 2.62 26 13 7.2% 1.23E-04
3.0.4.565 180 28993 1617 10678 372 4.60 2.62 26 12 6.7% 1.22E-04
3.1.0.652 215 32452 1791 12489 430 4.43 2.93 27 24 11.2% 1.26E-04
3.1.0.662 215 33515 1791 12517 430 4.43 2.93 27 24 11.2% 1.23E-04
3.1.0.683 215 33696 1800 12617 432 4.44 2.94 27 23 10.7% 1.23E-04
3.1.1.742 219 34678 1852 12987 438 4.62 3.09 28 25 11.4% 1.22E-04
3.1.1.748 219 34717 1855 13017 438 4.62 3.10 28 25 11.4% 1.23E-04
3.1.2.796 219 35193 1867 13280 440 4.63 3.15 30 27 12.3% 1.24E-04
3.1.2.810 219 35410 1874 13401 440 4.65 3.19 39 27 12.3% 1.25E-04
3.2.0 220 37165 2010 14248 447 5.00 3.21 15 12 5.5% 1.04E-04
0,0%
10,0%
20,0%
30,0%
40,0%
50,0%
60,0%
Percentage of Files with max. Complexity > 11

Service contract CLIMA.C.2/SER/2012/0004 Draft final Report
56
4.3.4.4 Traceability of VECTO Development
As outlined in the VECTO Software Development Guideline, the development follows the GIT-flow approach, whereas every developer works in his own fork of the main repository. For every new feature to be added to VECTO it is mandatory to open a new issue in the CITnet/Jira. Consequently, each feature is implemented in a separate feature-branch, which is then merged back to the main repository once the implementation is done and accepted. This development approach allows to trace the implementation of every new feature added to VECTO.
In total about 400 issues concerning new features or bugs have been created and about 100 issues for end-user support requests. All issues (except 2, waiting for input from ACEA) have been processed. During the development of VECTO 3.2 more than 3200 GIT commits have been submitted and more than 400 merge requests have been merged.
4.3.5 Generic data in VECTO for simulation of official CO2 values
In the HDV CO2 legislation the allocation of generic data to a particular vehicle is defined via the so called “segmentation matrix” (Table 6). It defines applicable mission profile and vehicle configuration as well as allocated standard body as a function of the “vehicle group”. The vehicle group is defined by axle and chassis configuration and the technically permissible maximum laden mass. Similar tables exist for the allocation of vehicle payloads (see section 4.3.5.4) as well as for data on energy consumption of auxiliaries.
This section focuses on generic data for trucks only, as both the segmentation tables as well as several other datasets related to VECTO settings for buses in the official CO2 declaration are still in development. Details on bus topics are given separately in section 5.1.

Service contract CLIMA.C.2/SER/2012/0004 Draft final Report
57
Table 6: Segmentation matrix
Description of elements relevant
to the classification in vehicle
groups
Veh
icle
gro
up
Allocation of mission profile and vehicle configuration
Sta
nd
ard
bo
dy a
llo
cati
on
Axle
co
nfi
gu
rati
on
Ch
assis
co
nfi
gu
rati
on
Te
ch
nic
ally
pe
rmis
sib
le m
axim
um
lad
en
mass (
ton
s)
Long h
aul
Long h
aul (E
MS
*)
Regio
nal deliv
ery
Regio
nal deliv
ery
(E
MS
*)
Urb
an d
eliv
ery
Mu
nic
ipal utilit
y
Constr
uctio
n
4x2
Rigid >3.5 – 7.5 (0) excluded
Rigid (or tractor)* 7.5 - 10 1
R R
B1
Rigid (or tractor)* >10 - 12 2 R+T1 R R
B2
Rigid (or tractor)* >12 - 16 3
R R
B3
Rigid >16 4 R+T2 R
R
B4
Tractor 7.5 - 16 5 T+ST1 T+ST1+T2 T+ST1 T+ST1+T2
4x4
Rigid >16 (6) excluded
Rigid >16 (7) excluded
Tractor all weights (8) excluded
6x2 Rigid all weights 9 R+T2 R+D+ST1 R R+D+ST1
R
B5
Tractor all weights 10 T+ST1 T+ST1+T2 T+ST1 T+ST1+T2
6x4 Rigid all weights 11 R+T2 R+D+ST R R+D+ST
R R B5
Tractor all weights 12 T+ST1 T+ST1+T2 T+ST1 T+ST1+T2
T+ST1
6x6 Rigid all weights (13) excluded
Tractor all weights (14) excluded
8x2 Rigid all weights (15) excluded
8x4 Rigid all weights 16 R
8x6
8x8 Rigid all weights (17) excluded
* EMS - European Modular System (concept of allowing combinations of existing loading units (modules) into longer and
sometime heavier vehicle combinations to be used on some parts of the road network)
EMS results are calculated by VECTO only for vehicles with a rated power of equal or higher than 300kW
** in these vehicle classes tractors are treated as rigids but with specific curb weight of tractor
R = Rigid & standard body
T1, T2 = Standard trailers
ST1 = Standard semitrailer
D = Standard dolly

Service contract CLIMA.C.2/SER/2012/0004 Draft final Report
58
4.3.5.1 Mission profiles and CO2 cycles
VECTO uses target speed cycles (“CO2 test cycles”) to calculate the fuel consumption and CO2 emissions of the HDV. The target speed cycles define the velocity the driver wants to reach or to which he is limited by traffic conditions over the distance of the trip. To properly reflect the different mission profiles in which different HDV groups are used in real world traffic, a set of five CO2 test cycles for HGV and of five CO2 test cycles for buses and coaches have been developed. The cycle development was coordinated by ACEA with support by the consortium. During the previous project (LOT3) the proposed cycles were validated based on a comparison with corresponding cycles in the WHDC database (see [4], paragraph 4.3)
The following mission profiles are implemented:
Long haul,
Regional delivery,
Urban delivery,
Construction,
Municipal utility,
Citybus heavy urban,
Citybus urban,
Citybus suburban,
Interurban bus,
Coach.
During this project the cycles for the following mission classes were reviewed and amended by ACEA and subcontractors:
Long haul,
Regional delivery,
Municipal utility
Citybus suburban
In addition to that a comparison of VECTO CO2-cycles with real world driving data of N2 vehicles and the WLTC was performed, see also chapter 5.2
Currently ACEA and their subcontract are still reviewing the cycles for “Urban delivery” as well as “Construction”. As no final drafts have been available until the end of this project no assessment of these updates can be made within the SR7 project.
Amended cycles:
Long haulage
The proposed cycle amendments for the missions listed above are based on an assessment of the existing driving cycles by SIOUX LIME, contracted by ACEA [8]. This report was studied in detail for the assessment of the amendment proposals.
With regards to the long haulage target speed cycle in the version at the end of LOT3 the LIME study resulted in the following conclusions:

Service contract CLIMA.C.2/SER/2012/0004 Draft final Report
59
“Regarding the characteristics of the speed profile, the average speed is low compared to the measurements. Approximately 10% of the distance is travelled at a speed of 60 km/h or less, which seems too much to represent a long-haul transportation route. Furthermore, the CO2-cycle contains a relatively high number of large speed fluctuations. On the contrary, at 80 km/h, the CO2-cycle does not induce any minor speed fluctuations due to traffic behaviour, which seems unrealistic when compared to the actual observations.“ Figure 21 shows the target speed gradient profile as well as stop times of the updated cycle as elaborated on behalf of ACEA. The updated cycle has a distance of 100km and an average speed of approx. 80km/h. The total stop time is 67 seconds.
Figure 21: Long Haul cycle (2015 Update)
In order to enable a comparison with 1 Hz in-use data TUG provided time based cycles for typical vehicles calculated with VECTO.
Figure 22 shows the vehicle speed distributions for long haul missions in the WHDC database and the transformed VECTO cycles in the old and the amended version. It can clearly be seen that the amendment cannot be justified by the WHDC in-use data. But one has to take into account that the WHDC data was derived 18 to 20 years ago while the amendment proposal is based on more recent data from 18 long haulage trips covering different regions in Europe as well as a wide variation range of travelled distances between 300 and 1500 km and that the analysis methods used by LIME are transparent and reasonable.

Service contract CLIMA.C.2/SER/2012/0004 Draft final Report
60
Figure 22: Time weighted cumulative vehicle speed frequency distributions for long haul mission (vehicle 17 to 35 are driving data from the WHDC data base)
The only comment would be, that the VECTO cycles do not include traffic jam sections, and thus do not reflect the traffic situation distributions near agglomerations.
Regional delivery
With respect to the regional delivery cycle in the version from LOT3 the LIME project led to the following conclusions:
“The average (legal) speed underlying the existing driving cycle speed profile is a bit too low:
a. The portion of the existing driving cycle travelled on roads with legal speeds of 50km/h or lower is too high
b. The portion of the existing driving cycle travelled on roads with legal speeds higher than 50km/h, but not on highways, is too low
c. The existing driving cycle has a sufficient portion travelled on highways”
The above text was copied from the LIME report, but “ACEA cycle” was replaced by “existing cycle”. Figure 23 shows the target speed gradient profile as well as stop times of the updated Regional Delivery cycle as elaborated by LIME. The cycle has a distance of 100 km and an average speed of approx. 60 km/h. The total stop time is 746 seconds.
0%
10%
20%
30%
40%
50%
60%
70%
80%
90%
100%
0 10 20 30 40 50 60 70 80 90 100
cum
fre
qu
en
cy
vehicle speed in km/h
veh 17, time weighted
veh 18, time weighted
veh 31, time weighted
veh 32, time weighted
veh 33, time weighted
veh 34, time weighted
veh 35, time weighted
WHDC database, time weighted
old LH cycle
amended LH cycle
long haul mission

Service contract CLIMA.C.2/SER/2012/0004 Draft final Report
61
Figure 23: Regional delivery cycle (2016 update)
Figure 24 shows a comparison of the old and the amended VECTO cycle for regional delivery and vehicle speed distribution curves from the WHDC database. Since regional delivery is defined in the LIME report as trips between 50 and 150 km, the speed distributions from the WHDC database were adjusted to this distance class. As one can see, the amended curve is closer to the average curve for the WHDC with one exception: The stop phase frequency of the amended cycle is significantly higher (12% compared to 7%) and outside the range of the WHDC data.

Service contract CLIMA.C.2/SER/2012/0004 Draft final Report
62
Figure 24: Time weighted cumulative vehicle speed frequency distributions for regional delivery mission
Municipal Utility cycle
The municipal utility cycle shall depict a typical operation of a refuse truck of the most common type “rear loader”. The cycle consists of three parts:
1. Approach to the area of garbage collection 2. Collection part 3. Drive from the area of garbage collection to the waste processing side
Parts 1. and 3. as well as a draft for the collection part have been elaborated by ACEA already during the course of the LOT3 project. Within the SR7 project the collection part was updated in order to meet the vehicle operation pattern as described in DIN 30752-1 [6]. The collection part consist of 20 meter and 40 meter distances with stops of 25 seconds including “garbage collection” where also the power consumption of the PTO (power take off) for the hydraulic system of the garbage body is considered (see also section 4.3.5.5). The cycles as well as the definitions of the generic refuse bodies to be used by VECTO in the simulations have been elaborated in close cooperation with the NA 051 DIN-Normenausschuss Kommunale Technik (NKT) in Germany. The Municipal cycle is shown in Figure 25. The cycle has a total distance of 11.2 km and an average speed of approximately 9 km/h. The collection part covers 2.9 km distance and has an average speed of approximately 3 km/h.
0%
10%
20%
30%
40%
50%
60%
70%
80%
90%
100%
0 10 20 30 40 50 60 70 80 90 100
cum
fre
qu
en
cy
vehicle speed in km/h
amended RD cycle
old RD cycle
WHDC, 50 - 150 km, veh 2
WHDC, 50 - 150 km, veh 5
WHDC, 50 - 150 km, veh 6
WHDC, 50 - 150 km, veh 7
WHDC, 50 - 150 km, veh 13
WHDC, 50 - 150 km, veh 15
WHDC, 50 - 150 km, veh 16
WHDC, 50 - 150 km, veh 17
WHDC, 50 - 150 km, veh 18
all, distance between 50 and 150 km
WHDC database,
journeys with distances between 50
and 150 km

Service contract CLIMA.C.2/SER/2012/0004 Draft final Report
63
Figure 25: Municipal cycle (2017 update)
Public transport bus, suburban
Another cycle for which ACEA proposed an amendment is the suburban public transport bus cycle. As one can see in Figure 27, the amended cycle is shifted between 15 km/h and 55 km/h towards about 3 km/h higher speeds. Compared to bus cycles from WHDC and more recent research projects in the Ruhrgebiet low vehicle speeds are underrepresented. But this was already the case for the old suburban cycle. (See final report LOT3 [4], figure 19).
The updated suburban cycle is shown in Figure 26.

Service contract CLIMA.C.2/SER/2012/0004 Draft final Report
64
Figure 26: Suburban cycle (2016 update)
Figure 27: Time weighted cumulative vehicle speed frequency distributions for suburban public transport bus routes
0%
10%
20%
30%
40%
50%
60%
70%
80%
90%
100%
0 10 20 30 40 50 60 70 80 90
cum
fre
qu
en
cy
vehicle speed in km/h
suburban old
suburban amended
veh 29, CH, inter city, WHDC
Veh 22, D, suburban, WHDC
veh 24, D, inter city, WHDC
Veh 24, D, suburban, WHDC
Düsseldorf, 2010
Essen, 2010
Hagen, 2010
WHDC database,
Ruhrgebiet 2010

Service contract CLIMA.C.2/SER/2012/0004 Draft final Report
65
N2 vehicles
Another open issue is, how N2 vehicles below approx. 5.5 tons mass shall be handled, since these can by certified regarding pollutants according to WLTP as well as to the HDV engine certification procedure. Therefore, a comparison of the mission cycles urban and regional delivery and the WLTP cycle with in-use data for N2 vehicles was performed.
Since N2 vehicles are speed limited similar to N3 vehicles, a capped speed WLTC was used as shown in Figure 28 with a speed cap of 88 km/h. The capped speed cycle is calculated in that way, that the distance driven is the same as for the original WLTC.
The results are shown in Figure 29 to Figure 33. The vehicle speed distributions for the WHDC database are shown for each journey separately. For vehicles 2 and 3 a clear distinction between urban delivery like and regional delivery like journeys were found. For the other three vehicles a broader variety of the speed distribution curves can be seen with a majority of urban delivery like journeys.
One could conclude that a weighted average of the results for urban and regional delivery cycles would be appropriate for N2 vehicles. The capped speed WLTC fits in terms of speed distribution to the real world data. The analysis of the engine load distribution gives a different result, see chapter 5.2.
Figure 28: Speed trace of the WLTC, original and with a speed cap of 88 km/h
0
10
20
30
40
50
60
70
80
90
100
110
120
130
140
0 200 400 600 800 1000 1200 1400 1600 1800 2000
veh
icle
sp
ee
d i
n k
m/h
time in s
WLTC 3a with capped speed
WLTC 3b, original
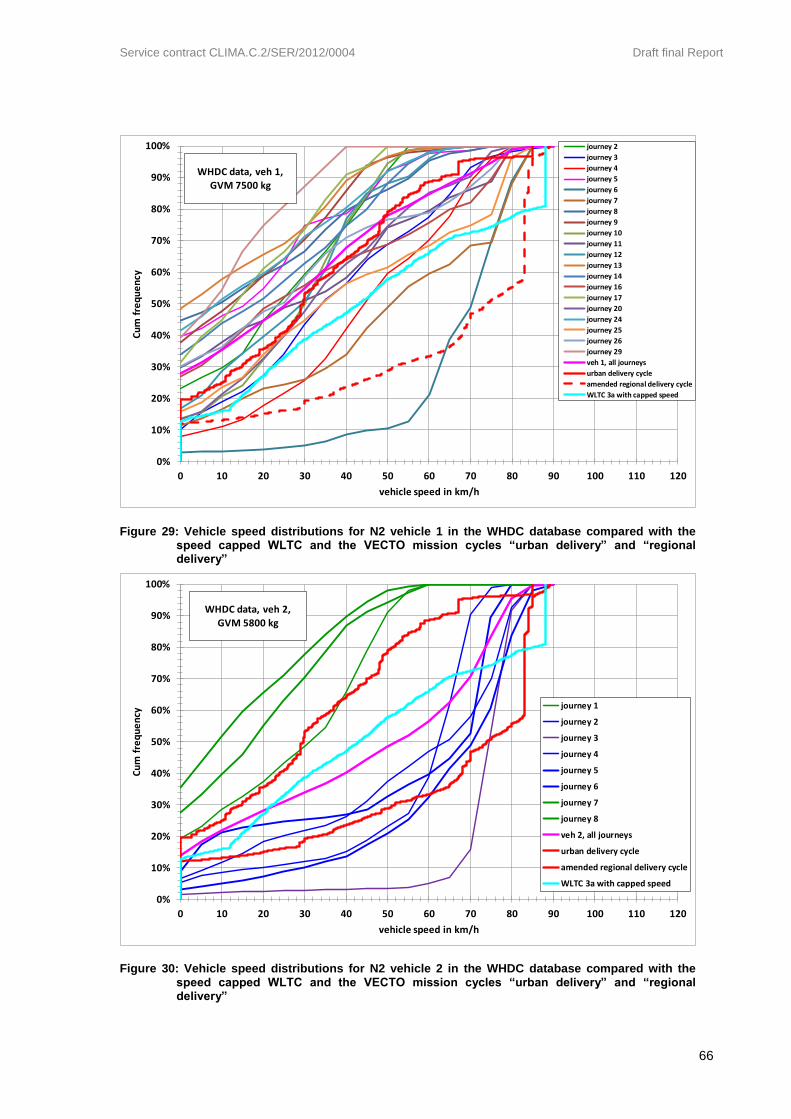
Service contract CLIMA.C.2/SER/2012/0004 Draft final Report
66
Figure 29: Vehicle speed distributions for N2 vehicle 1 in the WHDC database compared with the speed capped WLTC and the VECTO mission cycles “urban delivery” and “regional delivery”
Figure 30: Vehicle speed distributions for N2 vehicle 2 in the WHDC database compared with the speed capped WLTC and the VECTO mission cycles “urban delivery” and “regional delivery”
0%
10%
20%
30%
40%
50%
60%
70%
80%
90%
100%
0 10 20 30 40 50 60 70 80 90 100 110 120
Cu
m f
req
ue
ncy
vehicle speed in km/h
journey 2
journey 3
journey 4
journey 5
journey 6
journey 7
journey 8
journey 9
journey 10
journey 11
journey 12
journey 13
journey 14
journey 16
journey 17
journey 20
journey 24
journey 25
journey 26
journey 29
veh 1, all journeys
urban delivery cycle
amended regional delivery cycle
WLTC 3a with capped speed
WHDC data, veh 1,
GVM 7500 kg
0%
10%
20%
30%
40%
50%
60%
70%
80%
90%
100%
0 10 20 30 40 50 60 70 80 90 100 110 120
Cu
m f
req
ue
ncy
vehicle speed in km/h
journey 1
journey 2
journey 3
journey 4
journey 5
journey 6
journey 7
journey 8
veh 2, all journeys
urban delivery cycle
amended regional delivery cycle
WLTC 3a with capped speed
WHDC data, veh 2,
GVM 5800 kg

Service contract CLIMA.C.2/SER/2012/0004 Draft final Report
67
Figure 31: Vehicle speed distributions for N2 vehicle 3 in the WHDC database compared with the speed capped WLTC and the VECTO mission cycles “urban delivery” and “regional delivery”
Figure 32: Vehicle speed distributions for N2 vehicle 4 in the WHDC database compared with the speed capped WLTC and the VECTO mission cycles “urban delivery” and “regional delivery”
0%
10%
20%
30%
40%
50%
60%
70%
80%
90%
100%
0 10 20 30 40 50 60 70 80 90 100 110 120
cum
fre
qu
en
cy
vehicle speed in km/h
journey 1
journey 2
journey 3
journey 4
journey 5
journey 6
journey 7
journey 8
journey 9
journey 10
journey 11
journey 13
journey 14
veh 3, all journeys
urban delivery cycle
amended regional delivery cycle
WLTC 3a with capped speed
WHDC database, veh 3,
5600 kg GVM
0%
10%
20%
30%
40%
50%
60%
70%
80%
90%
100%
0 10 20 30 40 50 60 70 80 90 100 110 120
Cu
m f
req
ue
ncy
vehicle speed in km/hv
journey 1
journey 2
journey 3
journey 4
journey 5
journey 6
journey 7
journey 8
journey 13
journey 14
journey 16
journey 18
journey 19
journey 21
journey 22
journey 24
veh 4, all journeys
urban delivery cycle
amended regional delivery cycle
WLTC 3a with capped speed
WHDC data, veh 4,
GVM 12000 kg

Service contract CLIMA.C.2/SER/2012/0004 Draft final Report
68
Figure 33: Vehicle speed distributions for N2 vehicle 11 in the WHDC database compared with the speed capped WLTC and the VECTO mission cycles “urban delivery” and “regional delivery”
4.3.5.2 Standard bodies and standard trailers
Table 7 gives the physical parameters for standard bodies (B) and standard trailers (T, ST) as used in the VECTO declaration mode.
Table 7: VECTO parameters for standard bodies and standard trailers
name
curb mass [kg]
max gross mass [kg]
delta CdxA for trailer operation in long haul [m²]
axle count
[-] wheels
dimension
tyre RRC
[N/kN]
cargo volume
[m³] as first trailer
as second trailer (EMS)
B1 1600 - - - - - 36.5
B2 1900 - - - - - 45.2
B3 2000 - - - - - 47.7
B4 2100 - - - - - 49.4
B5 2200 - - - - - 51.9
T1 3400 10500 1.3 - 2 235/75 R17.5 5.5 (mid
of energy class "C")
39.8
T2 5400 18000 1.5 1.5 2 385/65 R22.5 49.5
ST1 7500 24000 0 2.1 3 385/65 R22.5 91
Dolly 2500 12000 - - 2 315/70 R22.5 0
0%
10%
20%
30%
40%
50%
60%
70%
80%
90%
100%
0 10 20 30 40 50 60 70 80 90 100 110 120
Cu
m f
req
ue
ncy
vehicle speed in km/h
journey 1
journey 3
journey 4
journey 5
journey 6
journey 7
journey 8
journey 10
journey 11
journey 12
journey 13
journey 14
journey 15
journey 16
journey 17
journey 18
journey 19
veh 11, 9650 kg GVM
urban delivery cycle
amended regional delivery cycle
WLTC 3a with capped speed
WHDC data, veh 11, GVM
9650 kg

Service contract CLIMA.C.2/SER/2012/0004 Draft final Report
69
All specifications have been elaborated in close cooperation with CLCCR and ACEA.
A particular task in the SR7 project was to elaborate standard values for body and trailer volumes which is described in detail below. The specifications relevant for the air drag test were already elaborated in LOT3 [4] and are listed in the HDV CO2 TA.
Elaboration of standard values for body and trailer volumes
Usually, the HDV CO2 emission is related to ‘utility’, ‘duty’ or ‘production’. The most common way for HDV’s is to express the CO2 emission in relation to distance (gCO2 / km) and to mass transported over distance (gCO2 / ton-km). Next to payload, cargo volume is an important criterion for utility when choosing a HDV and therefore stakeholders requested ‘volume’ to be taken into account. Also for CO2 monitoring it is important to know the vehicles ‘utility’ in terms of CO2 emitted per kilometre of usable cargo volume travelled. The goal for the development of VECTO was therefore to determine the Usable Cargo Volume of the (reference-) bodies and semi- trailers that have already been defined in the framework of the VECTO development.
Cargo volume can be used:
as information in the VECTO output (m3),
for the definition of a ‘cargo volume specific CO2 emission’, i.e. gCO2 / m3-km.
The definition of useable cargo volume is based on the outer dimensions as defined for the standard bodies an trailers in the HDV CO2 TA.
The volume represents usable cubic cargo volume of reference bodywork. The real volume may differ, and depends on actual internal dimensions and construction.8
Definition of usable cargo volume:
Usable Cargo Volume = LINT x WINT x HINT (largest cubic volume that fits)
Internal length and width were fit to discrete numbers of euro pallets with a margin of a few cm.
The following tables show the defined internal dimensions of the reference bodywork and the resulting usable cargo volumes that can be used in VECTO for the definition of volume specific CO2 emissions and to provide a basic information about the utility of the vehicle for which a CO2 value was calculated/certified. The dimensions were reviewed by Prof. Pflug representing CLCCR/VDA.
8 If a customer knows the specific volume of his particular body work or trailer, he can make a good estimation of the actual g_CO2/m³-km by dividing the VECTO distance based results (g/km) by the known volume.

Service contract CLIMA.C.2/SER/2012/0004 Draft final Report
70
Figure 34: Dimensions, cargo volume and number of pallets of reference bodies.
Figure 35: Dimensions, cargo volumes and number of pallet of reference (semi-) trailers.
Alternatives for vehicles with different length of chassis and bodywork.
Rigid trucks are sold with different chassis lengths or wheelbases. For further development of VECTO, besides the option of the plain measurement of the internal cargo volume of real bodywork, options could be considered for the simplified definition of usable cargo volume for vehicles that mainly differ from the reference bodies in chassis and bodywork length, with height and width being the same as the reference bodies.
For this option interior length needs to be estimated:
LINT = LEXT – front – rear (thickness ‘front’ and ‘rear’ can be calculated from specifications of the reference bodies)
LEXT = (Free chassis length) – (cabin to body) + (overhang)
A certain cabin to body distance is required to avoid the cabin hitting the bodywork due to chassis flex and is usually 50-80mm. A default overhang of the bodywork at the rear of the chassis needs to be defined. Probably for a lot of vehicles the overhang is about 0m.
Besides the estimation of the usable cargo volume, for instance for multistage vehicles, and for introduction in VECTO at a later stage the measurement of real cargo volume could be considered.
Floor surface, number of pallets

Service contract CLIMA.C.2/SER/2012/0004 Draft final Report
71
In addition to volume, floor surface or number of pallets could be part of the standard information provided to the customer. Both can easily be determined from the tables with dimensions.
4.3.5.3 EMS vehicle configurations
The segmentation matrix as proposed by ACEA also includes vehicle configurations with a gross combination mass of more than 40.000 kg according to the “European Modular System” (EMS) concept as permitted in Directive 96/53 EC, Article 4, § 4 (b). The proposed vehicle configurations have a gross combination mass of 60.000 kg and a maximum length of 25.25 m and can be configured from vehicles of the groups 5, 9, 10, 11 and 12 (Figure 36). Such vehicles are actually permitted in Sweden, Finland, Denmark, The Netherlands, Spain and parts of Germany.
Figure 36: EMS vehicle configurations in VECTO
These vehicle configurations are simulated in VECTO using additional or different trailers (including a “dolly” required for coupling the standard semitrailer to a group 9 or 11 rigid). Results for EMS are only calculated by VECTO for vehicles with a rated power equal or higher than 300 kW (referring to a specific motorisation of equal or higher than 5 kW per ton gross combination mass).
4.3.5.4 Vehicle payloads
ACEA provided data on representative payloads for all applicable combinations of vehicle group and mission profile in their White book. Additional data from [6] on typical average payloads for refuse vehicles has been taken into consideration for VECTO. The resulting logics behind the definitions for “representative” payloads as implemented in VECTO are the following:
Typical loading factor for long haul operation is defined with 75%.
Typical loading factor for other cycles except municipal is 50%.
For vehicle of groups 1 to 3 – which have a wide spread of maximum gross vehicle weights within a group – functions for typical payload calculated from the max. gross vehicle weights have been elaborated.

Service contract CLIMA.C.2/SER/2012/0004 Draft final Report
72
For vehicles of groups 4 and higher fixed absolute payloads per group and mission profile have been elaborated.
For vehicles simulated in the municipal cycle the representative payloads as described in [6] for each axle configuration are applied.
There were several discussions whether VECTO should also simulate results for other payloads than “representative”. VECTO versions until early 2017 additionally simulated empty and fully loaded vehicles. After discussions it was agreed that for the official CO2 declaration VECTO simulates representative payload as well as 10% payload. Based on this data a customer can then interpolate and/or extrapolate the fuel consumption / CO2 emissions for his specific use case as the related dependencies with vehicle mass are quite linear. Arguments against simulation of fully loaded vehicles are that in order to calculate the payload for this use case additional input for VECTO regarding registered vehicle specifications as well as definitions how to deal with country specific limitations would be required. Additionally simulation of fully loaded vehicles would significantly increase computation time per vehicle.
The payloads as used in VECTO for the official CO2 declaration for each applicable combination of vehicle group, mission profile and payload conditions are shown in Table 8.
Table 8: VECTO payloads in tons (f10%, f50% and f75% refer to functions as shown in Figure 37)
Vehicle group
Long haul Long haul
(EMS) Regional delivery
Regional delivery (EMS)
Urban delivery
Municipal utility Construction
rep
r. lo
ad
10
% lo
ad
rep
r. lo
ad
10
% lo
ad
rep
r. lo
ad
10
% lo
ad
rep
r. lo
ad
10
% lo
ad
rep
r. lo
ad
10
% lo
ad
rep
r. lo
ad
10
% lo
ad
rep
r. lo
ad
10
% lo
ad
1 --- --- --- --- f50% f10% --- --- f50% f10% --- --- --- ---
2 f10% + 5.3
f75% + 0.7
--- --- f50% f10% --- --- f50% f10% --- --- --- ---
3 --- --- --- --- f50% f10% --- --- f50% f10% --- --- --- ---
4 14.0 1.9 --- --- 4.4 0.9 --- --- --- --- 3.0 0.6 --- ---
5 19.3 2.6 26.5 3.5 12.9 2.6 17.5 3.5 --- --- --- --- --- ---
9 19.3 2.6 26.5 3.5 7.1 1.4 17.5 3.5 --- --- 6.0 1.2 --- ---
10 19.3 2.6 26.5 3.5 12.9 2.6 17.5 3.5 --- --- --- --- --- ---
11 19.3 2.6 26.5 3.5 7.1 1.4 17.5 3.5 --- --- 6.0 1.2 7.1 1.4
12 19.3 2.6 26.5 3.5 12.9 2.6 17.5 3.5 --- --- --- --- 12.9 2.6
16 --- --- --- --- --- --- --- --- --- --- --- --- 12.9 2.6
The linear functions for the definition of 10%, 50% and 75% typical payload as applied to vehicle groups 1 to 3 are shown in Figure 37.

Service contract CLIMA.C.2/SER/2012/0004 Draft final Report
73
Figure 37: Payload functions applicable for for vehicle groups 1, 2 and 3
VECTO reduces the payload in the simulations compared to Table 8 in the following cases:
The total mass of the rigid (sum of “corrected actual curb mass”9 plus mass of standard body plus mass of payload) for groups 1, 2 and 3 calculated by the payload function exceeds the GVWR. In this case the vehicle is simulated with a payload matching the GVWR.
The total vehicle mass from the rigid plus trailer or the tractor plus semitrailer combination exceeds 40 tons (for non-EMS vehicles) or 60 tons (for EMS vehicles) respectively. In these cases the payload is calculated to match 40 tons or 60 tons total vehicle mass.
4.3.5.5 Generic data for simulation of “Municipal cycle”
According to the segmentation matrix vehicles of groups 4, 9 and 11 are also simulated in the Municipal cycle representing a typical operation pattern of a refuse truck of type “rear loader”. The underlying set of generic data has been elaborated in close cooperation with the “DIN-Normenausschuss Kommunale Technik (NKT)”. This data consists of the following elements:
1. Driving cycle (see section 4.3.5.1)
2. Mass of the refuse body (Table 9)
9 Definition see HDV CO2 TA Annex III

Service contract CLIMA.C.2/SER/2012/0004 Draft final Report
74
Table 9: Generic refuse vehicle bodies
vehicle group mass refuse body
[kg]
4 6000
9 6750
11 6750
3. Losses of the PTO10 which are considered from the technology “only the drive shaft of the PTO – shift claw, synchroniser, sliding gearwheel” (see Table 10 in Annex IX of the HDV CO2 TA). This PTO technology is applied in the Municipal cycle independently of any other particular PTO technology mounted on the vehicle.11
4. The data on power consumption of the refuse body consists of two elements:
a. The engine speed and engine torque pattern during PTO operation at vehicle standstill in the garbage collection phase (Figure 38)
Figure 38: Generic engine speed and load pattern during PTO activation
b. The idling power consumption of the hydraulic pump during normal vehicle operation. These losses are defined over engine speed (Figure 39) and are relevant for the simulation as the generic refuse truck is defined to have no clutch in the PTO system to separate the refuse body hydraulics when not active.
10
PTO = “power take off”, system to take off power from the engine or the transmission to be used e.g. in case of a refuse truck to drive the mechanical functions of the refuse body.
11 Not all PTO technologies are compatible with the hydraulic system of the generic refuse truck.
Also the fact whether the PTO mounted on a truck is able to declutch the power-consumer from the vehicle powertrain cannot be identified in all cases from the VECTO input. Hence the generic settings as described are used for all vehicles in the Municipal cycle. The losses of the specific PTO mounted on a vehicle are considered by VECTO for all other mission profiles.

Service contract CLIMA.C.2/SER/2012/0004 Draft final Report
75
Figure 39: Idling losses of the hydraulic pump during normal vehicle operation
A detailed description of the VECTO algorithms to consider the power consumption of vehicle systems operated via a PTO can be found in the VECTO user manual.
All other vehicle parameters (e.g. the CdxA value or the rolling resistance coefficients) are considered in the VECTO simulations for the Municipal cycle as declared for the specific vehicle.
As a rule of thumb the power consumption of the refuse body contributes some 45% to the total fuel consumption in the collection part and some 30 % in the total municipal cycle.
4.3.5.6 Generic data for simulation of “Construction cycle”
Trucks typically used for construction purposes vary significantly from vehicles with standard box body in terms of aerodynamic characteristics as well as masses from the superstructure and the (semi-)trailer. This difference shall also be considered by VECTO in the simulation of the Construction cycle. Since up to now the specific characteristics of the body and the trailer are not available in the CO2 certification (see section 5.3.2) generic data for body masses and CdxA for typical construction vehicles shall be used in VECTO. Typical values for these parameters are currently under elaboration by ACEA. The final VECTO version from SR7 (3.2.0.925) uses the masses as well as the fall-back CdxA values for of the standard bodies also as interim generic data for construction vehicles. This data shall be updated as soon as input from industry is available. This data is relevant for vehicle groups 11, 12, and 16 which will be CO2 certified from the 1st of July 2020.
4.3.5.7 Auxiliaries
Auxiliary systems are devices that consume energy for functions other than propulsion. Auxiliaries are either needed for proper operation of the engine (e.g. engine cooling fan) or of vehicle related systems (e.g. compressor for pressurised air system). In conventional vehicles, auxiliary units are driven by mechanical power from the internal combustion engine. The power consumption of some engine-related auxiliary components are already implicitly covered by the engine fuel map and hence do not have to be considered separately. These components are:

Service contract CLIMA.C.2/SER/2012/0004 Draft final Report
76
engine oil pump
coolant pump
fuel delivery pump
fuel high pressure pump
The remaining auxiliary units need to be covered in the fuel consumption modelling individually. These systems are:
engine cooling fan
alternator
air compressor
steering pump
A/C compressor
Additionally VECTO treats the power losses of a PTO system (see footnote 10 on page 74) like an auxiliary.
For trucks the influence of auxiliaries on overall fuel consumption was assessed to be of secondary importance. Hence intentionally rather simple methods are applied in VECTO. As a general principle the auxiliary power demand is simulated in VECTO for trucks adding a constant power level to the internal combustion engine. This power demand is either taken from tables as a function of auxiliary technology and mission profiles or calculated from formulas taking specific vehicle specifications into consideration. The complete set of tables and formulas is specified in the HDV CO2 TA Annex IX.
4.3.5.8 VECTO driver strategy and gear shift strategy
The parameterisation of the VECTO driver model as well as the gear shift model is an important part of the generic data relevant in the official CO2 certification. A detailed description of the algorithms as well as the underlying model parameters are given in the VECTO User manual. All functionalities have been elaborated on the basis of proposals from industry (as provided in the ACEA Whitebook as well as proposed from transmission suppliers) and adapted to the particular structure of the VECTO model.
The VECTO gear shift algorithms have been subject to intensive discussions until the end of the SR7 contract. The actual strategy for AMTs has been validated for long haul and partly for regional delivery driving by industry and by data available to TUG. However, the actual model is criticised to show poor fuel efficient shifting in low speed cycles (especially urban delivery and municipal cycle). ACEA is currently investigating updated approaches which shall be tested in autumn 2017.
For the generic parameterisation of the AT model for trucks measurements have been provided by Daimler where two identical trucks, one with AMT transmission and one with AT transmission, have been operated simultaneously on a Municipal utility operation profile as well as on a regional route. This data has been analysed by TUG and was used for fine-tuning of the AT truck model extensively. Compared to the measurement VECTO 3.2 slightly favours the AT vs the AMT in fuel consumption ranking. This can be mainly attributed to the low efficient gear shifts of the VECTO AMT gear shift strategy. It is hence recommended, that once the AMT gear shift strategy is updated, also the AT gear shift strategy is validated again to maintain a correct ranking between AT and AMT technology.
The VECTO gear shift models for buses are still under development. Main issue is that the settings as communicated at the end of the SR7 contract still show a systematic bias

Service contract CLIMA.C.2/SER/2012/0004 Draft final Report
77
for the ranking of AT technologies between the two main market competitors for AT transmissions in buses. This issue is discussed in more details in section 5.1.1.
4.3.5.9 Generic data for calculation of air resistance
The following set of generic data is used in VECTO to calculate the vehicles’ air resistance force:
1) Air density: 1.188 [kg/m³]
This value refers to an ambient air temperature of 12°C and an ambient air pressure of 1013 mbar at sea-level converted to an average altitude of 200 m.
2) Average wind conditions
The typical conditions are defined with 3 m/s at a height of 4 m above ground level, blowing uniformly distributed from all directions [9]
3) Dependency of CdxA value on yaw angle12
The dependency of the CdxA value on the yaw angle is described by generic 3rd order polynomial functions of the form:
CdxA(β) - CdxA(0) = a1 β+ a2 β²+ a3 β²
Table 10 gives the coefficients a1 to a3 per vehicle type. The functions are valid in a range between 0 and 10 degrees yaw angle assuming symmetry around 0 yaw angle. The parameters have been provided by ACEA in the White book 2016.
Table 10: Coefficients for yaw angle dependency of air drag
a1 a2 a3
rigid solo 0.013526 0.017746 -0.000666
rigid trailer, EMS
0.017125 0.072275 -0.004148
tractor semitrailer
0.030042 0.040817 -0.002130
bus, coach
-0.000794 0.021090 -0.001090
Figure 40 gives the resulting dependency of the CdxA value as a function of yaw angle.
12
The CdxA value evaluated by VECTO Air Drag from the constant speed test is corrected for cross wind influence during the testing and refers to zero yaw angle “CdxA(0)”. This correction is based on the similar method as used in VECTO to consider “average cross wind”.

Service contract CLIMA.C.2/SER/2012/0004 Draft final Report
78
Figure 40: Generic correction of air drag as a function of inflow angle
The calculation algorithms implemented in VECTO to consider the cross wind influence are documented in the VECTO user manual. Additionally an MS Excel is distributed together with the VECTO software, which comprehends all algorithms in order to reproduce the calculations related to cross-wind influence as performed within VECTO.
4.3.5.10 Wheels
For each wheel/tyre size VECTO requires a list of generic data which comprises mainly information on rotational inertia and data to calculate the dynamic tyre radius. As some wheel/tyre dimensions are not “self-explaining” e.g. do not contain the tire aspect ratio, no standard formulas can be applied to accept any dimension as input to VECTO. Hence the VECTO input on tyre dimensions is limited by the available dataset of wheel dimensions. The actual table as shown in Table 11 has been elaborated by together with ACEA based on the list of dimensions as provided in the Whitebook 2016.
Table 11: Generic wheel data in VECTO
Wheel dimension code
Cross-sectional
width [mm]
Tire aspect
ratio [%]
Rim diameter
[inch]
Design overall
diameter d [mm] Inertia F [-]
9.00 R20 258 0.95 20 1018 10.5 3.05
9 R22.5 230 0.95 22.5 970 8.9 3.05
9.5 R17.5 240 0.95 17.5 842 4.9 3.05
10 R17.5 254 0.95 17.5 858 5 3.05
10 R22.5 254 0.95 22.5 1020 11 3.05
10.00 R20 275 0.95 20 1052 13.1 3.05
11 R22.5 279 0.95 22.5 1050 14.4 3.05

Service contract CLIMA.C.2/SER/2012/0004 Draft final Report
79
Wheel dimension code
Cross-sectional
width [mm]
Tire aspect
ratio [%]
Rim diameter
[inch]
Design overall
diameter d [mm] Inertia F [-]
11.00 R20 286 0.95 20 1082 14.6 3.05
11.00 R22.5 279 0.95 22.5 1050 16 3.05
12 R22.5 300 0.95 22.5 1084 16.85 3.05
12.00 R20 313 0.95 20 1122 19.5 3.05
12.00 R24 313 0.95 24 1226 27.7 3.05
12.5 R20 317.5 0.95 20 1120 12.7 3.05
13 R22.5 320 0.95 22.5 1124 20 3.05
14.00 R20 370 0.95 20 1238 30.8 3.05
14.5 R20 368.3 0.95 20 1092 14.8 3.05
16.00 R20 406.4 0.95 20 1343 47.5 3.05
205/75 R17.5 205 0.75 17.5 753 3.5 3.05
215/75 R17.5 212 0.75 17.5 767 3.9 3.05
225/70 R17.5 226 0.7 17.5 761 4 3.05
225/75 R17.5 226 0.75 17.5 783 4 3.05
235/75 R17.5 233 0.75 17.5 797 4.5 3.05
245/70 R17.5 248 0.7 17.5 789 5.2 3.05
245/70 R19.5 248 0.7 19.5 839 6 3.05
255/70 R22.5 255 0.7 22.5 930 9.5 3.05
265/70 R17.5 262 0.7 17.5 817 5.6 3.05
265/70 R19.5 262 0.7 19.5 867 6.5 3.05
275/70 R22.5 276 0.7 22.5 958 11.9 3.05
275/80 R22.5 276 0.8 22.5 1012 12.8 3.05
285/60 R22.5 285 0.6 22.5 914 10.6 3.03
285/70 R19.5 283 0.7 19.5 895 7.9 3.05
295/55 R22.5 292 0.55 22.5 896 10.2 3.03
295/60 R22.5 292 0.6 22.5 926 10.8 3.03
295/80 R22.5 298 0.8 22.5 1044 15.5 3.05
305/60 R22.5 306 0.6 22.5 938 11.4 3.03
305/70 R19.5 305 0.7 19.5 923 9.2 3.05
305/70 R22.5 305 0.7 22.5 1000 13.9 3.05
305/75 R24.5 305 0.75 24.5 1080 21.2 3.05
315/45 R22.5 307 0.45 22.5 856 9.9 3.03
315/60 R22.5 313 0.6 22.5 950 12.8 3.03
315/70 R22.5 312 0.7 22.5 1014 14.9 3.05
315/80 R22.5 312 0.8 22.5 1076 17.6 3.05
325/95 R24 325 0.95 24 1228 27.6 3.05
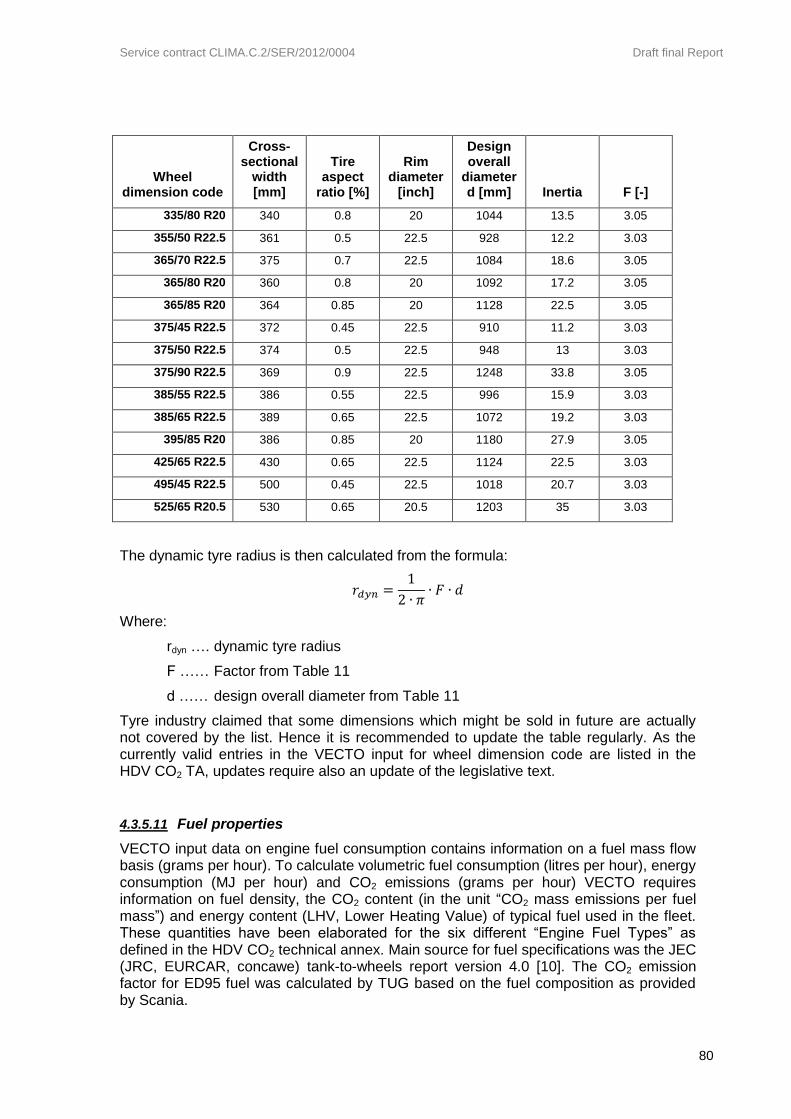
Service contract CLIMA.C.2/SER/2012/0004 Draft final Report
80
Wheel dimension code
Cross-sectional
width [mm]
Tire aspect
ratio [%]
Rim diameter
[inch]
Design overall
diameter d [mm] Inertia F [-]
335/80 R20 340 0.8 20 1044 13.5 3.05
355/50 R22.5 361 0.5 22.5 928 12.2 3.03
365/70 R22.5 375 0.7 22.5 1084 18.6 3.05
365/80 R20 360 0.8 20 1092 17.2 3.05
365/85 R20 364 0.85 20 1128 22.5 3.05
375/45 R22.5 372 0.45 22.5 910 11.2 3.03
375/50 R22.5 374 0.5 22.5 948 13 3.03
375/90 R22.5 369 0.9 22.5 1248 33.8 3.05
385/55 R22.5 386 0.55 22.5 996 15.9 3.03
385/65 R22.5 389 0.65 22.5 1072 19.2 3.03
395/85 R20 386 0.85 20 1180 27.9 3.05
425/65 R22.5 430 0.65 22.5 1124 22.5 3.03
495/45 R22.5 500 0.45 22.5 1018 20.7 3.03
525/65 R20.5 530 0.65 20.5 1203 35 3.03
The dynamic tyre radius is then calculated from the formula:
𝑟𝑑𝑦𝑛 =1
2 ∙ 𝜋∙ 𝐹 ∙ 𝑑
Where:
rdyn …. dynamic tyre radius
F …… Factor from Table 11
d …… design overall diameter from Table 11
Tyre industry claimed that some dimensions which might be sold in future are actually not covered by the list. Hence it is recommended to update the table regularly. As the currently valid entries in the VECTO input for wheel dimension code are listed in the HDV CO2 TA, updates require also an update of the legislative text.
4.3.5.11 Fuel properties
VECTO input data on engine fuel consumption contains information on a fuel mass flow basis (grams per hour). To calculate volumetric fuel consumption (litres per hour), energy consumption (MJ per hour) and CO2 emissions (grams per hour) VECTO requires information on fuel density, the CO2 content (in the unit “CO2 mass emissions per fuel mass”) and energy content (LHV, Lower Heating Value) of typical fuel used in the fleet. These quantities have been elaborated for the six different “Engine Fuel Types” as defined in the HDV CO2 technical annex. Main source for fuel specifications was the JEC (JRC, EURCAR, concawe) tank-to-wheels report version 4.0 [10]. The CO2 emission factor for ED95 fuel was calculated by TUG based on the fuel composition as provided by Scania.
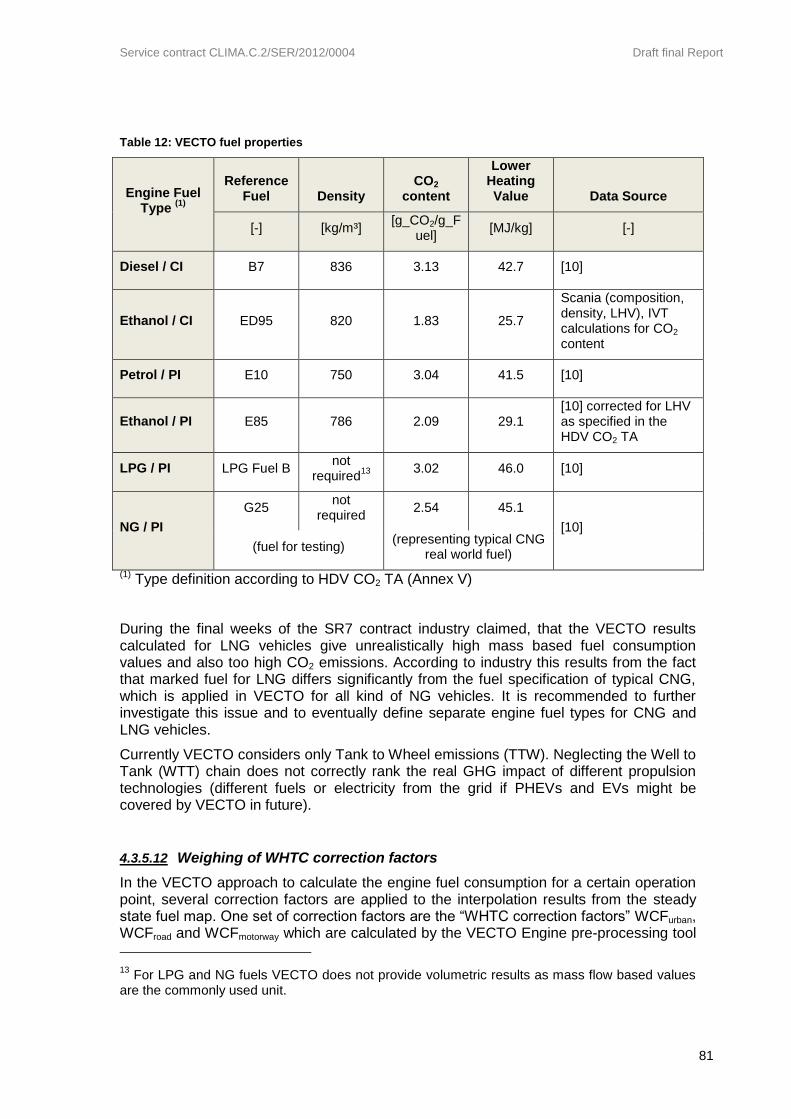
Service contract CLIMA.C.2/SER/2012/0004 Draft final Report
81
Table 12: VECTO fuel properties
Engine Fuel Type
(1)
Reference Fuel Density
CO2 content
Lower Heating Value Data Source
[-] [kg/m³] [g_CO2/g_F
uel] [MJ/kg] [-]
Diesel / CI B7 836 3.13 42.7 [10]
Ethanol / CI ED95 820 1.83 25.7
Scania (composition, density, LHV), IVT calculations for CO2 content
Petrol / PI E10 750 3.04 41.5 [10]
Ethanol / PI E85 786 2.09 29.1 [10] corrected for LHV as specified in the HDV CO2 TA
LPG / PI LPG Fuel B not
required13
3.02 46.0 [10]
NG / PI
G25 not
required 2.54 45.1
[10]
(fuel for testing) (representing typical CNG
real world fuel)
(1) Type definition according to HDV CO2 TA (Annex V)
During the final weeks of the SR7 contract industry claimed, that the VECTO results calculated for LNG vehicles give unrealistically high mass based fuel consumption values and also too high CO2 emissions. According to industry this results from the fact that marked fuel for LNG differs significantly from the fuel specification of typical CNG, which is applied in VECTO for all kind of NG vehicles. It is recommended to further investigate this issue and to eventually define separate engine fuel types for CNG and LNG vehicles.
Currently VECTO considers only Tank to Wheel emissions (TTW). Neglecting the Well to Tank (WTT) chain does not correctly rank the real GHG impact of different propulsion technologies (different fuels or electricity from the grid if PHEVs and EVs might be covered by VECTO in future).
4.3.5.12 Weighing of WHTC correction factors
In the VECTO approach to calculate the engine fuel consumption for a certain operation point, several correction factors are applied to the interpolation results from the steady state fuel map. One set of correction factors are the “WHTC correction factors” WCFurban, WCFroad and WCFmotorway which are calculated by the VECTO Engine pre-processing tool
13
For LPG and NG fuels VECTO does not provide volumetric results as mass flow based values are the commonly used unit.

Service contract CLIMA.C.2/SER/2012/0004 Draft final Report
82
by dividing the measured fuel consumption in hot WHTC (urban, road and motorway) by the value interpolated for the related engine speed and torque operation points from the steady fuel map. These correction factors shall account for influence of transients on the fuel efficiency of engines as well of the influence of complex engine applications (as e.g. variations in EGR rates and SCR heating strategies) which are not covered by the steady state fuel map.
When VECTO is then used to calculate the fuel consumption of the HDV in a HDV-CO2 test cycle, the three WHTC correction factors are weighted to fit the dynamics of the target speed cycle of the mission profile under consideration:
WCFTot-i = WCFUrb x WFUrb-i + WCFRur x WFRur-i + WCFMW x WFMW-i
With i ..... mission profile according to Table 13.
Table 13: Weighting factors for the WHTC category correction factors (final values from the HDH GTR work)
Index Mission profile WFMW WFRoad WFUrb
1 Long haul 89% 0% 11%
2 Regional delivery 53% 30% 17%
3 urban delivery 4% 27% 69%
4 Municipial utility 2% 0% 98%
5 Construction 6% 32% 62%
6 Citybus 0% 0% 100%
7 Interurban bus 19% 36% 45%
8 Coach 78% 22% 0%
This approach and the derivation of the weighing factors is already described in a document for the heavy Duty Hybrid-HILS test procedure [11].
4.4 Ex-Post test procedure (EPTP)
The so called “Ex Post Test procedure” shall provide a method to validate VECTO input data which can be handled by independent labs without support from OEMs. Re-testing the engine, the gear box and the axle according to the corresponding component test procedures is almost impossible without OEM support since the ECUs handling engine operation and gear shifts need manifold signals from various components of the vehicle which can hardly be provided correctly by a 3rd party component test stand. Furthermore dismounting the components and putting them on the component test stand from an existing HDV is already a complex and costly process.
To solve the issue, a vehicle test was developed, which is based on on-board measurement of rotational speed and torque at the driven wheels and of the fuel flow (Figure 41). By recalculating the test cycle defined by the instantaneous torque and rpm signal at the wheels with VECTO using the vehicle’s certified input data, the measured fuel consumption should be met. The test set up covers the combined input data of the axle, the gear box and the engine. To eliminate the influence of the generic gear shift model also measured engine speed or the measured gear position is needed as model
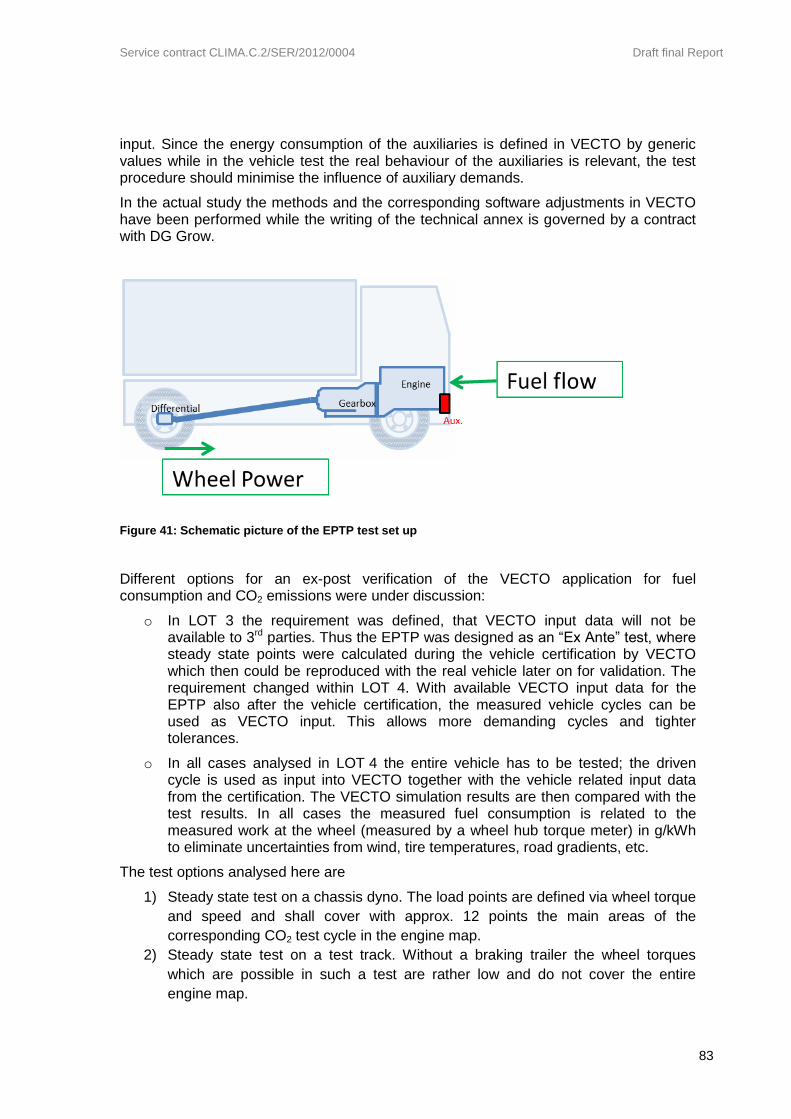
Service contract CLIMA.C.2/SER/2012/0004 Draft final Report
83
input. Since the energy consumption of the auxiliaries is defined in VECTO by generic values while in the vehicle test the real behaviour of the auxiliaries is relevant, the test procedure should minimise the influence of auxiliary demands.
In the actual study the methods and the corresponding software adjustments in VECTO have been performed while the writing of the technical annex is governed by a contract with DG Grow.
Figure 41: Schematic picture of the EPTP test set up
Different options for an ex-post verification of the VECTO application for fuel consumption and CO2 emissions were under discussion:
o In LOT 3 the requirement was defined, that VECTO input data will not be available to 3rd parties. Thus the EPTP was designed as an “Ex Ante” test, where steady state points were calculated during the vehicle certification by VECTO which then could be reproduced with the real vehicle later on for validation. The requirement changed within LOT 4. With available VECTO input data for the EPTP also after the vehicle certification, the measured vehicle cycles can be used as VECTO input. This allows more demanding cycles and tighter tolerances.
o In all cases analysed in LOT 4 the entire vehicle has to be tested; the driven cycle is used as input into VECTO together with the vehicle related input data from the certification. The VECTO simulation results are then compared with the test results. In all cases the measured fuel consumption is related to the measured work at the wheel (measured by a wheel hub torque meter) in g/kWh to eliminate uncertainties from wind, tire temperatures, road gradients, etc.
The test options analysed here are
1) Steady state test on a chassis dyno. The load points are defined via wheel torque
and speed and shall cover with approx. 12 points the main areas of the
corresponding CO2 test cycle in the engine map.
2) Steady state test on a test track. Without a braking trailer the wheel torques
which are possible in such a test are rather low and do not cover the entire
engine map.

Service contract CLIMA.C.2/SER/2012/0004 Draft final Report
84
3) Transient test on a chassis dyno, e.g. a short version of a CO2 VECTO cycle or
the WHVC
4) Transient test on the road from driving in real world traffic, e.g. following the
PEMS test boundary conditions from the ISC testing for regulated pollutants but
with fuel flow meter and wheel hub torque meter.
In the following different basic investigations for designing the test procedure are described. Main focus was put on the analysis of uncertainties related to the options listed above. While the creditability of transient on-road transient tests is rated highest from the above mentioned options, the concern existed that such tests will have a much higher uncertainty than steady state tests. Since no major disadvantages in terms of inaccuracies were found for transient tests - as shown later in this chapter - the actual draft technical annex for the EPTP describes an on-road test procedure.
Since the physical test procedure still is a reasonable effort (selection of a suitable HDV, equipment with measurement devices, calibration, testing, evaluation) options for reducing the efforts for testing are still under consideration. A simple option in this direction is a twostep EPTP:
Step 1): validation of the VECTO input data by comparison of information on the vehicle (component certification numbers, auxiliaries installed, etc.) and simple re-run of VECTO with the original hashed data set from the certification to reproduce the certified results; re-computation of the hash-values and comparison of the hash values with the certification.
Figure 42: flow chart of the proposed check of VECTO input data
Step 2): physical EPTP
The physical tests consists of:
Selection of the test route
Instrumentation of the vehicle
Calibration , of sensors and analysers where relevant
Run fuel consumption test
Drift check of the torque measurement device
Evaluation of test results
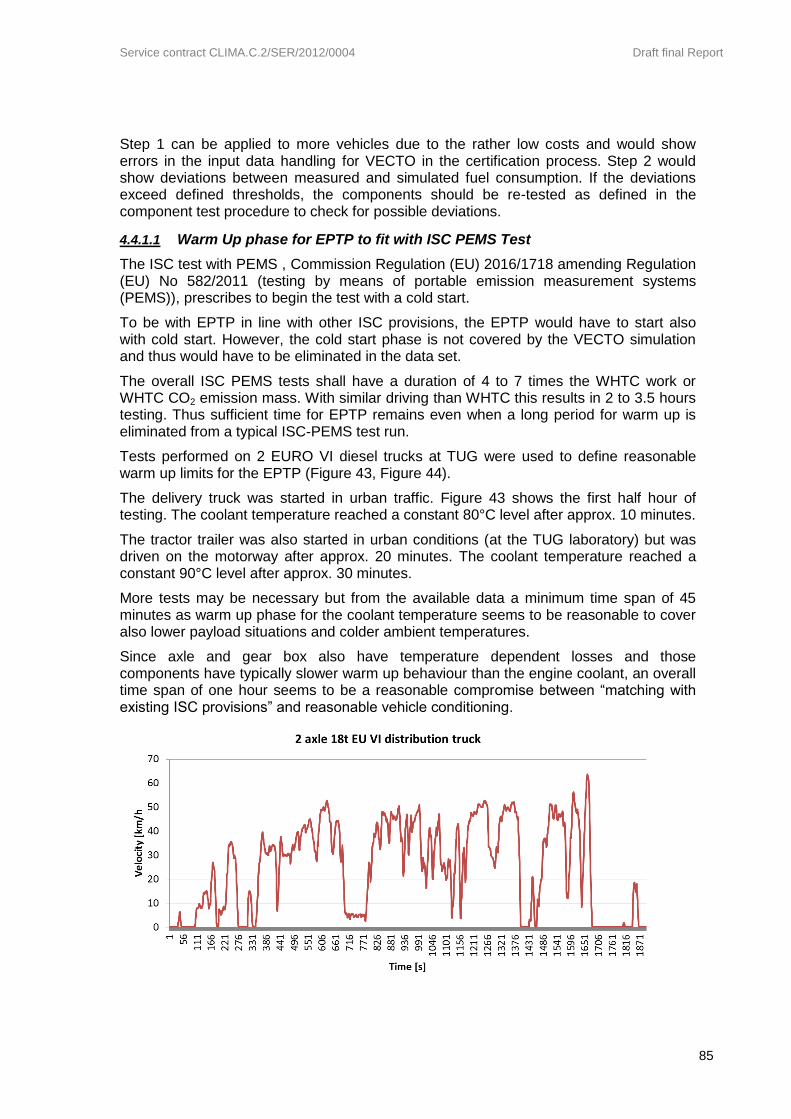
Service contract CLIMA.C.2/SER/2012/0004 Draft final Report
85
Step 1 can be applied to more vehicles due to the rather low costs and would show errors in the input data handling for VECTO in the certification process. Step 2 would show deviations between measured and simulated fuel consumption. If the deviations exceed defined thresholds, the components should be re-tested as defined in the component test procedure to check for possible deviations.
4.4.1.1 Warm Up phase for EPTP to fit with ISC PEMS Test
The ISC test with PEMS , Commission Regulation (EU) 2016/1718 amending Regulation (EU) No 582/2011 (testing by means of portable emission measurement systems (PEMS)), prescribes to begin the test with a cold start.
To be with EPTP in line with other ISC provisions, the EPTP would have to start also with cold start. However, the cold start phase is not covered by the VECTO simulation and thus would have to be eliminated in the data set.
The overall ISC PEMS tests shall have a duration of 4 to 7 times the WHTC work or WHTC CO2 emission mass. With similar driving than WHTC this results in 2 to 3.5 hours testing. Thus sufficient time for EPTP remains even when a long period for warm up is eliminated from a typical ISC-PEMS test run.
Tests performed on 2 EURO VI diesel trucks at TUG were used to define reasonable warm up limits for the EPTP (Figure 43, Figure 44).
The delivery truck was started in urban traffic. Figure 43 shows the first half hour of testing. The coolant temperature reached a constant 80°C level after approx. 10 minutes.
The tractor trailer was also started in urban conditions (at the TUG laboratory) but was driven on the motorway after approx. 20 minutes. The coolant temperature reached a constant 90°C level after approx. 30 minutes.
More tests may be necessary but from the available data a minimum time span of 45 minutes as warm up phase for the coolant temperature seems to be reasonable to cover also lower payload situations and colder ambient temperatures.
Since axle and gear box also have temperature dependent losses and those components have typically slower warm up behaviour than the engine coolant, an overall time span of one hour seems to be a reasonable compromise between “matching with existing ISC provisions” and reasonable vehicle conditioning.

Service contract CLIMA.C.2/SER/2012/0004 Draft final Report
86
Figure 43: test results for warm up behaviour on a EURO VI delivery truck at TUG
Figure 44: test results for warm up behaviour on a EURO VI tractor trailer combination at TUG
From test data of the 2 trucks it was analysed if a minimum engine work can be demanded as warm up time criterion. The integrated positive engine work over the cycles was normalised by division by the engine rated power. The coolant temperature
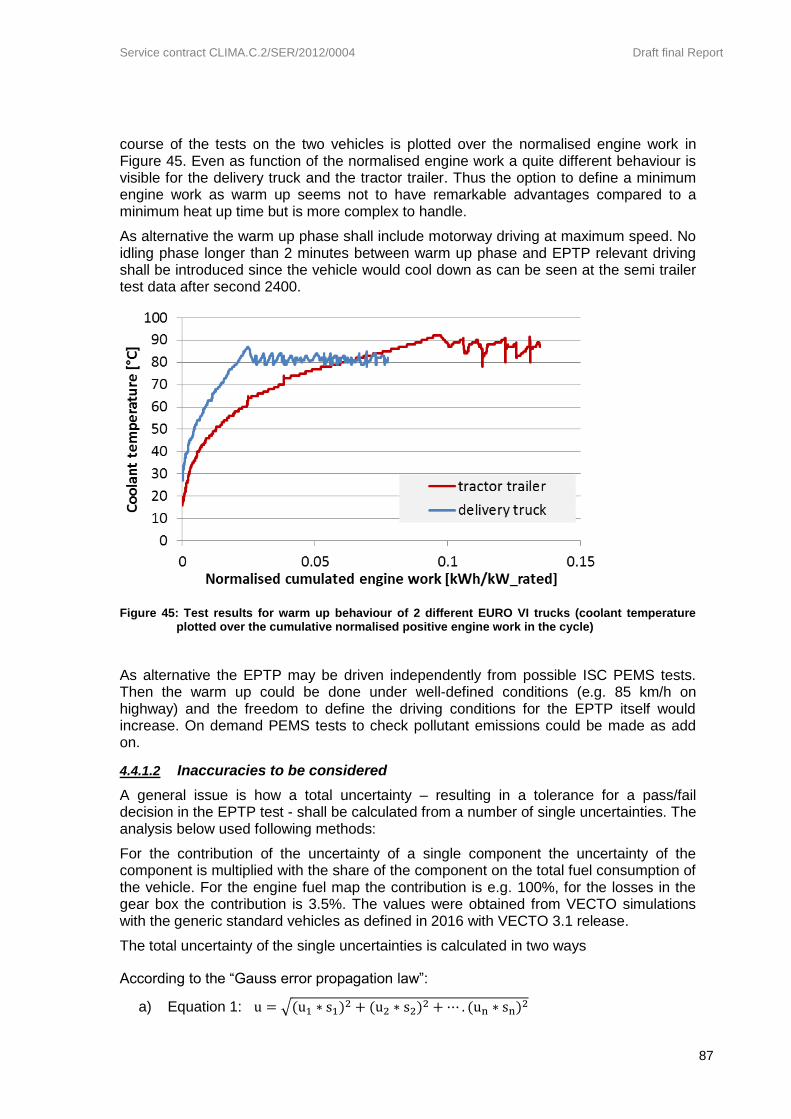
Service contract CLIMA.C.2/SER/2012/0004 Draft final Report
87
course of the tests on the two vehicles is plotted over the normalised engine work in Figure 45. Even as function of the normalised engine work a quite different behaviour is visible for the delivery truck and the tractor trailer. Thus the option to define a minimum engine work as warm up seems not to have remarkable advantages compared to a minimum heat up time but is more complex to handle.
As alternative the warm up phase shall include motorway driving at maximum speed. No idling phase longer than 2 minutes between warm up phase and EPTP relevant driving shall be introduced since the vehicle would cool down as can be seen at the semi trailer test data after second 2400.
Figure 45: Test results for warm up behaviour of 2 different EURO VI trucks (coolant temperature plotted over the cumulative normalised positive engine work in the cycle)
As alternative the EPTP may be driven independently from possible ISC PEMS tests. Then the warm up could be done under well-defined conditions (e.g. 85 km/h on highway) and the freedom to define the driving conditions for the EPTP itself would increase. On demand PEMS tests to check pollutant emissions could be made as add on.
4.4.1.2 Inaccuracies to be considered
A general issue is how a total uncertainty – resulting in a tolerance for a pass/fail decision in the EPTP test - shall be calculated from a number of single uncertainties. The analysis below used following methods:
For the contribution of the uncertainty of a single component the uncertainty of the component is multiplied with the share of the component on the total fuel consumption of the vehicle. For the engine fuel map the contribution is e.g. 100%, for the losses in the gear box the contribution is 3.5%. The values were obtained from VECTO simulations with the generic standard vehicles as defined in 2016 with VECTO 3.1 release.
The total uncertainty of the single uncertainties is calculated in two ways
According to the “Gauss error propagation law”:
a) Equation 1: u = √(u1 ∗ s1)2 + (u2 ∗ s2)
2 +⋯ . (un ∗ sn)2

Service contract CLIMA.C.2/SER/2012/0004 Draft final Report
88
where:
ui .......... uncertainty of the contributor i
si .......... share of the the contributor i on the fuel consumption of the vehicle
u .......... total uncertainty with 98% probability
b) Simple sum of uncertainties:
Equation 2: 𝑢 = 𝑢1 + 𝑢2 +⋯…𝑢𝑛
The option a) is relevant for uncertainties which are independent from each other and considers that the probability that all single contributors are combined with the worst case uncertainty is decreasing with the number of contributors considered. Thus the uncertainty according to a) is lower than according to b) where a dependency between the single uncertainties is assumed. E.g. a very dynamic driving style would increase the transient effects at the engine efficiency and also the number of gear shifts at the same time. The uncertainty analysis shows both results for combined uncertainties and suggests which of them is more representative.
Bottom up approach
Influence of auxiliaries in EPTPs
The auxiliaries are simulated in VECTO with generic power consumption values. These are based on generic work delivered over the cycles (e.g. electric energy consumed) and efficiency values of the auxiliaries (e.g. alternator efficiency).
Thus the real auxiliary behaviour may be quite different from the generic one. However, this is a deviation which shall not be part of the verification of input data. As long as the correct auxiliary technologies were selected, the related uncertainties shall be quantified and shall be considered in the tolerances defined for the EPTP.
A tractor-trailer (GVWR 40 t, with a rated engine power of 324 kW) was simulated with VECTO on different test conditions for the assessment of the variability to be expected from auxiliaries in the different test options:
I. The VECTO Long Haul (LH) and Regional Delivery (RD) cycle.
II. A possible steady state EPTP from the results from I.: with the weightings 2 times LH and 1 time RD the three most frequent gears were determined, here 12, 11 and 10. Then for every gear the four most frequent engine operation points were chosen. The results were subdivided into classes of 50 rpm engine speed and 20 kW wheel power, and the four classes with the highest share of fuel consumption were identified. To avoid a dense cluster of operation points, classes of speed and power which are side by side were omitted. I. e. if the 3rd-highest FC occurs at 1150 rpm, 200kW, the 4th-highest at 1150 rpm, 220 kW and the 5th highest at 1150 rpm, 120 kW, the latter class was chosen as operation point 4. Then a provisional driving cycle for the 3 x 4 operation points was created, where every point is constant for 5 min and followed by a transition of 2 min to the next point. For the analysis below only the measurement phases at constant speed and load were analysed.
The variations in auxiliary power demand in the simulation are described below.
Power demand fan
The driving cycles were simulated with default settings and the VECTO outcome was used as input data for a post processing. For each cycle simulated the “Willans factor”, i.e. the change of fuel mass per change of engine cycle work, was calculated. The

Service contract CLIMA.C.2/SER/2012/0004 Draft final Report
89
Willans factor is then used to convert variabilities in the power demand from the fan into the corresponding variability in fuel consumption during the test setting all other parameters constant.
Possible fan power consumption under different driving situations were calculated with a simulation model for the fan described in [2].
Following fan situations were calculated:
Fan disconnected (0 kW power demand): The accumulated mechanical work of the fan during the cycles was determined from the default constant fan power (LH 0.62 kW, RD 0.67 kW). It was multiplied with the Willans factor and subtracted from the overall FC.
Chassis dyno (steady state and transient cycle): Ambient temperature 20 °C, headwind velocity from blower 20 km/h
Test track and road (steady state and transient cycle): Ambient temperature 30 °C, headwind velocity equals vehicle velocity.
The fuel consumption due to the fan engagement was calculated for the possible EPTP test methods listed before (steady state versus transient real world cycle and chassis dyno versus test track or road).
Table 14. Variability in fuel consumption calculated for the tractor trailer combination
Cycle Steady state Transient cycle
Test stand chassis dyno road chassis dyno road
For amb. Temp. Tamb 20 °C Tamb 30 °C Tamb 20 °C Tamb 30 °C
Wind situation blower 20 km/h Headwind =vveh blower 20 km/h Headwind =vveh
Wwheel,pos [kWh] 169.6 169.6 98.6 98.6
FC fan on [g/h] 37 125 37 012 20 644 20 501
FC fan off [g/h] 36 106 36 106 20 378 20 378
% uncertainty 2.8 2.5 1.3 0.6
Power demand alternator
The fuel consumption simulated with VECTO for the tractor-trailer model without the default power demand of the alternator (LH cycle: 1.71 kWmech, RD cycle: 1.43 kWmech) was determined as described above for the fan variabilities.
With two performance maps of HDV alternators, one of an older type with external mounted fan (average efficiency ca. 52 %) and one of the actual type with internal mounted fan (average efficiency ca. 75 %) and the default values for the electric power demand (LH cycle 1.2 kWel, RD cycle 1.0 kWel) the mechanical power and work of the alternator types were calculated. Via the work and the Willans factor the FC for both alternator types was calculated.

Service contract CLIMA.C.2/SER/2012/0004 Draft final Report
90
Table 15: Variability in fuel consumption simulated from variability of the alternator efficiency at fixed electric energy consumption
Cycle Steady state Transient cycle
Test stand chassis dyno road chassis dyno road
Wwheel,pos in kWh 169.6 169.6 98.6 98.6
FC high [g/h] 36 404 36 404 20 592 20 592
FC low [g/h] 36 205 36 205 20 470 20 470
% uncertainty 0.5 0.5 0.6 0.6
In addition the uncertainty from the electric energy consumption itself was determined for the case low alternator performance and half electric load by simulating also the option that the alternator is not active. This situation can occur in case of smart alternator controllers if the battery SOC is high enough and the engine operates at positive load. With most consumers inactive in an EPTP set up, the battery capacity may be sufficient for more than 30 minutes driving without battery charging. The electric power consumption applied was 0.6 kW in the LH cycle and 0.5 kW in the RD cycle.
Table 16. Variability in fuel consumption simulated due to alternator on/off condition
Cycle Steady state Transient cycle
Test stand chassis dyno road chassis dyno road
Wwheel,pos [kWh] 169.6 169.6 98.6 98.6
FC altern. on [g/h] 36 236 36 236 20 444 20 444
FC altern. off [g/h] 35 906 35 906 20 197 20 197
% uncertainty 0.9 0.9 1.2 1.2
Power demand A/C
As for the other auxiliaries the fuel consumption was simulated without HVAC, with the generic power demand of the HVAC (LH cycle 0.35 kW, RD cycle 0.2 kW) and with a more detailed model for Air conditioning systems. The effects of variations in the power demand were again translated to changes in the fuel consumption using the Willans curve for the specific cycle. Comparing the results allows an assessment of possible deviations in the AC related fuel consumption demand against the generic values used by VECTO.
In the first step the heat radiation from the sun through the windows was calculated using a tool elaborated during the development of the MAC test procedure for LDV to assess heat entrance due to radiation and heat transfer through glasses, [14]:
The following general settings were used in the software:
Area of windows: 2.5 m * 1 m + 2 * 0.8 m * 0.8 m = 3.78 m²
Sun intensity = 700 W/m²
Headwind velocity = 50 km/h
Window angle = 89 °
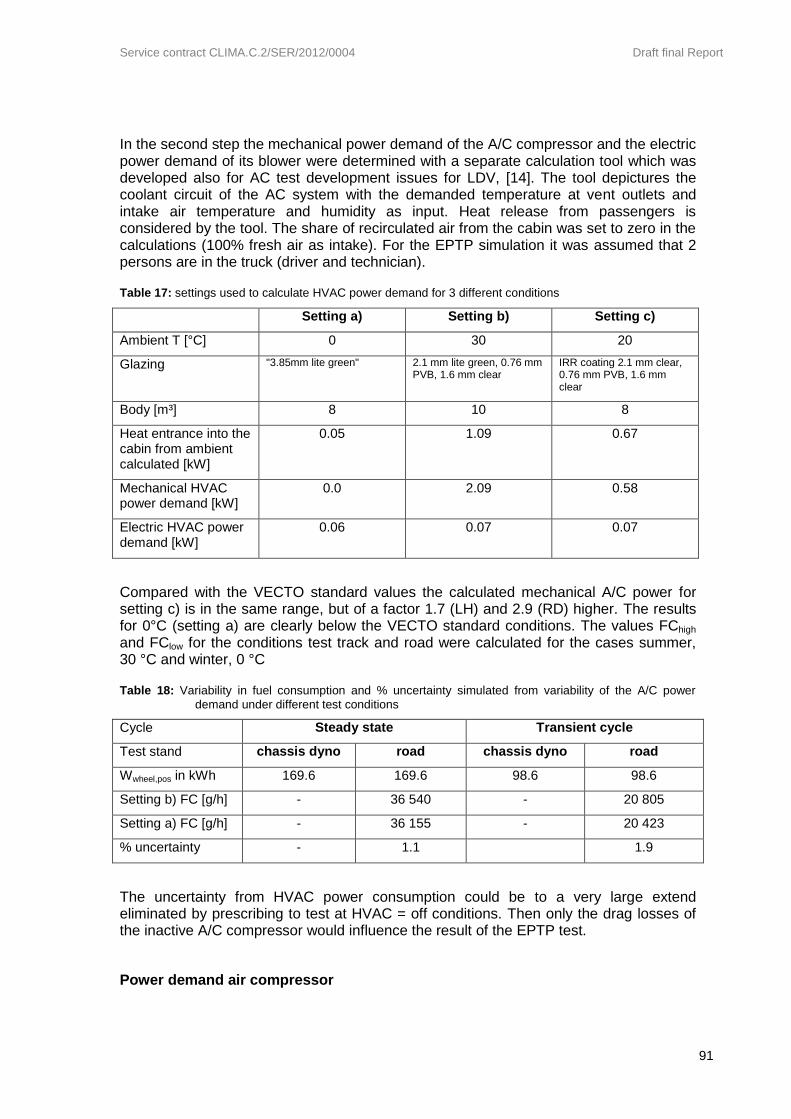
Service contract CLIMA.C.2/SER/2012/0004 Draft final Report
91
In the second step the mechanical power demand of the A/C compressor and the electric power demand of its blower were determined with a separate calculation tool which was developed also for AC test development issues for LDV, [14]. The tool depictures the coolant circuit of the AC system with the demanded temperature at vent outlets and intake air temperature and humidity as input. Heat release from passengers is considered by the tool. The share of recirculated air from the cabin was set to zero in the calculations (100% fresh air as intake). For the EPTP simulation it was assumed that 2 persons are in the truck (driver and technician).
Table 17: settings used to calculate HVAC power demand for 3 different conditions
Setting a) Setting b) Setting c)
Ambient T [°C] 0 30 20
Glazing "3.85mm lite green" 2.1 mm lite green, 0.76 mm PVB, 1.6 mm clear
IRR coating 2.1 mm clear, 0.76 mm PVB, 1.6 mm clear
Body [m³] 8 10 8
Heat entrance into the cabin from ambient calculated [kW]
0.05 1.09 0.67
Mechanical HVAC power demand [kW]
0.0 2.09 0.58
Electric HVAC power demand [kW]
0.06 0.07 0.07
Compared with the VECTO standard values the calculated mechanical A/C power for setting c) is in the same range, but of a factor 1.7 (LH) and 2.9 (RD) higher. The results for 0°C (setting a) are clearly below the VECTO standard conditions. The values FChigh and FClow for the conditions test track and road were calculated for the cases summer, 30 °C and winter, 0 °C
Table 18: Variability in fuel consumption and % uncertainty simulated from variability of the A/C power
demand under different test conditions
Cycle Steady state Transient cycle
Test stand chassis dyno road chassis dyno road
Wwheel,pos in kWh 169.6 169.6 98.6 98.6
Setting b) FC [g/h] - 36 540 - 20 805
Setting a) FC [g/h] - 36 155 - 20 423
% uncertainty - 1.1 1.9
The uncertainty from HVAC power consumption could be to a very large extend eliminated by prescribing to test at HVAC = off conditions. Then only the drag losses of the inactive A/C compressor would influence the result of the EPTP test.
Power demand air compressor

Service contract CLIMA.C.2/SER/2012/0004 Draft final Report
92
A VECTO model of a delivery truck with 12t GVWR and a rated engine power of 154 kW was used as basis here. The driving cycle Urban Delivery (UD) was simulated with default settings in VECTO and the outcome was used as input data for the post processing.
Variations of the compressor power within one technology stage cannot be determined with available data. Thus the FC from the vehicle model with a simulated compressor power for different testing conditions was compared with the overall FC for the default compressor power (UD 0.90 kW).
The analysed compressor model with ESS (Energy Saving System = reduced idle losses) was deduced from a measured compressor of a delivery truck 12 t [2]. For the VECTO cycle on the road a worst case air consumption was assumed which includes a lot of braking – e.g. due to having a traffic jam during the test - and a high consumption of the air suspension due to a jigging body. Like described above for the tractor-trailer, the FC of the truck model was calculated with the Willans factor, and the overall FC from the model was compared with the FC from the ACEA default compressor power. For chassis dyno lower air consumption for the suspension and braking was assumed than for on-road tests. For steady state no air consumption during the test for braking was assumed.
Table 19: Variability in fuel consumption and % uncertainty simulated from variability of the compressor power
Cycle Steady state Transient cycle
Test stand chassis dyno road chassis dyno road
Wwheel,pos in kWh 76.2 76.2 21.1 21.1
Calculated FC [g/h] 16 776 16 787 6 332 6 392
Generic data, FC [g/h] 16 764 16 764 6 340 6 340
% deviation 0.07 0.14 -0.1 0.8
The air consumption would mainly be a relevant source of uncertainty in a test on the road if a lot of braking on uneven roads happens. If the air system has possibly leakages may be checked before an EPTP test and is not analysed here.
Power demand steering pump
The differences in fuel consumption were calculated for the model of the delivery truck described above. The default power value for the steering pump was applied for on-road testing (UD cycle 0.31 kW). For the conditions "chassis dyno" and "test track" only the relevant shares of the average steering pump power were applied: Idle 0.26 kW for the dyno and idle 0.26 kW + banking 0.02 kW for the test track. The average power of 0.03 kW for the literal steering in curves occurs only in the "road" setting.
For the model it was assumed, that on the chassis dyno only the idling power applies, during a test on the track idle + banking and on the road the highest power: Idle + double banking + double steering. The model results were compared with the simulation output with the VECTO default steering power.
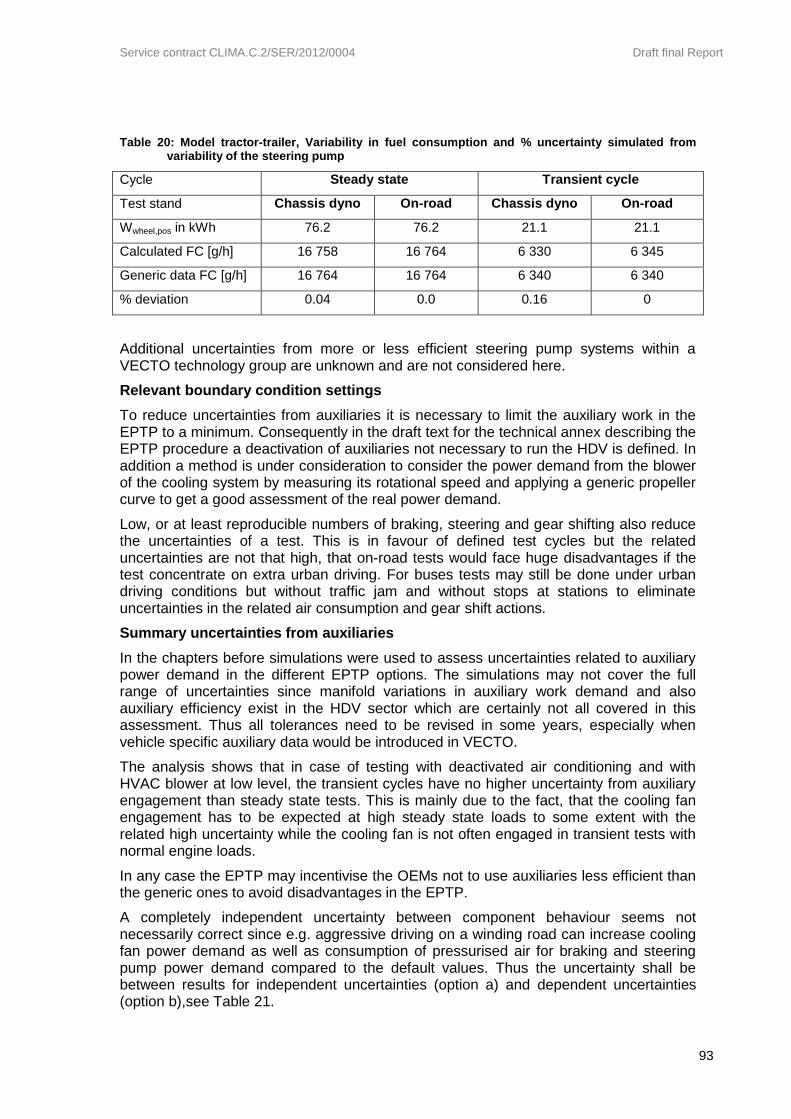
Service contract CLIMA.C.2/SER/2012/0004 Draft final Report
93
Table 20: Model tractor-trailer, Variability in fuel consumption and % uncertainty simulated from variability of the steering pump
Cycle Steady state Transient cycle
Test stand Chassis dyno On-road Chassis dyno On-road
Wwheel,pos in kWh 76.2 76.2 21.1 21.1
Calculated FC [g/h] 16 758 16 764 6 330 6 345
Generic data FC [g/h] 16 764 16 764 6 340 6 340
% deviation 0.04 0.0 0.16 0
Additional uncertainties from more or less efficient steering pump systems within a VECTO technology group are unknown and are not considered here.
Relevant boundary condition settings
To reduce uncertainties from auxiliaries it is necessary to limit the auxiliary work in the EPTP to a minimum. Consequently in the draft text for the technical annex describing the EPTP procedure a deactivation of auxiliaries not necessary to run the HDV is defined. In addition a method is under consideration to consider the power demand from the blower of the cooling system by measuring its rotational speed and applying a generic propeller curve to get a good assessment of the real power demand.
Low, or at least reproducible numbers of braking, steering and gear shifting also reduce the uncertainties of a test. This is in favour of defined test cycles but the related uncertainties are not that high, that on-road tests would face huge disadvantages if the test concentrate on extra urban driving. For buses tests may still be done under urban driving conditions but without traffic jam and without stops at stations to eliminate uncertainties in the related air consumption and gear shift actions.
Summary uncertainties from auxiliaries
In the chapters before simulations were used to assess uncertainties related to auxiliary power demand in the different EPTP options. The simulations may not cover the full range of uncertainties since manifold variations in auxiliary work demand and also auxiliary efficiency exist in the HDV sector which are certainly not all covered in this assessment. Thus all tolerances need to be revised in some years, especially when vehicle specific auxiliary data would be introduced in VECTO.
The analysis shows that in case of testing with deactivated air conditioning and with HVAC blower at low level, the transient cycles have no higher uncertainty from auxiliary engagement than steady state tests. This is mainly due to the fact, that the cooling fan engagement has to be expected at high steady state loads to some extent with the related high uncertainty while the cooling fan is not often engaged in transient tests with normal engine loads.
In any case the EPTP may incentivise the OEMs not to use auxiliaries less efficient than the generic ones to avoid disadvantages in the EPTP.
A completely independent uncertainty between component behaviour seems not necessarily correct since e.g. aggressive driving on a winding road can increase cooling fan power demand as well as consumption of pressurised air for braking and steering pump power demand compared to the default values. Thus the uncertainty shall be between results for independent uncertainties (option a) and dependent uncertainties (option b),see Table 21.
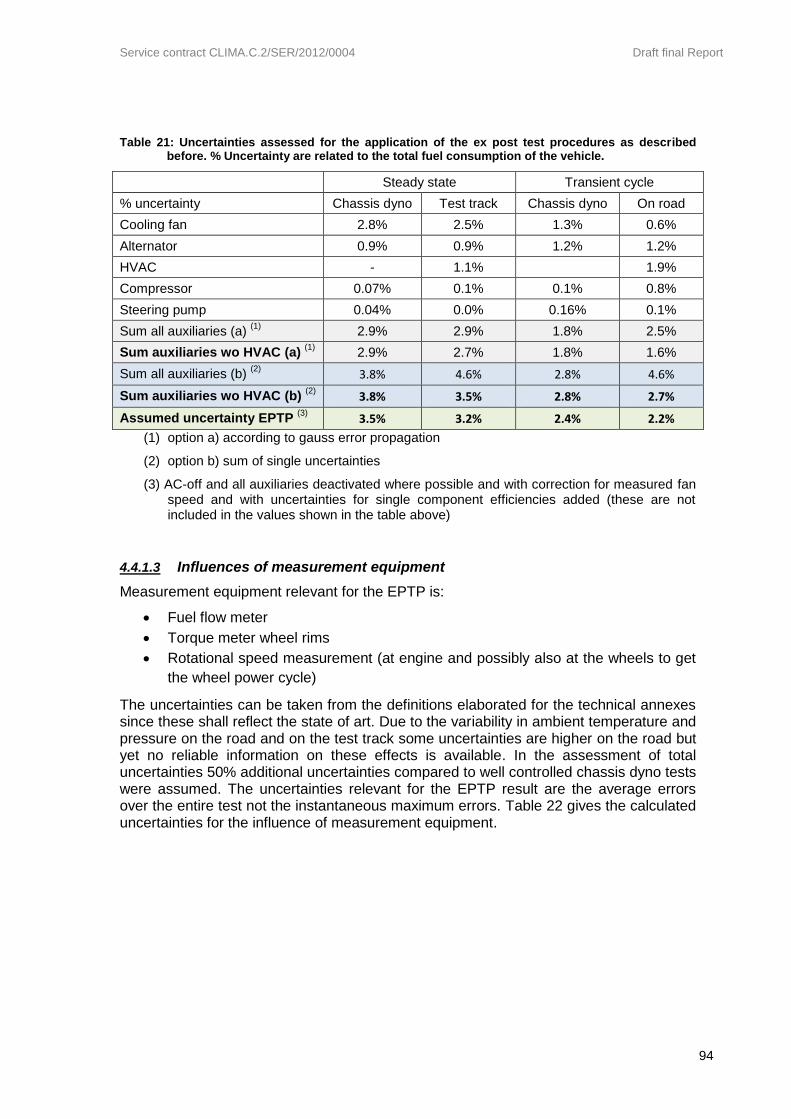
Service contract CLIMA.C.2/SER/2012/0004 Draft final Report
94
Table 21: Uncertainties assessed for the application of the ex post test procedures as described before. % Uncertainty are related to the total fuel consumption of the vehicle.
Steady state Transient cycle
% uncertainty Chassis dyno Test track Chassis dyno On road
Cooling fan 2.8% 2.5% 1.3% 0.6%
Alternator 0.9% 0.9% 1.2% 1.2%
HVAC - 1.1% 1.9%
Compressor 0.07% 0.1% 0.1% 0.8%
Steering pump 0.04% 0.0% 0.16% 0.1%
Sum all auxiliaries (a) (1)
2.9% 2.9% 1.8% 2.5%
Sum auxiliaries wo HVAC (a) (1)
2.9% 2.7% 1.8% 1.6%
Sum all auxiliaries (b) (2)
3.8% 4.6% 2.8% 4.6%
Sum auxiliaries wo HVAC (b) (2)
3.8% 3.5% 2.8% 2.7%
Assumed uncertainty EPTP (3)
3.5% 3.2% 2.4% 2.2%
(1) option a) according to gauss error propagation
(2) option b) sum of single uncertainties
(3) AC-off and all auxiliaries deactivated where possible and with correction for measured fan speed and with uncertainties for single component efficiencies added (these are not included in the values shown in the table above)
4.4.1.3 Influences of measurement equipment
Measurement equipment relevant for the EPTP is:
Fuel flow meter
Torque meter wheel rims
Rotational speed measurement (at engine and possibly also at the wheels to get
the wheel power cycle)
The uncertainties can be taken from the definitions elaborated for the technical annexes since these shall reflect the state of art. Due to the variability in ambient temperature and pressure on the road and on the test track some uncertainties are higher on the road but yet no reliable information on these effects is available. In the assessment of total uncertainties 50% additional uncertainties compared to well controlled chassis dyno tests were assumed. The uncertainties relevant for the EPTP result are the average errors over the entire test not the instantaneous maximum errors. Table 22 gives the calculated uncertainties for the influence of measurement equipment.

Service contract CLIMA.C.2/SER/2012/0004 Draft final Report
95
Table 22: Uncertainties assessed for the influence of measurement equipment
Steady state Transient cycle
% uncertainty Chassis
dyno Test track
Chassis dyno
On road
Rotational speed at wheels 0.40% 0.40% 0.40% 0.40%
Torque at wheel rims 0.40% 0.50% 0.40% 0.50%
Uncertainty from cornering (1)
0.00% 0.30% 0.00% 0.30%
Total power at wheels 0.80% 1.20% 0.80% 1.20%
Rotational speed engine 0.20% 0.20% 0.20% 0.20%
VECTO fuel interpolation result (2) 0.80% 1.20% 0.80% 1.20%
Fuel mass flow measured on-board (3)
1% 1.50% 1% 1.50%
Total error in g/kWh option a) 1.28% 1.92% 1.28% 1.92%
Total error in g/kWh option b) 1.80% 2.70% 1.80% 2.70%
Measurement uncertaintly considered already by CoP
(4)
0.90% 0.90% 0.90% 0.90%
Error assumed for EPTP - CoP uncertainty added later
0.6% 1.4% 0.6% 1.4%
option a) according to gauss error propagation
option b) sum of single uncertainties
(1)… cornering during on-road tests is a relevant part of the test an additional uncertainty is assumed due to the different rotational speeds and the different torque at the inner and outer wheels.
(2)… the fuel flow interpolated by VECTO from the steady state map depends on engine speed and torque. The uncertainty in the overall fuel consumption related to 0.2% rpm error is assumed to be negligible. Thus the uncertainty for the VECTO result is manly based on the wheel power uncertainties which influence fuel consumption proportional.
(3)… shall cover also gaseous fuels
(4)…the uncertainty from variations in component tests are considered separately later and includes also measurement uncertainties (see Table 24).
4.4.1.4 Uncertainties from effects not considered in VECTO
Main effects not or not fully covered in VECTO relevant for the EPTP accuracy are:
Transient effects on engine efficiency (only by WHTC correction functions)
Different temperature levels of axle, transmission and engine compared to
component tests
Different temperature levels of exhaust gas after-treatment systems which may
cause active heating by the engine
Energy losses during gear changes (additional to engine transient effects)

Service contract CLIMA.C.2/SER/2012/0004 Draft final Report
96
It has to be noted, that the uncertainty here is related to the case that a measured wheel power and a measured engine speed are used as VECTO input. Thus the uncertainty covers only the drive train, not the simulation of road loads or the driver behaviour. The worst case overall uncertainties for simulating o-road driving just from measured speed and road gradients are thus clearly higher than shown here.
No data is yet available to assess the related uncertainties in scientific sound way. The values in Table 23 are based on limited data and expert views.
Table 23: Uncertainties from effects not considered in VECTO
Steady state Transient cycle
% uncertainty Chassis dyno Test track Chassis dyno On road
Transient engine effects 0% 0% 1.5% 1.5%
Gear shifts 0% 0% 1% 1%
Temperatures transmission and engine
0.5% 1.0% 1.0% 1.5%
Exhaust aftertreatment temperatures
0.5% 2% 0.5% 2%
Total according to option b)
1.0% 3.0% 4.0% 6.0%
Total for tighter test conditions
(1)
0.7% 2.0% 2.7% 4.0%
(1) Test only above 10°C ambient temperature and dry conditions, 1 hour warm up with allowance to
run maximum speed and limited idling time and limit for minimum average urban speeds and low
share of urban driving within the total test.
Option a) not applicable here, since systematic errors are rather not independent. E.g. a trip at 10°C in dynamic driving on a winding road with hilly topography where downhill driving makes SCR heating necessary may combine several effects underestimating the real fuel consumption by VECTO.
Option b) sum of single uncertainties relevant here.
4.4.1.5 Tolerances for serial production and for component tests
Compared to the certified components the tested parts from serial production are allowed to have deviations due to tolerances in the production process. In addition the VECTO component input data gained from the certification tests includes uncertainties from the test procedure. The entire uncertainty per component is summarised in the CoP tolerances defined for each component in the actual technical annexes.
These CoP tolerances allowed for engine, gear box and axle have thus to be added to the overall uncertainties of the EPTP to reach reasonable limits for tolerances between test results at a vehicle from serial productions and the simulation results of the tests with VECTO component data from the component certification.
For the calculation of the total CoP related uncertainty, all CoP tolerances were converted to tolerances in g/kWh
𝑔𝑓𝑢𝑒𝑙
𝑘𝑊ℎ𝑚𝑒𝑐ℎ=
1000
Eta𝑖×LHV𝑓𝑢𝑒𝑙 with: Etai….Efficiency of the component [%/100]
LHV….11.81 g/kWh used here
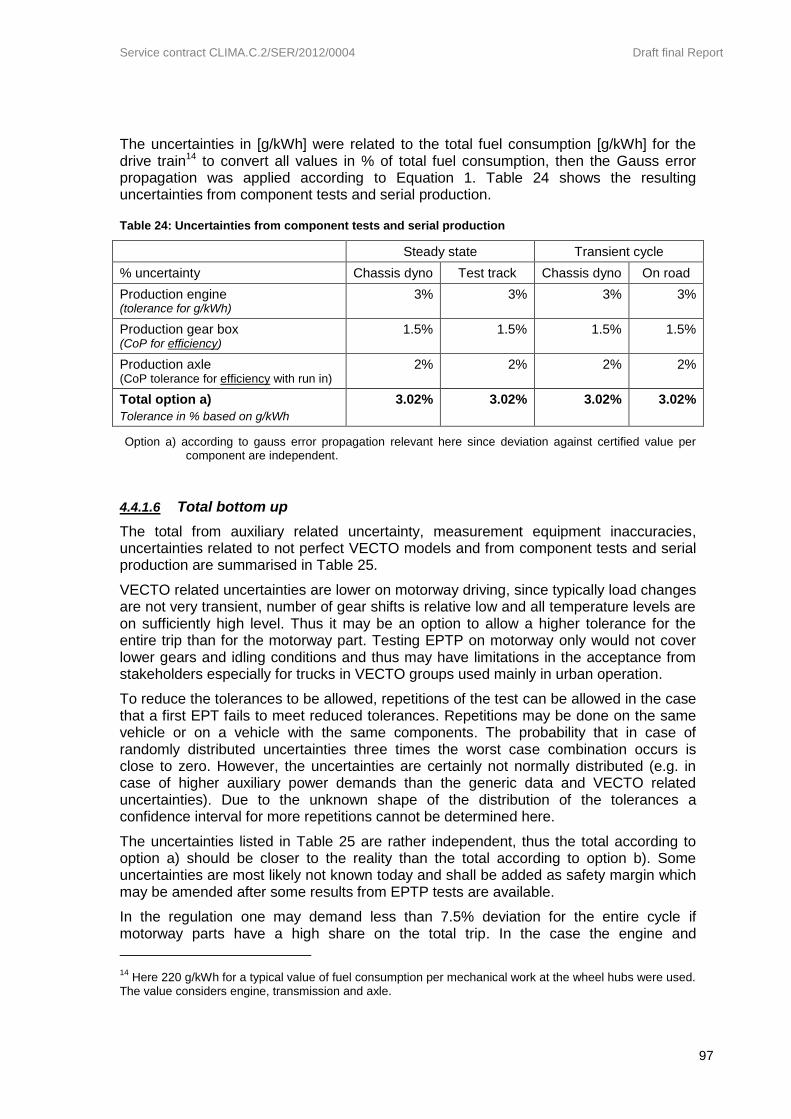
Service contract CLIMA.C.2/SER/2012/0004 Draft final Report
97
The uncertainties in [g/kWh] were related to the total fuel consumption [g/kWh] for the drive train14 to convert all values in % of total fuel consumption, then the Gauss error propagation was applied according to Equation 1. Table 24 shows the resulting uncertainties from component tests and serial production.
Table 24: Uncertainties from component tests and serial production
Steady state Transient cycle
% uncertainty Chassis dyno Test track Chassis dyno On road
Production engine (tolerance for g/kWh)
3% 3% 3% 3%
Production gear box (CoP for efficiency)
1.5% 1.5% 1.5% 1.5%
Production axle (CoP tolerance for efficiency with run in)
2% 2% 2% 2%
Total option a)
Tolerance in % based on g/kWh
3.02% 3.02% 3.02% 3.02%
Option a) according to gauss error propagation relevant here since deviation against certified value per component are independent.
4.4.1.6 Total bottom up
The total from auxiliary related uncertainty, measurement equipment inaccuracies, uncertainties related to not perfect VECTO models and from component tests and serial production are summarised in Table 25.
VECTO related uncertainties are lower on motorway driving, since typically load changes are not very transient, number of gear shifts is relative low and all temperature levels are on sufficiently high level. Thus it may be an option to allow a higher tolerance for the entire trip than for the motorway part. Testing EPTP on motorway only would not cover lower gears and idling conditions and thus may have limitations in the acceptance from stakeholders especially for trucks in VECTO groups used mainly in urban operation.
To reduce the tolerances to be allowed, repetitions of the test can be allowed in the case that a first EPT fails to meet reduced tolerances. Repetitions may be done on the same vehicle or on a vehicle with the same components. The probability that in case of randomly distributed uncertainties three times the worst case combination occurs is close to zero. However, the uncertainties are certainly not normally distributed (e.g. in case of higher auxiliary power demands than the generic data and VECTO related uncertainties). Due to the unknown shape of the distribution of the tolerances a confidence interval for more repetitions cannot be determined here.
The uncertainties listed in Table 25 are rather independent, thus the total according to option a) should be closer to the reality than the total according to option b). Some uncertainties are most likely not known today and shall be added as safety margin which may be amended after some results from EPTP tests are available.
In the regulation one may demand less than 7.5% deviation for the entire cycle if motorway parts have a high share on the total trip. In the case the engine and
14
Here 220 g/kWh for a typical value of fuel consumption per mechanical work at the wheel hubs were used. The value considers engine, transmission and axle.

Service contract CLIMA.C.2/SER/2012/0004 Draft final Report
98
transmission are very sensitive to transient loads and the test cycle is driven quite aggressive, one can also allow more deviation for the total trip (due to high effects from the driving style) but ask for a better agreement in the motorway part of the test (e.g. below 6%).
Table 25: Total uncertainties bottom-up
Steady state Transient cycle
% uncertainty Chassis
dyno Test track
Chassis dyno
On road
Auxiliaries without A/C 3.50% 3.20% 2.40% 2.20%
Measurement equipment 0.64% 1.41% 0.64% 1.41%
VECTO model uncertainty 1.00% 3.00% 4.00% 6.00%
CoP of component tests 3.02% 3.02% 3.02% 3.02%
VECTO tighter uncertainty (1)
0.70% 2.00% 2.70% 4.00%
Total bottom up (option a) 4.8% 5.5% 5.6% 7.2%
Total motorway (option a) 4.7% 5.0% 4.8% 5.7%
Total bottom up (option b) 8.2% 10.6% 10.1% 12.6%
Total motorway (option b) 7.9% 9.6% 8.8% 10.6%
(1) VECTO model uncertainties for tighter test conditions: test only above 10°C ambient temperature and
dry conditions, 1 hour warm up with allowance to run maximum speed and limited idling time and limit
for minimum average urban speeds.
option a) according to gauss error propagation; option b) sum of single uncertainties
4.4.1.7 Top down approach
For the top down approach the deviations between VECTO simulation and measurements have been collected from all partners in the CO2 certification development (OEMs, JRC, TUG).
It has to be noted, that not any of these tests followed the EPTP procedure drafted in the technical annex completely. Table 26 summarises the average absolute deviations found between measured and VECTO-simulated fuel consumption as well as the maximum positive deviation (measured value higher than simulated value).
Special conditions were reported at tests from OEM No. 4 at the steady state tests. Due to technical issues and time constraints only 3 test points were used and the fuel consumption was gained by the CAN signal only. Furthermore only one of the two torque meter wheel hobs worked properly.
Although the number of useful tests is limited, the results from the top down approach reflect by the bottom up assessments:
The average absolute deviations are comparable between the test methods and are below the 98% percentile uncertainties calculated in the bottom up approach which is 5% to 10% depending on the test method and evaluation option concerned.
Single tests show deviations of more than the approx.13% uncertainty identified in the bottom up approach. Possibly also the test set up and simulation methods
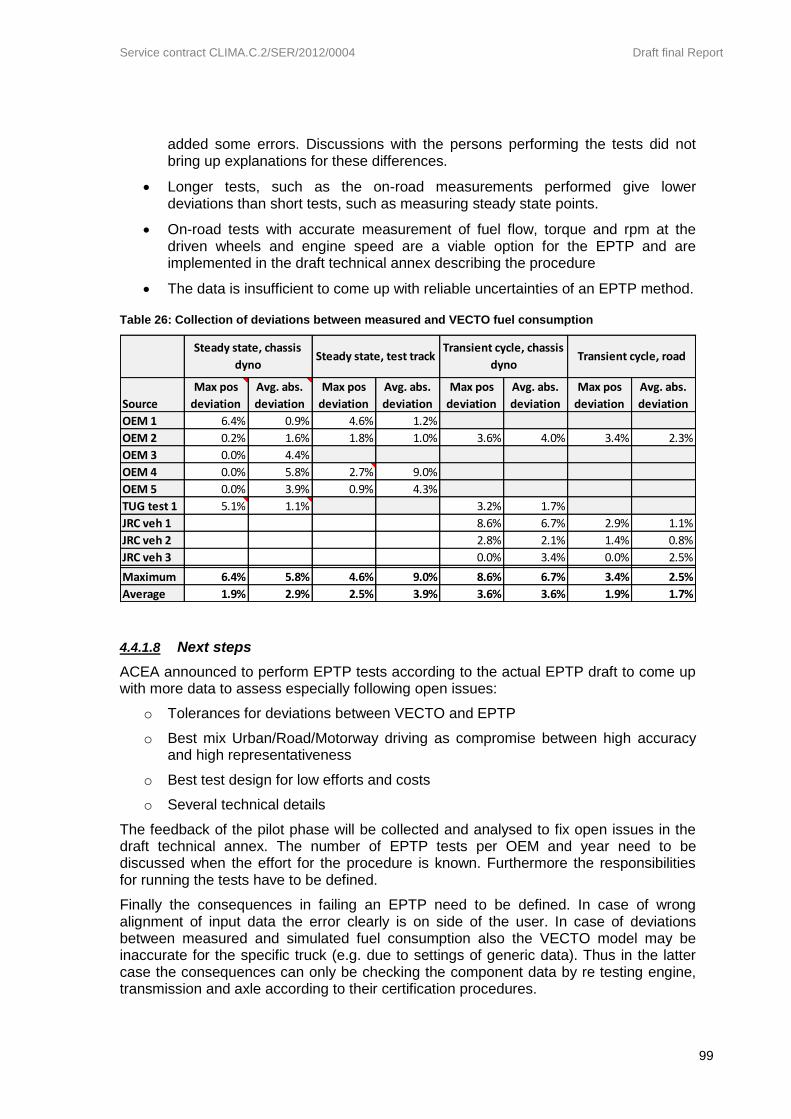
Service contract CLIMA.C.2/SER/2012/0004 Draft final Report
99
added some errors. Discussions with the persons performing the tests did not bring up explanations for these differences.
Longer tests, such as the on-road measurements performed give lower deviations than short tests, such as measuring steady state points.
On-road tests with accurate measurement of fuel flow, torque and rpm at the driven wheels and engine speed are a viable option for the EPTP and are implemented in the draft technical annex describing the procedure
The data is insufficient to come up with reliable uncertainties of an EPTP method.
Table 26: Collection of deviations between measured and VECTO fuel consumption
4.4.1.8 Next steps
ACEA announced to perform EPTP tests according to the actual EPTP draft to come up with more data to assess especially following open issues:
o Tolerances for deviations between VECTO and EPTP
o Best mix Urban/Road/Motorway driving as compromise between high accuracy and high representativeness
o Best test design for low efforts and costs
o Several technical details
The feedback of the pilot phase will be collected and analysed to fix open issues in the draft technical annex. The number of EPTP tests per OEM and year need to be discussed when the effort for the procedure is known. Furthermore the responsibilities for running the tests have to be defined.
Finally the consequences in failing an EPTP need to be defined. In case of wrong alignment of input data the error clearly is on side of the user. In case of deviations between measured and simulated fuel consumption also the VECTO model may be inaccurate for the specific truck (e.g. due to settings of generic data). Thus in the latter case the consequences can only be checking the component data by re testing engine, transmission and axle according to their certification procedures.
Source
Max pos
deviation
Avg. abs.
deviation
Max pos
deviation
Avg. abs.
deviation
Max pos
deviation
Avg. abs.
deviation
Max pos
deviation
Avg. abs.
deviation
OEM 1 6.4% 0.9% 4.6% 1.2%
OEM 2 0.2% 1.6% 1.8% 1.0% 3.6% 4.0% 3.4% 2.3%
OEM 3 0.0% 4.4%
OEM 4 0.0% 5.8% 2.7% 9.0%
OEM 5 0.0% 3.9% 0.9% 4.3%
TUG test 1 5.1% 1.1% 3.2% 1.7%
JRC veh 1 8.6% 6.7% 2.9% 1.1%
JRC veh 2 2.8% 2.1% 1.4% 0.8%
JRC veh 3 0.0% 3.4% 0.0% 2.5%
Maximum 6.4% 5.8% 4.6% 9.0% 8.6% 6.7% 3.4% 2.5%
Average 1.9% 2.9% 2.5% 3.9% 3.6% 3.6% 1.9% 1.7%
Steady state, chassis
dynoSteady state, test track
Transient cycle, chassis
dynoTransient cycle, road

Service contract CLIMA.C.2/SER/2012/0004 Draft final Report
100
4.5 Regulatory description
From the previous projects LOT2 and LOT3 already the main approaches for the HDV CO2 certification with VECTO had been elaborated. Also a “draft technical annex” has been elaborated as one of the main deliverables of LOT3. This document however, was neither complete from a technical point of view nor did it cover crucial points like family concepts and CoP testing.
During the SR7 project the technical annexes have been further developed continuously until to the final documents as adopted by the TCMV on the 11th of May 2017. In the first phase until summer 2015 the main focus was set on completing all technical issues (like 100% complete description of the test procedures, definition of measurement equipment tolerances etc.) in order to have solid baseline technical document for the pilot phase activities. In the second phase of SR7 the following open issues have been analysed, intensively discussed with stakeholders (COM, industry and NGOs) and put into a legislative text:
Optimisations and necessary amendments on all parts of the annexes according to the feedback collected from the pilot phase and the discussions in the expert groups
Family concepts, which allow for reduced component testing efforts by grouping different model types with similar CO2 relevant performance into “families”. The crucial point in well-defined criteria, which allow for grouping of different models/types into a family, was to find a balance between testing demands for OEMs and accuracy of the generated VECTO component data. As a main principle for all components it is defined that the model/type which shows the worst CO2 related performance shall be the parent of the family to be applicable to certified component testing. By performing additional tests the OEM can furthermore decide to introduce additional families which have better CO2 related performance.
Elaboration of “standard values” (or “fall-back values”) which shall be applied as VECTO input data for components which are not measured according to the relevant component test procedures (e.g. for small series products). Standard values or formulas have been reviewed and fine-tuned by industry and consultants in order to incentivise to perform component tests (measured components shall always show better performance than using standard values). This exercise was in particular challenging for transmissions, as several options for combining component tests with the use of standard values or formulas exist.
Provisions for Conformity of Production testing. This includes:
o Definition of the test procedure to be applied to components selected for CoP
o Elaboration of tolerances and test statistics for a pass/fail decision
o Definition of number of components which shall be CoP tested per OEM and year
The main issues, which emerged during the work on the above mentioned items during SR7, are documented in chapter 4.2.
Parts of the generic data implemented in VECTO like CO2 cycles, payloads and cargo volumes have been decided by DG GROW not to be incorporated into the legislative texts. For this data section 4.3.5 of this report serves as the main documentation. Data
Service contract CLIMA.C.2/SER/2012/0004 Draft final Report
101
on auxiliaries as well as definitions of standard bodies and semi-trailer are also described in the technical annexes.
During the course of SR7 two additional crucial points in the implementation of VECTO in the HDV CO2 certification emerged:
a) The ability of VECTO to be fully integrated into the IT processes as established at the OEMs
As VECTO will be used both for certification of each produced vehicle which rolls off from the assembly line as well as for customer information for each vehicle which is inquired in the sales process, the necessary VECTO simulations (combinations of vehicles, cycles and payloads) might be in the 10.000s per OEM and day. Hence a fully automatized process to couple OEM product databases with VECTO and to further process the VECTO output is inevitable. To establish such a VECTO implementation an IT group was launched with ACEA and main suppliers as well as the VECTO IT team participating. Outcome of the work are provisions for VECTO input and output data (XML schemas for component input data as well as for a complete vehicle (“job”)) which have been also implemented as separate Appendices to all relevant annexes of the HDV CO2 legislation or have been included into the legislation by reference.
b) Measures to ensure the integrity of electronic data flow from certified component data, VECTO calculations performed for the complete vehicles and CO2 results reported to the approval authorities and to the customer
The results produced by VECTO simulations are legally binding documents for declaring CO2 emissions of HDVs in the upcoming legislation. Also the input data for VECTO, i.e. component measurement data, are certified by TAAs and thus legally valid. As a consequence the integrity of these electronically stored and exchanged data has to be ensured during the whole certification process and conformity of production activities.
During the SR7 project the implementation of such integrity measures was prepared by discussing requirements of potential methods and the applicable use cases in the legislative processes with the Commission and with industry. The work on this topic is continued in the DG CLIMA Contract No 356/PP/2014/FC.
5 Application of the VECTO method for HDV groups not covered by the actual HDV CO2 legislation
The VECTO method as elaborated by the end of the SR7 project does not (fully) cover the following vehicle groups/categories:
i. Buses and coaches (M3 vehicles)
For M3 buses and coaches (B&C) special requirements exist for component testing, physical VECTO models as well as generic datasets to be used in the CO2 certification. The work on the methods for B&C performed within SR7 and the status quo at the end of the project is described in section 5.1.
ii. Intermediate-size vehicles (3.51 to 7.49 tons GVWR) both for transportation of goods (N2) as well as for persons (M2)

Service contract CLIMA.C.2/SER/2012/0004 Draft final Report
102
Commercial vehicles in the maximum GVW range from 3.51 to 7.49 tons are a special case in terms of CO2 certification. Background is the fact that in this vehicle segment two different options for pollutant emissions certification exist (LDV regulation with the WLTP test procedure as well as HDE regulation with WHTC, WHSC and PEMS). For vehicles certified using the WLTP already a CO2 value is reported. Options how to handle intermediate size vehicles have been elaborated in SR7 and are documented in section 5.2.
iii. All wheel drive trucks of the groups 6, 7 and 8 (4x4), 13 and 14 (6x6) as well as groups 15 and 17 (8x2, 8x6, 8x8)
These vehicle groups are listed in the segmentation table of the actual HDV CO2 TA but have been not considered for CO2 certification so far. Reason is their low contribution on overall CO2 emissions from HDV and a comparably high effort for component testing due to small numbers of sold units per component model. Details are given in section 5.3.1.
iv. Trucks with more than 4 axles
Trucks with more than 4 axles are sold in some regions of Europe but are actually not part of the segmentation table. Their impact on overall CO2 emissions is assumed to be significantly lower than the vehicle segment described in iii. However, there is a request from ACEA to also include 5 axle vehicles into the segmentation matrix in future.
Furthermore it has to be taken into consideration, that in the actual approach for CO2 certification of trucks all vehicles are defined to have standard bodies and are operated with standard (semi-)trailers. This leaves a signification potential for CO2 reduction uncovered. This topic is addressed in section 5.3.2.
5.1 Buses and coaches (M3 vehicles)
This section gives an overview on the work performed on the VECTO methods for buses and coaches (“B&C”) within SR7 and summarises the open issues for a final implementation into the software as well as into legislation.
5.1.1 Further development of the VECTO AT model
AT transmissions with torque converter are the dominant transmission technology in the city bus market (>90% market share) and also play an important role for interurban buses. In actual buses two different AT design types are available:
AT serial type “AT-S”, makes ZF and Allison
AT power-split type “AT-P”, make VOITH
Most bus OEMs offer vehicles with both transmission designs. A major challenge for the CO2 certification is to provide a realistic ranking between the different technologies for the variety of buses in the fleet and the different CO2 cycles as defined for VECTO.
The following work was performed related to the further development of the VECTO model for AT within SR7.

Service contract CLIMA.C.2/SER/2012/0004 Draft final Report
103
Transfer of the AT model approach as developed for VECTO 2.2 into the refactored VECTO version 3.
Revision of the algorithm for search of torque converter operating point from a partly instable iterative method in VECTO 2.2 to an analytical algorithm in VECTO 3.
Extension of the model for transmission losses for consideration of clutch losses during AT power shifts.
This model extension was identified to be necessary for a realistic ranking between the two different AT design types. A simple algorithm was developed and discussed with industry. The method and the defined parameters have been agreed in spring 2017.
Extension of the AT gear shift algorithms for additional parameters giving more freedom to adapt VECTO gear shifts to real shift behaviour as measured on the vehicles
Model validation exercises performed in 2016 based on data provided by ACEA
Industry provided data on measurements performed with city buses both with VOITH and ZF transmissions. These data (which origin from earlier test series, mainly comprising SORT cycle measurements) have been simulated in VECTO in two different setups:
a. Providing vehicle operation data including gear information from the measurement as input to VECTO
b. Only providing vehicle speed and gradient and applying the VECTO AT gear shift model in the simulations
It was found that VECTO simulates the fuel consumption for buses with both transmission designs very well in case the gear information was also provided as model input. Hence it was concluded that the capabilities of the “physical” AT model are sufficient. However, if the gear shifts are also simulated with VECTO, there is a systematic bias of VECTO to the advantage of AT-S transmissions in the range of a few percent in fuel consumption. VECTO simulations have been run so far under the assumption, that similar gear shift parameters shall be used for both transmission concepts.
Further development of the VECTO AT gear shift model shall be made based on the systematic data as collected by ACEA during the pre-pilot phase in 2017 and further discussions with gearbox and bus OEMs (see also section 5.1.5 on open topics).
5.1.2 Implementation of the Ricardo AAUX module
The advanced auxiliary sub-model (AAUX) for B&C from the Ricardo project [13] was transferred from VECTO 2 into the VECTO version 3.1 and obvious bugs in the sub-model were eliminated. The sub-model was kept running in all further VECTO releases. Guidelines have been elaborated how to run the AAUX model and interpret results in VECTO 3. The list of model input parameters was maintained in two iterative loops with industry and distributed as guideline document for the pre-pilot phase 2017.

Service contract CLIMA.C.2/SER/2012/0004 Draft final Report
104
Analysis performed showed, that the approach to account for smart auxiliaries (brake energy recuperation by the alternators and/or by the pneumatic system) may work for mild hybrids but this depends on the way how the different hybrid architectures will be considered in the future CO2 certification. For full hybrids the AAUX approach may not provide reasonable results (double counting of energy saving potentials) if the HEV simulation is also included in VECTO. A detailed analysis of possible issues is provided in a parallel project [12].
Since the input data structure elaborated in the Ricardo project seems to be too complicated for a certification process, further efforts will be necessary on this topic before a CO2 certification for buses is introduced.
5.1.3 Bus and Coach workshop
Prior to the 1st B&C meeting a workshop was held on the 12th of September 2016 in Brussels. Main focus was to inform non-ACEA bus OEMS - which have not followed the activities until then – on the B&C CO2 certification procedure. The according information was prepared and presented by TUG.
5.1.4 Preparation of baseline documents for the B&C pre-pilot phase
During the course of SR7 it was concluded that it is too early to already launch a “pilot phase” similar to the campaign as launched in 2015 for trucks, as the methods for B&C were not mature enough. Instead it was decided to perform a “pre-pilot phase” (PPP), mainly organised within ACEA TF5 and DG JRC, to push forward the development of methods. Main targets of the PPP were defined to be:
1) Further validation of descriptions of component test procedures (e.g. air drag testing for B&C may raise issues different than for trucks)
2) Producing measurement data for VECTO development issues (mainly collecting data in real driving conditions with special focus on the parameterisation of the VECTO gear shift model)
3) Proof of Concept activities where VECTO simulation shall be compared with measured fuel consumption values
4) Testing of options for the Ex Post Validation test for B&C.
For the planning of the PPP documents with the description of tasks and proposals for vehicles to be tested and measurements to be performed have been provided and discussed with stakeholders. Furthermore a detailed description how to use VECTO in the PPP has been elaborated. This document was designed to be a draft for the declaration mode for B&C, which is actually not implemented in VECTO due to several open topics still discussed within industry (see 5.1.5 item i.)
PPP measurements have been performed by industry and by DG JRC in the first half of 2017 and are currently being analysed.

Service contract CLIMA.C.2/SER/2012/0004 Draft final Report
105
5.1.5 Open topics for a implementation of B&C into the HDV CO2 legislation
The following topics remain open at the end of the SR7 project for a successful implementation of buses and coaches into the HDV CO2 legislation:
i.) Generic data handling
ACEA is currently revising the B&C segmentation approach from a simple matrix as proposed in the ACEA WB 2016 to a “vehicle group” based proposal, which is in line to the segmentation approach as applied for trucks. Data to be handled covers e.g. cycle allocations, payloads and auxiliary data. ACEA presented a draft table at the 2nd B&C meeting in June 2017. Table(s) shall be finalised until the end of this year. The approach shall also be reviewed by CLCCR.
The developed methods and data are recommended to be reviewed also by Commission consultants and finally need to be put into the VECTO software and transferred into a legislative text.
ii.) Finalisation of the VECTO gear shift model for AT transmissions
In order to obtain a suitable VECTO gear shift model for AT transmissions, which can be agreed by all stakeholders further activities seem to be necessary. The following options for achieving a solution have been identified:
(a) Elaborate different settings (shift polygons plus other parameters) in VECTO for AT-S and AT-P transmissions.
(b) Further extent the VECTO gear shift model by additional parameters which result in more realistic gear shifts for both AT design types.
Any solution would require ideally a technical explanation of the difference in gear shift characteristics between the two transmission designs or at least and agreement within industry to use the settings as fitted to available measurements.
iii.) Review of the VECTO gear shift model for AMTs in B&C
The VECTO gear shift model for AMT transmissions is recommended to be reviewed for applications in B&C. Related activities have been launched by ACEA in summer 2017 and shall cover trucks and B&C in parallel.
iv.) Review of minor items as raised by ACEA on the Ricardo AAUX module (“ACEA sideletter” plus further ongoing analysis in the context of the revision of the B&C segmentation matrix) and possible adaptions in the code and the set of input parameters. One of the main identified issues is that the Ricardo code requires input of a particular data (e.g. vehicle length) several times. Hence the input data handling is recommended to be “cleaned up”.
v.) “API”15 link of VECTO B&C to the OEM databases for VECTO to be fully integrable into the IT processes at the OEMs
Such an API link was already established for VECTO application for trucks. The software solution for B&C will require additional resources as
The large number of VECTO input data required for the AAUX module is not yet linked to the VECTO API interface
15
Application programming interface

Service contract CLIMA.C.2/SER/2012/0004 Draft final Report
106
Due to the different structure of bus OEMs (much larger number of companies than truck OEMs, many small companies) also a different IT solution might be required for the B&C API than for trucks.
vi.) Elaboration of a legislative text including the necessary amendments to cover B&C
Main items to be described are the segmentation table for buses, family concept for air drag testing (different approach required than for trucks) as well as provisions how to parameterise the AAUX module (including the optional test procedure for regenerative electric systems incl. as proposed by ACEA).
vii.) Organisation of a main Pilot Phase for B&C, with focus set on the “playing certification” aspect (i.e. simulating a certification by following the draft legislative text and involving technical services and/or approval authorities) as well as on involving further bus manufacturers which so far were not actively participating in the development of the B&C CO2 certification procedure.
5.2 Intermediate-size vehicles (M2 and N2 with max GVW from 3.5 to 7.49 tons)
Currently there is no consistent CO2 certification procedure defined for light commercial vehicles (LCVs) in the range of GVWR from 3.51 to 7.49 t.
For N2 and M2 above 7.5t GVWR VECTO vehicle groups are defined and VECTO is applicable in future
For smaller LCVs below 3.5t GVWR the light duty test procedure is relevant (WLTP from September 2017 on)
N2 and M2 vehicles between 3.51 to 7.49 t are not allocated to any of these procedures.
To elaborate basics for further decisions how to handle N2 and M2 between 3.51 to 7.49 t an expert group within SR 7 was installed. The group was open for all interested participants. Regularly the Commission, TUG and ACA members participated. The group had several meetings:
Kick-off on 29.10.2015 in Brussels
Web Ex meetings on 22.03.2016; 30.05.2016; 20.06.2016; 16.09.2016
Main issues for allocating a test procedure are:
Classification of the vehicles
I. The LDV regulation with the WLTP test procedure can be applied up to 2.84 tons vehicle empty weight (reference mass)
II. HDE regulation can be applied from 2.61 tons vehicle empty weight on with the HD engine test procedure for pollutants (WHTC, WHSC, PEMS)
Consequently for a large share of N2 the manufacturer can decide which regulation is applied. The decision has to take the customer wishes into consideration (e.g. multistage vehicles may/may not have > 2.84 tons in the end, depending on the body to be mounted).

Service contract CLIMA.C.2/SER/2012/0004 Draft final Report
107
A rough overview on typical shares of type approvals was elaborated in the expert group meetings: for Daimler and IVECO roughly half of the N2, M2 vehicles are below 7 tons. Concerned are e.g. the Daily (lower weight of N2) and Eurocargo (higher weight in N2) models. Roughly 50% of the vehicles are registered under LDV emission regulation. For VW almost all N2 and M2 vehicles are tested under LDV regulation. For MAN all trucks are tested under HDE regulation since N2 from MAN have typically 7.49 ton GVW.
A typical truck of this segment is shown in Figure 46.
Figure 46: Example for a light truck with a GVWR of 5.50 t
Since the shares of trucks certified under the different regulations differ significantly between OEMs, the classification should consider the existing practice, should be fair and should also lead to proper test procedures. A proper test procedure needs to test fuel efficiency in representative mission profiles to ensure that the selected efficiency technologies have also in real operation later on a high potential for fuel saving.
Technical applicability:
No restrictions from technical point of view were identified for using VECTO for N2 and M2 above 3.5 tons
Chassis dyno tests as defined in the WLTP are limited due to the typical designs of the test beds which are limited in vehicle weight which can be simulated clearly below 7.5 tons.
The simplest future option seems thus to use the WLTP to produce the CO2 value for vehicles type approved under WLTP and to use VECTO for all N2 and M2 where already the engine is type approved in WHTC and WHSC since this test procedure is a core element of the engine component data certification in VECTO.
Representativeness of the test procedure:
The main open question was if existing VECTO cycles and WLTC are representative cycles which could be used in VECTO.
If the WLTC is not representative for smaller N2 and M2 trucks, the overlapping of allowed test options as outlined above either leads to improper test procedures or to a poor comparability of results in the weight class where WLTP and VECTO may be used in future.
Two options for test cycles are under discussion:
a) N2 and M2 which may be certified in future with VECTO have to use the WLTC as VECTO test cycle to be compatible with similar N2 and M2 certified

Service contract CLIMA.C.2/SER/2012/0004 Draft final Report
108
in the WLTP. This however will need also an alignment of VECTO results for the WLTC with WLTP results. An alignment would have to bring the differences in road load determination in line, mimic chassis dyno conditions in VECTO and finally also take care of power consumption values of auxiliaries during the test.
b) N2 and M2 which may be certified in future with VECTO get a separate test cycle which is oriented towards representativeness and towards comparability with other HDV groups certified in VECTO
Option a) seems to be quite challenging. If VECTO and chassis dyno results cannot be fully aligned, one of the two certification options may result in a competitive disadvantage.
In option b) no alignment is possible; the results between WLTP procedure and VECTO are not comparable. This saves a lot of effort for method developments but the question is, how customers may use the information from CO2 testing which gives for a part of the fleet g/km in WLTP test conditions and for another part the g/t-km from the VECTO method. Again competitive disadvantages from one of the both options may occur.
As shown in the chapters below, the WLTC seems not to be representative for LCVs in the N2 range. Therefore the options identified for LCVs from 2.61 to 7.5 tons GVWR are
Use the VECTO approach for all N2 and M2 above approx. 5.5t GVWR since there no overlapping with WLTP certified vehicles exist,
Discuss and select a target for the small N2 and M2:
o Except N2 and M2 below the 5.5 tons from CO2 certification or
o Allow between 2.61 and 5.5 tons GVWR both, WLTP and VECTO and mark and explain the results for the customers properly or
o Demand VECTO results for all N2 and M2 vehicles even if they are certified for pollutant emissions in the WLTP (would add test costs for these vehicles)
The chapters below give an overview on typical vehicle GVWR classes and analyse which cycles are representative for their typical mission profiles.

Service contract CLIMA.C.2/SER/2012/0004 Draft final Report
109
5.2.1 Overview of vehicle models and current certification options for CO2
A selection of currently available light trucks in the GVWR range 3.51 to 7.49 t from the main manufacturers is shown in Table 27.
Table 27: Typical truck weights from N2 vehicles with a GVWR from 3.51 to 7.49 t
DAF LF
Fiat Ducato 2.60 4.00 3.00 4.00 3.00 4.30
Ford Transit 2.90 4.70 3.10 4.70
Fuso Canter 3.50 7.49
Isuzu N55
Daily 3.30 7.00 3.30 7.20
Eurocargo
MAN TGL
Atego 6.50 7.49
Sprinter 3.00 5.50 3.19 5.50 3.19 5.50
Opel Movano 2.80 4.50 3.50 4.50 3.50 4.50
D6.5
Master 2.80 4.50 3.50 4.50
Maxity 3.50 4.50
VW (MAN) Crafter (TGE) 3.00 5.50 3.00 5.50 3.00 5.50
max. GVWR > 5.50 t
Make ModelVan Flatbed/Tipper Chassis
GVWR in t, min., max.
- - 7.49
-
- -
5.50
Iveco-
- - 7.49
- -
- - 7.00
MB- -
Renault
- - 6.50
-
- -
Only the models Fuso Canter and Iveco Daily are available with GVWRs below and above 5.50 t, hence if the segment from 3.5 to 7.5 tons needs to be further subdivided, approx. 5.5t could be a threshold. N2/M2 vehicles up to 5.50 t are usually derived from the N1/M1 segment, and vehicles down to 5.50 t from the N3/M3 class.
5.2.2 Analysis of the representativeness of test cycles
The model of a typical light truck, based on the dimensions of a MB Sprinter, was created in VECTO. An overview of the model data is shown in Table 28 and Figure 47.

Service contract CLIMA.C.2/SER/2012/0004 Draft final Report
110
Table 28. Parameters of vehicle model
NEDC WLTC rdyn, driven wheels, 195/75R16, [m] (2) 0.339
Gross vehicle weight rating, [kg] (1) Inertia of wheels, 6 x 195/75R16, [kg*m²] (2) 15
Payload usage WLTC, LDV cat. 2, [%] 0 28 Equivalent mass wheels, [kg] (2) 131
Inertia of engine and clutch plate, [kg*m²] (2) 1.5
RRC-bin, C1-tires (1)
Vehicle width, [m] (2) Final drive gear ratio, [-] (1) 4.727
Vehicle height, [m] (2) Manual transmission, number of gears (1) 6
Cross sectional area, [m²] (3)
Air drag coefficient, [-] (3)mech, final drive & indirect gears, [-] (2) 0.96
Air drag area, [m²] (3)mech, direct gears, [-] (2) 0.98
Constant road load, F0, [N] (3) 204 264 Pavrg,aux (chassis dyno conditions), [kWmech] (2) 1.75
Quadratic road load, F2, [N/(m/s)²] (3)
1) Specific vehicle data, public 2) Data estimated or Vecto-default
5000
C
1.99
2.50
4.98
0.350
1.741
1.034
Figure 47. Full load curve, drag curve and engine performance map used for the N2 VECTO vehicle model
This model was used to simulate a selection of driving cycles.
The velocity trajectories of the driving cycles used in the VECTO simulations are shown in section 4.3.5.1.
Following cycles have been analysed:
a) Real word cycles from in-use measurements of N2 vehicles (only a limited number of four of such vehicle cycles were found in the entire WLTP data base)
b) “LDV-dyno”: Chassis dyno test cycles for N1 (NEDC, WLTC)
c) “HDV-dyno”: Chassis dyno test cycles for N3 (JE05, NERV, WHVC)
d) VECTO CO2 cycles for N3
The cycles were analysed for driving dynamics, fuel consumption and the load spectrum in the engine performance map. The results for the dynamics are shown in Table 29.
neng rpm

Service contract CLIMA.C.2/SER/2012/0004 Draft final Report
111
Table 29. Driving dynamics of analysed driving cycles 16
payload
in %t in s s in km
vavrg in
km/h
vroll,avrg
in km/h
stops/
km
stand in
% of t
RPA in
m/s²
ã in
m/s²
Real World 1 variable 28 908 330.7 41.2 46.5 0.57 11.4 0.098 0.102
Real World 2 variable 28 572 235.8 29.7 40.5 0.91 26.7 0.109 0.114
Real World 3 variable 299 913 3759.8 45.1 49.7 0.39 9.2 0.120 0.124
Real World 4 variable 1 484 645 29 623.9 71.8 77.6 0.14 7.4
NEDC, 88 km/h 0 1 180 10.5 31.9 42.5 1.24 24.8 0.089 0.093
WLTC 3b, 88 km/h 28 1 801 21.6 43.1 49.6 0.37 13.0 0.127 0.132
JE05 n. def. 1 830 13.9 27.3 36.5 1.01 25.2 0.116 0.121
NERV 20+60 n. def. 1 809 20.1 40.0 45.6 0.70 12.3 0.121 0.125
WHVC n. def. 1 800 20.1 40.1 46.5 0.60 13.6 0.101 0.104
Long Haul, '15 28 4 546 100.2 79.3 80.5 0.03 1.4 0.012 0.053
Reg. Delivery, '12 28 1 581 25.8 58.8 63.3 0.19 7.0 0.045 0.111
Reg. Delivery, '16 28 5 934 100.0 60.7 69.0 0.10 12.1 0.035 0.084
Urb. Delivery, '12 28 3 267 27.8 30.6 37.9 0.94 19.3 0.095 0.148
VEC
TO,
sim
ula
tio
n
-Rea
l wo
rld
LDV
,
dyn
o
HD
V,
dyn
o
When taking the Real World cycles as reference one finds, that the 4th cycle is closer to long haulage than to delivery traffic. From the 1st, 2nd and 3rd cycle a range of characteristic values can be extracted:
Average velocity 30 to 45 km/h,
Average rolling velocity 40 to 50 km/h,
0.4 to 0.9 stops/km,
Time share of stand 9 to 27 %,
Relative Positive Acceleration (RPA, excl. change of altitude) 0.1 to 0.12
Characteristic Acceleration (ã, incl. change of altitude) from ca. 0.10 to 0.12 m/s².
It shall be mentioned, that for the real world cycles the road gradient was not available and all real world cycles were simulated without gradient, hence also ã reflects only the driving dynamics from the velocity course.
When looking at the LDV cycles the result is, that the NEDC is at the lower end of the velocity range and has very low dynamics (RPA, ã) even for vans. The future WLTC
matches the level of velocity better, but is rather too transient. As will be shown later, this increases the share of engine operation at high load.
The existing HDV chassis dyno cycles fit better to the real world driving characteristics, albeit the Japanese cycle JE05 is too slow. The French combined cycle NERV 20+60 is
16 ã: Characteristic acceleration, ã = {max[0; 0.5 ∙ (v²i+1 - v²i) + g ∙ (alti+1 - alti)]} / s, O'Keefe 2007,
doi 10.4271/2007-01-0302. Payload in %: Percentage of max. payload for the test. RPA in m/s²: Relative Positive acceleration, RPA = ∫ {v ∙ max[0; a]} dt / s, Weijer 1997, permalink.obvsg.at/AC02228456. s in km: Cycle distance. stand in % of t: Stand duration in % of cycle duration. stops/km: Number of stops per distance. t in s: Cycle duration. vavrg in km/h: Average velocity, incl. stops. vroll,avrg in km/h: Average rolling velocity, excl. stops.
For the real world cycles the acceleration values from -0.05 to +0.05 m/s² were not counted for RPA and ã, to exclude measurement inaccuracies from oscillations of the velocity signal.

Service contract CLIMA.C.2/SER/2012/0004 Draft final Report
112
at the upper end of dynamics (RPA, ã), and the global cycle WHVC matches quite well,
but lacks a bit of dynamics.
In case of the VECTO cycles the Long Haul profile is not suited for most of the light trucks. According to the existing real world data, N2 vehicles are operated mainly in delivery traffic. When looking at the VECTO Regional Delivery cycle (version 2016) plus the Urban Delivery cycle (version 2012), a combination of both would meet the real world behaviour from the N2 in terms of driving dynamics.
For the VECTO cycles it shall be regarded, that RPA and ã are dependent on the curve of the target acceleration in the VECTO driver model. Thus adjustments to real driving behaviour by these generic VECTO parameters are possible. Certainly also a separate mission profile for the smaller N2 could be elaborated in future if needed. In the actual simulations the curve for target acceleration HDV with GVWRs ≥ 7.50 t was used with a
desired acceleration of +1.0 m/s² from 0 to 25 km/h which decreases to +0.5 m/s² at 60 km/h and above.
Since only very limited real world driving data for the small N2 vehicles was available, more data shall be elaborated if VECTO shall be applied for these vehicles in future. For smaller M2 no real world driving data was found. If such vehicles could use existing VECTO cycles for M3 vehicles is thus open.
The results for the simulated fuel consumption (FC) in the different cycles with a variation of the simulated payload are shown in Figure 48. The variation of the payload from empty to full shows, that the more transient the cycle is, the steeper the line of the increase of FC with payload becomes. This is due to the fact, that more brake energy is annihilated at higher vehicle mass while energy consumption for air drag and auxiliaries is independent from the loading.
Figure 48: Simulated fuel consumption on different driving cycles for the N2 VECTO vehicle model (LDV
cycles were reduced to maximum 88 km/h speed of the N2 vehicle)
0
5
10
15
0.0 0.5 1.0 1.5 2.0 2.5
FC in
L/1
00
km
Real World 4
8.8
0
5
10
15
0.0 0.5 1.0 1.5 2.0 2.5
FC in
L/1
00
km
Real World 3
9.2
0
5
10
15
0.0 0.5 1.0 1.5 2.0 2.5
FC in
L/1
00
km
Real World 2
9.5
0
5
10
15
0.0 0.5 1.0 1.5 2.0 2.5
Real World 1
8.9
0
5
10
15
0.0 0.5 1.0 1.5 2.0 2.5
Long Haul 2015
7.2
0
5
10
15
0.0 0.5 1.0 1.5 2.0 2.5
FC in
L/1
00
km
Reg. Delivery 2016
7.6
FC in
L/1
00
km
0
5
10
15
0.0 0.5 1.0 1.5 2.0 2.5
FC in
L/1
00
km
Reg. Delivery 2012
7.5
0
5
10
15
0.0 0.5 1.0 1.5 2.0 2.5
FC in
L/1
00
km
Urb. Delivery 2012
9.9
Pay-load [t]
FC in
L/1
00
km
NEDC, 88 km/h WLTC 3b, 88 km/h JE05 NERV 20+60 WHVCPayload in % 0 28 28 28 28FC in L/100km 8.3 8.8 9.6 8.5 8.5
LDV HDV
Pay-load [t]
FC in
L/1
00
km
PayloadWLTC(28 %)

Service contract CLIMA.C.2/SER/2012/0004 Draft final Report
113
As payload for the basis configuration the default value for the WLTC of 28 % of the maximum allowed payload was chosen. Just for the NEDC the default payload of 100kg as defined in the reference mass definition was used as basis.
With 28 % payload the simulated FC on the Real World cycles ranges from 8.8 to 9.5 L/100km, where the lowest value is reached on the motorway-like cycle 4.
On the LDV cycles the NEDC without payload and WLTC 3b with 28 % payload, both cycles limited to 88 km/h, the FC is similar at 8.3 and 8.8 L/100km.
For the HDV cycles JE05, NERV 20+60 and WHVC the spread in FC is bigger from 8.5 to 9.6 L/100km, where the highest value is reached on the slow JE05 with the biggest share of engine idling at vehicle stop.
The outcome from the VECTO cycles Long Haul 2015, Regional Delivery 2016/2012 and Urban Delivery 2012 are FC values from 7.2 to 9.9 L/100km for the basis configuration. The highest overall FC was simulated on the Urban Delivery cycle.
The load spectra in the engine map in terms of the share at the overall FC in the driving cycle are shown in Figure 49 and Figure 50.
Figure 49: Shares at the overall FC in the engine map from various real world cycles and LDV dyno cycles.
In the plots of the Real World cycles 1 to 3 it is shown, that the majority of fuel is consumed in the lower halves of the power and speed ranges of the engine. Only for the motorway-like 4th Real World cycle the FC is situated at higher power and speed values. The share of operation at full load is low in general, and in the main areas of engine operation the FC is evenly distributed in the map.
When looking at the LDV cycles, limited to 88 km/h, one recognises that the discontinued NEDC matches only the power level of light trucks in the lower half of the engine map, but the engine speed level is slightly too high. In addition the FC is concentrated on
neng in rpm neng in rpm
neng in rpm neng in rpm
P in
kW
P in
kW
0.28
Payload NEDC : 0 %,
others: 28 %.
Share at FC correlates
with circle area.

Service contract CLIMA.C.2/SER/2012/0004 Draft final Report
114
single nodes in the map due to the artificial constant acceleration, and is only less distributed.
In case of the WLTC the speed range in the lower half of the map fits better to the Real World cycles and the FC is more distributed than in case of the NEDC, but the share of full load is much higher than found in the real world cycles. This is most likely caused by the database used for the development of the WLTC, which comprised mainly real world cycles from N1 vehicles. In this segment the power-to-mass ratio is usually higher than in case of light trucks, what leads to higher acceleration values than common for N2 vehicles. In addition the constant driving at 88 km/h on the motorway part of the WLTC causes an overrating of the FC at this single operating point.
Figure 50: Shares at the overall FC in the engine map for the HDV dyno cycles and for the VECTO cycles,
payload in all simulations set to 28 %.
The check of the simulated load spectra from common HDV cycles (JE05, NERV and WHVC) show, that they match quite well to the load distribution found for the Real World cycles in terms of main operation area and distribution of the FC. Only on the motorway part of the WHVC an accumulation of FC could be observed which is not reflected in the real world data.
The comparison of the simulated load spectra from the VECTO cycles with the Real World cycles lead to the conclusion, that the Long Haul cycle is not suited for light trucks due to the concentration of the FC at the few operating points for motorway driving with 85 km/h.
P in
kW
P in
kW
neng in rpm neng in rpm neng in rpm
0.50
neng in rpm

Service contract CLIMA.C.2/SER/2012/0004 Draft final Report
115
The applicability of the Regional Delivery cycle (version 2016) is also limited, because it contains a significant share of motorway driving which is responsible for 63 % of the overall fuel consumption17.
Summarising the analysis of the existing cycles shows:
The WLTC is not very representative for the load distributions found in the N2 real world driving while the HDV test cycles fitted much better. The analysis of the VECTO HDV CO2 cycles shows, that the Long Haul and Regional Delivery cycle are not representative for smaller N2/M2 due to high shares of motorway driving. A weighted result from the VECTO Regional Delivery and the Urban Delivery cycle would fit to available real world driving data of N2 vehicles analysed quite well.
5.2.3 Outlook
For a future CO2 certification N2 and M2 vehicles with a max. GWM mass below 7.5 tons following steps are prerequisite:
o Decision, if one procedure shall be applied to the overall GVWR range of N2/M2 from 3.51 to 7.49 t GVWR, or if an additional subdivision becomes necessary. E.g. N2a/M2a from GVWR 3.51 to 5.50 t and N2b/M2b from GVWR 5.51 to 7.49 t
o Decision, if the certification procedure(s) shall be based on measurements on the chassis dyno or on the future VECTO simulation approach for smaller N2 and M2.
o A possible solution could be a VECTO based certification of CO2 for all N2 above a GVWR of approx. 5.50 tons.
o For the smaller N2 a reasonable share of the vehicles is now type approved on the chassis dyno and thus would have extra test burden if VECTO is introduced for CO2. For the other N2, which are nowadays type approved on the engine test bed, additional chassis dyno testing would add costs. No preference seems to exist, how to proceed in this class. A decision needs to be taken as outlined in the beginning of the N2/M2 chapter.
o Appropriate driving cycles need to be chosen for a possible application of VECTO. The analysis shows, that a mix of existing VECTO urban and regional delivery cycles already match the real world driving from N2 quite well. For chassis dyno testing, the WLTP is fixed for all N2 which are type approved on the chassis dyno. Unfortunately the WLTC seems not to be very representative for N2 real world operation. If an additional CO2 test cycle for chassis dyno testing shall be introduced needs to be discussed.
o All sets of generic VECTO data may need to be adjusted for the N2 and M2 groups. In the actual work the acceleration curve and payloads have been tested. Furthermore standard bodies and auxiliary power demand values need to be defined.
o Finally the number of OEMS involved in the N2 and M2 marked in Europe is much higher than the OEMS of N3 vehicles. After the above mentioned adjustments are made in the VECTO data to cover also smaller N2 and M2, iteration loops with the manufacturers have to be started which could lead to a coordinated pilot phase as performed for N3 and M3 vehicles already. This part of the work is expected to be
17
The share of motorway driving at the overall FC of the Regional Delivery cycle (version 2012) is also high at 57 %, but the FC is more distributed among the map than in case of the 2016 cycle.

Service contract CLIMA.C.2/SER/2012/0004 Draft final Report
116
the most time consuming but seems to be necessary to reach general understanding and acceptance of the new method.
5.3 Further HDV groups not considered yet
The actually planned vehicle groups to be covered in the CO2 certification cover approx. 98% of the HDV CO2 emissions in Europe (Figure 51). The CO2 emissions per HDV group shown in Figure 51 were compiled from the LOT1 and LOT2 reports. We do not assume that the truck market has changed a lot in the last years and thus the shares in registration of trucks, the annual mileage and the specific fuel consumption per km which have been used as basis for these numbers shall still be representative.
The single steps of the introduction will thus provide following CO2 coverage:
Step 1 (1.1.2019) with groups 4, 5, 9, 10: ca. 71%
Step 2 (1.1.2020) with groups 1, 2, 3: ca. 8%
Step 3 (1.7.2020) with groups 11, 12, 16: ca. 9%
Step 4 (open) with buses and coaches: ca. 10%
Figure 51: Share of the VECTO truck groups on the CO2 emission in the EU (complied from data in (Luz,
2014), HDV groups in brackets are not foreseen in CO2 certification yet.
Table 30 shows in addition the shares of different mission profiles on the CO2 emissions on the total HDV CO2 emissions. Obviously long haul operation has by far the highest contribution to the CO2 emissions, followed by regional delivery and construction.

Service contract CLIMA.C.2/SER/2012/0004 Draft final Report
117
Table 30: Share of the VECTO truck groups and mission profiles on the CO2 emission in the EU (complied
from data in [4], HDV groups in brackets are not foreseen in CO2 certification yet
5.3.1 All-wheel-drive trucks
The vehicles not covered by the CO2 certification are typically all road driven and are excluded due to their specialised and thus inhomogeneous mission profiles (e.g. Figure 52). Such vehicles can also hardly be included in a CO2-limit scheme, since standard fuel saving technologies such as tires with low rolling resistance and a body with lower air resistance would not be in line with customers’ demands in many cases. It is also unlikely that the future CO2 regulation for trucks would cause a shift from regulated classes towards these non-regulated ones. Thus no urgent need to include these vehicles into the CO2 certification scheme is identified.
However, the market development may be monitored together with the CO2 monitoring to be able to identify quickly if the share of non-regulated trucks increases in future. The difference between vehicle registration numbers in Europe and vehicles with CO2 reporting data should be a reasonable indicator of the development.
ClassUrban
Delivery
Municipal
Delivery
Regional
Delivery
Long
Haul
Construc-
tion
City
Class I
Interurb.
Class II
Coach
Class IIISum
Truck 4x2 Rigid + (Tractor) 7.5-10t 1 0.5% 0.2% 0.7% 1.1% 2.6%
2 Axles 4x2 Rigid + (Tractor) > 10-12t 2 0.5% 0.2% 0.7% 1.1% 2.6%
4x2 Rigid + (Tractor) > 12-16t 3 0.5% 0.2% 0.7% 1.1% 2.6%
4x2 Rigid > 16t 4 0.8% 0.5% 1.2% 5.3% 7.7%
4x2 Tractor > 16t 5 10.5% 33.8% 4.5% 48.8%
4x4 Rigid 7.5-16t (6) 0.0% 0.2% 0.3%
4x4 Rigid >16t (7) 0.0% 0.4% 0.4%
4x4 Tractor >16t (8) 0.3% 0.3%
Truck 6x2/2-4 Rigid All Weights 9 1.2% 1.0% 4.2% 6.4%
3 Axles 6x2/2-4 Tractor All Weights 10 8.2% 8.2%
6x4 Rigid All Weights 11 1.4% 2.5% 3.9%
6x4 Tractor All Weights 12 1.0% 0.3% 1.3%
6x6 Rigid All Weights (13) 0.6% 0.6%
6x6 Tractor All Weights (14) 0.1% 0.1%
Truck 8x2 Rigid All Weights (15) 0.0% 0.2% 0.2%
4 Axles 8x4 Rigid All Weights 16 4.1% 4.1%
8x6/8x8 Rigid All Weights (17) 0.3% 0.3%
Total Bus&Coach b&c 9.6%
Bus City Class I 4.4% 4.4%
- Coach Interurban Class II 2.7% 2.7%
Coach Class III 2.5% 2.5%
Total: 2.3% 2.4% 15.0% 57.3% 13.4% 4.4% 2.7% 2.5% 100.0%
Categories

Service contract CLIMA.C.2/SER/2012/0004 Draft final Report
118
Figure 52: Example for a 6x6 rigid trucks (source www. Ditzj.de - MAN TGS 6x6 – Kessler and Hemro-Tech GmbH)
5.3.2 Specific bodies, trailers and semi-trailers
More important than all-wheel-drive trucks seems to be the inclusion of bodies and trailers into a CO2 certification scheme. Table 31 shows the shares of different bodies, semi-trailers and trailers in the market. No data is available to assess the share of these bodies and trailers in the total CO2 emissions since no statistics exist on the yearly mileage per body and trailer type.
Since the tractor groups 5 and 10 have highest share in CO2 emissions from trucks (Table 30) and are used mainly in long haul operation it can be concluded that the typical semi-trailers allocated to long haul operation also have the highest share in CO2 emissions. For these semi-trailers fuel savings due to improved aerodynamics has a high effect. Thus including semi-trailers and trailers in the box form and possibly also tank and container would cover the main systems with large potential in fuel saving and higher shares in CO2 emissions.
Table 31: Share of different bodies and trailers in the market (compiled from [4])
Box /
Curtain Tank / Bulk
Container / Swap Tipper Others Total
Truck bodies 39% 2% 8% 18% 34% 100%
Semi trailers 60% 7% 8% 12% 13% 100%
Trailers 31% 4% 16% 18% 31% 100%
In the current VECTO approach all trucks are certified with “standard bodies” and/or “standard-trailers” in box body design.18 Any improvements on bodies and trailers sold are not reflected in the CO2 certification unless the standard bodies etc. are adjusted.
This would allow the simulation of the CO2 value for the complete vehicle. For tractors the later combination of tractor and trailer is typically not known. Thus a generic tractor model could be provided in VECTO for each tractor group, e.g. based on average
18 For tractor semi-trailers combinations the difference in air drag of different body types has been
investigated in [15]. Compared to box body vehicles tank/bulk vehicles were found with some 7% lower CdxA, tippers with some 15% lower CdxA. These findings refer to zero-crosswind conditions. Additionally the cross-wind sensitivity of different body types was found to be significantly different.

Service contract CLIMA.C.2/SER/2012/0004 Draft final Report
119
efficiencies from the CO2 monitoring process. With a generic tractor model also the CO2 values for tractor-trailer combinations can be computed with VECTO. The "fuel efficiency” of the semitrailers and trailers may be illustrated as “% CO2 reduction” against the standard trailer. For bodies of trucks either a multistage approach to provide the g/t-km for the truck/body combination is possible or also an approach providing % reduction against the standard body can be followed.
Following steps would be necessary for body builders:
1) Identify the weight of their body or trailer
2) Select the tires and obtain the tire related VECTO input file from the tire manufacturer (rolling resistance coefficient etc.)
3) Simulate (or measure) CdxA value of the body or trailer, possibly simulate (or measure) the difference against the standard body or trailer. As default, do not change the CdxA value in the later VECTO simulation, if no measured values are produced.
4) Run VECTO with the adjusted mass, tire data and air drag data, either with VECTO data for the real chassis used or with generic chassis or tractor VECTO data
A basic requirement for a cost efficient simulation of the changes in air drag against the norm bodies / trailers would be a well-defined approach how to use CFD simulation by body builders in a certification process. An example for such a method can be found in the US EPA phase 2 regulations, where also the use of CFD tools under the provisions for well-defined parameters and simulation settings is allowed. Work in this direction is currently performed by CLCCR and by VDA but yet no results are available.
In a first step which may just address semi-trailers, just the weight and the tire selection may be used for the VECTO calculation. For air drag some credits may be given for well-defined aero-devices like side skirts or boat tails. This would allow a quite cheap certification for a CO2 reduction against standard semi-trailers. Such an approach would at least set incentives to sell tires with low rolling resistance also on semi-trailers and to use some standard aerodynamic devices.

Service contract CLIMA.C.2/SER/2012/0004 Draft final Report
120
6 Main open work for follow up activities after SR7
This chapter shall support the Commission in planning the next steps after the finalisation of the SR7 project. The topics are ranked from minor and short term topics – some of them are already under investigation - up to long term strategic items for VECTO and the HDV CO2 certification
Table 32: List of open topics after SR7
Topic Description Actions necessary
Update of VECTO cycles
(trucks)
Currently ACEA and their subcontractor are still reviewing the cycles for “Urban delivery” as well as “Construction”. Updates proposals shall be ready still in 2017.
Review of updates cycles and implementation into VECTO software
Update of list with tyre dimensions in VECTO
Tyre industry claimed that some dimensions which might be sold in future are actually not covered by the list.
It is recommended to update the table with tyre dimensions regularly. The list of required information in VECTO was already distributed to ETRMA. As the valid entries in the VECTO input for wheel dimension code are also listed in the HDV CO2 TA, updates require also an update of the legislative text (or a wording which allows simple amendments just in the software).
Fuel properties for Natural Gas engines in VECTO
Currently in VECTO all types of Natural Gas engines are combined into a single engine fuel type (“NG”). In the simulation of fuel consumption and CO2 emissions VECTO applies fuel properties (CO2 content and heating value) for typical CNG fuel. Different fuel properties of LNG are not considered.
Decision whether NG fuel type shall be differentiated into CNG and LNG. If yes, survey on typical fuel properties for LNG and implementation into VECTO.
Currently VECTO considers tank to wheel emissions only. Especially for LNG this does not reflect the complete impact on GHG emissions (well to tank GHG emission contribution from CH4 losses in long-distance transport and energy consumption from liquefaction). See also topic “Well to tank emissions”

Service contract CLIMA.C.2/SER/2012/0004 Draft final Report
121
Topic Description Actions necessary
Generic gear shift strategies in VECTO for AMTs and AT vehicles
The gear shift strategy for AMTs as currently implemented in VECTO is optimised for long-haul and regional delivery cycles and has shortcomings for low speed driving cycles (urban delivery and municipal cycle). Currently ACEA is investigating a different approach for AMT gear shift rules, which shall better reflect behaviour of real vehicles in all driving cycles.
Review of new approach as proposed by ACEA after it has reached a mature status (i.e. after testing was successful at different OEMs).
Implementation into VECTO if agreed in the VECTO maintenance board. Further testing will be necessary.
Update of AMT strategy will also require review of AT gear shift rules (ranking issue between AMT and AT).
Advanced Driver Assistance Systems (ADAS)
ADAS systems can significantly contribute to fuel efficient driving behaviour. Such systems are currently not considered in the CO2 certification with VECTO.
ACEA already elaborated drafts for simulating the fuel consumption benefit of the systems “Engine Stop-start”, “Eco-roll” and “Predictive Cruise control” and its possible combinations.
The following steps are necessary for an implementation into VECTO and the HDV CO2 certification:
Review of system definitions and parameter settings as proposed by ACEA by a market survey and an inquiry of typical ADAS usage/ settings as operated by real drivers in the fleet
Implementation into VECTO, testing and including some feedback loops with industry
Incorporation of provisions for declaration of ADAS systems into the legislative text (definitions, methods for verification in the Ex-post verification)
Ex-post test procedure
For the implementation of the Ex-post test procedure into the HDV CO2 legislation several tasks are still open.
Topics and required actions are listed in section 4.4.1.8.
A project for DG GROW on this topic is ongoing.
Methods for buses and coaches
For the implementation of buses and coaches into the HDV CO2 legislation several tasks are still open.
Topics and required actions are listed in section 5.1.5.
Hybrid electric vehicles (HEV)
Hybrid electric vehicles are actually not covered by the VECTO approach.
Possible options and necessary steps for an implementation into the HDV CO2 certification were in detail analysed in the DG CLIMA study [12].

Service contract CLIMA.C.2/SER/2012/0004 Draft final Report
122
Topic Description Actions necessary
Advanced engine technologies
Several engine technologies which are expected to enter the HDV market in the nearer future are not yet covered by the VECTO approach. Identified technologies are Duel Fuel engines (CNG with Diesel injection) and Waste Heat Recovery.
Appropriate approaches (test procedures, VECTO simulation modules and legislative texts) have to be developed and tested in close cooperation with industry.
Incorporation of specific designs of bodies, trailers and semitrailers into the CO2 certification
In the current HDV CO2 certification all trucks are certified with “standard bodies” and/or “standard-trailers”. Thus there is no incentive to optimise body and trailer designs.
Options and tasks are listed in section 5.3.2.
CdxA test procedure
CFD might be suitable method for determination of relative differences in air drag for certain HDV or trailer design variants. Before CFD can be introduced for certification purposes it seems that more details of the code and of the settings need to be harmonised. If successful, the approach is promising.
Within ACEA and CLCCR activities are ongoing to clarify the suitability of such an approach as part of the HDV CO2 certification and its necessary boundary conditions.
Decision if CFD simulation shall be followed for a 2
nd phase of HDV-
CO2 legislation.
If yes, cooperation between ACEA, Commission and possibly a consultant is suggested to elaborate the method in detail.
N2 and M2 vehicles with a max GVW <7.5 tons
For the implementation N2 and M2 vehicles with a max. GVW below 7.5 tons into the HDV CO2 legislation a several tasks are still open.
Options and tasks are listed in section 5.2.3.
“Eco-features” It is unlikely that all new technologies can be integrated in the CO2 test procedure quickly on demand (develop component test procedure, integrate simulation in VECTO, test and validate results).
Thus a method may be necessary, which allows an alternative assessment of the CO2 benefit of new technologies before implementation into VECTO or niche technologies which are not foreseen for a full VECTO implementation. The method may e.g. be based on vehicle testing and a measured ratio with/without new technology or via inter-faces in VECTO where values could be adapted (such as power demand from alternator if waste heat recovery produces electric energy).
Decision if necessary
If yes: timeline, set up a project for development

Service contract CLIMA.C.2/SER/2012/0004 Draft final Report
123
Topic Description Actions necessary
Incorporation of OEM specific control strategies
The option to consider OEM specific control strategies into the VECTO CO2 certification appears worthwhile for several vehicle systems (e.g. gear shift strategies or HEV controllers). Possible solutions are SIL
19 or HIL
20 interfaces to
VECTO.
The development of methods suitable to be used in a CO2 certification is estimated to be a complex process requiring several years of lead time. The following tasks have to be covered:
Definition and implementation of VECTO SILS/ HILS interfaces (input / output signals) which work with all OEM software
Potential extension of VECTO modules to provide additional required signals
Proof of concept and further optimisation of methods
Elaboration of type approval approach for „black-box“ software & dataset or ECU
Verification of system behaviour on certain number of vehicles by TAA
Elaboration of legal text
It is estimated that the implementation of SILS/HILS functionalities into VECTO does not necessarily require switching from “backward” to “forward” looking simulation approach.
Well to Tank (WTT) emissions
(all vehicles)
Currently VECTO considers only Tank to Wheel emissions (TTW). Neglecting the Well to Tank (WTT) chain does not correctly rank the real GHG impact of different propulsion technologies (different fuels or electricity from the grid if PHEVs and EVs might be covered by VECTO in future).
Political decision needed. Discussion of WTT factors with stakeholders might be a long process.
19
SILS: Software in the Loop (combination of independent software element into a single simulation, e.g. longitudinal simulated model with interface to blackbox controller software)
20 HILS: Hardware in the Loop (simulation with interface to physical components)

Service contract CLIMA.C.2/SER/2012/0004 Draft final Report
124
7 Summary and outlook
Aiming for reductions of CO2 emissions from road transport, the European Commission has prepared a methodology for certification of CO2 emissions from Heavy Duty vehicles. The general approach of the new certification procedure is based on tests of the individual components of the vehicle and a subsequent simulation of fuel consumption and CO2 emissions of the entire HDV. This approach offers the possibility to accurately capture the highly diverse characteristics of HDVs and their influence on fuel consumption and CO2 emissions, without heavily increasing the complexity and the costs for vehicle certification.
Previous projects LOT2 [3] and LOT3 [4] have brought the method and corresponding software and descriptions already on a high level. The objectives of the work in the current project (“SR7”) were related to the finalisation of the entire CO2 certification method for trucks as basis for a legislative procedure. Furthermore other open tasks should be brought forward which mainly meant inclusion of additional HDV categories and technologies and an improvement of the software quality.
The deliverables of the SR7 project are:
The software VECTO (Vehicle Energy Consumption calculation Tool) for simulating fuel consumption and CO2 emissions of HDV.
The software was completely refactored from version 2.2 (status LOT3) to version 3.2 (starts SR7) and extended by additional simulation elements and features necessary for the use in the official CO2 certification.
VECTO 3.2 is suitable to be used as the backbone of the future European HDV CO2 certification and meets professional software requirements as laid out in the SR7 Service Request.
A complete set of generic data required for CO2 certification of trucks for the groups 1, 2, 3, 4, 5, 9, 10, 11, 12 and 16 (all truck groups as currently foreseen to be CO2 certified)
The generic data comprises driving cycles, driver model settings, generic gear shift strategies for MT, AMT and AT vehicles, vehicle payloads, definitions for standard bodies and standard (semi-)trailers, wheel specifications for all common HDV tyre dimensions, data on power demand from truck auxiliary operation, data on usage patterns of refuse trucks represented in the “municipal cycle”, fuel properties for the six reference engine fuel types as defined in ECE R49 as well as data on average European ambient conditions.
A user manual for VECTO in HTML format integrated in the graphical user interface of the software
A document with VECTO development guides
The software tool “VECTO Engine” for evaluation of the HDV CO2 engine test procedure and for generation of VECTO input data for the engine component
A User manual for VECTO Engine distributed with the VECTO Engine software
The software tool “VECTO Air Drag” for evaluation of the HDV CO2 constant speed test procedure and generation of VECTO input data for the air drag component

Service contract CLIMA.C.2/SER/2012/0004 Draft final Report
125
A User manual for VECTO Air Drag distributed with the VECTO Air Drag software
This final report
The validation of VECTO approach for trucks has been extensively performed during the project based on measurements performed at ACEA, JRC and TUG. Extensive comparisons with various other sources on real world fuel consumption were made which are described in detail in a Phd thesis [2]. All comparisons indicate that realistic fuel consumption values are provided by VECTO. A pilot phase for trucks was organised in 2015 to also check the formal issues of the procedure like the involvement of the technical services and approval authorities.
The method was 100% completed within SR7 for all trucks groups as scheduled to be CO2 certified in the current HDV CO2 legislation. However, some possible improvements or updates seem worth to be considered in the next months. Drafts for minor updates of generic data are actually under elaboration at ACEA (update of urban delivery and construction cycle, update of generic vehicle data for simulation of construction cycle etc.). Additional efforts are recommended to be performed until 2018 for improvement of generic gear shifts strategies for AMT and AT transmissions as well as incorporation of Advanced Driver Assistance Systems (ADAS) into the HDV CO2 certification.
The Ex-post validation test procedure (EPTP), which was drafted as a “simple constant speed test” (SiCo) in LOT3 – was significantly further developed in SR7. After analysis of vehicle tests at TUG and JRC in transient cycles, the focus was put on real world transient test procedures on the road or on a chassis dyno (both options work similar and could be allowed). A draft method was elaborated for the EPTP validation test. In a separate contract for Dg Grow a technical annex describing the test was released in January 2017. One iteration round with industry and stakeholder was made to collect comments and to adjust the procedure. The OEMs are currently testing the procedure and shall give feedback in autumn 2017. Main issues under discussion are the tolerances to be allowed and boundaries for the driving conditions.
Within SR7 the expansion of the VECTO method to further vehicle categories was significantly pushed forward. For buses and coaches (B&C) the AT model was further developed to be able to correctly depict the two different AT designs (types AT-S “serial” and AT-P “power-split”) as available on the market for buses. The updated VECTO “physical” model was assessed to be of sufficient accuracy to calculate the operation behaviour and losses for both AT transmission types. However, still a small systematic bias of fuel consumption simulated with VECTO to the advantage of AT-S transmissions is observed. Reason is the generic gear shift strategy which currently does not fit for both AT types. Further development of the VECTO AT gear shift model shall be made based on the systematic data as collected by ACEA during the pre-pilot phase in 2017 and further discussions with gearbox and bus OEMs.
The advanced auxiliary sub-model (AAUX) for B&C from the Ricardo project was transferred in SR7 from VECTO 2 into the VECTO version 3.1 and obvious bugs in the sub-model were eliminated. Guidelines have been elaborated how to run the AAUX model and interpret results in VECTO 3.
The pre-pilot phase was designed and coordinated for buses and coaches. The pre-pilot phase covers component testing and VECTO simulation as planned in certification but does not involve type approval authorities and technical services. Additional vehicle tests are made as basis for the comparison between measured and simulated data.
Main open topics for the implementation of B&C into the HDV CO2 legislation are the completion of the generic data (ACEA currently elaborating a vehicle group based

Service contract CLIMA.C.2/SER/2012/0004 Draft final Report
126
system like for trucks), the finalisation of the VECTO gear shift model for AT transmissions, adaptions to the “advanced auxiliary module” for an efficient model application in the official CO2 certification and the elaboration of a legislative text as a basis for the main pilot phase. From the current view such a phase could earliest start in mid of 2018.
For analysis of options for inclusion of intermediate-size vehicles (M2 and N2 with max GVW from 3.5 to 7.49 tons) into the HDV CO2 certification based on VECTO several specific N2/M2 vehicles have been simulated. A comparison of VECTO CO2-cycles, real world driving data of N2 vehicles and the WLTC was performed. As a result the WLTC seems not to be representative for N2/M2 mission profiles.
For the heavier N2/M2 the VECTO cycles seem to be representative and the VECTO methods can be applied from a physical point of view. An open issue for a political decision is how N2 vehicles below approx. 5.5 ton GVW shall be handled, since a part of these vehicles can be certified for pollutant emissions according to WLTP as well as to the HDV engine certification procedure. The different structure of OEMs and multistage vehicle shares compared to N3/M3 vehicles however, needs political discussions and decisions to define the next steps to be taken.
A significant further potential for triggering CO2 reductions from HDV was identified by the inclusion of bodies and (semi-)trailers into a CO2 certification scheme. In the current VECTO approach all trucks are certified with “standard bodies” and/or “standard-trailers”. Thus any improvements on bodies and trailers sold are not reflected in the CO2 certification unless the standard bodies etc. are adjusted. An option to include the real bodies and trailers is to consider actual mass, RRC value and volume and optionally measure or simulate the difference in air drag against the standard body or trailer. In a first step which may just address semi-trailers, just the weight and the tire selection may be used for the VECTO calculation. For air drag some credits may be given for well-defined aero-devices like side skirts or boat tails. This would allow a quite cheap certification for a CO2 reduction against standard semi-trailers. Such an approach would at least set incentives to sell tires with low rolling resistance also on semi-trailers and to use some standard aerodynamic devices.
CLCCR and VDA are currently elaborating a detailed proposal how bodies and (semi-)trailers could be included into a CO2 certification scheme. This work has been supported by the SR7 consortium. For these activities a possible CFD based approach may be added later to the afore-mentioned base semi-trailer certification.
Identified medium goals for the further development of the HDV CO2 certification procedure are:
Inclusion of Hybrid Electric Vehicles (with possible required adjustments of the “advanced auxiliary model” to avoid double counting of energy recuperation effects)
Elaboration of methods for consideration of advanced engine technologies (like CNG engines with Diesel injection) and Waste Heat Recovery.
As a long term vision it should be envisaged to elaborate an option to consider OEM specific control strategies in the VECTO CO2 certification. Possible solutions are SIL or HIL interfaces to VECTO. The development of related methods suitable to be used in a CO2 certification is estimated to be a complex process and requiring several years of lead time. The shift to forward simulation in VECTO is not seen as a prerequisite in this context.

Service contract CLIMA.C.2/SER/2012/0004 Draft final Report
127
Under the boundary condition of ongoing maintenance and improvements to keep up with latest vehicle technologies, the VECTO method shall be a very well suitable basis to inform customers on real world fuel consumption, monitor CO2 emissions from the HDV sector and give OEMs the opportunities to demonstrate the improvements in environmental impact of the HDV sector.
8 Literature
[1] HDV CO2 legislation as adopted by the TCMV on the 11th of May 2017 and its
technical annexes
https://circabc.europa.eu/w/browse/c99d7c7e-cb99-421a-bb74-f75447b287ec
[2] Kies A.: A contribution to the analysis of fuel efficiency measures for heavy duty
vehicles; Doctoral Thesis at TU Graz; 2017
[3] Hausberger S., Rexeis M., Kies, A., Schulte L-E.; Steven H., Verbeek R., et.al.:
Reduction and Testing of Greenhouse Gas Emissions from Heavy Duty Vehicles
- LOT 2; Development and testing of a certification procedure for CO2 emissions
and fuel consumption of HDV; Contract N° 070307/2009/548300/SER/C3; Final
Report; 9 January 2012
[4] Luz R., Rexeis M., Hausberger S., Schulte L, Hammer J., Steven H., Verbeek R.,
et.al: Development and validation of a methodology for monitoring and
certification of greenhouse gas emissions from heavy duty vehicles through
vehicle simulation, Final report; Service contract CLIMA.C.2/SER/2012/0004;
Report No. I 07/14/Rex EM-I 2012/08 699 from 15.05.2014
[5] Becher O.: ACEA Project Reduced Rolling Resistance Study, Phase 1 CST Tests
in Klettwitz. IPW Report 429, July 22nd, 2015
[6] DIN SPEC 30752-1: Refuse collection vehicles — Environmental efficiency —
Part 1: Requirements on the test procedure for fuel consumption at the collection
area
[7] ACEA: White Book on CO2 declaration procedure HDV ACEA Workgroup-
CO2HDV, Version April 2016; Overview on completion status LOT4 board, apr
21st 2016. Document shared with DG CLIMA and SR7 consortium
[8] SIOUX LIME: Assessment of ACEA driving cycles, September 2016
[9] Thomas Schütz (Herausgeber): Hucho – Aerodynamik des Automobils 6.,
vollständig überarbeitete und erweiterte Auflage ISBN 978-3-8348-1919-2
Springer Fachmedien Wiesbaden 2005, 2013
[10] Huss A., Maas H., Hass H: TANK-TO-WHEELS Report Version 4.0. European
Commission Joint Research Centre Institute for Energy and Transport. ISBN 978-
92-79-31195-6. © European Union, 2013
[11] Hausberger S., Silberholz G., Kies A., Dekker H.: Report of the Research
Program on an Emissions and CO2 Test Procedure for Heavy Duty Hybrids
(HDH), Final Report for UNECE-GRPE HDH Working Group, Geneva –
Switzerland, TNO report nr. 2012 R10679, 27.09.2012

Service contract CLIMA.C.2/SER/2012/0004 Draft final Report
128
[12] Silberholz G., Hausberger S.: Feasibility assessment regarding the development
of VECTO for hybrid heavy-duty vehicles. Draft final report for service contract
CLIMA.C.4/ETU/2016/0005LV. Graz 6.7.2017
[13] Norris J., Hill N., Kirsch F., Nurse D., Revereault P., Preston M.: Quantifying
energy consumption of HDV auxiliary components and their contribution to CO2
emissions of buses and coaches. Heavy Duty Vehicles Framework Contract –
Service Request 3 Final Report for DG Climate Action Ref:
CLIMA.C.2/FRA/2013/0007
[14] Hausberger S., Vermeulen R., et.al.: MAC performance test procedure; Co-
ordination of the pilot test phase and follow up towards the drafting of the
regulatory text; Performed under FRAMEWORK CONTRACT
ENTR/F1/2009/030.1; TNO report, 2013
[15] Frasquet C., Indinger T.: Schwere Nutzfahrzeugkonfigurationen unter Einfluss
realitätsnaher Anströmbedingungen. FAT Schriftenreihe 281, 2014

Service contract CLIMA.C.2/SER/2012/0004 Draft final Report
129
Annex I: Documents for Planning of the Bus and Coach Pre-Pilot Phase (PPP)

Service contract CLIMA.C.2/SER/2012/0004 Draft final Report
130

Service contract CLIMA.C.2/SER/2012/0004 Draft final Report
131

Service contract CLIMA.C.2/SER/2012/0004 Draft final Report
132
Annex II: Guidelines how to use VECTO in the Bus and Coach Pre-Pilot Phase (PPP)
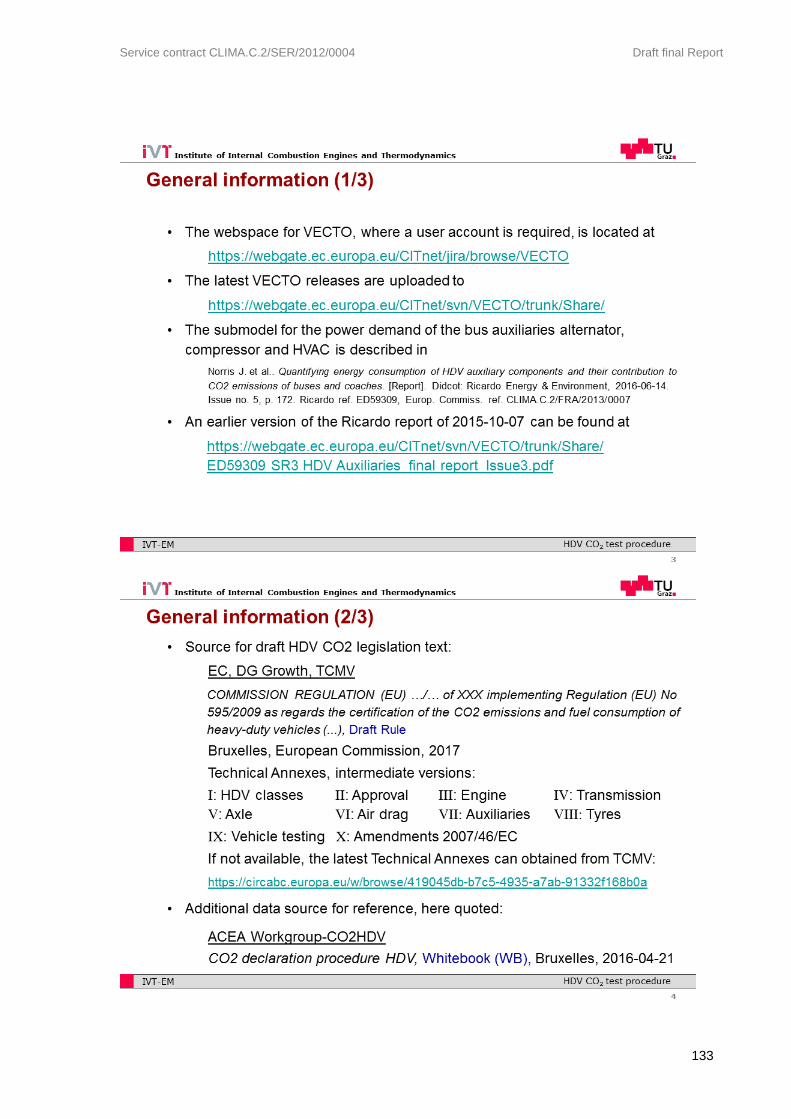
Service contract CLIMA.C.2/SER/2012/0004 Draft final Report
133

Service contract CLIMA.C.2/SER/2012/0004 Draft final Report
134

Service contract CLIMA.C.2/SER/2012/0004 Draft final Report
135

Service contract CLIMA.C.2/SER/2012/0004 Draft final Report
136

Service contract CLIMA.C.2/SER/2012/0004 Draft final Report
137

Service contract CLIMA.C.2/SER/2012/0004 Draft final Report
138

Service contract CLIMA.C.2/SER/2012/0004 Draft final Report
139

Service contract CLIMA.C.2/SER/2012/0004 Draft final Report
140

Service contract CLIMA.C.2/SER/2012/0004 Draft final Report
141

Service contract CLIMA.C.2/SER/2012/0004 Draft final Report
142

Service contract CLIMA.C.2/SER/2012/0004 Draft final Report
143

Service contract CLIMA.C.2/SER/2012/0004 Draft final Report
144

Service contract CLIMA.C.2/SER/2012/0004 Draft final Report
145

Service contract CLIMA.C.2/SER/2012/0004 Draft final Report
146
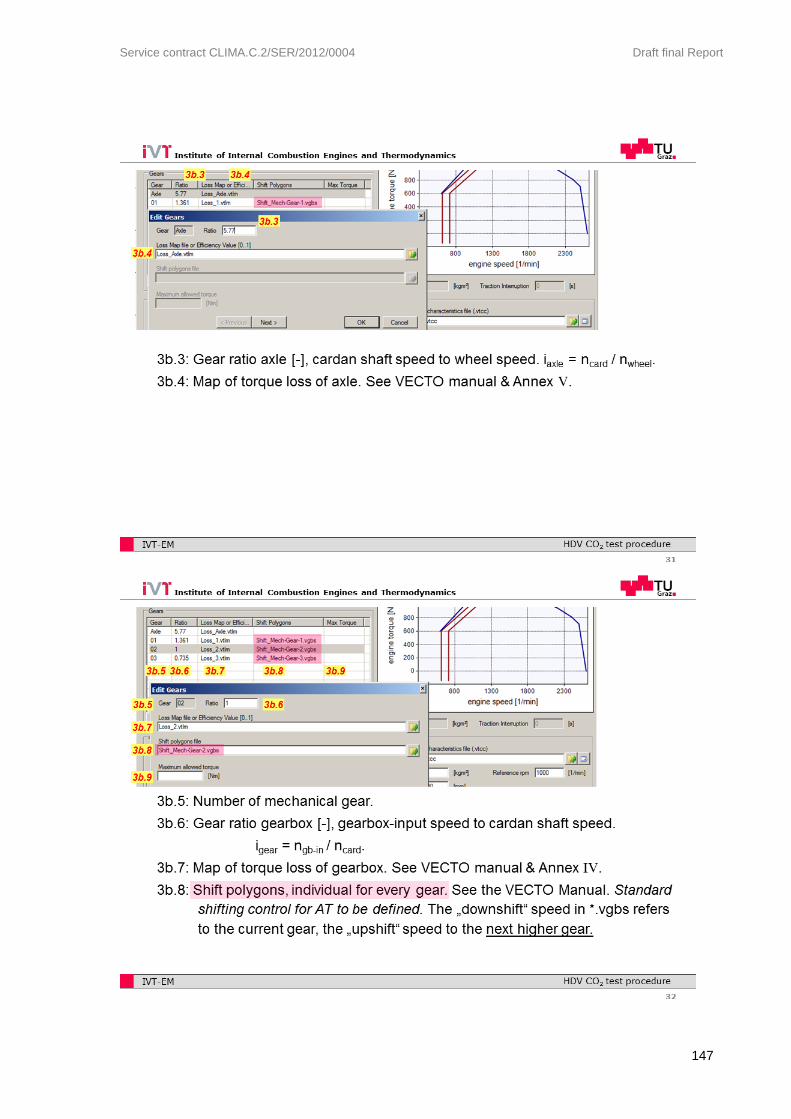
Service contract CLIMA.C.2/SER/2012/0004 Draft final Report
147
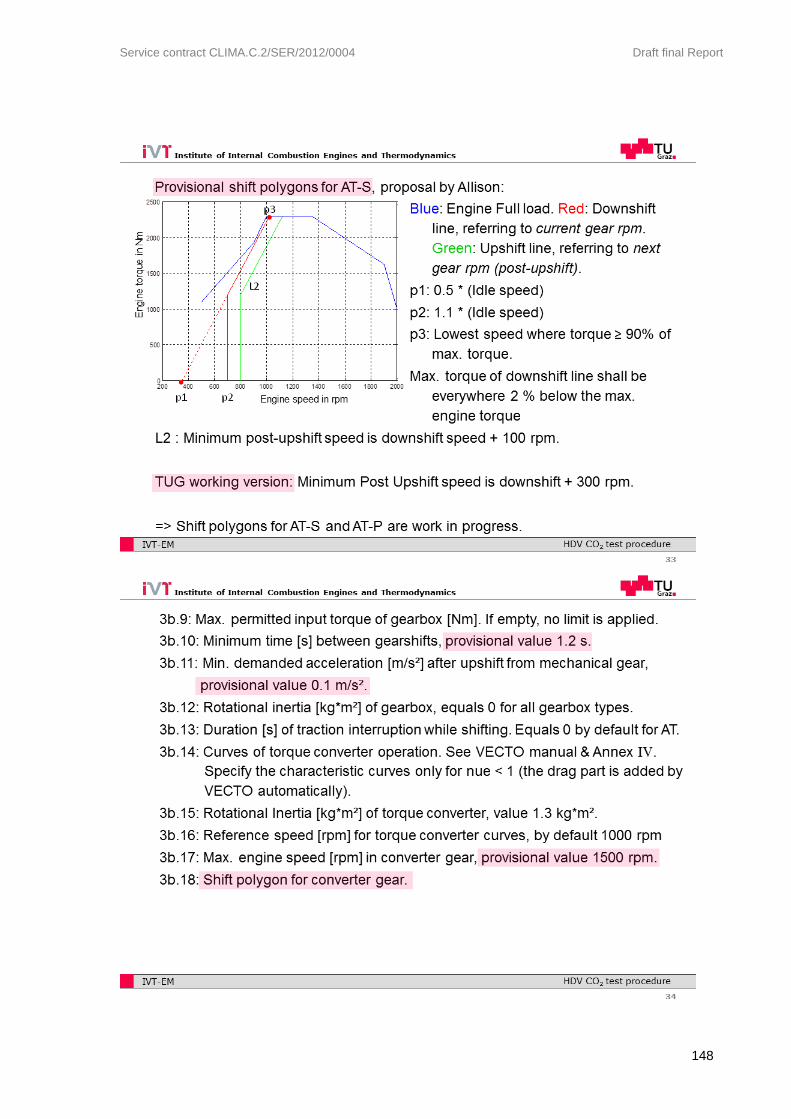
Service contract CLIMA.C.2/SER/2012/0004 Draft final Report
148

Service contract CLIMA.C.2/SER/2012/0004 Draft final Report
149

Service contract CLIMA.C.2/SER/2012/0004 Draft final Report
150

Service contract CLIMA.C.2/SER/2012/0004 Draft final Report
151

Service contract CLIMA.C.2/SER/2012/0004 Draft final Report
152

Service contract CLIMA.C.2/SER/2012/0004 Draft final Report
153

Service contract CLIMA.C.2/SER/2012/0004 Draft final Report
154
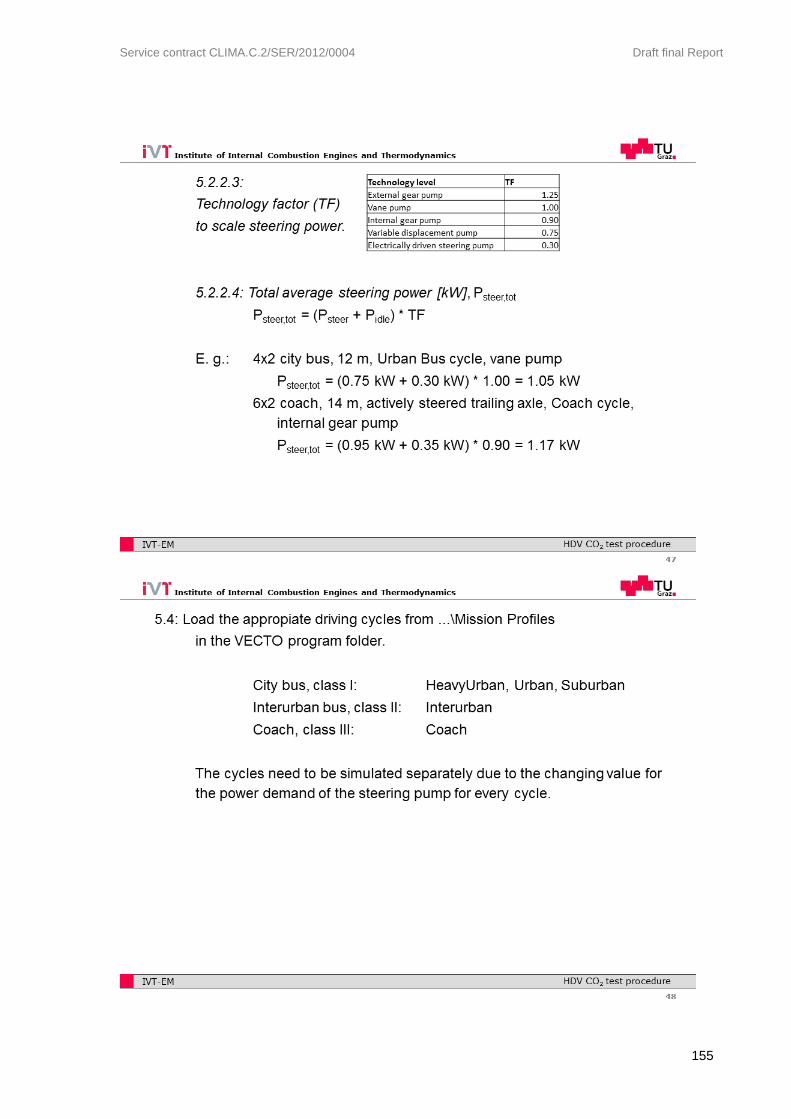
Service contract CLIMA.C.2/SER/2012/0004 Draft final Report
155

Service contract CLIMA.C.2/SER/2012/0004 Draft final Report
156

Service contract CLIMA.C.2/SER/2012/0004 Draft final Report
157