vCenter Adapter Install and Config Guide
78
VMware vCenter Adapter Installation and Configuration Guide vCenter Operations Manager 1.0 This document supports the version of each product listed and supports all subsequent versions until the document is replaced by a new edition. To check for more recent editions of this document, see http://www.vmware.com/support/pubs. EN-000912-02
description
vCops adapter info
Transcript of vCenter Adapter Install and Config Guide
VMware vCenter Adapter Installationand Configuration Guide
vCenter Operations Manager 1.0
This document supports the version of each product listed andsupports all subsequent versions until the document is replacedby a new edition. To check for more recent editions of thisdocument, see http://www.vmware.com/support/pubs.
EN-000912-02

VMware vCenter Adapter Installation and Configuration Guide
2 VMware, Inc.
You can find the most up-to-date technical documentation on the VMware Web site at:
http://www.vmware.com/support/
The VMware Web site also provides the latest product updates.
If you have comments about this documentation, submit your feedback to:
Copyright © 2013 VMware, Inc. All rights reserved. This product is protected by U.S. and international copyright and intellectualproperty laws. VMware products are covered by one or more patents listed at http://www.vmware.com/go/patents.
VMware is a registered trademark or trademark of VMware, Inc. in the United States and/or other jurisdictions. All other marksand names mentioned herein may be trademarks of their respective companies.
VMware, Inc.3401 Hillview Ave.Palo Alto, CA 94304www.vmware.com

Contents
VMware vCenter Adapter Installation and Configuration Guide 5
Updated Information 7
1 Introduction to the vCenter Adapter 9
How the Adapter Creates Resources 9Data that the Adapter Collects 9Using the VM Entity Status Resource Tag 10Installation and Configuration Requirements 10vCenter Adapter Resource Identification 11
2 Installing the vCenter Adapter 15
Install the Adapter in a Standalone Installation 15Install the Adapter in a vApp Installation 16vCenter Adapter Folders and Files 16
3 Configuring the vCenter Adapter 19
Add a Credential 19Add an Adapter Instance 20Reducing the Number of Collected Metrics 20
4 Troubleshooting the vCenter Adapter 21
Troubleshooting a vCenter Adapter Instance 21View Collection Information 21Viewing System Log Files 23
5 Metrics for vCenter Server Components 25
vCenter Server Metrics 25Datacenter Metrics 28Cluster Compute Resource Metrics 30Resource Pool Metrics 35Host System Metrics 37Virtual Machine Metrics 48Datastore Metrics 55Capacity Planning Metrics 59Badge Metrics 63
6 Metrics for vCenter Operations Manager Components 65
Analytics Metrics 65Collector Metrics 70ActiveMQ Service Metrics 71
VMware, Inc. 3

Web Server Metrics 72Replication Server Metrics 74Database Metrics 74Host Operating System Metrics 75
Index 77
VMware vCenter Adapter Installation and Configuration Guide
4 VMware, Inc.
VMware vCenter Adapter Installation andConfiguration Guide
The VMware vCenter Adapter Installation and Configuration Guide describes how to install and configure thevCenter adapter for vCenter Operations Manager.
Intended AudienceThis information is intended for anyone who needs to install or configure the vCenter adapter.
VMware, Inc. 5

VMware vCenter Adapter Installation and Configuration Guide
6 VMware, Inc.

Updated Information
The VMware vCenter Adapter Installation and Configuration Guide is updated with each release of the product orwhen necessary.
This table provides the update history of the VMware vCenter Adapter Installation and Configuration Guide.
Revision Description
EN-000912-02 n Updated the list of compatible vSphere versions in “Installation and Configuration Requirements,” onpage 10.
n Added “Reducing the Number of Collected Metrics,” on page 20.n Added the datastore | notshared metric to “Virtual Machine Metrics,” on page 48.n Added Chapter 6, “Metrics for vCenter Operations Manager Components,” on page 65.
EN-000912-01 n Changed the product name to reflect the new licensing model for the 5.6 release.n Added “vCenter Adapter Folders and Files,” on page 16.n Added information about configuring the adapter in a 5.6 or later vApp installation to Chapter 3,
“Configuring the vCenter Adapter,” on page 19.n Added “View Collection Information,” on page 21.n Added metrics to Chapter 5, “Metrics for vCenter Server Components,” on page 25
EN-000912-00 The vCenter Adapter Technical Note is now the VMware vCenter Adapter Installation and Configuration Guide.
The vCenter Adapter Technical Note was the initial release of this document.
VMware, Inc. 7

VMware vCenter Adapter Installation and Configuration Guide
8 VMware, Inc.
Introduction to the vCenter Adapter 1The vCenter adapter is an embedded adapter for vCenter Operations Manager. The adapter collects metricsfrom vCenter Server.
This chapter includes the following topics:
n “How the Adapter Creates Resources,” on page 9
n “Data that the Adapter Collects,” on page 9
n “Using the VM Entity Status Resource Tag,” on page 10
n “Installation and Configuration Requirements,” on page 10
n “vCenter Adapter Resource Identification,” on page 11
How the Adapter Creates ResourcesThe vCenter adapter can create resources in vCenter Operations Manager by using auto-discovery and manualdiscovery.
When you enable auto-discovery for a vCenter adapter instance, the adapter discovers and creates resourcesin vCenter Operations Manager after it runs a main collection query.
You can use manual discovery to restrict the resources that the vCenter adapter creates invCenter Operations Manager. With manual discovery, the adapter sends a request to vCenter Server to returnall available resources and you select the resources to add.
Data that the Adapter CollectsDuring each collection cycle, the vCenter adapter retrieves metric values, events, and relationships fromvCenter Server.
For metric values, the adapter queries for up to five of the most recent 20-second samples from vCenter Serverand calculates the average. The adapter also adds several aggregate metrics, which it calculates based on thosevalues.
The vCenter adapter collects metrics for the following vCenter Server objects:
n Datacenter
n Cluster
n Resource Pools
n Host
n Virtual Machine
VMware, Inc. 9
n Datastore
n Folder
For information about the metrics that the adapter collects for these objects, see Chapter 5, “Metrics for vCenterServer Components,” on page 25.
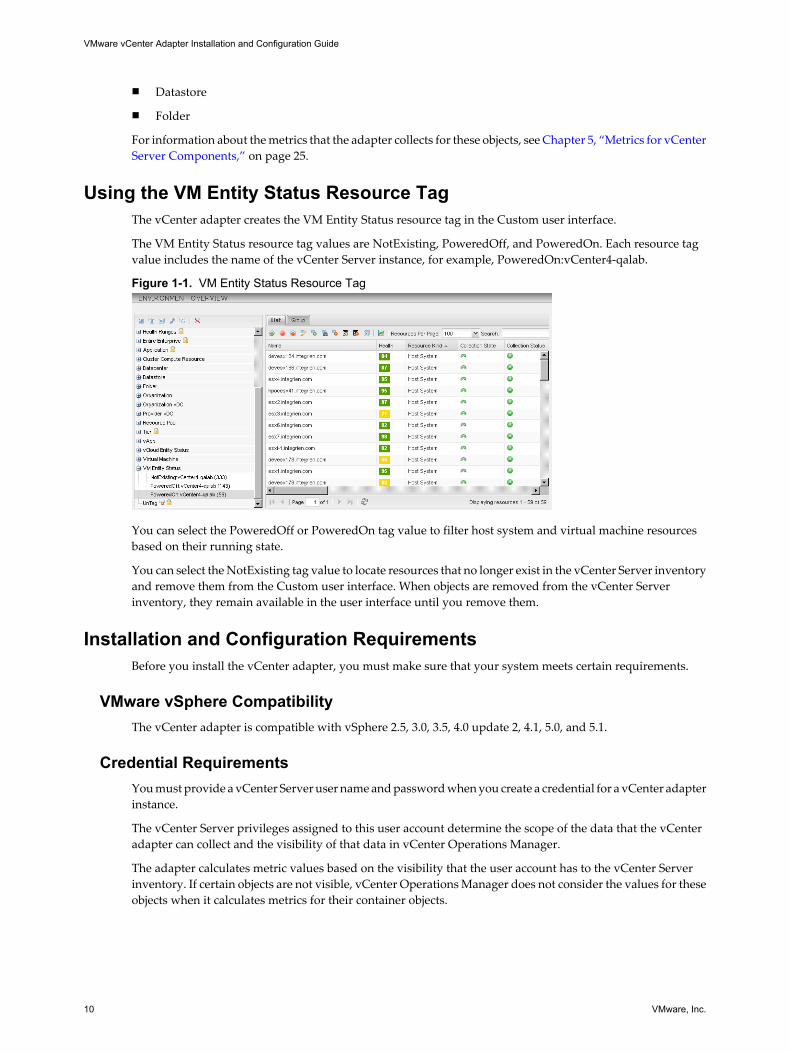
Using the VM Entity Status Resource TagThe vCenter adapter creates the VM Entity Status resource tag in the Custom user interface.
The VM Entity Status resource tag values are NotExisting, PoweredOff, and PoweredOn. Each resource tagvalue includes the name of the vCenter Server instance, for example, PoweredOn:vCenter4-qalab.
Figure 1-1. VM Entity Status Resource Tag
You can select the PoweredOff or PoweredOn tag value to filter host system and virtual machine resourcesbased on their running state.
You can select the NotExisting tag value to locate resources that no longer exist in the vCenter Server inventoryand remove them from the Custom user interface. When objects are removed from the vCenter Serverinventory, they remain available in the user interface until you remove them.
Installation and Configuration RequirementsBefore you install the vCenter adapter, you must make sure that your system meets certain requirements.
VMware vSphere CompatibilityThe vCenter adapter is compatible with vSphere 2.5, 3.0, 3.5, 4.0 update 2, 4.1, 5.0, and 5.1.
Credential RequirementsYou must provide a vCenter Server user name and password when you create a credential for a vCenter adapterinstance.
The vCenter Server privileges assigned to this user account determine the scope of the data that the vCenteradapter can collect and the visibility of that data in vCenter Operations Manager.
The adapter calculates metric values based on the visibility that the user account has to the vCenter Serverinventory. If certain objects are not visible, vCenter Operations Manager does not consider the values for theseobjects when it calculates metrics for their container objects.
VMware vCenter Adapter Installation and Configuration Guide
10 VMware, Inc.

At a minimum, the user account must have Read privileges and the Read privileges must be assigned at theDatacenter or vCenter Server level. If the Read privileges are assigned to selected ESX hosts or individualvirtual machines, vCenter Operations Manager cannot show metrics for their parent objects. For example, ifthe user account has Read privileges only for an ESX host, you cannot view metrics for the parent datastore,cluster, or datacenter of that ESX host in vCenter Operations Manager.
vCenter Adapter Resource IdentificationThe vCenter adapter uses certain resource identifiers. You must specify resource identifiers when you referencevCenter adapter resources with the vCenter Operations Manager API.
Adapter KindThe adapter kind for the vCenter adapter is VMware Adapter and the identifier key is VMWARE.
Adapter Instance Resource KindThe adapter instance resource kind for a vCenter adapter instance is vCenter Server and the identifier key isVMwareAdapter Instance.
A vCenter adapter instance resource has a specific identifier key.
Table 1-1. vCenter Adapter Instance Resource Identifier Key
Key Part of Uniqueness Default Name (en) Description
VCURL Yes VC Host Host name or IP address of avCenter Server host.
Datacenter Resource KindThe resource kind for a vCenter Server datacenter is Datacenter and the identifier key is Datacenter.
A Datacenter resource has specific identifier keys.
Table 1-2. Datacenter Resource Identifier Keys
Key Part of Uniqueness Default Name (en) Description
VMEntityName No VM Entity Name Name of the datacenter.
VMEntityObjectID Yes VM Entity Object ID vCenter Server object ID forthe datacenter, for example,datacenter-2.
VMEntityVCID Yes VC ID vCenter Server unique ID.
Cluster Compute Resource KindThe resource kind for a vCenter Server cluster is Cluster Compute Resource and the identifier key isClusterComputeResource.
A Cluster Compute Resource resource has specific identifier keys.
Chapter 1 Introduction to the vCenter Adapter
VMware, Inc. 11
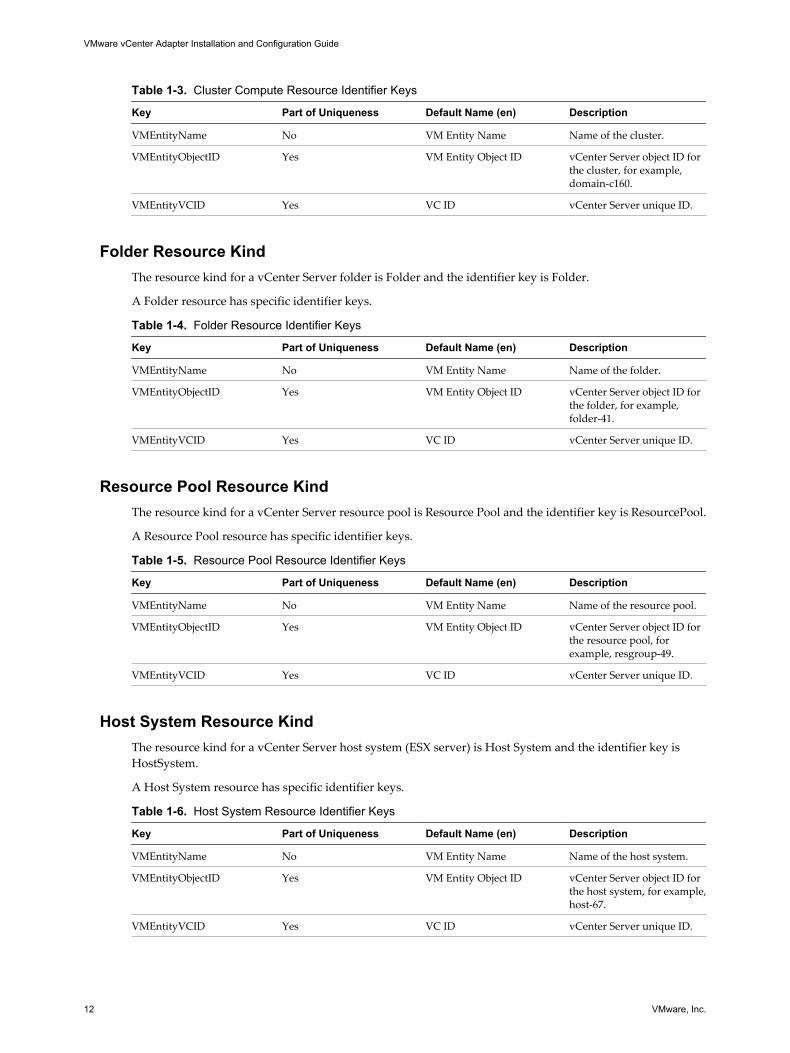
Table 1-3. Cluster Compute Resource Identifier Keys
Key Part of Uniqueness Default Name (en) Description
VMEntityName No VM Entity Name Name of the cluster.
VMEntityObjectID Yes VM Entity Object ID vCenter Server object ID forthe cluster, for example,domain-c160.
VMEntityVCID Yes VC ID vCenter Server unique ID.
Folder Resource KindThe resource kind for a vCenter Server folder is Folder and the identifier key is Folder.
A Folder resource has specific identifier keys.
Table 1-4. Folder Resource Identifier Keys
Key Part of Uniqueness Default Name (en) Description
VMEntityName No VM Entity Name Name of the folder.
VMEntityObjectID Yes VM Entity Object ID vCenter Server object ID forthe folder, for example,folder-41.
VMEntityVCID Yes VC ID vCenter Server unique ID.
Resource Pool Resource KindThe resource kind for a vCenter Server resource pool is Resource Pool and the identifier key is ResourcePool.
A Resource Pool resource has specific identifier keys.
Table 1-5. Resource Pool Resource Identifier Keys
Key Part of Uniqueness Default Name (en) Description
VMEntityName No VM Entity Name Name of the resource pool.
VMEntityObjectID Yes VM Entity Object ID vCenter Server object ID forthe resource pool, forexample, resgroup-49.
VMEntityVCID Yes VC ID vCenter Server unique ID.
Host System Resource KindThe resource kind for a vCenter Server host system (ESX server) is Host System and the identifier key isHostSystem.
A Host System resource has specific identifier keys.
Table 1-6. Host System Resource Identifier Keys
Key Part of Uniqueness Default Name (en) Description
VMEntityName No VM Entity Name Name of the host system.
VMEntityObjectID Yes VM Entity Object ID vCenter Server object ID forthe host system, for example,host-67.
VMEntityVCID Yes VC ID vCenter Server unique ID.
VMware vCenter Adapter Installation and Configuration Guide
12 VMware, Inc.

Virtual Machine Resource KindThe resource kind for a virtual machine is Virtual Machine and the identifier key is VirtualMachine.
A Virtual Machine resource has specific identifier keys.
Table 1-7. Cluster Compute Resource Identifier Keys
Key Part of Uniqueness Default Name (en) Description
VMEntityName No VM Entity Name Name of the virtual machine.
VMEntityObjectID Yes VM Entity Object ID vCenter Server object ID forthe virtual machine, forexample, vm-67.
VMEntityVCID Yes VC ID vCenter Server unique ID.
Datastore Resource KindThe resource kind for a vCenter Sever datastore is Datastore and the identifier key is Datastore.
A Datastore resource has specific identifier keys.
Table 1-8. Datastore Resource Identifier Keys
Key Part of Uniqueness Default Name (en) Description
VMEntityName No VM Entity Name Name of the datastore.
VMEntityObjectID Yes VM Entity Object ID vCenter Server object ID forthe datastore, for example,datastore-1.
VMEntityVCID Yes VC ID vCenter Server unique ID.
DataStorePath No Datastore Path For NFS-based datastores, astring in the format storage-system-IP-address/path-to-element-in-storage-system.
Compute Resource KindThe resource kind for a vCenter server compute resource is Compute Resource and the identifier key isComputerResource.
A Compute Resource resource has specific identifier keys.
Table 1-9. Compute Resource Identifier Keys
Key Part of Uniqueness Default Name (en) Description
VMEntityName No VM Entity Name Name of the resource.
VMEntityObjectID Yes VM Entity Object ID vCenter Server object ID forthe resource.
VMEntityVCID Yes VC ID vCenter Server unique ID.
World Resource KindThe World object is a logical container for all monitored objects. The resource kind for the World object is Worldand the identifier key is World.
Chapter 1 Introduction to the vCenter Adapter
VMware, Inc. 13

VC ID ValuesFor vCenter Server 4.0 and later, the VC ID is set to the VC UUID. For version 2.5, the VC ID is set to the vCenterServer host name.
VMware vCenter Adapter Installation and Configuration Guide
14 VMware, Inc.
Installing the vCenter Adapter 2How you install the vCenter adapter depends on whether you have a standalone or vApp installation.
This chapter includes the following topics:
n “Install the Adapter in a Standalone Installation,” on page 15
n “Install the Adapter in a vApp Installation,” on page 16
n “vCenter Adapter Folders and Files,” on page 16
Install the Adapter in a Standalone InstallationIf you have a standalone installation, you install the vCenter adapter by extracting the adapter installation filesfrom a TGZ file and running an installation utility.
Prerequisites
n Download the adapter installation TGZ file anonymously from ftp://ftp.integrien.com/.
n Make a note of the build number in the TGZ file name. The build number appears after the adapter name,for example, adaptername-buildnumber.tgz.
n Read the release notes that are included with the TGZ file.
Procedure
1 Open the TGZ file and extract the TAR file to a temporary folder on your vCenter Operations Managerserver.
2 In the temporary folder, open the TAR file and extract and run the installer for your operating systemplatform.
3 Log in to the Custom user interface as an administrator.
4 Select Admin > Support.
5 On the Info tab, find the Adapters Info pane and click the Describe icon ( ).
The Describe icon is located at the top right of the Adapters Info pane.
6 Click Yes to start the describe process and click OK.
The Custom user interface finds the adapter files, gathers information about the abilities of the adapter,and updates the user interface with information about the adapter. If you have remote collectors, it installsthe adapter on the remote collectors.
The describe process might take several minutes. When the describe process is finished, the adapterappears in the Adapters Info pane. The build number is in the Adapter Version column.
VMware, Inc. 15

7 Verify that the build number in the Adapter Version column for the adapter matches the build number inthe TGZ file that you downloaded.
Install the Adapter in a vApp InstallationIf you have a vApp installation, you install the vCenter adapter from a PAK file.
Prerequisites
n Download the adapter installation PAK file anonymously from ftp://ftp.integrien.com.
n Make a note of the build number in the PAK file name. The build number appears after the adapter name,for example, adaptername-buildnumber.pak.
n Read the release notes that are included with the PAK file.
Procedure
1 Save the PAK file in a temporary folder.
2 Log in to the Admin user interface as the admin user.
For example: https://ipaddress/admin/
3 On the Update tab, click Browse to locate the temporary folder and select the PAK file.
4 Click Update and click OK to confirm the update.
The Admin user interface uploads the PAK file. The upload might take several minutes.
5 Read and accept the EULA and click OK.
6 Click OK to confirm and start the update process.
The update might take several minutes. Status information appears on the Update tab when the updateis finished.
7 Log in to the Custom user interface as an administrator.
For example: https://ipaddress/vcops-custom/
8 Select Admin > Support.
9 On the Info tab, find the Adapters Info pane and click the Describe icon ( ).
The Describe icon is located at the top right of the Adapters Info pane.
10 Click Yes to start the describe process and click OK.
The Custom user interface finds the adapter files, gathers information about the abilities of the adapter,and updates the user interface with information about the adapter.
The describe process might take several minutes. When the describe process is finished, the adapterappears in the Adapters Info pane. The build number is in the Adapter Version column.
11 Verify that the build number in the Adapter Version column for the adapter matches the build number inthe PAK file that you uploaded.
vCenter Adapter Folders and FilesThe installer places the vCenter adapter files in the vcenter-ops/user/plugins/inbound/vcenter_adapter3folder.
The vcenter_adapter3 folder contains several subfolders and files.
VMware vCenter Adapter Installation and Configuration Guide
16 VMware, Inc.
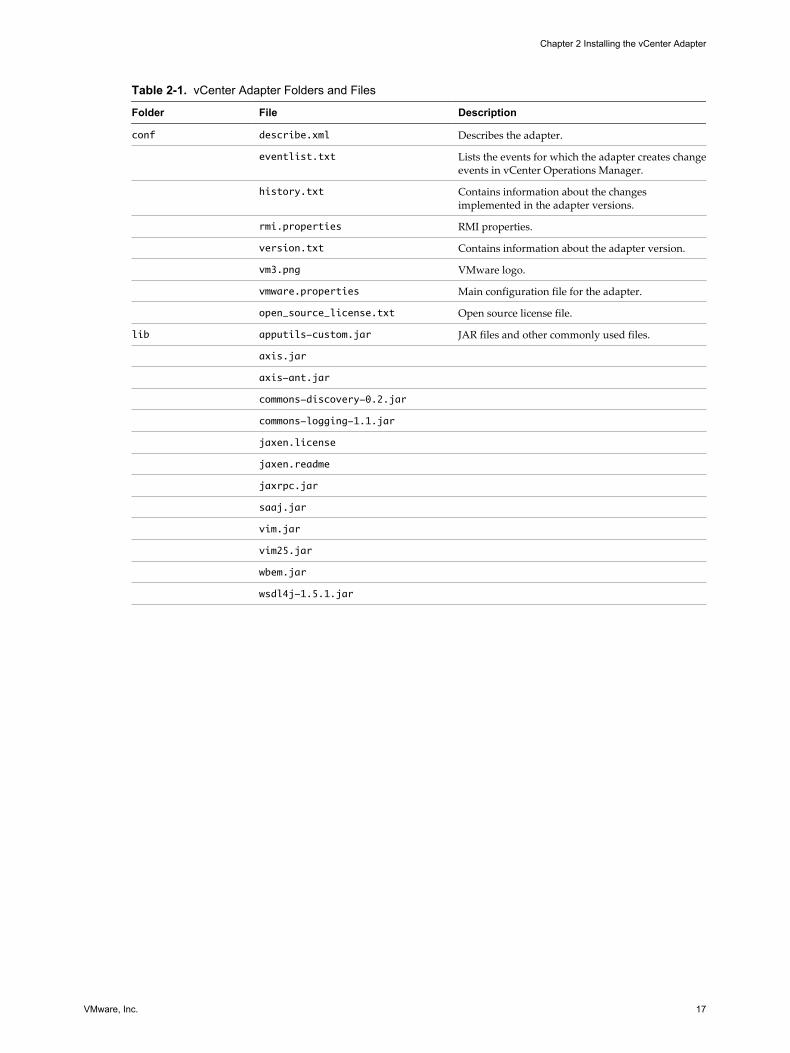
Table 2-1. vCenter Adapter Folders and Files
Folder File Description
conf describe.xml Describes the adapter.
eventlist.txt Lists the events for which the adapter creates changeevents in vCenter Operations Manager.
history.txt Contains information about the changesimplemented in the adapter versions.
rmi.properties RMI properties.
version.txt Contains information about the adapter version.
vm3.png VMware logo.
vmware.properties Main configuration file for the adapter.
open_source_license.txt Open source license file.
lib apputils-custom.jar JAR files and other commonly used files.
axis.jar
axis-ant.jar
commons-discovery-0.2.jar
commons-logging-1.1.jar
jaxen.license
jaxen.readme
jaxrpc.jar
saaj.jar
vim.jar
vim25.jar
wbem.jar
wsdl4j-1.5.1.jar
Chapter 2 Installing the vCenter Adapter
VMware, Inc. 17

VMware vCenter Adapter Installation and Configuration Guide
18 VMware, Inc.

Configuring the vCenter Adapter 3For pre-5.6 releases, you configure the vCenter adapter by adding a credential and an adapter instance in theCustom user interface.
For 5.6 and later releases, you add a credential and an adapter instance in the Custom user interface only ifyou have a standalone installation.
If you have a 5.6 or later vApp installation, you manage the vCenter adapter from vCenter Operations ManagerAdministration. You define adapter settings for a vCenter server system in the vCenter Server Registrationpane on the Registration tab. For more information, see the vCenter Operations Manager Administration onlinehelp.
This chapter includes the following topics:
n “Add a Credential,” on page 19
n “Add an Adapter Instance,” on page 20
n “Reducing the Number of Collected Metrics,” on page 20
Add a CredentialYou must use the Custom user interface to create a credential for a vCenter adapter instance if you have a 5.6or later standalone installation or a pre-5.6 standalone or vApp installation.
You use a vCenter Server user name and password to create a credential for the adapter instance.
You can add the credential before you create the adapter instance and select the correct credential when youdefine the adapter instance, or you can add the credential when you define the adapter instance.
Prerequisites
n Install or upgrade the vCenter adapter. See Chapter 2, “Installing the vCenter Adapter,” on page 15.
n Verify that the user name and password meet the credential requirements. See “CredentialRequirements,” on page 10.
Procedure
1 Log in to the Custom user interface as an administrator.
2 Select Environment > Configuration > Credentials.
3 Select VMware Adapter from the Adapter Kind drop-down menu.
4 Select Principal Credential from the Credential Kind drop-down menu.
5 At the top of the list of credentials, next to Action, click Add.
6 Type a unique name for the credential instance in the Instance name text box.
VMware, Inc. 19
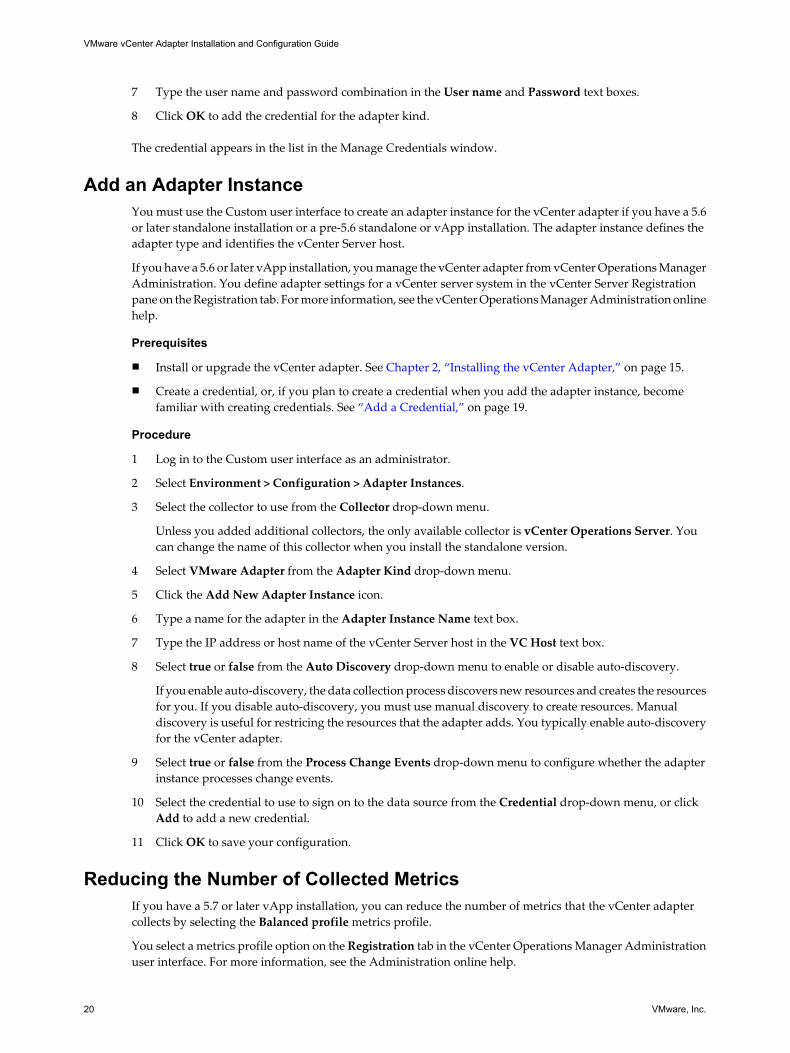
7 Type the user name and password combination in the User name and Password text boxes.
8 Click OK to add the credential for the adapter kind.
The credential appears in the list in the Manage Credentials window.
Add an Adapter InstanceYou must use the Custom user interface to create an adapter instance for the vCenter adapter if you have a 5.6or later standalone installation or a pre-5.6 standalone or vApp installation. The adapter instance defines theadapter type and identifies the vCenter Server host.
If you have a 5.6 or later vApp installation, you manage the vCenter adapter from vCenter Operations ManagerAdministration. You define adapter settings for a vCenter server system in the vCenter Server Registrationpane on the Registration tab. For more information, see the vCenter Operations Manager Administration onlinehelp.
Prerequisites
n Install or upgrade the vCenter adapter. See Chapter 2, “Installing the vCenter Adapter,” on page 15.
n Create a credential, or, if you plan to create a credential when you add the adapter instance, becomefamiliar with creating credentials. See “Add a Credential,” on page 19.
Procedure
1 Log in to the Custom user interface as an administrator.
2 Select Environment > Configuration > Adapter Instances.
3 Select the collector to use from the Collector drop-down menu.
Unless you added additional collectors, the only available collector is vCenter Operations Server. Youcan change the name of this collector when you install the standalone version.
4 Select VMware Adapter from the Adapter Kind drop-down menu.
5 Click the Add New Adapter Instance icon.
6 Type a name for the adapter in the Adapter Instance Name text box.
7 Type the IP address or host name of the vCenter Server host in the VC Host text box.
8 Select true or false from the Auto Discovery drop-down menu to enable or disable auto-discovery.
If you enable auto-discovery, the data collection process discovers new resources and creates the resourcesfor you. If you disable auto-discovery, you must use manual discovery to create resources. Manualdiscovery is useful for restricing the resources that the adapter adds. You typically enable auto-discoveryfor the vCenter adapter.
9 Select true or false from the Process Change Events drop-down menu to configure whether the adapterinstance processes change events.
10 Select the credential to use to sign on to the data source from the Credential drop-down menu, or clickAdd to add a new credential.
11 Click OK to save your configuration.
Reducing the Number of Collected MetricsIf you have a 5.7 or later vApp installation, you can reduce the number of metrics that the vCenter adaptercollects by selecting the Balanced profile metrics profile.
You select a metrics profile option on the Registration tab in the vCenter Operations Manager Administrationuser interface. For more information, see the Administration online help.
VMware vCenter Adapter Installation and Configuration Guide
20 VMware, Inc.

Troubleshooting the vCenter Adapter 4Known troubleshooting information can help you diagnose and correct common problems with the vCenteradapter.
This chapter includes the following topics:
n “Troubleshooting a vCenter Adapter Instance,” on page 21
n “View Collection Information,” on page 21
n “Viewing System Log Files,” on page 23
Troubleshooting a vCenter Adapter InstancePerform these general troubleshooting steps to diagnose and correct problems with a vCenter adapter instance.
1 Verify that vCenter Server is running.
2 View the collection status and collection state for the adapter instance resource in Custom user interface.See “View Collection Information,” on page 21.
3 Check the adapter and collector logs for errors. See “Viewing System Log Files,” on page 23.
View Collection InformationYou can view collection information for a vCenter adapter instance in the Custom user interface. Thisinformation can help you diagnose and troubleshoot adapter problems.
Prerequisites
Become familiar with the collection states and status values. See “Collection States,” on page 22 and “Collection Status Values,” on page 23.
Procedure
1 Log in to the Custom user interface as an administrator.
2 Select Environment > Environment Overview and find the vCenter adapter instance resource on theList tab.
3 Point to the icon in the Collection State column to see whether vCenter Operations Manager should becollecting data through the adapter instance.
The collection state appears in a pop-up window. If the adapter instance is set to collect data, the collectionstate is Collecting.
4 (Optional) If you have vCenter Operations Manager 5.6 or later, click the icon in the Collection Statecolumn to see detailed information about the collection state.
VMware, Inc. 21

5 Point to the icon in the Collection Status column to see whether vCenter Operations Manager is receivingdata through the adapter instance.
The collection status and a collection status message appear in a pop-up window. IfvCenter Operations Manager is receiving data through the adapter instance, the collection status is DataReceiving.
In vCenter Operations Manager 5.6 and later, the vCenter adapter generates a collection time statusmessage whenever a host system or virtual machine receives raw data from vCenter Server, for example,Message: Last successful collection time is "Fri May 11 11:44:09 PDT 2012".
Collection StatesThe resource collection state indicates whether vCenter Operations Manager should be collecting data for theresource.
The resource collection state appears in a pop-up window when you point to an icon in the Collection Statecolumn in the resource list on the Environment Overview page. If vCenter Operations Manager collects datafor a resource through more than one adapter instance, a separate icon appears for each adapter instance.
Table 4-1. Collection States
State Description
Collecting Resource is set to collect data.
Not Collecting Resource is set to not collect data.
Starting Collection is starting.
Stopping Collection is stopping.
Updating Resource is being updated.
Failed Resource configuration problem.
In Maintenance Resource is in scheduled maintenance.
In Maintenance (Manual) Resource is in manual maintenance.
Removing Resource is being deleted.
If you click an icon in the Collection State column, detailed information appears in a pop-up window.
Table 4-2. Detailed Collection State Information
Field Description
Adapter Instance Name of the adapter instance.
Collector Name of the collector that the adapter instance uses.
Last Heartbeat Amount of time since vCenter Operations Manager received a heartbeat message fromthe adapter. A long period of time might indicate a connection problem.
Status Status message from the collector.
Last Collection Time Amount of time since the end of the last collection cycle and the number of metricsthat the adapter collected during that cycle.
Last Collection Duration Length of time of the last collection cycle.
Metric Sparklines Graphical representations of the last collection cycle duration and the number ofmetrics and resources that the adapter collected during that cycle.
VMware vCenter Adapter Installation and Configuration Guide
22 VMware, Inc.
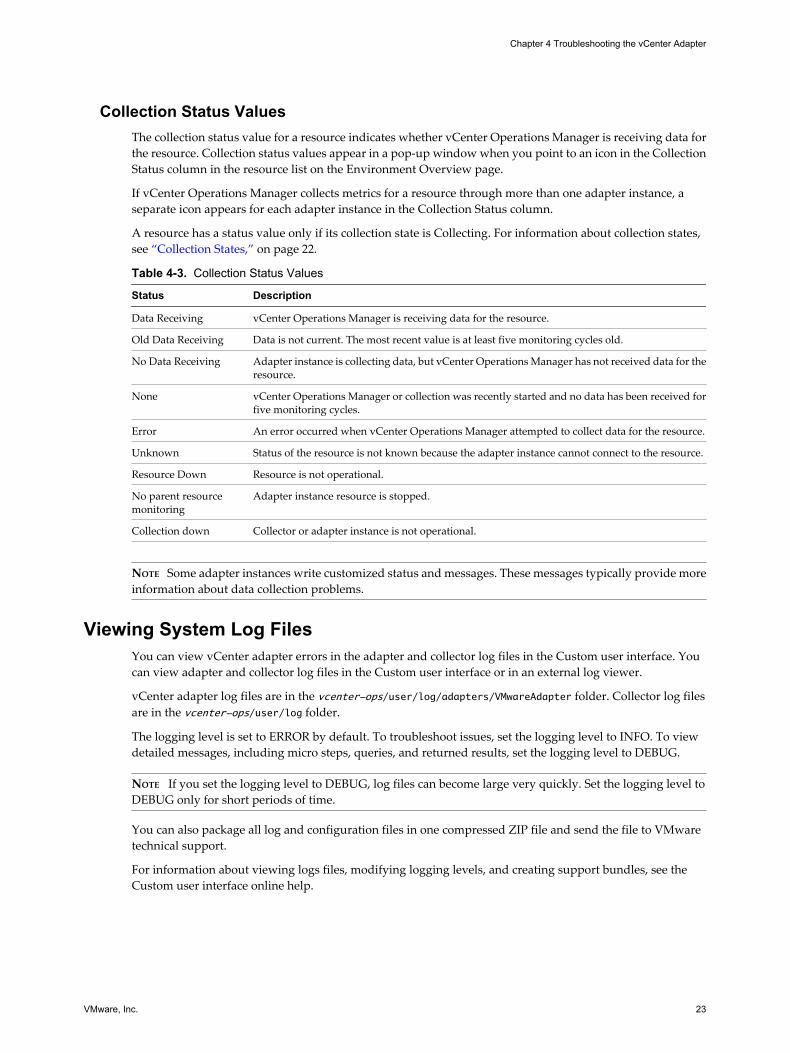
Collection Status ValuesThe collection status value for a resource indicates whether vCenter Operations Manager is receiving data forthe resource. Collection status values appear in a pop-up window when you point to an icon in the CollectionStatus column in the resource list on the Environment Overview page.
If vCenter Operations Manager collects metrics for a resource through more than one adapter instance, aseparate icon appears for each adapter instance in the Collection Status column.
A resource has a status value only if its collection state is Collecting. For information about collection states,see “Collection States,” on page 22.
Table 4-3. Collection Status Values
Status Description
Data Receiving vCenter Operations Manager is receiving data for the resource.
Old Data Receiving Data is not current. The most recent value is at least five monitoring cycles old.
No Data Receiving Adapter instance is collecting data, but vCenter Operations Manager has not received data for theresource.
None vCenter Operations Manager or collection was recently started and no data has been received forfive monitoring cycles.
Error An error occurred when vCenter Operations Manager attempted to collect data for the resource.
Unknown Status of the resource is not known because the adapter instance cannot connect to the resource.
Resource Down Resource is not operational.
No parent resourcemonitoring
Adapter instance resource is stopped.
Collection down Collector or adapter instance is not operational.
NOTE Some adapter instances write customized status and messages. These messages typically provide moreinformation about data collection problems.
Viewing System Log FilesYou can view vCenter adapter errors in the adapter and collector log files in the Custom user interface. Youcan view adapter and collector log files in the Custom user interface or in an external log viewer.
vCenter adapter log files are in the vcenter-ops/user/log/adapters/VMwareAdapter folder. Collector log filesare in the vcenter-ops/user/log folder.
The logging level is set to ERROR by default. To troubleshoot issues, set the logging level to INFO. To viewdetailed messages, including micro steps, queries, and returned results, set the logging level to DEBUG.
NOTE If you set the logging level to DEBUG, log files can become large very quickly. Set the logging level toDEBUG only for short periods of time.
You can also package all log and configuration files in one compressed ZIP file and send the file to VMwaretechnical support.
For information about viewing logs files, modifying logging levels, and creating support bundles, see theCustom user interface online help.
Chapter 4 Troubleshooting the vCenter Adapter
VMware, Inc. 23

VMware vCenter Adapter Installation and Configuration Guide
24 VMware, Inc.

Metrics for vCenter ServerComponents 5
The vCenter adapter collects metrics from vCenter Server and uses formulas to derive statistics from thosemetrics.
This chapter includes the following topics:
n “vCenter Server Metrics,” on page 25
n “Datacenter Metrics,” on page 28
n “Cluster Compute Resource Metrics,” on page 30
n “Resource Pool Metrics,” on page 35
n “Host System Metrics,” on page 37
n “Virtual Machine Metrics,” on page 48
n “Datastore Metrics,” on page 55
n “Capacity Planning Metrics,” on page 59
n “Badge Metrics,” on page 63
vCenter Server MetricsA vCenter adapter instance collects CPU use, disk, memory, network, and summary metrics for vCenter Serverresources.
CPU Usage MetricsCPU usage metrics provide information about CPU use.
Table 5-1. CPU Usage Metrics
Metric Key Metric Name Description
cpu | capacity_usagepct_average Capacity Usage (%) Percent capacity used.
cpu | capacity_contentionPct CPU Contention (%) Percent CPU contention.
cpu | demandPct Demand (%) Percent demand.
cpu | demandmhz Demand (MHz) Demand in megahertz.
cpu | iowait IO Wait (ms) IO wait time in milliseconds.
cpu | numpackages Number of CPU Sockets Number of CPU sockets.
cpu | capacity_contention Overall CPU Contention (ms) Overall CPU contention in milliseconds.
cpu | capacity_provisioned Provisioned Capacity (MHz) Provisioned capacity in megahertz.
VMware, Inc. 25

Table 5-1. CPU Usage Metrics (Continued)
Metric Key Metric Name Description
cpu | corecount_provisioned Provisioned CPU Cores Number of provisioned CPU cores.
cpu | reservedCapacity_average Reserved Capacity (MHz) Sum of the reservation properties of the immediatechildren of the host's root resource pool.
cpu | usagemhz_average Usage (MHz) CPU use in megahertz.
cpu | wait Wait (ms) CPU time spent on the idle state.
cpu | workload Workload (%) Percent workload.
Disk MetricsDisk metrics provide information about disk use.
Table 5-2. Disk Metrics
Metric Key Metric Name Description
disk |commandsAveraged_average
Commands per second Average number of commands issued per secondduring the collection cycle.
disk | totalLatency_average Disk Command Latency (ms) Average amount of time taken for a command fromthe perspective of the guest operating system. Thismetric is the sum of the Kernal Device CommandLatency and Physical Device Command Latencymetrics.
disk | usage_average Usage Rate (KBps) Average of the sum of the data read and written forall of the disk instances of the host or virtual machine.
disk | workload Workload (%) Percent workload.
Memory MetricsMemory metrics provide information about memory use and allocation.
Table 5-3. Memory Metrics
Metric Key Metric Name Description
mem | host_contentionPct Contention (%) Percent host memory contention.
mem | host_demand Machine Demand (KB) Host memory demand in kilobytes.
mem | workload Overall Workload (%) Percent memory workload.
mem | host_provisioned Provisioned Memory (KB) Provisioned host memory in kilobytes.
mem | reservedCapacity_average Reserved Capacity (KB) Sum of the reservation properties of the immediatechildren of the host's root resource pool.
mem | host_usable Usable Memory (KB) Usable host memory in kilobytes.
mem | host_usage Usage (KB) Host memory use in kilobytes.
mem | host_usagePct Usage/Usable (%) Percent host memory used.
mem | host_contention Contention (KB) Host contention in kilobytes.
Network MetricsNetwork metrics provide information about network performance.
VMware vCenter Adapter Installation and Configuration Guide
26 VMware, Inc.

Table 5-4. Network Metrics
Metric Key Metric Name Description
net | workload Workload (%) Percent network workload.
net | droppedPct Packets Dropped (%) Percent network packets dropped.
net | usage_average Usage Rate (KBps) Sum of the data transmitted and received for all ofthe NIC instances of the host or virtual machine.
net | usage_capacity I/O Usage Capacity IO use capacity.
net | packetsRx_summation Packets Received Number of packets received.
net | packetsTx_summation Packets Transmitted Number of packets transmitted.
net | droppedRx_summation Received Packets Dropped Number of received packets that were dropped.
net | droppedTx_summation Transmitted Packets Dropped Number of transmitted packets that were dropped.
Summary MetricsSummary metrics provide information about overall performance.
Table 5-5. Summary Metrics
Metric Key Metric Name Description
summary | capacity Capacity (%) Percent capacity.
summary | number_running_hosts Number of Running Hosts Number of running hosts.
summary | number_running_vms Number of Running VMs Number of running virtualmachines.
summary | total_number_clusters Total Number of Clusters Total number of clusters.
summary | total_number_datastores Total Number of Datastores Total number of datastores.
summary | total_number_hosts Total Number of Hosts Total number of hosts.
summary | total_number_vms Total Number of VMs Total number of virtual machines.
summary | version Version vCenter Server version.
summary | workload Workload (%) Percent workload.
summary | workload_indicator Workload Indicator (%) Percent workload indicator.
summary | total_number_datacenters Total Number of Datacenters Total number of datacenters.
summary |number_powered_on_cores
Number of Cores on Powered On Hosts Number of cores on powered-onhosts.
summary | number_running_vcpus Number VCPUs on Powered on VMs Number of virtual CPUs onpowered-on virtual machines.
summary | avg_vm_density Average Running VM Count per RunningHost
Average running virtual machinecount per running host.
summary | vcuuid VirtualCenter ID vCenter Server ID.
summary | vc_query_time VC Query Time (ms) vCenter Server query time inmilliseconds.
summary |derived_metrics_comp_time
Derived Metrics Computation Time (ms) Derived metrics computation timein milliseconds.Available only in 5.6 and laterreleases.
summary | number_objs Number of objects Number of objects.Available only in 5.6 and laterreleases.
Chapter 5 Metrics for vCenter Server Components
VMware, Inc. 27

Table 5-5. Summary Metrics (Continued)
Metric Key Metric Name Description
summary | number_vc_events Number of VC Events Number of vCenter Server events.Available only in 5.6 and laterreleases.
summary | number_sms_metrics Number of SMS Metrics Number of SMS metrics.Available only in 5.6 and laterreleases.
summary | collector_mem_usage Collector Memory Usage (MB) Collector memory use inmegabytes.Available only in 5.6 and laterreleases.
Datacenter MetricsThe vCenter adapter collects CPU usage, disk, memory, network, storage, disk space, and summary metricsfor datacenters.
CPU Usage Metrics for DatacentersCPU usage metrics provide information about CPU use.
Table 5-6. CPU Usage Metrics for Datacenters
Metric Key Metric Name Description
cpu | capacity_usagepct_average Capacity Usage (%) Percent capacity used.
cpu | capacity_contentionPct CPU Contention (%) Percent CPU contention.
cpu | demandPct Demand (%) Percent demand.
cpu | demandmhz Demand (MHz) Demand in megahertz.
cpu | wait IO Wait (ms) IO wait time in millliseconds.
cpu | numpackages Number of CPU Sockets Number of CPU sockets.
cpu | capacity_contention Overall CPU Contention (ms) Overall CPU contention in milliseconds.
cpu | capacity_provisioned Provisioned Capacity (MHz) Provisioned capacity in megahertz.
cpu | corecount_provisioned Provisioned CPU Cores Provisioned CPU cores.
cpu | reservedCapacity_average Reserved Capacity (MHz) Reserved capacity in megahertz.
cpu | usagemhz_average Usage (MHz) Average use in megahertz.
cpu | iowait Wait (ms) IO wait time in milliseconds.
cpu | workload Workload (%) Percent workload.
Disk Metrics for DatacentersDisk metrics provide information about disk use.
VMware vCenter Adapter Installation and Configuration Guide
28 VMware, Inc.
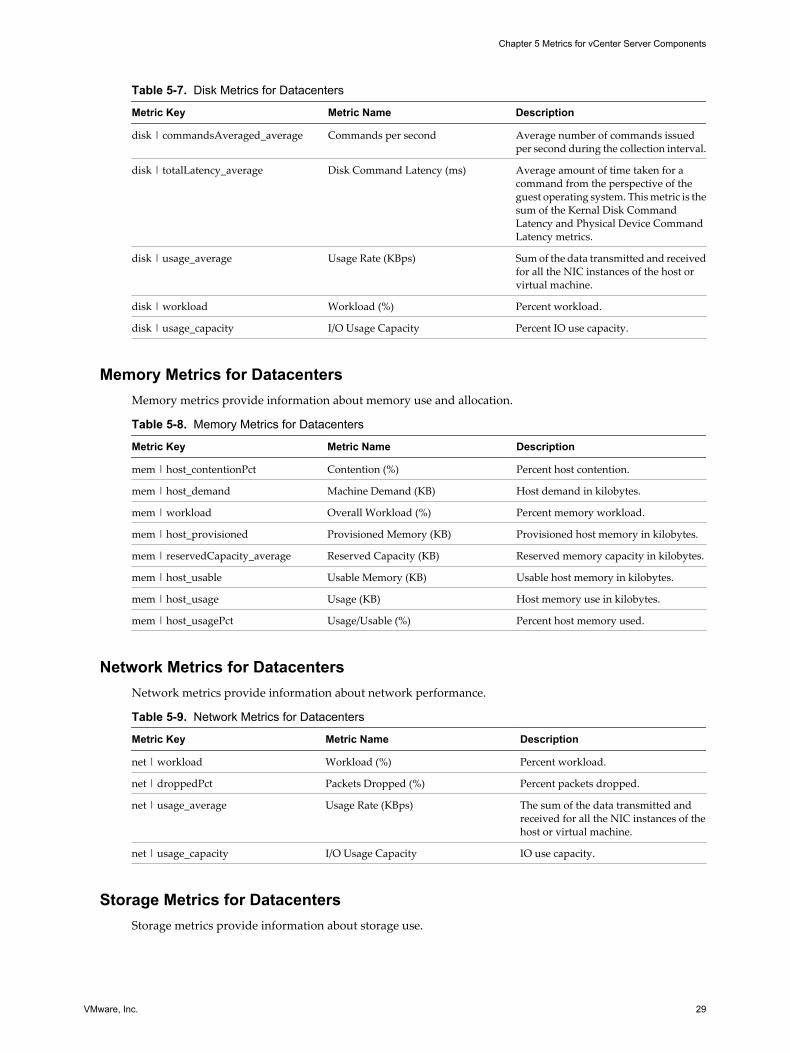
Table 5-7. Disk Metrics for Datacenters
Metric Key Metric Name Description
disk | commandsAveraged_average Commands per second Average number of commands issuedper second during the collection interval.
disk | totalLatency_average Disk Command Latency (ms) Average amount of time taken for acommand from the perspective of theguest operating system. This metric is thesum of the Kernal Disk CommandLatency and Physical Device CommandLatency metrics.
disk | usage_average Usage Rate (KBps) Sum of the data transmitted and receivedfor all the NIC instances of the host orvirtual machine.
disk | workload Workload (%) Percent workload.
disk | usage_capacity I/O Usage Capacity Percent IO use capacity.
Memory Metrics for DatacentersMemory metrics provide information about memory use and allocation.
Table 5-8. Memory Metrics for Datacenters
Metric Key Metric Name Description
mem | host_contentionPct Contention (%) Percent host contention.
mem | host_demand Machine Demand (KB) Host demand in kilobytes.
mem | workload Overall Workload (%) Percent memory workload.
mem | host_provisioned Provisioned Memory (KB) Provisioned host memory in kilobytes.
mem | reservedCapacity_average Reserved Capacity (KB) Reserved memory capacity in kilobytes.
mem | host_usable Usable Memory (KB) Usable host memory in kilobytes.
mem | host_usage Usage (KB) Host memory use in kilobytes.
mem | host_usagePct Usage/Usable (%) Percent host memory used.
Network Metrics for DatacentersNetwork metrics provide information about network performance.
Table 5-9. Network Metrics for Datacenters
Metric Key Metric Name Description
net | workload Workload (%) Percent workload.
net | droppedPct Packets Dropped (%) Percent packets dropped.
net | usage_average Usage Rate (KBps) The sum of the data transmitted andreceived for all the NIC instances of thehost or virtual machine.
net | usage_capacity I/O Usage Capacity IO use capacity.
Storage Metrics for DatacentersStorage metrics provide information about storage use.
Chapter 5 Metrics for vCenter Server Components
VMware, Inc. 29

Table 5-10. Storage Metrics for Datacenters
Metric Key Metric Name Description
storage | usage_average Total Usage (KBps) Average use in kilobytes.
Disk Space Metrics for DatacentersDisk space metrics provide information about disk use.
Table 5-11. Disk Space Metrics for Datacenters
Metric Key Metric Name Description
diskspace | used Virtual machine used (GB) Used virtual machine disk space ingigabytes.
diskspace | notshared Not Shared (GB) Unshared disk space in gigabytes.
diskspace | shared Shared Used (GB) Shared disk space in gigabytes.
diskspace | snapshot Snapshot Space (GB) Snapshot disk space in gigabytes.
diskspace | diskused Virtual Disk Used (GB) Used virtual disk space in gigabtyes.
diskspace | numvmdisk Virtual machine used (GB) Used virtual machine disk space ingigabtyes.
Summary Metrics for DatacentersSummary metrics provide information about overall performance.
Table 5-12. Summary Metrics for Datacenters
Metric Key Metric Name Description
summary | number_running_hosts Number of Running Hosts Number of running hosts.
summary | number_running_vms Number of Running VMs Number of running virtual machines.
summary | total_number_clusters Total Number of Clusters Total number of clusters.
summary | total_number_hosts Total Number of Hosts Total number of hosts.
summary | total_number_vms Total Number of VMs Total number of virtual machines.
summary | total_number_datastores Total Number of Datastores Total number of datastores.
summary | number_running_vcpus Number of VCPUs on Powered OnVMs
Number of virtual CPUs on powered-on virtual machines.
summary | workload_indicator Workload Indicator Workload indicator.
summary | avg_vm_density Average Running VM Count perRunning Host
Average number of running virtualmachines per running host.
Cluster Compute Resource MetricsThe vCenter adapter collects configuration, storage, disk space, CPU use, disk, memory, network, power, andsummary metrics for cluster compute resources.
Configuration Metrics for Cluster Compute ResourcesConfiguration metrics provide information about configuration settings.
VMware vCenter Adapter Installation and Configuration Guide
30 VMware, Inc.
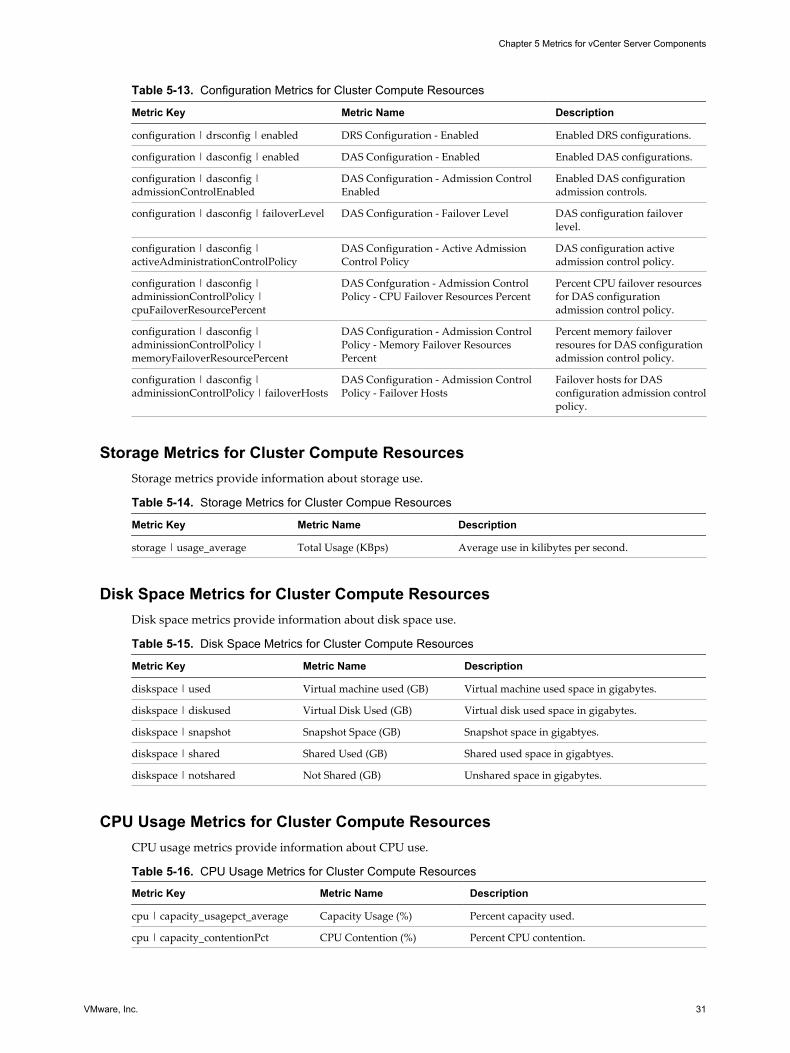
Table 5-13. Configuration Metrics for Cluster Compute Resources
Metric Key Metric Name Description
configuration | drsconfig | enabled DRS Configuration - Enabled Enabled DRS configurations.
configuration | dasconfig | enabled DAS Configuration - Enabled Enabled DAS configurations.
configuration | dasconfig |admissionControlEnabled
DAS Configuration - Admission ControlEnabled
Enabled DAS configurationadmission controls.
configuration | dasconfig | failoverLevel DAS Configuration - Failover Level DAS configuration failoverlevel.
configuration | dasconfig |activeAdministrationControlPolicy
DAS Configuration - Active AdmissionControl Policy
DAS configuration activeadmission control policy.
configuration | dasconfig |adminissionControlPolicy |cpuFailoverResourcePercent
DAS Confguration - Admission ControlPolicy - CPU Failover Resources Percent
Percent CPU failover resourcesfor DAS configurationadmission control policy.
configuration | dasconfig |adminissionControlPolicy |memoryFailoverResourcePercent
DAS Configuration - Admission ControlPolicy - Memory Failover ResourcesPercent
Percent memory failoverresoures for DAS configurationadmission control policy.
configuration | dasconfig |adminissionControlPolicy | failoverHosts
DAS Configuration - Admission ControlPolicy - Failover Hosts
Failover hosts for DASconfiguration admission controlpolicy.
Storage Metrics for Cluster Compute ResourcesStorage metrics provide information about storage use.
Table 5-14. Storage Metrics for Cluster Compue Resources
Metric Key Metric Name Description
storage | usage_average Total Usage (KBps) Average use in kilibytes per second.
Disk Space Metrics for Cluster Compute ResourcesDisk space metrics provide information about disk space use.
Table 5-15. Disk Space Metrics for Cluster Compute Resources
Metric Key Metric Name Description
diskspace | used Virtual machine used (GB) Virtual machine used space in gigabytes.
diskspace | diskused Virtual Disk Used (GB) Virtual disk used space in gigabytes.
diskspace | snapshot Snapshot Space (GB) Snapshot space in gigabtyes.
diskspace | shared Shared Used (GB) Shared used space in gigabtyes.
diskspace | notshared Not Shared (GB) Unshared space in gigabytes.
CPU Usage Metrics for Cluster Compute ResourcesCPU usage metrics provide information about CPU use.
Table 5-16. CPU Usage Metrics for Cluster Compute Resources
Metric Key Metric Name Description
cpu | capacity_usagepct_average Capacity Usage (%) Percent capacity used.
cpu | capacity_contentionPct CPU Contention (%) Percent CPU contention.
Chapter 5 Metrics for vCenter Server Components
VMware, Inc. 31

Table 5-16. CPU Usage Metrics for Cluster Compute Resources (Continued)
Metric Key Metric Name Description
cpu | demandPct Demand (%) Percent demand.
cpu | demandmhz Demand (MHz) Demand in megahertz.
cpu | iowait IO Wait (ms) IO wait time in milliseconds.
cpu | numpackages Number of CPU Sockets Number of CPU sockets.
cpu | capacity_contention Overall CPU Contention (ms) Overall CPU contention in milliseconds.
cpu | capacity_provisioned Provisioned Capacity (MHz) Provisioned CPU capacity in megahertz.
cpu | corecount_provisioned Provisioned CPU Cores Number of provisioned CPU cores.
cpu | reservedCapacity_average Reserved Capacity (MHz) Reserved capacity in megahertz.
cpu | wait Wait (ms) Wait time in milliseconds.
cpu | workload Workload (%) Percent workload.
cpu | usagemhz_average Usage (MHz) CPU use in megahertz.
cpu | total_capacity Total Capacity (MHz) Total CPU capacity in megahertz.
Disk Metrics for Cluster Compute ResourcesDisk metrics provide information about disk use.
Table 5-17. Disk Metrics for Cluster Compute Resources
Metric Key Metric Name Description
disk | commandsAveraged_average Commands per second Average number of commands issued persecond during the collection interval.
disk | totalLatency_average Disk Command Latency (ms) Average amount of time taken for a commandfrom the perpsective of the guest operatingsystem. This metric is the sum of the KernalDevice Command Latency and PhysicalDevice Command Latency metrics.
disk | totalReadLatency_average Disk Read Latency Average amount of time for a read operationfrom the virtual disk. The total latency is thesum of kernal latency and device latency.
disk | totalWriteLatency_average Disk Write Latency Average time taken for a write from theperspective of the guest operating system. Thismetric is the sum of the Kernel Write Latencyand Physical Write Latency metrics.
disk | numberRead_summation Read Rate (KBps) Amount of data read during the collectioninterval.
disk |numberReadAveraged_average
Reads per second Average number of read commands issued persecond during the collection interval.
disk | usage_average Usage Rate (KBps) Average of the sum of the data read andwritten for all of the disk instances of the hostor virtual machine.
disk | workload Workload (%) Percent workload.
disk | numberWrite_summation Write Rate (KBps) Amount of data written to disk during thecollection interval.
disk |numberWriteAveraged_average
Writes per second Average number of write commands issuedper second during the collection interval.
disk | read_average Read Requests Number of times data was read from the diskduring the collection interval.
VMware vCenter Adapter Installation and Configuration Guide
32 VMware, Inc.
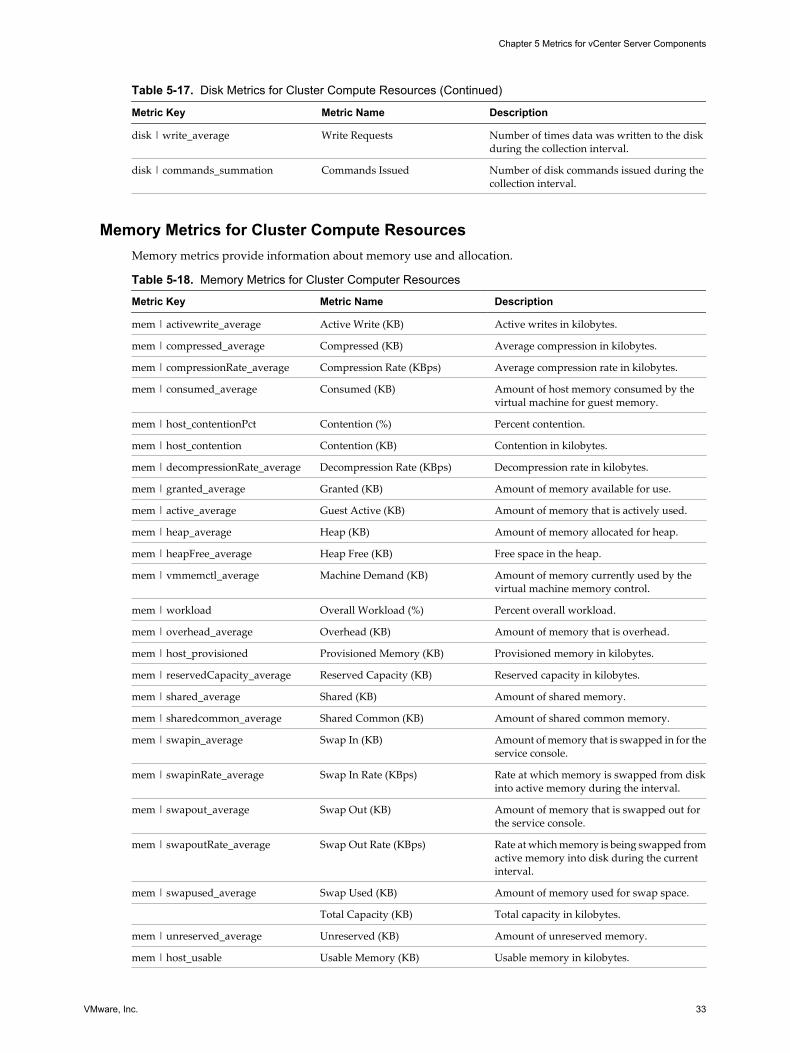
Table 5-17. Disk Metrics for Cluster Compute Resources (Continued)
Metric Key Metric Name Description
disk | write_average Write Requests Number of times data was written to the diskduring the collection interval.
disk | commands_summation Commands Issued Number of disk commands issued during thecollection interval.
Memory Metrics for Cluster Compute ResourcesMemory metrics provide information about memory use and allocation.
Table 5-18. Memory Metrics for Cluster Computer Resources
Metric Key Metric Name Description
mem | activewrite_average Active Write (KB) Active writes in kilobytes.
mem | compressed_average Compressed (KB) Average compression in kilobytes.
mem | compressionRate_average Compression Rate (KBps) Average compression rate in kilobytes.
mem | consumed_average Consumed (KB) Amount of host memory consumed by thevirtual machine for guest memory.
mem | host_contentionPct Contention (%) Percent contention.
mem | host_contention Contention (KB) Contention in kilobytes.
mem | decompressionRate_average Decompression Rate (KBps) Decompression rate in kilobytes.
mem | granted_average Granted (KB) Amount of memory available for use.
mem | active_average Guest Active (KB) Amount of memory that is actively used.
mem | heap_average Heap (KB) Amount of memory allocated for heap.
mem | heapFree_average Heap Free (KB) Free space in the heap.
mem | vmmemctl_average Machine Demand (KB) Amount of memory currently used by thevirtual machine memory control.
mem | workload Overall Workload (%) Percent overall workload.
mem | overhead_average Overhead (KB) Amount of memory that is overhead.
mem | host_provisioned Provisioned Memory (KB) Provisioned memory in kilobytes.
mem | reservedCapacity_average Reserved Capacity (KB) Reserved capacity in kilobytes.
mem | shared_average Shared (KB) Amount of shared memory.
mem | sharedcommon_average Shared Common (KB) Amount of shared common memory.
mem | swapin_average Swap In (KB) Amount of memory that is swapped in for theservice console.
mem | swapinRate_average Swap In Rate (KBps) Rate at which memory is swapped from diskinto active memory during the interval.
mem | swapout_average Swap Out (KB) Amount of memory that is swapped out forthe service console.
mem | swapoutRate_average Swap Out Rate (KBps) Rate at which memory is being swapped fromactive memory into disk during the currentinterval.
mem | swapused_average Swap Used (KB) Amount of memory used for swap space.
Total Capacity (KB) Total capacity in kilobytes.
mem | unreserved_average Unreserved (KB) Amount of unreserved memory.
mem | host_usable Usable Memory (KB) Usable memory in kilobytes.
Chapter 5 Metrics for vCenter Server Components
VMware, Inc. 33
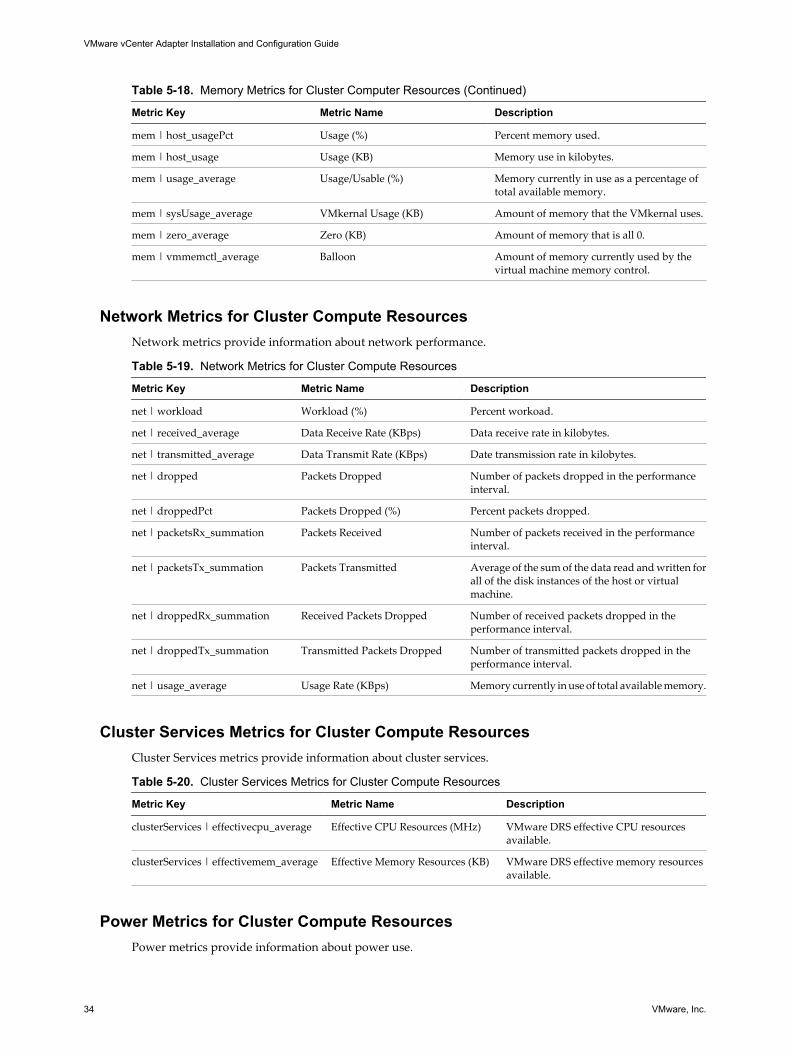
Table 5-18. Memory Metrics for Cluster Computer Resources (Continued)
Metric Key Metric Name Description
mem | host_usagePct Usage (%) Percent memory used.
mem | host_usage Usage (KB) Memory use in kilobytes.
mem | usage_average Usage/Usable (%) Memory currently in use as a percentage oftotal available memory.
mem | sysUsage_average VMkernal Usage (KB) Amount of memory that the VMkernal uses.
mem | zero_average Zero (KB) Amount of memory that is all 0.
mem | vmmemctl_average Balloon Amount of memory currently used by thevirtual machine memory control.
Network Metrics for Cluster Compute ResourcesNetwork metrics provide information about network performance.
Table 5-19. Network Metrics for Cluster Compute Resources
Metric Key Metric Name Description
net | workload Workload (%) Percent workoad.
net | received_average Data Receive Rate (KBps) Data receive rate in kilobytes.
net | transmitted_average Data Transmit Rate (KBps) Date transmission rate in kilobytes.
net | dropped Packets Dropped Number of packets dropped in the performanceinterval.
net | droppedPct Packets Dropped (%) Percent packets dropped.
net | packetsRx_summation Packets Received Number of packets received in the performanceinterval.
net | packetsTx_summation Packets Transmitted Average of the sum of the data read and written forall of the disk instances of the host or virtualmachine.
net | droppedRx_summation Received Packets Dropped Number of received packets dropped in theperformance interval.
net | droppedTx_summation Transmitted Packets Dropped Number of transmitted packets dropped in theperformance interval.
net | usage_average Usage Rate (KBps) Memory currently in use of total available memory.
Cluster Services Metrics for Cluster Compute ResourcesCluster Services metrics provide information about cluster services.
Table 5-20. Cluster Services Metrics for Cluster Compute Resources
Metric Key Metric Name Description
clusterServices | effectivecpu_average Effective CPU Resources (MHz) VMware DRS effective CPU resourcesavailable.
clusterServices | effectivemem_average Effective Memory Resources (KB) VMware DRS effective memory resourcesavailable.
Power Metrics for Cluster Compute ResourcesPower metrics provide information about power use.
VMware vCenter Adapter Installation and Configuration Guide
34 VMware, Inc.
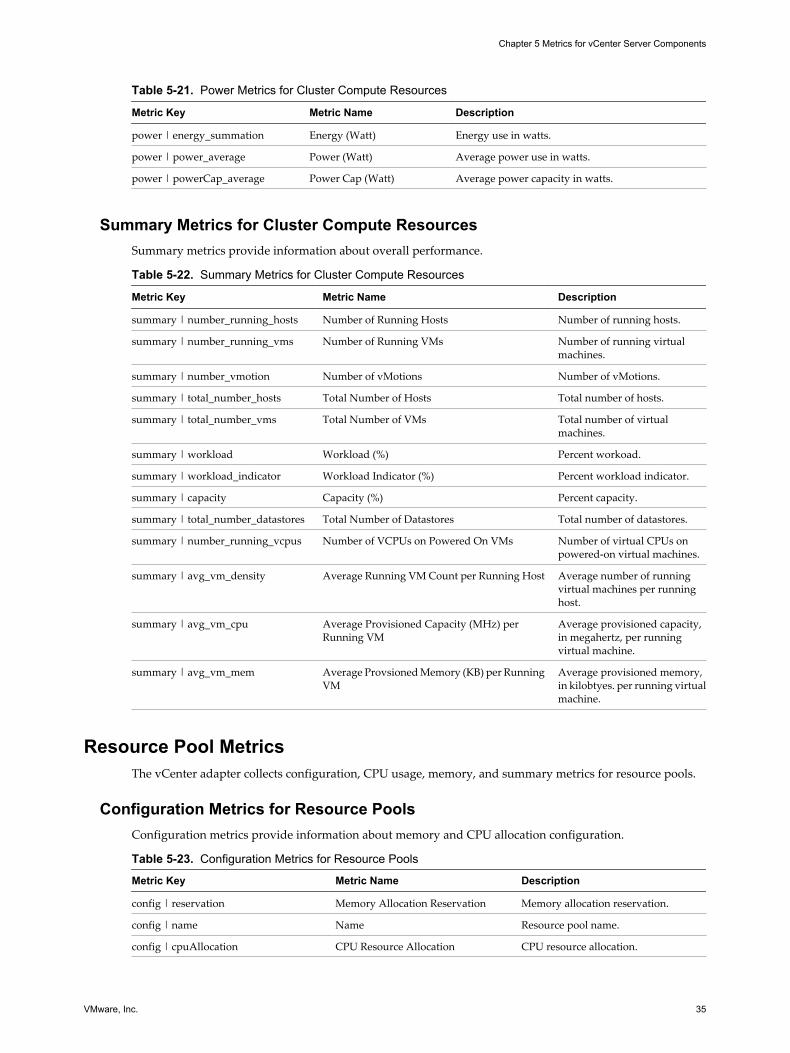
Table 5-21. Power Metrics for Cluster Compute Resources
Metric Key Metric Name Description
power | energy_summation Energy (Watt) Energy use in watts.
power | power_average Power (Watt) Average power use in watts.
power | powerCap_average Power Cap (Watt) Average power capacity in watts.
Summary Metrics for Cluster Compute ResourcesSummary metrics provide information about overall performance.
Table 5-22. Summary Metrics for Cluster Compute Resources
Metric Key Metric Name Description
summary | number_running_hosts Number of Running Hosts Number of running hosts.
summary | number_running_vms Number of Running VMs Number of running virtualmachines.
summary | number_vmotion Number of vMotions Number of vMotions.
summary | total_number_hosts Total Number of Hosts Total number of hosts.
summary | total_number_vms Total Number of VMs Total number of virtualmachines.
summary | workload Workload (%) Percent workoad.
summary | workload_indicator Workload Indicator (%) Percent workload indicator.
summary | capacity Capacity (%) Percent capacity.
summary | total_number_datastores Total Number of Datastores Total number of datastores.
summary | number_running_vcpus Number of VCPUs on Powered On VMs Number of virtual CPUs onpowered-on virtual machines.
summary | avg_vm_density Average Running VM Count per Running Host Average number of runningvirtual machines per runninghost.
summary | avg_vm_cpu Average Provisioned Capacity (MHz) perRunning VM
Average provisioned capacity,in megahertz, per runningvirtual machine.
summary | avg_vm_mem Average Provsioned Memory (KB) per RunningVM
Average provisioned memory,in kilobtyes. per running virtualmachine.
Resource Pool MetricsThe vCenter adapter collects configuration, CPU usage, memory, and summary metrics for resource pools.
Configuration Metrics for Resource PoolsConfiguration metrics provide information about memory and CPU allocation configuration.
Table 5-23. Configuration Metrics for Resource Pools
Metric Key Metric Name Description
config | reservation Memory Allocation Reservation Memory allocation reservation.
config | name Name Resource pool name.
config | cpuAllocation CPU Resource Allocation CPU resource allocation.
Chapter 5 Metrics for vCenter Server Components
VMware, Inc. 35

Table 5-23. Configuration Metrics for Resource Pools (Continued)
Metric Key Metric Name Description
config | limit Limit Configured limit.
config | expandableReservation Expandable Reservation Expandable reservation.
config | expandableReservation | shares| shares
Expandable Reservation - Shares -Shares
Shares of expandable reservation.
CPU Usage Metrics for Resource PoolsCPU usage metrics provide information about CPU use.
Table 5-24. CPU Usage Metrics for Resource Pools
Metric Key Metric Name Description
cpu | capacity_demandEntitlementPct Capacity Demand Entitlement (%) Percent demand entitlement capacity.
cpu | capacity_entitlement Capacity entitlement (MHz) Capacity entitlement in megahertz.
cpu | capacity_contentionPct CPU Contention (%) Percent CPU contention.
cpu | demandmhz Demand (MHz) CPU demand in megahertz.
cpu | capacity_contention Overall CPU Contention (ms) Overall CPU contention inmilliseconds.
cpu | usagemhz_average Usage (MHz) Average CPU use in megahertz.
cpu | limit CPU limit CPU limit.
cpu | reservation CPU reservation CPU reservation.
cpu | expandable_reservation CPU expandable reservation Expandable CPU reservation.
cpu | shares CPU shares CPU shares.
cpu | corecount_provisioned Provisioned CPU Cores Provisioned CPU cores.
cpu | effective_limit Effective limit Effective limit.
cpu | reservation_used Reservation Used Reservation used.
cpu | estimated_entitlement Estimated entitlement Estimated entitlement.
cpu | dynamic_entitlement Dynamic entitlement Dynamic entitlement.
cpu | workload Workload (%) Percent workload.
Memory Metrics for Resource PoolsMemory metrics provide information about memory use and allocation.
Table 5-25. Memory Metrics for Resource Pools
Metric Key Metric Name Description
mem | vmmemctl_average Balloon (KB) Amount of memory currently used bythe virtual machine memory control.
mem | compressionRate_average Compression Rate (KBps) Compression rate in kilobytes persecond.
mem | consumed_average Consumed (KB) Amount of host memory consumed bythe virtual machine for guest memory.
mem | host_contentionPct Contention (%) Percent contention.
mem | host_contention Contention (KB) Contention in kilobytes.
VMware vCenter Adapter Installation and Configuration Guide
36 VMware, Inc.

Table 5-25. Memory Metrics for Resource Pools (Continued)
Metric Key Metric Name Description
mem | decompressionRate_averaage Decompression Rate (KBps) Decompression rate in kilobytes persecond.
mem | granted_average Granted (KB) Average of memory available for use.
mem | active_average Guest Active (KB) Amount of memory that is activelyused.
mem | overhead_average Overhead (KB) Amount of memory that is overhead.
mem | shared_average Shared (KB) Amount of shared memory.
mem | swapinRate_average swapinRate_average Rate at which memory is swapped fromdisk into active memory during theinterval.
mem | swapoutRate_average swapoutRate_average Amount of unreserved memory.
mem | swapped_average Swapped (KB) Memory currently in use as apercentage of total available memory.
mem | usage_average Usage (%) Amount of memory currently used bythe virtual machine memory control.
mem | zero_average Zero (KB) Amount of memory that is all zero.
mem | zipped_latest Zipped (KB) Latest zipped memory in kilobytes.
mem | swapin_average Swap In (KB) Average swap-in memory in kilobytes.
mem | swapout_average Swap Out (KB) Average swap-out memory inkilobytes.
mem | swapused_average Swap Used (KB) Used swapped memory in kilobytes.
mem | guest_provisioned Guest Configured Memory (KB) Guest configured memory in kilobytes.
Summary Metrics for Resource PoolsSummary metrics provide information about overall performance.
Table 5-26. Summary Metrics for Resource Pools
Metric Key Metric Name Description
summary | number_running_vms Number of Running VMs Number of running virtual machines.
summary | total_number_vms Total Number of VMs Total number of virtual machines.
summary | iowait IO Wait (ms) IO wait time in milliseconds.
Host System MetricsThe vCenter adapter collects many metrics for host systems, including CPU use, datastore, disk, memory,network, storage, and summary metrics.
Configuration Metrics for Host SystemsConfiguration metrics provide information about host system configuration.
Chapter 5 Metrics for vCenter Server Components
VMware, Inc. 37

Table 5-27. Configuration Metrics for Host Systems
Metric Key Metric Name Description
config | diskSpace | network | nnic Disk Space - Network - Number ofNICs
Number of network interface cards.
config | diskSpace | network | linkspeed Disk Space - Network - AveragePhysical NIC Speed
Average physical network interface cardspeed.
config | product | productLineId Product - Product Line ID Product line identifier.
config | product | apiVersion Product - API Version API version.
config | hyperThread | available Hyperthreading - Available Number of available hyperthreads.
Hardware Metrics for Host SystemsHardware metrics provide information about host system hardware.
Table 5-28. Hardware Metrics for Host Systems
Metric Key Metric Name Description
hardware | memorySize | cpuinfo |numCpuCores
Memory Size - CPU Information -Number of CPU Cores
Number of CPU cores.
hardware | memorySize | cpuinfo.hz Memory Size - CPU Information -CPU Speed per Core
CPU speed per core.
hardware | memorySize | cpuinfo |numCpuPackages
Memory Size - CPU Information -Number of CPU Packages
Number of CPU packages.
Runtime Metrics for Host SystemsRuntime metrics provide information about host system connection and power states.
Table 5-29. Runtime Metrics for Host Systems
Metric Key Metric Name Description
runtime | connectionState Connection State Host connection state.
runtime | powerState Power State Host power state.
Configuration Manager Metrics for Host SystemsConfiguration Manager metrics provide information about the host system service console.
Table 5-30. Configuration Manager Metrics for Host Systems
Metric Key Metric Name Description
configManager | memoryManager |consoleReservationInfo |serviceConsoleReserved
Memory Manager - ConsoleReservation - Service ConsoleReserved
Service console memory reservation.
CPU Usage Metrics for Host SystemsCPU usage metrics provide information about CPU use.
VMware vCenter Adapter Installation and Configuration Guide
38 VMware, Inc.
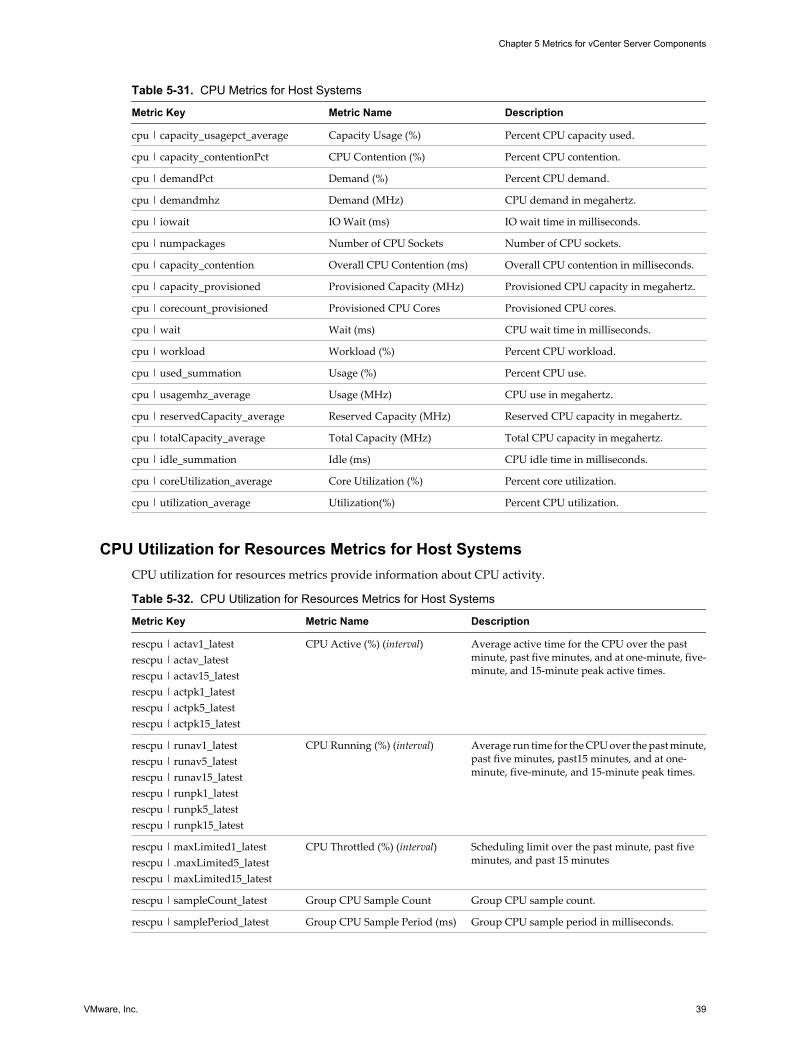
Table 5-31. CPU Metrics for Host Systems
Metric Key Metric Name Description
cpu | capacity_usagepct_average Capacity Usage (%) Percent CPU capacity used.
cpu | capacity_contentionPct CPU Contention (%) Percent CPU contention.
cpu | demandPct Demand (%) Percent CPU demand.
cpu | demandmhz Demand (MHz) CPU demand in megahertz.
cpu | iowait IO Wait (ms) IO wait time in milliseconds.
cpu | numpackages Number of CPU Sockets Number of CPU sockets.
cpu | capacity_contention Overall CPU Contention (ms) Overall CPU contention in milliseconds.
cpu | capacity_provisioned Provisioned Capacity (MHz) Provisioned CPU capacity in megahertz.
cpu | corecount_provisioned Provisioned CPU Cores Provisioned CPU cores.
cpu | wait Wait (ms) CPU wait time in milliseconds.
cpu | workload Workload (%) Percent CPU workload.
cpu | used_summation Usage (%) Percent CPU use.
cpu | usagemhz_average Usage (MHz) CPU use in megahertz.
cpu | reservedCapacity_average Reserved Capacity (MHz) Reserved CPU capacity in megahertz.
cpu | totalCapacity_average Total Capacity (MHz) Total CPU capacity in megahertz.
cpu | idle_summation Idle (ms) CPU idle time in milliseconds.
cpu | coreUtilization_average Core Utilization (%) Percent core utilization.
cpu | utilization_average Utilization(%) Percent CPU utilization.
CPU Utilization for Resources Metrics for Host SystemsCPU utilization for resources metrics provide information about CPU activity.
Table 5-32. CPU Utilization for Resources Metrics for Host Systems
Metric Key Metric Name Description
rescpu | actav1_latestrescpu | actav_latestrescpu | actav15_latestrescpu | actpk1_latestrescpu | actpk5_latestrescpu | actpk15_latest
CPU Active (%) (interval) Average active time for the CPU over the pastminute, past five minutes, and at one-minute, five-minute, and 15-minute peak active times.
rescpu | runav1_latestrescpu | runav5_latestrescpu | runav15_latestrescpu | runpk1_latestrescpu | runpk5_latestrescpu | runpk15_latest
CPU Running (%) (interval) Average run time for the CPU over the past minute,past five minutes, past15 minutes, and at one-minute, five-minute, and 15-minute peak times.
rescpu | maxLimited1_latestrescpu | .maxLimited5_latestrescpu | maxLimited15_latest
CPU Throttled (%) (interval) Scheduling limit over the past minute, past fiveminutes, and past 15 minutes
rescpu | sampleCount_latest Group CPU Sample Count Group CPU sample count.
rescpu | samplePeriod_latest Group CPU Sample Period (ms) Group CPU sample period in milliseconds.
Chapter 5 Metrics for vCenter Server Components
VMware, Inc. 39

Datastore Metrics for Host SystemsDatastore metrics provide information about datastore use.
Table 5-33. Datastore Metrics for Host Systems
Metric Key Metric Name Notes
datastore | commandsAveraged_average Commands Averaged Average number of commandsissued per second during thecollection interval.
datastore | oio Number of Outstanding IOOperations
Number of outstanding IOoperations.
datastore | totalLatency Total Latency (ms) Total latency in milliseconds.
datastore | usage Usage Rate (KBps) Use rate in kilobytes per second.
datastore | demand Demand Demand.
datastore | datastoreIops_average Storage I/O Control aggregatedIOPS
Aggregate number of IO operationson the datastore.
datastore | numberReadAveraged_average Reads per second Reads per second.
datastore | numberWriteAveraged_average Writes per second Writes per second.
datastore | read_average Read Rate (KBps) Read rate in kilobytes per second.
datastore |sizeNormalizedDatastoreLatency_average
Storage I/O Control normalizedlatency (ms)
Normalized latency in microsecondson the datastore.
datastore | totalReadLatency_average Read Latency (ms) Read latency in milliseconds.
datastore | totalWriteLatency_average Write Latency (ms) Write latency in milliseconds.
datastore | write_average Write Rate (KBps) Write rate in kilobytes per second.
Disk Metrics for Host SystemsDisk metrics provide information about disk use.
Table 5-34. Disk Metrics for Host Systems
Metric Key Metric Name Description
disk | usage_average Usage Rate (KBps) Average of the sum of the data readand written fro all of the diskinstances of the host or virtualmachine.
disk | workload Workload (%) Percent workload.Supported by ESX 3.5 and later.
disk | usage_average Commands per second Average number of commandsissued per second during thecollection interval.
disk | totalLatency_average Disk Command Latency (ms) Average amount of time taken for acommand from the perspective ofthe guest operating system. Thismetric is the sum of the KernelDevice Command Latency andPhysical Device Command Latencymetrics.
disk | numberReadAveraged_average Reads per second Average number of read commandsissued per second during thecollection interval.
VMware vCenter Adapter Installation and Configuration Guide
40 VMware, Inc.
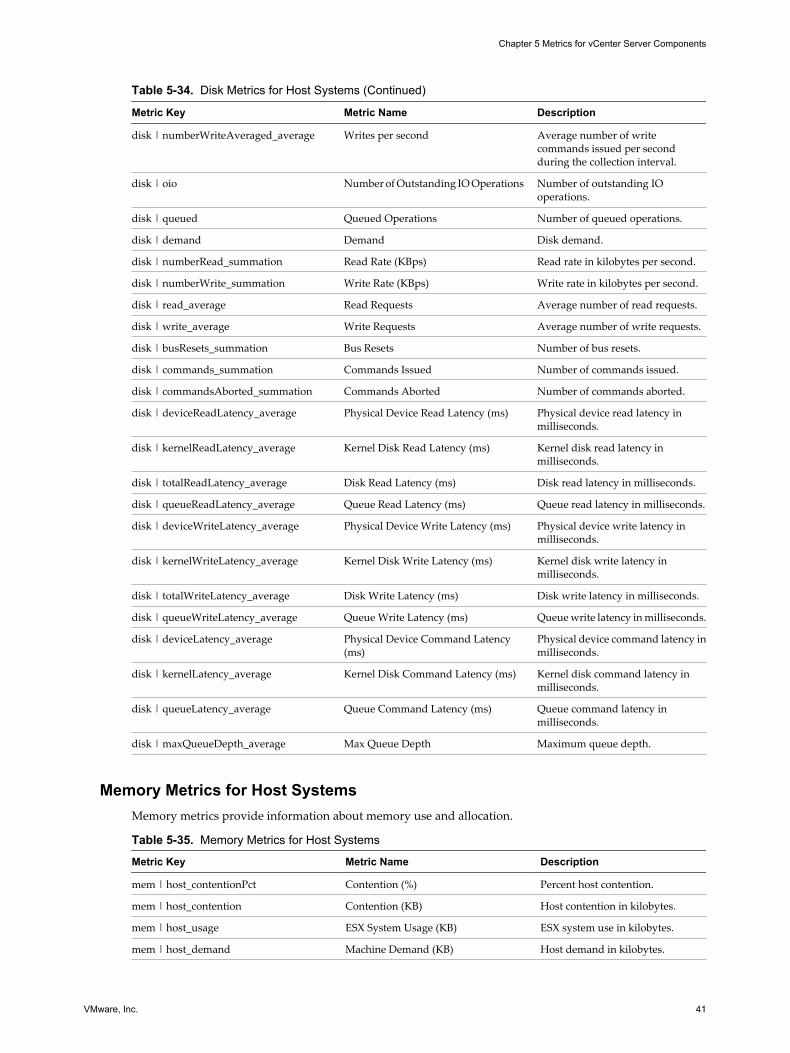
Table 5-34. Disk Metrics for Host Systems (Continued)
Metric Key Metric Name Description
disk | numberWriteAveraged_average Writes per second Average number of writecommands issued per secondduring the collection interval.
disk | oio Number of Outstanding IO Operations Number of outstanding IOoperations.
disk | queued Queued Operations Number of queued operations.
disk | demand Demand Disk demand.
disk | numberRead_summation Read Rate (KBps) Read rate in kilobytes per second.
disk | numberWrite_summation Write Rate (KBps) Write rate in kilobytes per second.
disk | read_average Read Requests Average number of read requests.
disk | write_average Write Requests Average number of write requests.
disk | busResets_summation Bus Resets Number of bus resets.
disk | commands_summation Commands Issued Number of commands issued.
disk | commandsAborted_summation Commands Aborted Number of commands aborted.
disk | deviceReadLatency_average Physical Device Read Latency (ms) Physical device read latency inmilliseconds.
disk | kernelReadLatency_average Kernel Disk Read Latency (ms) Kernel disk read latency inmilliseconds.
disk | totalReadLatency_average Disk Read Latency (ms) Disk read latency in milliseconds.
disk | queueReadLatency_average Queue Read Latency (ms) Queue read latency in milliseconds.
disk | deviceWriteLatency_average Physical Device Write Latency (ms) Physical device write latency inmilliseconds.
disk | kernelWriteLatency_average Kernel Disk Write Latency (ms) Kernel disk write latency inmilliseconds.
disk | totalWriteLatency_average Disk Write Latency (ms) Disk write latency in milliseconds.
disk | queueWriteLatency_average Queue Write Latency (ms) Queue write latency in milliseconds.
disk | deviceLatency_average Physical Device Command Latency(ms)
Physical device command latency inmilliseconds.
disk | kernelLatency_average Kernel Disk Command Latency (ms) Kernel disk command latency inmilliseconds.
disk | queueLatency_average Queue Command Latency (ms) Queue command latency inmilliseconds.
disk | maxQueueDepth_average Max Queue Depth Maximum queue depth.
Memory Metrics for Host SystemsMemory metrics provide information about memory use and allocation.
Table 5-35. Memory Metrics for Host Systems
Metric Key Metric Name Description
mem | host_contentionPct Contention (%) Percent host contention.
mem | host_contention Contention (KB) Host contention in kilobytes.
mem | host_usage ESX System Usage (KB) ESX system use in kilobytes.
mem | host_demand Machine Demand (KB) Host demand in kilobytes.
Chapter 5 Metrics for vCenter Server Components
VMware, Inc. 41

Table 5-35. Memory Metrics for Host Systems (Continued)
Metric Key Metric Name Description
mem | host_usageVM Overall Memory used to run VMs onHost (KB)
Overall memory used to run virtualmachines on the host in kilobytes.
mem | workload Overall Workload (%) Percent overall workload.
mem | host_provisioned Provisioned Memory (KB) Provisioned memory in kilobytes.
mem | reservedCapacityPct Reserved Capacity (%) Percent reserved capacity.
mem | host_usable Usable Memory (KB) Usable memory in kilobytes.
mem | host_usagePct Usage (%) Memory currently in use as apercentage of total availablememory.
mem | host_systemUsage VMkernel Usage (KB) Amount of memory that theVMkernel uses.
mem | active_average Guest Active (KB) Amount of memory that is activelyused.
mem | consumed_average Consumed (KB) Average consumed memory inkilobytes.
mem | granted_average Granted (KB) Amount of memory available foruse.
mem | heap_average Heap (KB) Amount of memory allocated forheap.
mem | heapFree_average Heap Free (KB) Amount of free space in the heap.
mem | overhead_average VM Overhead (KB) Virtual machine capacity inkilobytes.
mem | reservedCapacity_average Reserved Capacity (KB) Reserved capacity in kilobytes.
mem | shared_average Shared (KB) Average shared memory inkilobytes.
mem | sharedcommon_average Shared Common (KB) Average shared common memoryin kilobytes.
mem | swapin_average Swap In (KB) Amount of memory swapped in.
mem | swapout_average Swap Out KB) Amount of memory swapped out.
mem | swapused_average Swap Used (KB) Average used swapped memory inkilobytes.
mem | unreserved_average Unreserved (KB) Average unreserved memory inkilobytes.
mem | vmmemctl_average Balloon (KB) Amount of memory currently usedby the virtual machine memorycontrol.
mem | zero_average Zero (KB) Amount of memory that is all zero.
mem | state_latest State (0-3) Overall state of the memory. Thevalue is an integer between 0 (high)and 3 (low).
mem | host_usage Usage (KB) Host memory use in kilobytes.
mem | usage_average Usage/Usable (%) Percent memory used.
mem | swapinRate_average Swap In Rate (KBps) Average swap-in rate in kilobyteper second.
mem | swapoutRate_average Swap Out Rate (KBps) Average swap-out rate in kilobytesper second.
VMware vCenter Adapter Installation and Configuration Guide
42 VMware, Inc.
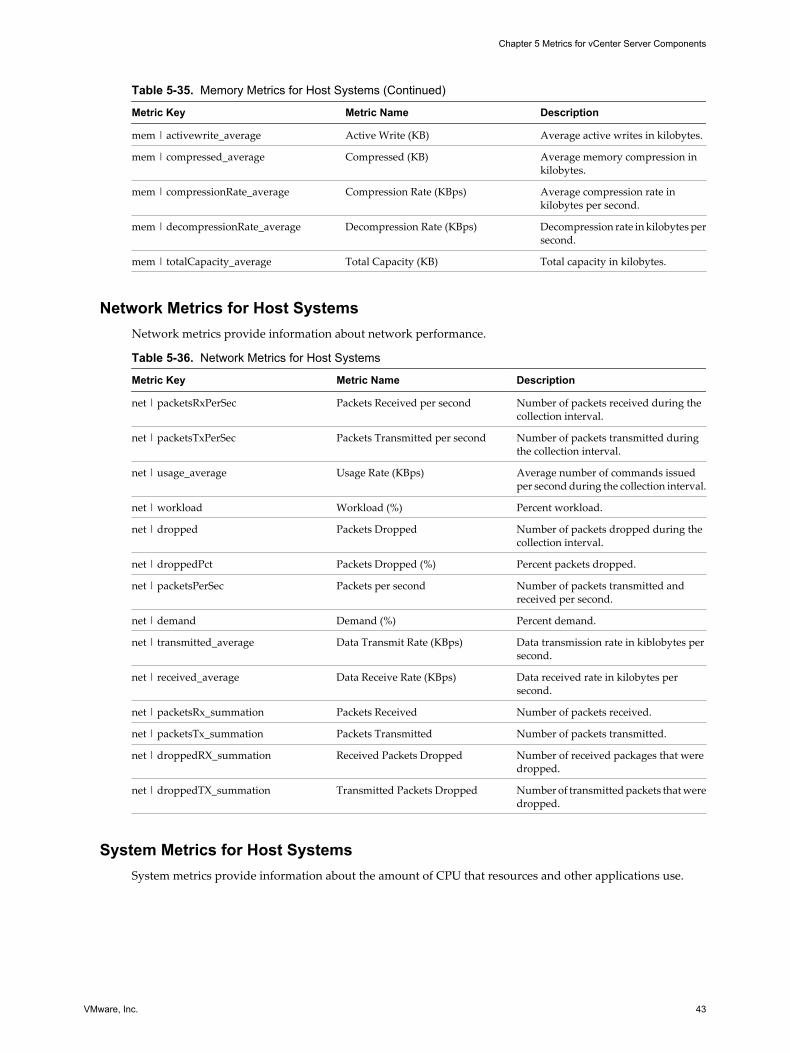
Table 5-35. Memory Metrics for Host Systems (Continued)
Metric Key Metric Name Description
mem | activewrite_average Active Write (KB) Average active writes in kilobytes.
mem | compressed_average Compressed (KB) Average memory compression inkilobytes.
mem | compressionRate_average Compression Rate (KBps) Average compression rate inkilobytes per second.
mem | decompressionRate_average Decompression Rate (KBps) Decompression rate in kilobytes persecond.
mem | totalCapacity_average Total Capacity (KB) Total capacity in kilobytes.
Network Metrics for Host SystemsNetwork metrics provide information about network performance.
Table 5-36. Network Metrics for Host Systems
Metric Key Metric Name Description
net | packetsRxPerSec Packets Received per second Number of packets received during thecollection interval.
net | packetsTxPerSec Packets Transmitted per second Number of packets transmitted duringthe collection interval.
net | usage_average Usage Rate (KBps) Average number of commands issuedper second during the collection interval.
net | workload Workload (%) Percent workload.
net | dropped Packets Dropped Number of packets dropped during thecollection interval.
net | droppedPct Packets Dropped (%) Percent packets dropped.
net | packetsPerSec Packets per second Number of packets transmitted andreceived per second.
net | demand Demand (%) Percent demand.
net | transmitted_average Data Transmit Rate (KBps) Data transmission rate in kiblobytes persecond.
net | received_average Data Receive Rate (KBps) Data received rate in kilobytes persecond.
net | packetsRx_summation Packets Received Number of packets received.
net | packetsTx_summation Packets Transmitted Number of packets transmitted.
net | droppedRX_summation Received Packets Dropped Number of received packages that weredropped.
net | droppedTX_summation Transmitted Packets Dropped Number of transmitted packets that weredropped.
System Metrics for Host SystemsSystem metrics provide information about the amount of CPU that resources and other applications use.
Chapter 5 Metrics for vCenter Server Components
VMware, Inc. 43
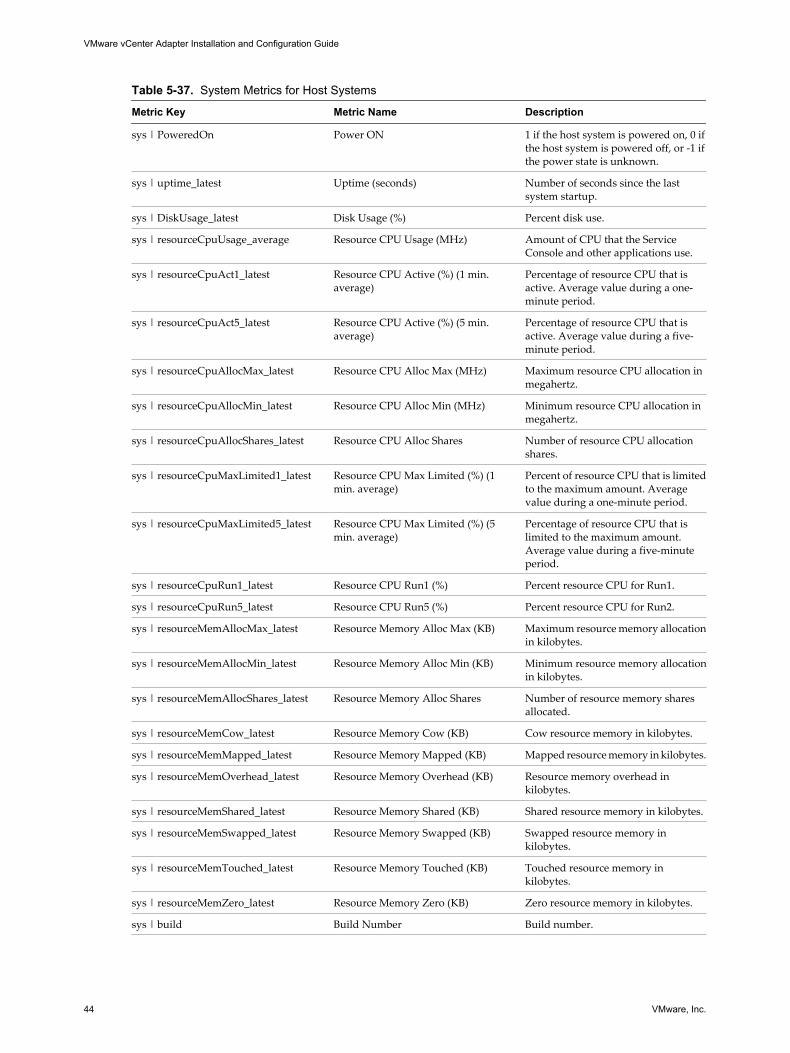
Table 5-37. System Metrics for Host Systems
Metric Key Metric Name Description
sys | PoweredOn Power ON 1 if the host system is powered on, 0 ifthe host system is powered off, or -1 ifthe power state is unknown.
sys | uptime_latest Uptime (seconds) Number of seconds since the lastsystem startup.
sys | DiskUsage_latest Disk Usage (%) Percent disk use.
sys | resourceCpuUsage_average Resource CPU Usage (MHz) Amount of CPU that the ServiceConsole and other applications use.
sys | resourceCpuAct1_latest Resource CPU Active (%) (1 min.average)
Percentage of resource CPU that isactive. Average value during a one-minute period.
sys | resourceCpuAct5_latest Resource CPU Active (%) (5 min.average)
Percentage of resource CPU that isactive. Average value during a five-minute period.
sys | resourceCpuAllocMax_latest Resource CPU Alloc Max (MHz) Maximum resource CPU allocation inmegahertz.
sys | resourceCpuAllocMin_latest Resource CPU Alloc Min (MHz) Minimum resource CPU allocation inmegahertz.
sys | resourceCpuAllocShares_latest Resource CPU Alloc Shares Number of resource CPU allocationshares.
sys | resourceCpuMaxLimited1_latest Resource CPU Max Limited (%) (1min. average)
Percent of resource CPU that is limitedto the maximum amount. Averagevalue during a one-minute period.
sys | resourceCpuMaxLimited5_latest Resource CPU Max Limited (%) (5min. average)
Percentage of resource CPU that islimited to the maximum amount.Average value during a five-minuteperiod.
sys | resourceCpuRun1_latest Resource CPU Run1 (%) Percent resource CPU for Run1.
sys | resourceCpuRun5_latest Resource CPU Run5 (%) Percent resource CPU for Run2.
sys | resourceMemAllocMax_latest Resource Memory Alloc Max (KB) Maximum resource memory allocationin kilobytes.
sys | resourceMemAllocMin_latest Resource Memory Alloc Min (KB) Minimum resource memory allocationin kilobytes.
sys | resourceMemAllocShares_latest Resource Memory Alloc Shares Number of resource memory sharesallocated.
sys | resourceMemCow_latest Resource Memory Cow (KB) Cow resource memory in kilobytes.
sys | resourceMemMapped_latest Resource Memory Mapped (KB) Mapped resource memory in kilobytes.
sys | resourceMemOverhead_latest Resource Memory Overhead (KB) Resource memory overhead inkilobytes.
sys | resourceMemShared_latest Resource Memory Shared (KB) Shared resource memory in kilobytes.
sys | resourceMemSwapped_latest Resource Memory Swapped (KB) Swapped resource memory inkilobytes.
sys | resourceMemTouched_latest Resource Memory Touched (KB) Touched resource memory inkilobytes.
sys | resourceMemZero_latest Resource Memory Zero (KB) Zero resource memory in kilobytes.
sys | build Build Number Build number.
VMware vCenter Adapter Installation and Configuration Guide
44 VMware, Inc.
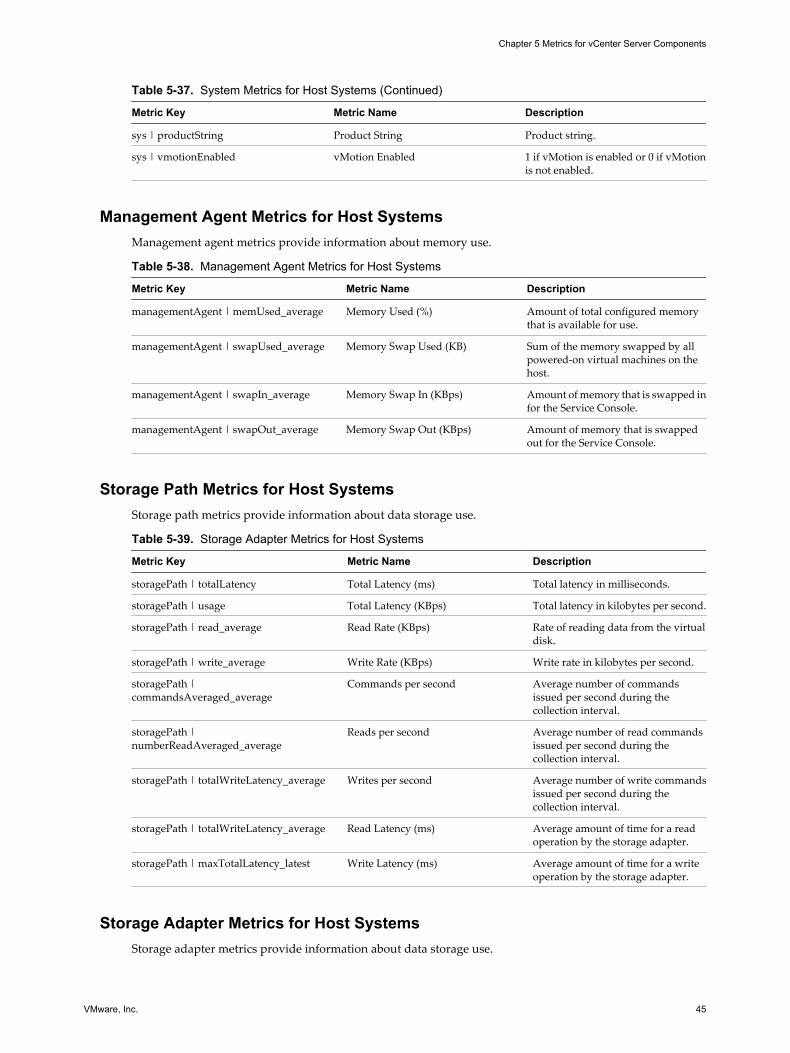
Table 5-37. System Metrics for Host Systems (Continued)
Metric Key Metric Name Description
sys | productString Product String Product string.
sys | vmotionEnabled vMotion Enabled 1 if vMotion is enabled or 0 if vMotionis not enabled.
Management Agent Metrics for Host SystemsManagement agent metrics provide information about memory use.
Table 5-38. Management Agent Metrics for Host Systems
Metric Key Metric Name Description
managementAgent | memUsed_average Memory Used (%) Amount of total configured memorythat is available for use.
managementAgent | swapUsed_average Memory Swap Used (KB) Sum of the memory swapped by allpowered-on virtual machines on thehost.
managementAgent | swapIn_average Memory Swap In (KBps) Amount of memory that is swapped infor the Service Console.
managementAgent | swapOut_average Memory Swap Out (KBps) Amount of memory that is swappedout for the Service Console.
Storage Path Metrics for Host SystemsStorage path metrics provide information about data storage use.
Table 5-39. Storage Adapter Metrics for Host Systems
Metric Key Metric Name Description
storagePath | totalLatency Total Latency (ms) Total latency in milliseconds.
storagePath | usage Total Latency (KBps) Total latency in kilobytes per second.
storagePath | read_average Read Rate (KBps) Rate of reading data from the virtualdisk.
storagePath | write_average Write Rate (KBps) Write rate in kilobytes per second.
storagePath |commandsAveraged_average
Commands per second Average number of commandsissued per second during thecollection interval.
storagePath |numberReadAveraged_average
Reads per second Average number of read commandsissued per second during thecollection interval.
storagePath | totalWriteLatency_average Writes per second Average number of write commandsissued per second during thecollection interval.
storagePath | totalWriteLatency_average Read Latency (ms) Average amount of time for a readoperation by the storage adapter.
storagePath | maxTotalLatency_latest Write Latency (ms) Average amount of time for a writeoperation by the storage adapter.
Storage Adapter Metrics for Host SystemsStorage adapter metrics provide information about data storage use.
Chapter 5 Metrics for vCenter Server Components
VMware, Inc. 45

Table 5-40. Storage Adapter Metrics for Host Systems
Metric Key Metric Name Description
storageAdapter | usage Total Usage (KBps) Total use in kilobytes per second.
storageAdapter |commandsAveraged_average
Commands per second Average number of commands issued persecond by the storage adapter during thecollection interval.
storageAdapter |numberReadAveraged_average
Reads per second Average number of read commands issued persecond by the storage adapter during thecollection interval.
storageAdapter |numberWriteAveraged_average
Writes per second Average number of write commands issued persecond by the storage adapter during thecollection interval.
storageAdapter | read_average Read Rate (KBps) Rate of reading data by the storage adapter.
storageAdapter |totalReadLatency_average
Read Latency (ms) Average amount of time for a read operation bythe storage adapter. Total latency is the sum ofkernel latency and device latency.
storageAdapter |totalWriteLatency_average
Write Latency (ms) Average amount of time for a write operation bythe storage adapter. Total latency is the sume ofkernel latency and device latency.
storageAdapter | write_average Write Rate (KBps) Rate of writing data by the storage adapter.
Storage Metrics for Host SystemsStorage metrics provide information about storage use.
Table 5-41. Storage Metrics for Host Systems
Metric Key Metric Name Description
storage | commandsAveraged_average Commands per second Number of commands per second.
storage | totalReadLatency_average Read Latency (ms) Read latency in milliseconds.
storage | read_average Read Rate (KBps) Read rate in kilobytes.
storage | numberReadAveraged_average Reads per second Reads per second.
storage | totalLatency_average Total Latency (ms) Total latency in milliseconds.
storage | usage_average Total Usage (KBps) Total storage use in kilobytes persecond.
storage | totalWriteLatency_average Write Latency (ms) Write latency in milliseconds.
storage | write_average Write Rate (KBps) Write rate in kilobytes per second.
storage | numberWriteAveraged_average Writes per second Writes per second.
Sensor Metrics for Host SystemsSensor metrics provide information about host system cooling.
Table 5-42. Fan Metrics for Host Systems
Metric Key Metric Name Description
fan | currentValue Speed (%) Percent fan speed.
fan | healthState Health State Fan health state.
VMware vCenter Adapter Installation and Configuration Guide
46 VMware, Inc.
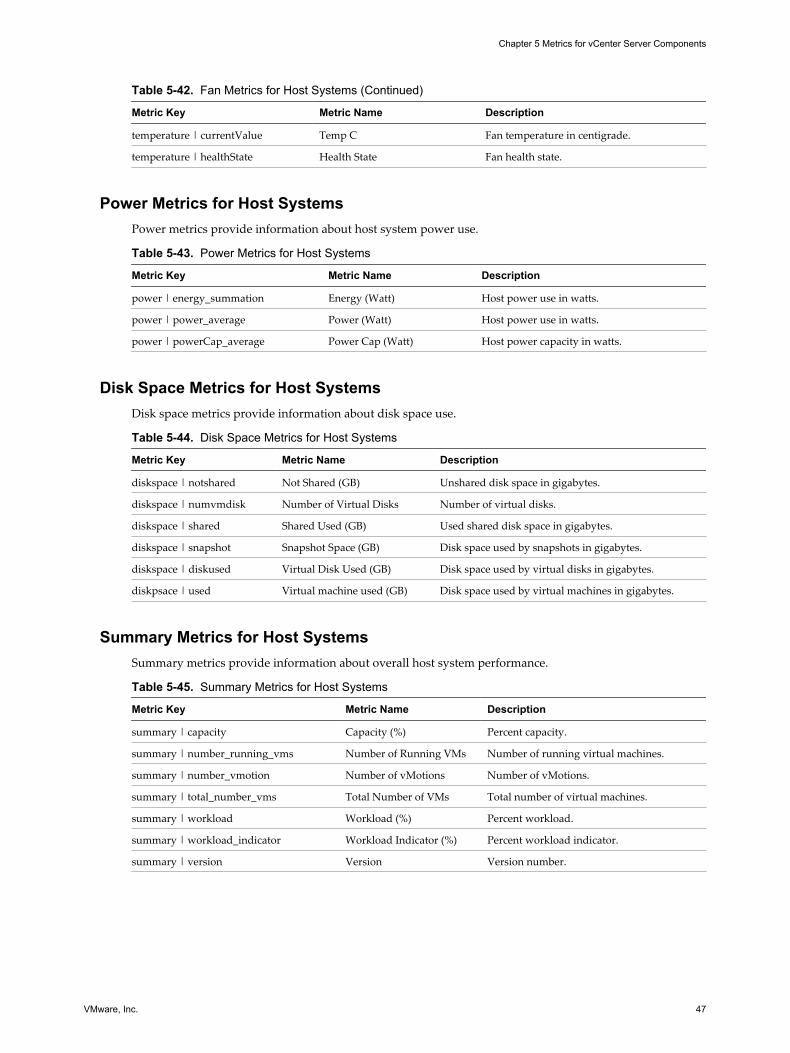
Table 5-42. Fan Metrics for Host Systems (Continued)
Metric Key Metric Name Description
temperature | currentValue Temp C Fan temperature in centigrade.
temperature | healthState Health State Fan health state.
Power Metrics for Host SystemsPower metrics provide information about host system power use.
Table 5-43. Power Metrics for Host Systems
Metric Key Metric Name Description
power | energy_summation Energy (Watt) Host power use in watts.
power | power_average Power (Watt) Host power use in watts.
power | powerCap_average Power Cap (Watt) Host power capacity in watts.
Disk Space Metrics for Host SystemsDisk space metrics provide information about disk space use.
Table 5-44. Disk Space Metrics for Host Systems
Metric Key Metric Name Description
diskspace | notshared Not Shared (GB) Unshared disk space in gigabytes.
diskspace | numvmdisk Number of Virtual Disks Number of virtual disks.
diskspace | shared Shared Used (GB) Used shared disk space in gigabytes.
diskspace | snapshot Snapshot Space (GB) Disk space used by snapshots in gigabytes.
diskspace | diskused Virtual Disk Used (GB) Disk space used by virtual disks in gigabytes.
diskpsace | used Virtual machine used (GB) Disk space used by virtual machines in gigabytes.
Summary Metrics for Host SystemsSummary metrics provide information about overall host system performance.
Table 5-45. Summary Metrics for Host Systems
Metric Key Metric Name Description
summary | capacity Capacity (%) Percent capacity.
summary | number_running_vms Number of Running VMs Number of running virtual machines.
summary | number_vmotion Number of vMotions Number of vMotions.
summary | total_number_vms Total Number of VMs Total number of virtual machines.
summary | workload Workload (%) Percent workload.
summary | workload_indicator Workload Indicator (%) Percent workload indicator.
summary | version Version Version number.
Chapter 5 Metrics for vCenter Server Components
VMware, Inc. 47
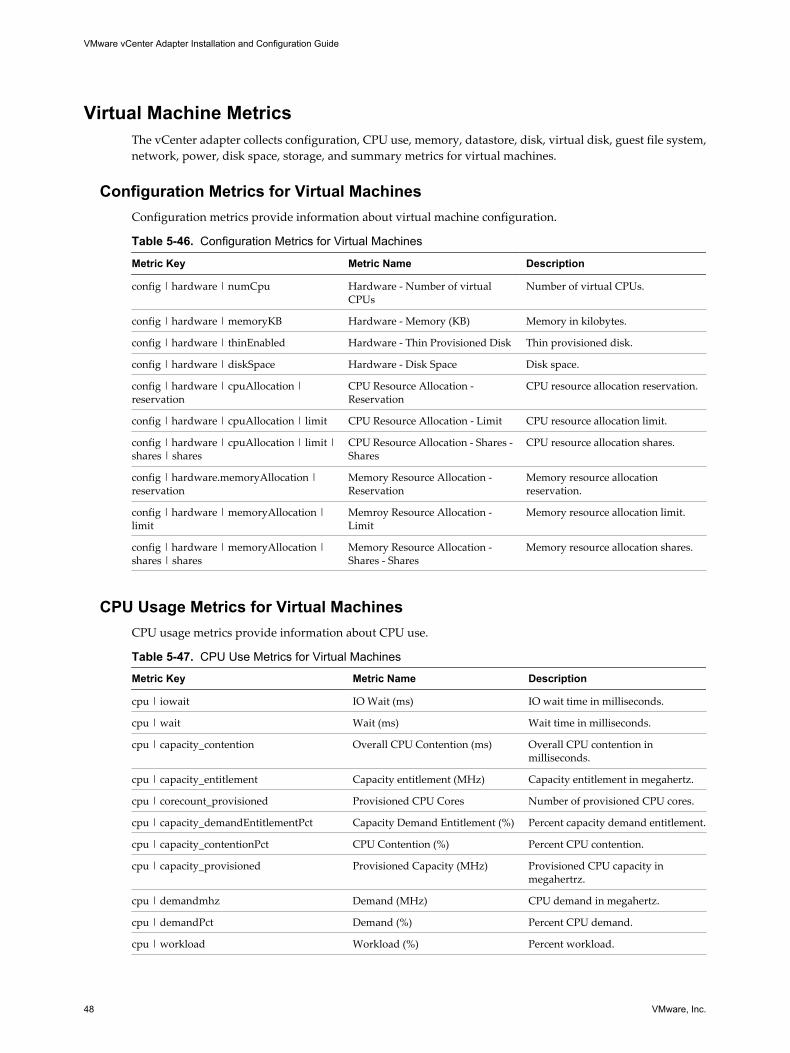
Virtual Machine MetricsThe vCenter adapter collects configuration, CPU use, memory, datastore, disk, virtual disk, guest file system,network, power, disk space, storage, and summary metrics for virtual machines.
Configuration Metrics for Virtual MachinesConfiguration metrics provide information about virtual machine configuration.
Table 5-46. Configuration Metrics for Virtual Machines
Metric Key Metric Name Description
config | hardware | numCpu Hardware - Number of virtualCPUs
Number of virtual CPUs.
config | hardware | memoryKB Hardware - Memory (KB) Memory in kilobytes.
config | hardware | thinEnabled Hardware - Thin Provisioned Disk Thin provisioned disk.
config | hardware | diskSpace Hardware - Disk Space Disk space.
config | hardware | cpuAllocation |reservation
CPU Resource Allocation -Reservation
CPU resource allocation reservation.
config | hardware | cpuAllocation | limit CPU Resource Allocation - Limit CPU resource allocation limit.
config | hardware | cpuAllocation | limit |shares | shares
CPU Resource Allocation - Shares -Shares
CPU resource allocation shares.
config | hardware.memoryAllocation |reservation
Memory Resource Allocation -Reservation
Memory resource allocationreservation.
config | hardware | memoryAllocation |limit
Memroy Resource Allocation -Limit
Memory resource allocation limit.
config | hardware | memoryAllocation |shares | shares
Memory Resource Allocation -Shares - Shares
Memory resource allocation shares.
CPU Usage Metrics for Virtual MachinesCPU usage metrics provide information about CPU use.
Table 5-47. CPU Use Metrics for Virtual Machines
Metric Key Metric Name Description
cpu | iowait IO Wait (ms) IO wait time in milliseconds.
cpu | wait Wait (ms) Wait time in milliseconds.
cpu | capacity_contention Overall CPU Contention (ms) Overall CPU contention inmilliseconds.
cpu | capacity_entitlement Capacity entitlement (MHz) Capacity entitlement in megahertz.
cpu | corecount_provisioned Provisioned CPU Cores Number of provisioned CPU cores.
cpu | capacity_demandEntitlementPct Capacity Demand Entitlement (%) Percent capacity demand entitlement.
cpu | capacity_contentionPct CPU Contention (%) Percent CPU contention.
cpu | capacity_provisioned Provisioned Capacity (MHz) Provisioned CPU capacity inmegahertrz.
cpu | demandmhz Demand (MHz) CPU demand in megahertz.
cpu | demandPct Demand (%) Percent CPU demand.
cpu | workload Workload (%) Percent workload.
VMware vCenter Adapter Installation and Configuration Guide
48 VMware, Inc.

Table 5-47. CPU Use Metrics for Virtual Machines (Continued)
Metric Key Metric Name Description
cpu | usage_average Usage (%) Percent CPU use.
cpu | usagemhz_average Usage (MHz) CPU use in megahertz.
cpu | system_summation System (ms) System use in milliseconds.
cpu | ready_summation Ready (ms) Ready time in milliseconds.
cpu | read_summation Read (%) Percent read time.
cpu | used_summation Used (ms) CPU used time in milliseconds.
cpu | extra_summation Extra (ms) Extra CPU time in milliseconds.
cpu | guaranteed_latest Guaranteed (ms) Guaranteed CPU in milliseconds.
cpu | swapwait_summation Swap Wait (ms) Swap wait time in milliseconds.
CPU Utilization for Resources Metrics for Virtual MachinesCPU utilization for resources metrics provide information about resource CPU use.
Table 5-48. CPU Utilization for Resources Metrics for Virtual Machines
Metric Key Metric Name Description
rescpu | actav1_latestrescpu | acta5_latestrescpu | acta15_latestrescpu | actpk1_latestrescpu | actpk15_latest
CPU Active (%) (interval) Percent CPU active time during various intervals.
rescpu | runav1_latestrescpu | runav5_latestrescpu | runav15.latestrescpu | runpk1_latestrescpu | runpk15_latest
CPU Running (%) (interval) Percent CPU running time during various intervals.
rescpu | maxLimited1_latestrescpu | maxLimited5_latestrescpu | maxLimited15_latest
CPU Throttled (%) (interval) Percent CPU throttled time during variousintervals.
rescpu | sampleCount_latest Group CPU Sample Count Group CPU sample count.
rscpu | samplePeriod_latest Group CPU Sample Period (ms) Group CPU sample period in milliseconds.
Memory Metrics for Virtual MachinesMemory metrics provide information about memory use and allocation.
Table 5-49. Memory Metrics for Virtual Machines
Metric Key Metric Name Description
mem | host_entitlement Host Entitlement (KB) Host entitlement in kilobytes.
mem | host_reservation VM Reservation (MB) Virtual machine memory reservation inmegabytes.
mem | host_limit VM Limit (MB) Virtual machine memory limit inmegabytes.
mem | host_activeEntitlementPct Active Entitlement (%) Percent active entitlement.
mem | host_active Host Active (KB) Host active memory use in kilobytes.
Chapter 5 Metrics for vCenter Server Components
VMware, Inc. 49
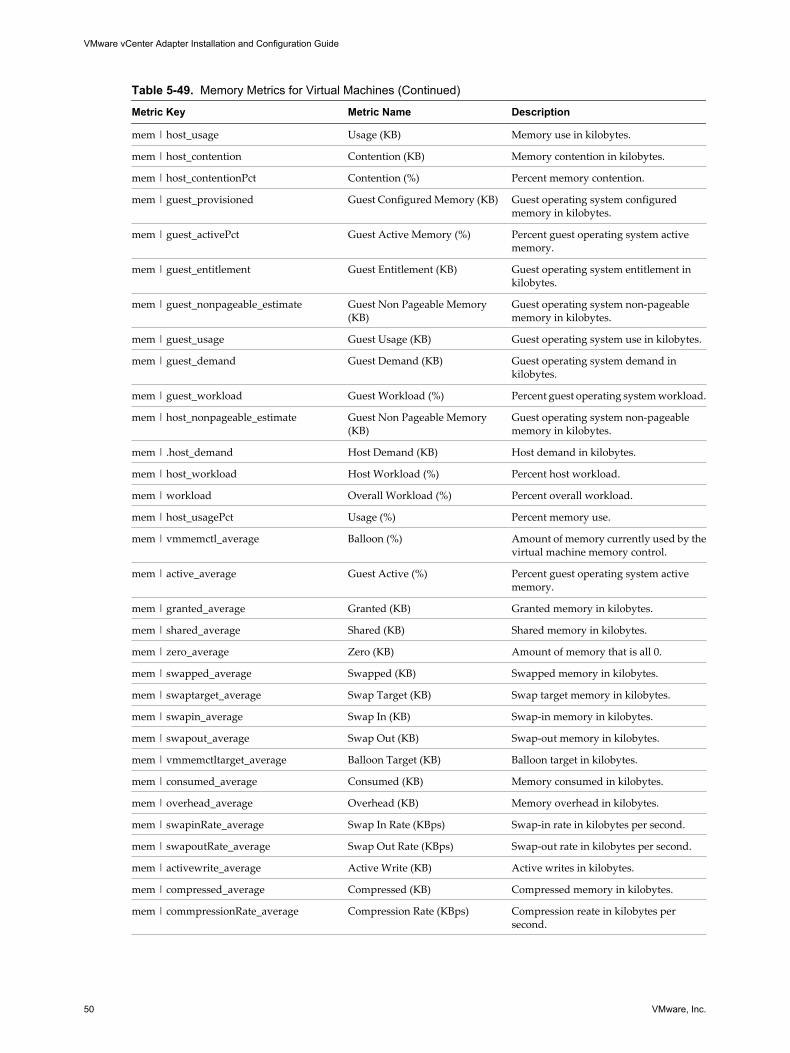
Table 5-49. Memory Metrics for Virtual Machines (Continued)
Metric Key Metric Name Description
mem | host_usage Usage (KB) Memory use in kilobytes.
mem | host_contention Contention (KB) Memory contention in kilobytes.
mem | host_contentionPct Contention (%) Percent memory contention.
mem | guest_provisioned Guest Configured Memory (KB) Guest operating system configuredmemory in kilobytes.
mem | guest_activePct Guest Active Memory (%) Percent guest operating system activememory.
mem | guest_entitlement Guest Entitlement (KB) Guest operating system entitlement inkilobytes.
mem | guest_nonpageable_estimate Guest Non Pageable Memory(KB)
Guest operating system non-pageablememory in kilobytes.
mem | guest_usage Guest Usage (KB) Guest operating system use in kilobytes.
mem | guest_demand Guest Demand (KB) Guest operating system demand inkilobytes.
mem | guest_workload Guest Workload (%) Percent guest operating system workload.
mem | host_nonpageable_estimate Guest Non Pageable Memory(KB)
Guest operating system non-pageablememory in kilobytes.
mem | .host_demand Host Demand (KB) Host demand in kilobytes.
mem | host_workload Host Workload (%) Percent host workload.
mem | workload Overall Workload (%) Percent overall workload.
mem | host_usagePct Usage (%) Percent memory use.
mem | vmmemctl_average Balloon (%) Amount of memory currently used by thevirtual machine memory control.
mem | active_average Guest Active (%) Percent guest operating system activememory.
mem | granted_average Granted (KB) Granted memory in kilobytes.
mem | shared_average Shared (KB) Shared memory in kilobytes.
mem | zero_average Zero (KB) Amount of memory that is all 0.
mem | swapped_average Swapped (KB) Swapped memory in kilobytes.
mem | swaptarget_average Swap Target (KB) Swap target memory in kilobytes.
mem | swapin_average Swap In (KB) Swap-in memory in kilobytes.
mem | swapout_average Swap Out (KB) Swap-out memory in kilobytes.
mem | vmmemctltarget_average Balloon Target (KB) Balloon target in kilobytes.
mem | consumed_average Consumed (KB) Memory consumed in kilobytes.
mem | overhead_average Overhead (KB) Memory overhead in kilobytes.
mem | swapinRate_average Swap In Rate (KBps) Swap-in rate in kilobytes per second.
mem | swapoutRate_average Swap Out Rate (KBps) Swap-out rate in kilobytes per second.
mem | activewrite_average Active Write (KB) Active writes in kilobytes.
mem | compressed_average Compressed (KB) Compressed memory in kilobytes.
mem | commpressionRate_average Compression Rate (KBps) Compression reate in kilobytes persecond.
VMware vCenter Adapter Installation and Configuration Guide
50 VMware, Inc.

Table 5-49. Memory Metrics for Virtual Machines (Continued)
Metric Key Metric Name Description
mem | decompressionRate_average Decompression Rate (KBps) Decompression rate in kilobytes persecond.
mem | overheadMax_average Overhead Max (KB) Maximum overhead in kilobytes.
mem | zipSaved_latest Zip Saved (KB) Zip-saved memory in kilobytes.
mem | zipped_latest Zipped (KB) Zipped memory in kilobytes.
Datastore Metrics for Virtual MachinesDatastore metrics provide information about datastore use.
Table 5-50. Datastore Metrics for Virtual Machines
Metric Key Metric Name Description
datastore | commandsAveraged_average Commands per second Commands per second.
datastore | oio Number of Outstanding IOOperations
Number of outstanding IO operations.
datastore | demand Demand Datatstore demand.
datastore | totalLatency Total Latency (ms) Total latency in milliseconds.
datastore | usage Usage Rate (KBps) Use rate in kilobytes per second.
datastore | used Used Space (MB) Used space in megabytes.
datastore | notshared Not Shared (GB) Unshared space in gigabytes.
datastore | numberReadAveraged_average Reads per second Reads per second.
datastore | numberWriteAveraged_average Writes per second Writes per second.
datastore | read_average Read Rate (KBps) Read rate in kilobytes per second.
datastore | totalReadLatency_average Read Latency (ms) Read latency in milliseconds.
datastore | totalWriteLatency_average Write Latency (ms) Write latency in milliseconds.
datastore | write_average Write Rate Write rate.
Disk Metrics for Virtual MachinesDisk metrics provide information about disk use.
Table 5-51. Disk Metrics for Virtual Machines
Metric Key Metric Name Description
disk | numberReadAveraged_average Reads per second Reads per second.
disk | numberWriteAveraged_average Writes per second Writes per second.
disk | commandsAveraged_average Commands per second Commands per second.
disk | usage_average Usage Rate (KBps) Use rate in kilobytes per second.
disk | oio Number of Outstanding IOOperations
Number of outstanding IO operations.
disk | queued Queued Operations Queued operations.
disk | demand Demand (%) Percent demand.
disk | workload Workload (%) Percent workload.
disk | read_average Read Rate (KBps) Read reate in kilobytes per second.
Chapter 5 Metrics for vCenter Server Components
VMware, Inc. 51
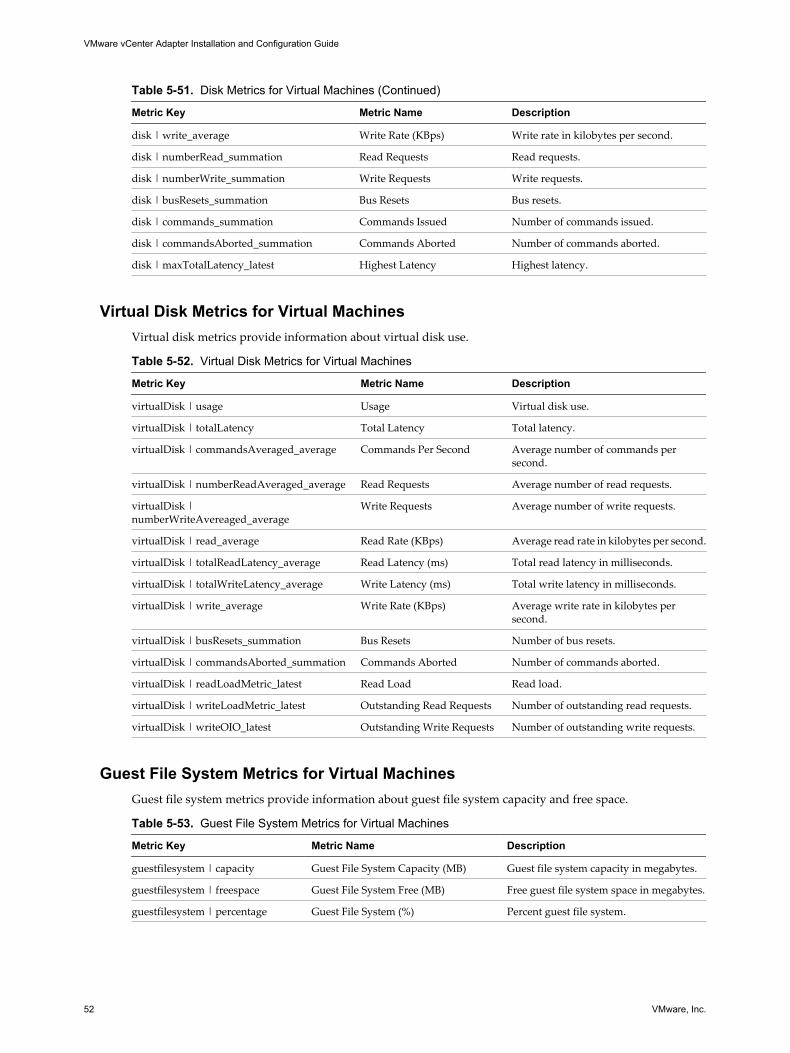
Table 5-51. Disk Metrics for Virtual Machines (Continued)
Metric Key Metric Name Description
disk | write_average Write Rate (KBps) Write rate in kilobytes per second.
disk | numberRead_summation Read Requests Read requests.
disk | numberWrite_summation Write Requests Write requests.
disk | busResets_summation Bus Resets Bus resets.
disk | commands_summation Commands Issued Number of commands issued.
disk | commandsAborted_summation Commands Aborted Number of commands aborted.
disk | maxTotalLatency_latest Highest Latency Highest latency.
Virtual Disk Metrics for Virtual MachinesVirtual disk metrics provide information about virtual disk use.
Table 5-52. Virtual Disk Metrics for Virtual Machines
Metric Key Metric Name Description
virtualDisk | usage Usage Virtual disk use.
virtualDisk | totalLatency Total Latency Total latency.
virtualDisk | commandsAveraged_average Commands Per Second Average number of commands persecond.
virtualDisk | numberReadAveraged_average Read Requests Average number of read requests.
virtualDisk |numberWriteAvereaged_average
Write Requests Average number of write requests.
virtualDisk | read_average Read Rate (KBps) Average read rate in kilobytes per second.
virtualDisk | totalReadLatency_average Read Latency (ms) Total read latency in milliseconds.
virtualDisk | totalWriteLatency_average Write Latency (ms) Total write latency in milliseconds.
virtualDisk | write_average Write Rate (KBps) Average write rate in kilobytes persecond.
virtualDisk | busResets_summation Bus Resets Number of bus resets.
virtualDisk | commandsAborted_summation Commands Aborted Number of commands aborted.
virtualDisk | readLoadMetric_latest Read Load Read load.
virtualDisk | writeLoadMetric_latest Outstanding Read Requests Number of outstanding read requests.
virtualDisk | writeOIO_latest Outstanding Write Requests Number of outstanding write requests.
Guest File System Metrics for Virtual MachinesGuest file system metrics provide information about guest file system capacity and free space.
Table 5-53. Guest File System Metrics for Virtual Machines
Metric Key Metric Name Description
guestfilesystem | capacity Guest File System Capacity (MB) Guest file system capacity in megabytes.
guestfilesystem | freespace Guest File System Free (MB) Free guest file system space in megabytes.
guestfilesystem | percentage Guest File System (%) Percent guest file system.
VMware vCenter Adapter Installation and Configuration Guide
52 VMware, Inc.
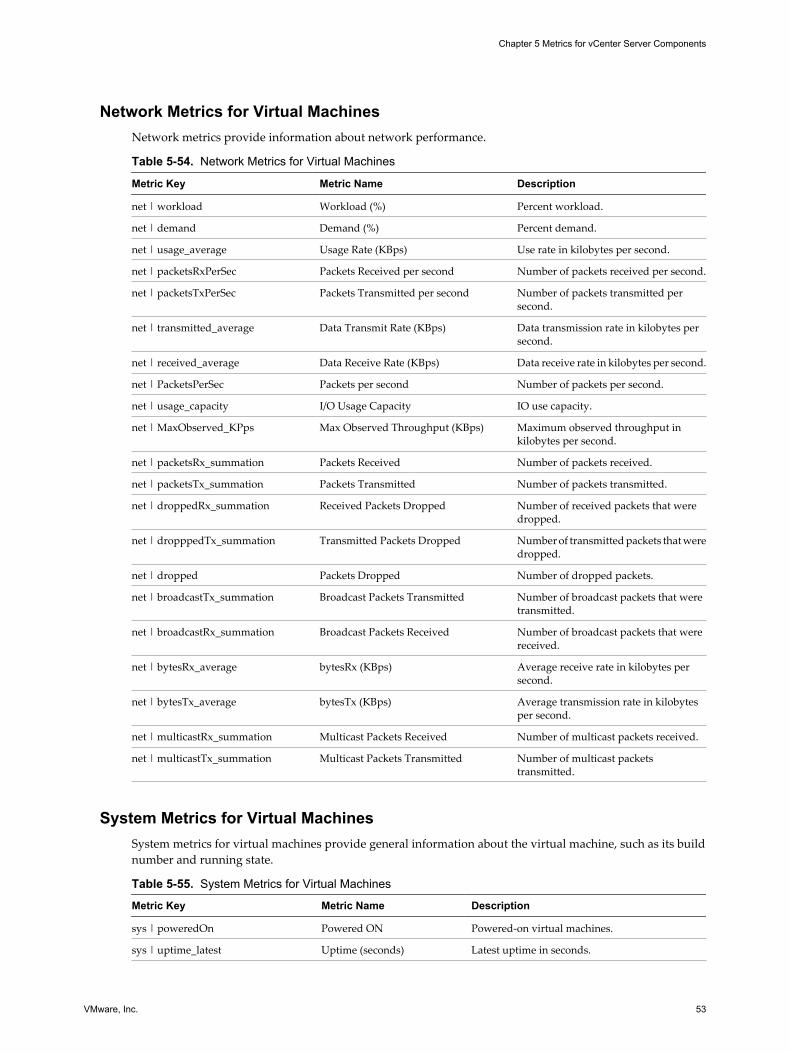
Network Metrics for Virtual MachinesNetwork metrics provide information about network performance.
Table 5-54. Network Metrics for Virtual Machines
Metric Key Metric Name Description
net | workload Workload (%) Percent workload.
net | demand Demand (%) Percent demand.
net | usage_average Usage Rate (KBps) Use rate in kilobytes per second.
net | packetsRxPerSec Packets Received per second Number of packets received per second.
net | packetsTxPerSec Packets Transmitted per second Number of packets transmitted persecond.
net | transmitted_average Data Transmit Rate (KBps) Data transmission rate in kilobytes persecond.
net | received_average Data Receive Rate (KBps) Data receive rate in kilobytes per second.
net | PacketsPerSec Packets per second Number of packets per second.
net | usage_capacity I/O Usage Capacity IO use capacity.
net | MaxObserved_KPps Max Observed Throughput (KBps) Maximum observed throughput inkilobytes per second.
net | packetsRx_summation Packets Received Number of packets received.
net | packetsTx_summation Packets Transmitted Number of packets transmitted.
net | droppedRx_summation Received Packets Dropped Number of received packets that weredropped.
net | dropppedTx_summation Transmitted Packets Dropped Number of transmitted packets that weredropped.
net | dropped Packets Dropped Number of dropped packets.
net | broadcastTx_summation Broadcast Packets Transmitted Number of broadcast packets that weretransmitted.
net | broadcastRx_summation Broadcast Packets Received Number of broadcast packets that werereceived.
net | bytesRx_average bytesRx (KBps) Average receive rate in kilobytes persecond.
net | bytesTx_average bytesTx (KBps) Average transmission rate in kilobytesper second.
net | multicastRx_summation Multicast Packets Received Number of multicast packets received.
net | multicastTx_summation Multicast Packets Transmitted Number of multicast packetstransmitted.
System Metrics for Virtual MachinesSystem metrics for virtual machines provide general information about the virtual machine, such as its buildnumber and running state.
Table 5-55. System Metrics for Virtual Machines
Metric Key Metric Name Description
sys | poweredOn Powered ON Powered-on virtual machines.
sys | uptime_latest Uptime (seconds) Latest uptime in seconds.
Chapter 5 Metrics for vCenter Server Components
VMware, Inc. 53

Table 5-55. System Metrics for Virtual Machines (Continued)
Metric Key Metric Name Description
sys | heartbeat_summation Heartbeat Heartbeats.
sys | vmotionEnabled vMotion Enabled 1 if vMotion is enabled or 0 if vMotion is notenabled.
sys | productString Product String Product string.
sys | build Build Number Build number.
sys | osUptime_latest OS Uptime Operating system up time.
Power Metrics for Virtual MachinesPower metrics provide information about power use.
Table 5-56. Power Metrics for Virtual Machines
Metric Key Metric Name Description
power | energy_summation Energy (Watt) Energy use in watts.
power | power_average Power (Watt) Average power use in watts.
Disk Space Metrics for Virtual MachinesDisk space metrics provide information about disk space use.
Table 5-57. Disk Space Metrics for Virtual Machines
Metric Key Metric Name Description
diskspace | notshared Not Shared (GB) Unshared space in kilobytes.
diskspace | numvmdisk Number of Virtual Disks Number of virtual disks.
diskspace | provisioned Provisioned Space (GB) Provisioned space in gigabytes.
diskspace | shared Shared Used (GB) Shared used space in gigabytes.
diskspace | snapshot Snapshot Space (GB) Snapshot space in gigabytes.
diskspace | diskused Virtual Disk Used (GB) Virtual disk space used in gigabytes.
diskpsace | used Virtual machine used (GB) Virtual machine space used in gigabytes.
Storage Metrics for Virtual MachinesStorage metrics provide information about storage use.
Table 5-58. Storage Metrics for Virtual Machines
Metric Key Metric Name Description
storage | commandsAveraged_average Commands per second Number of commands per second.
storage | contention Contention percentage Percent contention.
storage | demandKBps Demand (KBps) Demand in kilobytes per second.
storage | totalReadLatency_average Read Latency (ms) Read latency in milliseconds.
storage | read_average Read Rate (KBps) Read rate in kilobytes per second.
storage |numberReadAveraged_average
Reads per second Number of reads per second.
storage | totalLatency_average Total Latency (ms) Total latency in milliseconds.
VMware vCenter Adapter Installation and Configuration Guide
54 VMware, Inc.

Table 5-58. Storage Metrics for Virtual Machines (Continued)
Metric Key Metric Name Description
storage | usage_average Total Usage (KBps) Total use in kilobytes per second.
storage | totalWriteLatency_average Write Latency (ms) Write latency in milliseconds.
storage | write_average Write Rate (KBps) Write rate in kilobytes per second.
storage |numberWriteAveraged_average
Writes per second Writes per second.
Summary Metrics for Virtual MachinesSummary metrics provide information about overall performance.
Table 5-59. Summary Metrics for Virtual Machines
Metric Key Metric Name Description
summary | workload_indicator Workload Indicator (%) Percent workload indicator.
summary | capacity Capacity (%) Percent capacity.
summary | cpu_shares CPU Shares CPU shares.
summary | mem_shares Memory Shares Memory shares.
summary | number_datastore Number of Datastores Number of datastores.
summary | number_network Number of Networks Number of networks.
summary | running Running Number of running vitual machines.
summary | guest | ipaddress Guest IP address Guest operating system IP address.
summary | guest | fullname Guest OS name Guest operating system name.
summary | config | numEthernetCards Number of NICs Number of network interface cards.
summary | config | isTemplate VM Template Virtual machine template used.
summary | runtime | powerState Power State Power state.
Datastore MetricsThe vCenter adapter collects capacity, device, and summary metrics for datastores.
Capacity Metrics for DatastoresCapacity metrics provide information about datastore capacity.
Table 5-60. Capacity Metrics for Datastores
Metric Key Metric Name Description
capacity | available_space Available Space (GB) Available space in gigabytes.
capacity | contention Data Store Capacity Contention Datastore capacity contention.
capacity | total_capacity Total Capacity (GB) Total capacity in gigabytes.
capacity | used_space Used Space (GB) Used space in gigabytes.
capacity | workload Workload (%) Percent workload.
capacity | uncommitted Uncommitted Space (GB) Uncommitted space in gigabytes.
Chapter 5 Metrics for vCenter Server Components
VMware, Inc. 55

Device Metrics for DatastoresDevice metrics provide information about device performance.
Table 5-61. Devices Metrics for Datastores
Metric Key Metric Name Description
devices | busResets_summation Bus Resets Number of bus resets that occurredduring the performance interval.
devices | commandsAborted_summation Commands Aborted Number of aborted commands.
devices | commands_summation Commands Issued Number of disk commands issued in theperformance interval.
devices | totalLatency_average Disk Command Latency (ms) Average time taken for a command fromthe perspective of a guest operatingsystem. This metric is the sum of KernelDisk Command Latency and PhysicalDevice Command Latency metrics.
devices | totalReadLatency_average Disk Read Latency (ms) Average time taken for a read from theperspective of a guest operating system.This metric is the sum of the Kernel DiskRead Latency and Physical Device ReadLatency metrics.
devices | totalWriteLatency_average Disk Write Latency (ms) Average amount of time for a writeoperation to the datastore. Total latencyis the sum of kernel latency and devicelatency.
devices | kernelLatency_average Kernel Disk Command Latency(ms)
Average time spent in ESX ServerVMKernel per command.
devices | kernelReadLatency_average Kernel Disk Read Latency (ms) Average time spent in ESX host VMkernelper read.
devices | kernelWriteLatency_average Kernel Disk Write Latency (ms) Average time spent in ESX ServerVMKernel per write.
devices | number_running_hosts Number of Running Hosts Number of running hosts that arepowered on.
devices | number_running_vm Number of Running VMs Number of running virtual machines thatare powered on.
devices | deviceLatency_average Physical Device CommandLatency (ms)
Average time taken to complete acommand from the physical device.
devices | deviceReadLatency_average Physical Device Read Latency(ms)
Average time taken to complete a readfrom the physical device.
devices | queueLatency_average Queue Command Latency (ms) Average time spent in the ESX ServerVMKernel queue per command.
devices | queueReadLatency_average Queue Read Latency (ms) Average time spent in the ESX ServerVMKernel queue per read.
devices | queueWriteLatency_average Queue Write Latency (ms) Average time spent in the ESX ServerVMKernel queue per write.
devices | read_average Read Rate (KBps) Amount of data read during thecollection interval.
devices | numberRead_summation Read Requests Number of times data was read from thedisk during the collection interval.
devices | numberReadAveraged_average Reads per second Average number of read commandsissued per second to the datastore duringthe collection interval.
VMware vCenter Adapter Installation and Configuration Guide
56 VMware, Inc.
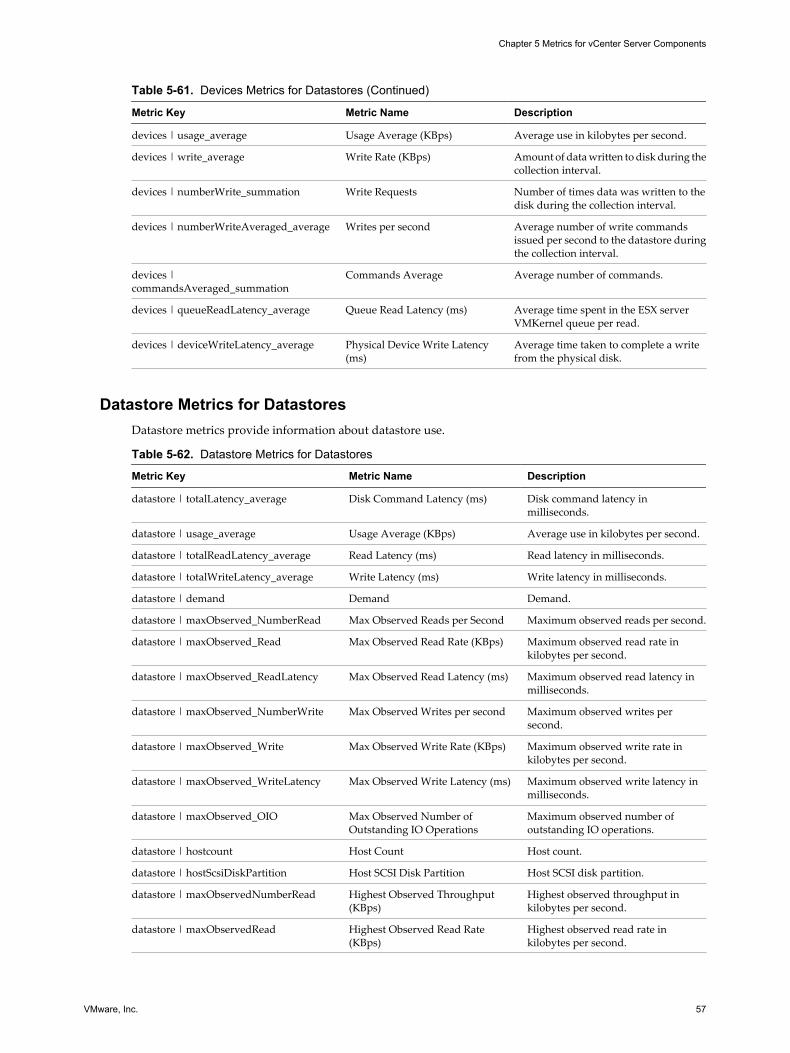
Table 5-61. Devices Metrics for Datastores (Continued)
Metric Key Metric Name Description
devices | usage_average Usage Average (KBps) Average use in kilobytes per second.
devices | write_average Write Rate (KBps) Amount of data written to disk during thecollection interval.
devices | numberWrite_summation Write Requests Number of times data was written to thedisk during the collection interval.
devices | numberWriteAveraged_average Writes per second Average number of write commandsissued per second to the datastore duringthe collection interval.
devices |commandsAveraged_summation
Commands Average Average number of commands.
devices | queueReadLatency_average Queue Read Latency (ms) Average time spent in the ESX serverVMKernel queue per read.
devices | deviceWriteLatency_average Physical Device Write Latency(ms)
Average time taken to complete a writefrom the physical disk.
Datastore Metrics for DatastoresDatastore metrics provide information about datastore use.
Table 5-62. Datastore Metrics for Datastores
Metric Key Metric Name Description
datastore | totalLatency_average Disk Command Latency (ms) Disk command latency inmilliseconds.
datastore | usage_average Usage Average (KBps) Average use in kilobytes per second.
datastore | totalReadLatency_average Read Latency (ms) Read latency in milliseconds.
datastore | totalWriteLatency_average Write Latency (ms) Write latency in milliseconds.
datastore | demand Demand Demand.
datastore | maxObserved_NumberRead Max Observed Reads per Second Maximum observed reads per second.
datastore | maxObserved_Read Max Observed Read Rate (KBps) Maximum observed read rate inkilobytes per second.
datastore | maxObserved_ReadLatency Max Observed Read Latency (ms) Maximum observed read latency inmilliseconds.
datastore | maxObserved_NumberWrite Max Observed Writes per second Maximum observed writes persecond.
datastore | maxObserved_Write Max Observed Write Rate (KBps) Maximum observed write rate inkilobytes per second.
datastore | maxObserved_WriteLatency Max Observed Write Latency (ms) Maximum observed write latency inmilliseconds.
datastore | maxObserved_OIO Max Observed Number ofOutstanding IO Operations
Maximum observed number ofoutstanding IO operations.
datastore | hostcount Host Count Host count.
datastore | hostScsiDiskPartition Host SCSI Disk Partition Host SCSI disk partition.
datastore | maxObservedNumberRead Highest Observed Throughput(KBps)
Highest observed throughput inkilobytes per second.
datastore | maxObservedRead Highest Observed Read Rate(KBps)
Highest observed read rate inkilobytes per second.
Chapter 5 Metrics for vCenter Server Components
VMware, Inc. 57
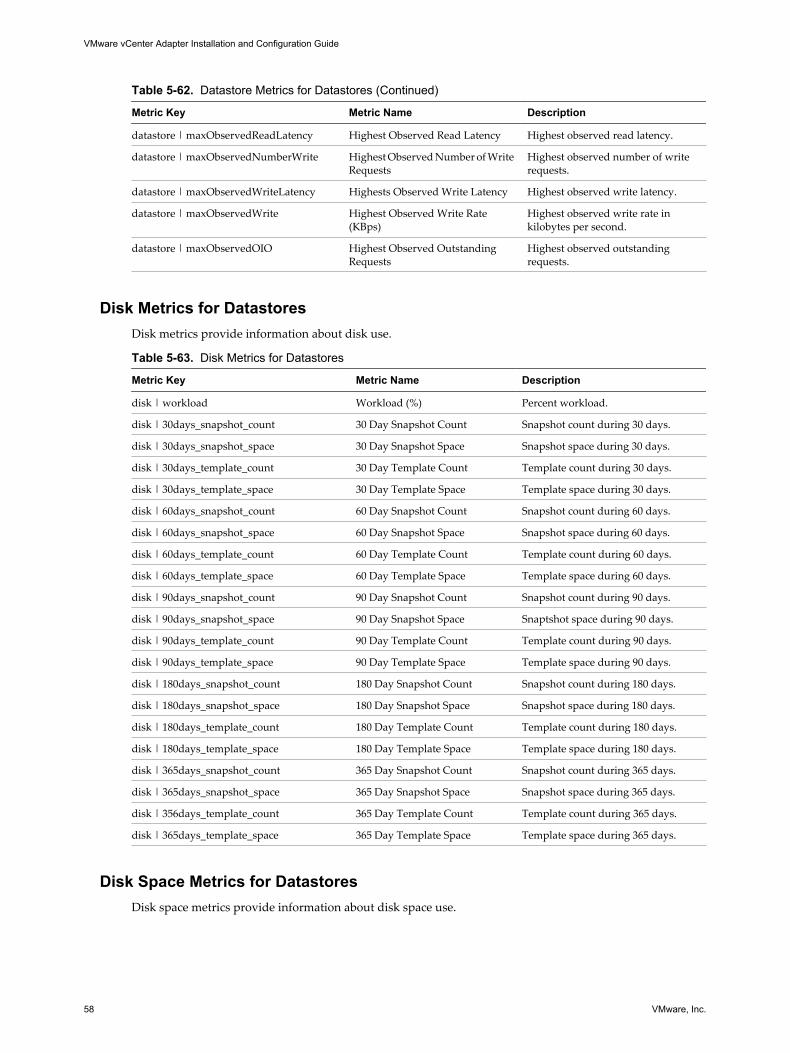
Table 5-62. Datastore Metrics for Datastores (Continued)
Metric Key Metric Name Description
datastore | maxObservedReadLatency Highest Observed Read Latency Highest observed read latency.
datastore | maxObservedNumberWrite Highest Observed Number of WriteRequests
Highest observed number of writerequests.
datastore | maxObservedWriteLatency Highests Observed Write Latency Highest observed write latency.
datastore | maxObservedWrite Highest Observed Write Rate(KBps)
Highest observed write rate inkilobytes per second.
datastore | maxObservedOIO Highest Observed OutstandingRequests
Highest observed outstandingrequests.
Disk Metrics for DatastoresDisk metrics provide information about disk use.
Table 5-63. Disk Metrics for Datastores
Metric Key Metric Name Description
disk | workload Workload (%) Percent workload.
disk | 30days_snapshot_count 30 Day Snapshot Count Snapshot count during 30 days.
disk | 30days_snapshot_space 30 Day Snapshot Space Snapshot space during 30 days.
disk | 30days_template_count 30 Day Template Count Template count during 30 days.
disk | 30days_template_space 30 Day Template Space Template space during 30 days.
disk | 60days_snapshot_count 60 Day Snapshot Count Snapshot count during 60 days.
disk | 60days_snapshot_space 60 Day Snapshot Space Snapshot space during 60 days.
disk | 60days_template_count 60 Day Template Count Template count during 60 days.
disk | 60days_template_space 60 Day Template Space Template space during 60 days.
disk | 90days_snapshot_count 90 Day Snapshot Count Snapshot count during 90 days.
disk | 90days_snapshot_space 90 Day Snapshot Space Snaptshot space during 90 days.
disk | 90days_template_count 90 Day Template Count Template count during 90 days.
disk | 90days_template_space 90 Day Template Space Template space during 90 days.
disk | 180days_snapshot_count 180 Day Snapshot Count Snapshot count during 180 days.
disk | 180days_snapshot_space 180 Day Snapshot Space Snapshot space during 180 days.
disk | 180days_template_count 180 Day Template Count Template count during 180 days.
disk | 180days_template_space 180 Day Template Space Template space during 180 days.
disk | 365days_snapshot_count 365 Day Snapshot Count Snapshot count during 365 days.
disk | 365days_snapshot_space 365 Day Snapshot Space Snapshot space during 365 days.
disk | 356days_template_count 365 Day Template Count Template count during 365 days.
disk | 365days_template_space 365 Day Template Space Template space during 365 days.
Disk Space Metrics for DatastoresDisk space metrics provide information about disk space use.
VMware vCenter Adapter Installation and Configuration Guide
58 VMware, Inc.

Table 5-64. Disk Space Metrics for Datastores
Metric Key Metric Name Description
diskspace | notshared Not Shared (GB) Unshared space in gigabytes.
diskspace | numvmdisk Number of Virtual Disks Number of virtual disks.
diskspace | provisioned Provisioned Space (GB) Provisioned space in gigabytes.
diskspace | shared Shared Used (GB) Shared used space in gigabytes.
diskspace | snapshot Snapshot Space (GB) Snapshot space in gigabytes.
diskspace | diskused Virtual Disk Used (GB) Virtual disk used space in gigabtyes.
diskpsace | used Virtual machine used (GB) Virtual machine used space in gigabytes.
diskspace | disktotal Total used (GB) Total used space in gigabytes.
diskspace | swap Swap File Space (GB) Swap file space in gigabytes.
diskspace | otherused Other VM Space (GB) Other virtual machine space in gigabytes.
diskspace | freespace Freespace (GB) Freespace in gigabytes.
diskspace | capacity Capacity (GB) Capacity in gigabytes.
Summary Metrics for DatastoresSummary metrics provide information about overall performance.
Table 5-65. Summary Metrics for Datastores
Metric Key Metric Name Description
summary | total_number_hosts Total Number of Hosts Total number of hosts.
summary | total_number_vms Total Number of VMs Total number of virtual machine.
summary | workload_indicator Workload Indicator Workload indicator.
summary | total_number_clusters Total Number of Clusters Total number of clusters.
summary | diskCapacity Disk Capacity Disk capacity.
Capacity Planning MetricsCapacityIQ collects metrics that provide capacity planning information.
Capacity Remaining MetricsTable 5-66. Capacity Remaining Metrics
Metric Key Metric Name Description
capacityRemaining | count | vm Count - VM Number of virtual machines.
capacityRemaining | count | vm | cpu Count - VM - CPU Number of virtual machine CPUs.
capacityRemaining | count | vm | diskSpace Count - VM - Disk Space Virtual machine disk space
capacityRemaining | count | vm | diskIO Count - VM - DiskIO Virtual machine disk IO.
capacityRemaining | count | vm | memory Count - VM - Memory Virtual machine memory.
capacityRemaining | count | vm | net Count - VM - Network Virtual machine network.
capacityRemaining | count | vm | mem |demand
Count - VM - Memory -Demand
Virtual machine memory demand.
Chapter 5 Metrics for vCenter Server Components
VMware, Inc. 59

Table 5-66. Capacity Remaining Metrics (Continued)
Metric Key Metric Name Description
capacityRemaining | count | vm | mem |consumed
Count - VM - Memory -Consumed
Virtual machine memory consumed.
capacityRemaining | count | vm | mem |reservation
Count - VM - Memory -Reservation
Virtual machine memory reservation.
capacityRemaining | count | vm | cpu | demand Count - VM - CPU - Demand Virtual machine CPU demand.
capacityRemaining | count | vm | cpu |reservation
Count - VM - CPU -Reservation
Virtual machine CPU reservation.
Density MetricsTable 5-67. Density Metrics
Metric Key Metric Name Description
density | ratio | vcpu2pcpu Ratio - vCPU to pCPU Virtual CPU to physical CPU ratio.
density | ratio | vm2host Ratio - VM to Host Virtual machine to host ratio.
density | ratio | vmem2pmem Ratio - vMemory to pMemory Virtual memory to physical memory ratio.
density | ratioOptimal | vcpu2pcpu Ratio Optimal - vCPU to pCPU Optimal virtual CPU to physical CPU ratio.
density | ratioOptimal | vm2host Ratio Optimal - VM to Host Optimal virtual machine to host ratio.
desnity | ratioOptiomal |vmem2pmem
Ratio Optimal - vMemory topMemory
Optimal virtual memory to physicalmemory ratio.
Deployed MetricsTable 5-68. Deployed Metrics
Metric Key Metric Name Description
deployed | count | vm Count - VM Number of deployed virtual machines.
deployed | countDistinct | vm Count Distinct - VM Number of distinct deployed virtual machines.
Optimal MetricsTable 5-69. Optimal Metrics
Metric Key Metric Name Description
optimal | countDistinct | vm Count Distinct - VM Distinct virtual machines.
Planning MetricsTable 5-70. Planning Metrics
Metric Key Metric Name Description
planning | capacityProvisioned | diskSpace Capacity Provisioned - Disk Space Provisioned disk space.
planning | capacityProvisioned | mem Capacity Provisioned - Memory Provisioned memory.
planning | capacityProvisioned | vcpu Capacity Provisioned - vCPU Provisioned virtual CPU.
planning | capacityUsable | diskSpace Capacity Usable - Disk Space Usable disk space.
planning | capacityUsable | mem Capacity Usable - Memory Usable memory.
VMware vCenter Adapter Installation and Configuration Guide
60 VMware, Inc.
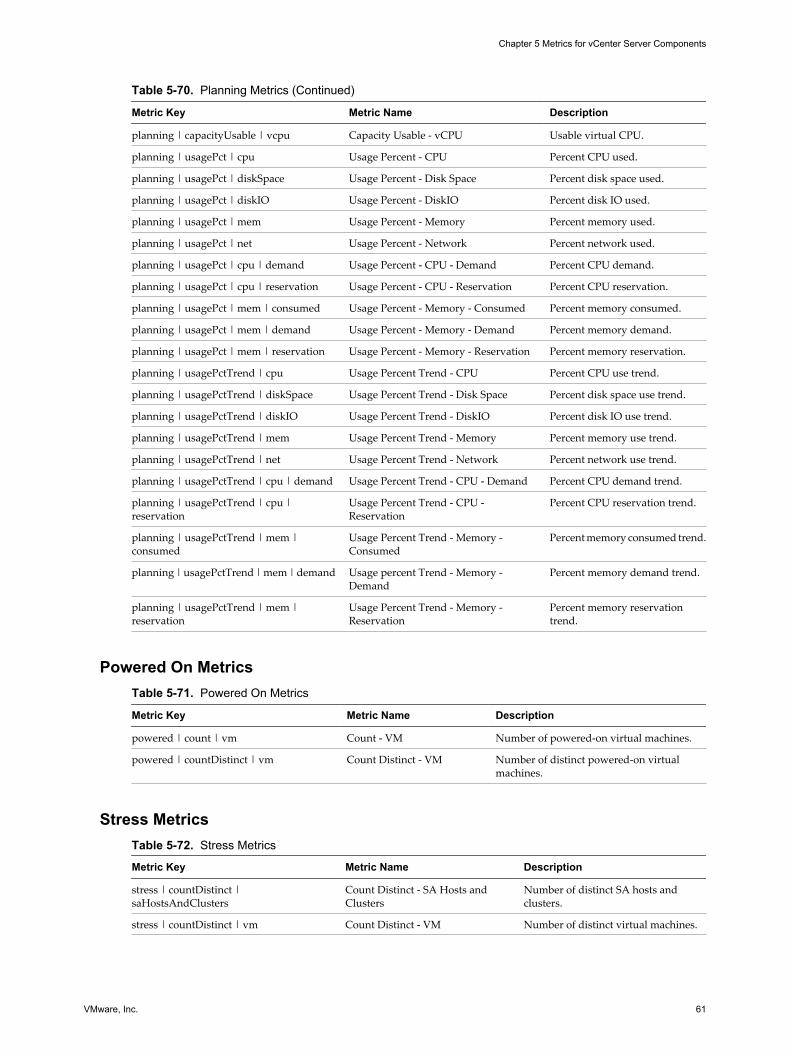
Table 5-70. Planning Metrics (Continued)
Metric Key Metric Name Description
planning | capacityUsable | vcpu Capacity Usable - vCPU Usable virtual CPU.
planning | usagePct | cpu Usage Percent - CPU Percent CPU used.
planning | usagePct | diskSpace Usage Percent - Disk Space Percent disk space used.
planning | usagePct | diskIO Usage Percent - DiskIO Percent disk IO used.
planning | usagePct | mem Usage Percent - Memory Percent memory used.
planning | usagePct | net Usage Percent - Network Percent network used.
planning | usagePct | cpu | demand Usage Percent - CPU - Demand Percent CPU demand.
planning | usagePct | cpu | reservation Usage Percent - CPU - Reservation Percent CPU reservation.
planning | usagePct | mem | consumed Usage Percent - Memory - Consumed Percent memory consumed.
planning | usagePct | mem | demand Usage Percent - Memory - Demand Percent memory demand.
planning | usagePct | mem | reservation Usage Percent - Memory - Reservation Percent memory reservation.
planning | usagePctTrend | cpu Usage Percent Trend - CPU Percent CPU use trend.
planning | usagePctTrend | diskSpace Usage Percent Trend - Disk Space Percent disk space use trend.
planning | usagePctTrend | diskIO Usage Percent Trend - DiskIO Percent disk IO use trend.
planning | usagePctTrend | mem Usage Percent Trend - Memory Percent memory use trend.
planning | usagePctTrend | net Usage Percent Trend - Network Percent network use trend.
planning | usagePctTrend | cpu | demand Usage Percent Trend - CPU - Demand Percent CPU demand trend.
planning | usagePctTrend | cpu |reservation
Usage Percent Trend - CPU -Reservation
Percent CPU reservation trend.
planning | usagePctTrend | mem |consumed
Usage Percent Trend - Memory -Consumed
Percent memory consumed trend.
planning | usagePctTrend | mem | demand Usage percent Trend - Memory -Demand
Percent memory demand trend.
planning | usagePctTrend | mem |reservation
Usage Percent Trend - Memory -Reservation
Percent memory reservationtrend.
Powered On MetricsTable 5-71. Powered On Metrics
Metric Key Metric Name Description
powered | count | vm Count - VM Number of powered-on virtual machines.
powered | countDistinct | vm Count Distinct - VM Number of distinct powered-on virtualmachines.
Stress MetricsTable 5-72. Stress Metrics
Metric Key Metric Name Description
stress | countDistinct |saHostsAndClusters
Count Distinct - SA Hosts andClusters
Number of distinct SA hosts andclusters.
stress | countDistinct | vm Count Distinct - VM Number of distinct virtual machines.
Chapter 5 Metrics for vCenter Server Components
VMware, Inc. 61

Table 5-72. Stress Metrics (Continued)
Metric Key Metric Name Description
stress | percent | cpu Percent - CPU Percent CPU.
stress | percent | mem Percent - Memory Percent memory.
Time Remaining MetricsTable 5-73. Time Remaining Metrics
Metric Key Metric Name Description
timeRemaining | allDimensions All Dimensions Time remaining for all dimensions.
timeRemaining | cpu CPU CPU time remaining.
timeRemaining | diskSpace Disk Space Disk space time remaining.
timeRemaining | diskIO DiskIO Disk IO time remaining.
timeRemaining | mem Memory Memory time remaining.
timeRemaining | net Network Network time remaining.
timeRemaining | cpu | demand CPU - Demand CPU demand time remaining.
timeRemaining | cpu | reservation CPU - Reservation CPU reservation time remaining.
timeRemaining | mem | consumed Memory - Consumed Memory consumed time remaining.
timeRemaining | mem | demand Memory - Demand Memory demand time remaining.
timeRemaining | mem | reservation Memory - Reservation Memory reservation time remaining.
timeRemaining | score | cpu Score - CPU CPU score.
timeRemaining | score | diskSpace Score - Disk Space Disk space score.
timeRemaining | score | diskIO Score - DiskIO Disk IO score.
timeRemaining | score | mem Score - Memory Memory score.
timeRemaining | score | net Score - Network Network score.
Waste MetricsTable 5-74. Waste Metrics
Metric Key Metric Name Description
waste | countDistinct | templateUnused Count Distinct - Template Unused Unused templates.
waste | countDistinct |vmIdleOrOversized
Count Distinct - VM Idle orOversized
Idle or oversized virtual machines.
waste | countDistinct | vmIdle Count Distinct - VM Idle Idle virtual machines.
waste | countDistinct | vmOversized Count Distinct - VM Oversized Oversized virtual machines.
waste | countDistinct | vmPoweredOff Count Distinct - VM Powered Off Powered-off virtual machines.
waste | countDistinct | vm Count Distinct - VM Number of virtual machines.
waste | countDistinct | vmOversized | cpu Count Distinct - VM Oversized - CPU Oversized virtual machine CPUs.
waste | countDistinct | vmOversized |mem
Count Distinct - VM Oversized -Memory
Oversized virtual machine memory.
waste | diskSpace | total Disk Space - Total Total disk space.
waste | percent | diskSpace Percent - Disk Space Percent disk space.
waste | percent | mem Percent - Memory Percent memory.
VMware vCenter Adapter Installation and Configuration Guide
62 VMware, Inc.

Table 5-74. Waste Metrics (Continued)
Metric Key Metric Name Description
waste | percent | vcpu Percent - vCPU Percent virtual CPU.
waste | mem | total Memory - Total Total memory.
waste | vcpu | total vCPU - Total Total virtual CPU.
VC Event Processing MetricsTable 5-75. VC Event Processing Metrics
Metric Key Metric Name Description
event | time Last VC Event Time Time of last vCenter event.
event | key Last VC Event ID Event ID of last vCenter event.
Badge MetricsBadge metrics provide information for badges in the user interface.
Table 5-76. Badge Metrics
Metric Key Metric Name Description
badge | alert_count_critical Alert Count Critical Critical alert count.
badge | alert_count_immediate Alert Count Immediate Immediate alert count.
badge | alert_count_info Alert Count Info Information alert count.
badge | alert_count_warning Alert Count Warning Warning alert count.
badge | anomaly Anomaly Anomalies.
badge | capacityRemaining Capacity Remaining Remaining capacity.
badge | compliance Compliance Compliance score.
badge | density Density Density score.
badge | efficiency Efficiency Efficiency score.
badge | fault Fault Fault score.
badge | health Health Health score.
badge | risk Risk Risk score.
badge | stress Stress Stress score.
badge | timeRemaining Time Remaining - Planning,Cyclical
Planning and cynclical time remaining.
badge | timeRemainingStandard Time Remaining - Real Time Real-time time remaining.
badge | waste Waste Waste score.
badge | workload Workload (%) Percent workload.
Chapter 5 Metrics for vCenter Server Components
VMware, Inc. 63

VMware vCenter Adapter Installation and Configuration Guide
64 VMware, Inc.

Metrics for vCenter OperationsManager Components 6
The vCenter Operations adapter monitors vCenter Operations Manager.
In vCenter Operations Manager 5.6 and later releases, the vCenter Operations adapter collects metrics forcertain vCenter Operations Manager components. These self-monitoring metrics are useful for diagnosingproblems with vCenter Operations Manager.
This chapter includes the following topics:
n “Analytics Metrics,” on page 65
n “Collector Metrics,” on page 70
n “ActiveMQ Service Metrics,” on page 71
n “Web Server Metrics,” on page 72
n “Replication Server Metrics,” on page 74
n “Database Metrics,” on page 74
n “Host Operating System Metrics,” on page 75
Analytics MetricsThe vCenter Operations adapter collects metrics for the vCenter Operations Manager Analytics service,including replication server, data receiver, threshold checker, alarm, alert, dynamic threshold, FSDB, databaseconnection, and garbage collector metrics.
Table 6-1. Analytics Metrics
Metric Key Metric Name Description
ConfiguredResources Configured Resources Configured resources.
VCConfiguredResources VC Configured Resources Configured vCenter resources.
ActiveAlarms Active Alarms Active alarms.
ActiveAlerts Active Alerts Active alerts.
FingerprintThreads Fingerprint Threads Fingerprint threads.
resourceCacheLoadTime Resource Cache Load Time (ms) Resource cache load time.Available only in 5.7 and laterreleases.
attributeCacheLoadTime Attribute Cache Load Time (ms) Attribute cache load time.Available only in 5.7 and laterreleases.
CurrentHeapSize Current heap size (MB) Current heap size.
VMware, Inc. 65
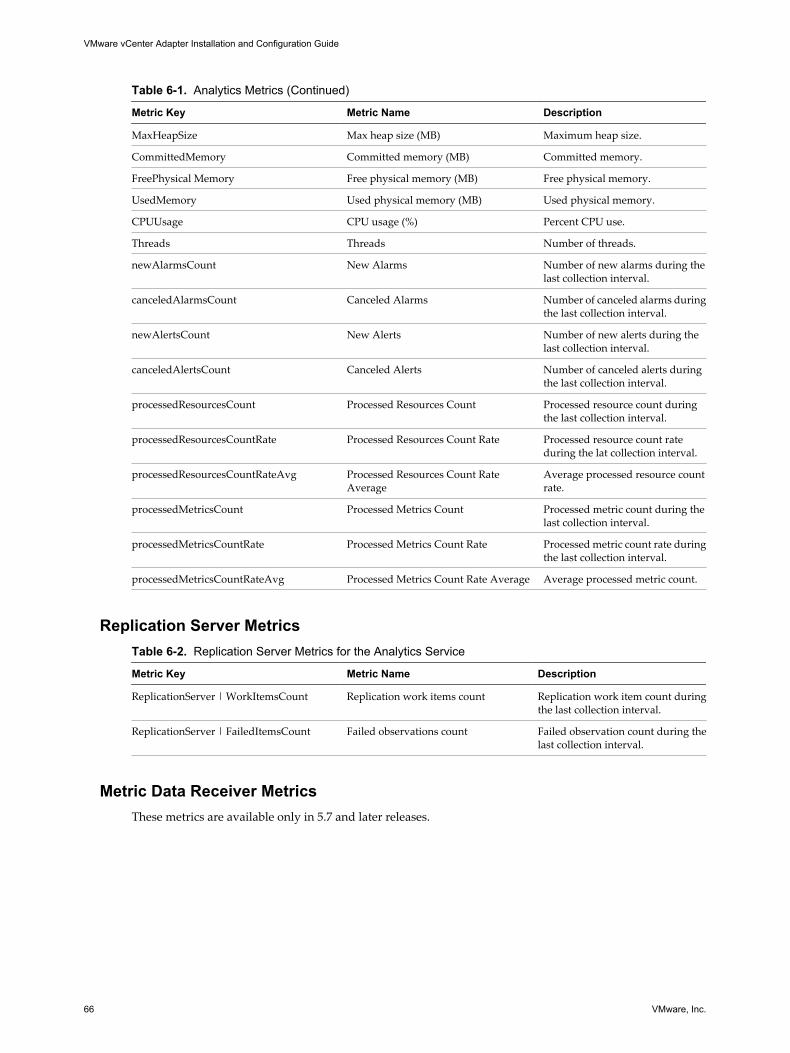
Table 6-1. Analytics Metrics (Continued)
Metric Key Metric Name Description
MaxHeapSize Max heap size (MB) Maximum heap size.
CommittedMemory Committed memory (MB) Committed memory.
FreePhysical Memory Free physical memory (MB) Free physical memory.
UsedMemory Used physical memory (MB) Used physical memory.
CPUUsage CPU usage (%) Percent CPU use.
Threads Threads Number of threads.
newAlarmsCount New Alarms Number of new alarms during thelast collection interval.
canceledAlarmsCount Canceled Alarms Number of canceled alarms duringthe last collection interval.
newAlertsCount New Alerts Number of new alerts during thelast collection interval.
canceledAlertsCount Canceled Alerts Number of canceled alerts duringthe last collection interval.
processedResourcesCount Processed Resources Count Processed resource count duringthe last collection interval.
processedResourcesCountRate Processed Resources Count Rate Processed resource count rateduring the lat collection interval.
processedResourcesCountRateAvg Processed Resources Count RateAverage
Average processed resource countrate.
processedMetricsCount Processed Metrics Count Processed metric count during thelast collection interval.
processedMetricsCountRate Processed Metrics Count Rate Processed metric count rate duringthe last collection interval.
processedMetricsCountRateAvg Processed Metrics Count Rate Average Average processed metric count.
Replication Server MetricsTable 6-2. Replication Server Metrics for the Analytics Service
Metric Key Metric Name Description
ReplicationServer | WorkItemsCount Replication work items count Replication work item count duringthe last collection interval.
ReplicationServer | FailedItemsCount Failed observations count Failed observation count during thelast collection interval.
Metric Data Receiver MetricsThese metrics are available only in 5.7 and later releases.
VMware vCenter Adapter Installation and Configuration Guide
66 VMware, Inc.

Table 6-3. Metric Data Receiver Metrics for the Analytics Service
Metric Key Metric Name Description
metricDataReceiver | state Metric Receiver State Metric data receiver state. 0 forconnecting, 1 for waitForMQ, 2 forprocessMsg, 3 forwaitForHiearchy, and 4 forwaitForThresholdChecking.
metricDataReceiver | waitForMQTime Wait For MQ Time (ms) Time spent waiting for data fromthe message queue during the lastcollection interval.
metricDataReceiver | waitForHierarchyTime Wait For Hiearchy Time (ms) Time spent waiting for hierarchymetric threshold checking at acycle end check point during thelast collection interval.
metricDataReceiver |waitforThresholdCheckTime
Wait For Threshold Check Time (ms) Time spent waiting for theoutstanding threshold checkingwork item count to drop below themaximum allowed value duringthe last collection interval.
metricDataReceiver |processedMessageCount
Processed Message Count Processed message count duringthe last collection interval.
metricDataReceiver |processedMessageCountRate
Processed Message Count Rate Processed message count rateduring the last collection interval.
metricDataReceiver |processedMessageCountRateAvg
Processed Message Count RateAverage
Average message count rate.
metricDataReceiver | storageThreadPoolSize Storage Thread Pool Size Storage thread pool size.
metricDataReceiver | cycleCompTime Cycle Computation Time (ms) Cycle computation time.
Threshold Checker MetricsThese metrics are available only in 5.7 and later releases.
Table 6-4. Threshold Checker Receiver Metrics for the Analytics Service
Metric Key Metric Name Description
thresholdChecker | totalCount Total Work Item Count Total outstanding thresholdchecking work item count.
thresholdChecker | waitForFSDBCount Wait For FSDB Work Item Threshold checking work itemcount that is waiting for the FSDB.
thresholdChecker |processedObservationCount
Processed Observation Count Processed observation countduring the last collection interval.
thresholdChecker |processedObservationCountRate
Processed Observation Count Rate Processed observation count rateduring the last collection interval.
thresholdChecker |processedObservationcountRateAvg
Processed Observation Count RateAverage
Average processed observationcount rate.
Alarm MetricsThese metrics are available only in 5.7 and later releases.
Chapter 6 Metrics for vCenter Operations Manager Components
VMware, Inc. 67

Table 6-5. Alarm Metrics for the Analytics Service
Metric Key Metric Name Description
alarm | newAlarmOpTime New Alarm Count Op Time (ms) Time spent creating new alarmsduring the last collection interval.
alarm | newAlarmOpTimeAvg New Alarm Count Op Time Average(ms)
Average time spent creating newalarms.
alarm | newFaultAlarmCount New Fault Alarm Count New fault alarm count during thelast collection interval.
alarm | newFaultAlarmOptime New Fault Alarm Count Op Time(ms)
Time spent creating new faultalarms during the last collectioninterval.
alarm | canceledAlarmOpTime New Canceled Alarm Count Op Time(ms)
Time spent canceling alarmsduring the last collection interval.
Alert MetricsThese metrics are available only in 5.7 and later releases.
Table 6-6. Alert Metrics for the Analytics Service
Metric Key Metric Name Description
alert | newAlertOpTime New Alert Count Op Time (ms) New alert count during the lastcollection interval.
alert | newalertOpTimeAvg New Alert Count Op Time Average(ms)
Average time spent creating newalerts.
alert | newfingerPrintGenerationAlertCount New Finger Print Generation AlertCount
New fingerprint alert countduring the last collection interval.
alert |newFingerPrintGenerationAlertOpTime
New Finger Print Generation AlertCount Op Time (ms)
Time spent creating fingerprintalerts during the last collectioninterval.
alert | canceledAlertOptime New Canceled Alert Count Op Time(ms)
Time spent canceling alerts duringthe last collection interval.
Dynamic Threshold MetricsTable 6-7. Dynamic Threshold Metrics for the Analytics Service
Metric Key Metric Name Description
dt | isRunning Running Value is 1 if dynamic threshold iscurrently running.
dt | percentage Percent (%) Finished dynamic thresholdcalculation percentage during adynamic threshold run.
dt | dtProcessorCount DT Processor Count Dynamic threshold processorcount.
dt | resourceCount Resource Count Resource count.
dt | fsdbReadTime FSDB Read Time (ms) FSDB read time.
dt | dtObjectSaveTime DT Object Save Time (ms) Dynamic threshold save time.
dt | dtHistorySaveTime DT History Save Time (ms) Dynamic threshold history savetime.
VMware vCenter Adapter Installation and Configuration Guide
68 VMware, Inc.

Table 6-7. Dynamic Threshold Metrics for the Analytics Service (Continued)
Metric Key Metric Name Description
dt | dtRunTime DT Run Time (ms) Dynamic threshold run time.Available only in 5.7 and laterreleases.
dt | cachedDTObjectCount Cached Object Count Cached object count since the starttime of the current dynamicthreshold run.Available only in 5.7 and laterreleases.
dt | dtCalcTime DT Calc Time (ms) Time spent calculating dynamicthresholds since the start of thecurrent dynamic threshold run.Available only in 5.7 and laterreleases.
FSDB MetricsThese metrics are available only in 5.7 and later releases.
Table 6-8. FSDB Metrics for the Analytics Service
Metric Key Metric Name Description
fsdb | savedObservationCount Saved Observation count Saved observation count duringthe last collection interval.
fsdb | saveObservationOpTime Save Observation Op Time (ms) Time spent saving the observationcount during the last collectioninterval.
fsdb | saveObservationOpTimeAvg Save Observation Op Time Average(ms)
Average time spent saving theobservation count.
Database Connection Pool MetricsThese metrics are available only in 5.7 and later releases.
Table 6-9. Database Connection Pool Metrics for the Analytics Service
Metric Key Metric Name Description
dbConnectionPool | numConnections Connection Count Number of database connectionsin the database connection pool.
dbConnectionPool | numIdleConnections Idle Connection Count Number of idle connections in thedatabase connection pool.
dbConnectionPool | numBusyConnections Busy Connection Count Number of busy connections in thedatabase connection pool.
dbConnectionPool |numUnclosedOrphanedConnecions
Unclosed Orphaned ConnectionCount
Number of unclosed orphanedconnections in the databaseconnection pool.
Chapter 6 Metrics for vCenter Operations Manager Components
VMware, Inc. 69

Garbage Collector MetricsTable 6-10. Garbage Collector Metrics for the Analytics Service
Metric Key Metric Name Description
garbageCollector | collectionCount Collection Count Garbage collection count duringthe last collection interval.
garbageCollector | collectionTime Collection Time (ms) Time spent in garbage collectionduring the last collection interval.
Collector MetricsThe vCenter Operations adapter collects metrics for the vCenter Operations Manager Collector service,including collection statistic and garbage collector metrics.
Table 6-11. Collector Metrics
Metric Key Metric Name Description
ThreadpoolThreadsCount Pool Threads Count Number of pool threads.
CurrentHeapSize Current heap size (MB) Current heap size.
MaxHeapsize Max heap size (MB) Maximum heap size.
CommittedMemory Committed memory (MB) Amount of committed memory.
FreePhysicalMemory Free physical memory Free physical memory.
UsedMemory Used physical memory Used physical memory.
CPUUsage CPU usage (%) Percent CPU use.
Threads Threads Number of threads.
Collection Statistics MetricsThese metrics are available only in 5.7 and later releases.
Table 6-12. Collection Statistics Metrics for the Collector Service
Metric Key Metric Name Description
collection | collectionTime Collection Time (ms) Time spent in data collection duringthe last collection interval.
collection | resourceCount Resource Count Number of resources processed duringthe last collection interval.
collection | metricCount Metric Count Number of metrics processed duringthe last collection interval.
Garbage Collector MetricsThese metrics are available only in 5.7 and later releases.
VMware vCenter Adapter Installation and Configuration Guide
70 VMware, Inc.

Table 6-13. Garbage Collector Metrics for the Collector Service
Metric Key Metric Name Description
garbageCollector | collectionCount Collection Count Garbage collection count during thelast collection interval.
garbageCollector | collectionTime Collection Time (ms) Time spent in garbage collectionduring the last collection interval.
ActiveMQ Service MetricsThe vCenter Operations adapter collects metrics for the vCenter Operations Manager ActiveMQ service,including queue, broker, database, and garbage collector metrics.
Table 6-14. ActiveMQ Metrics
Metric Key Metric Name Description
currentHeapSie Current heap size (MB) Current heap size.
MaxHeapSize Max heap size (MB) Maximum heap size.
CommittedMemory Committed memory (MB) Committed memory size.
FreePhysicalMemory Free physical memory Free physical memory.
UsedMemory Used physical memory Used physical memory.
CPUUsage CPU usage (%) Percent CPU use.
Threads Threads Number of threads.
Queue MetricsTable 6-15. Queue Metrics for the ActiveMQ Service
Metric Key Metric Name Description
Queues | MemoryPercentUsage Used Memory Percentage Percent used memory.
Queues | MemoryLimit Memory Limit Memory limit.
Queues | EnqueueCount Enqueue Count Enqueue count.
Queues | DispatchCount Dispatch Count Dispatch count.
Queues | DequeueCount Dequeue Count Dequeue count.
Queues | ConsumerCount Consumer Count Consumer count.
Queues | QueueSize Queue Size Queue size.
Queues | CursorMemoryUsage Cursor memory usage Cursor memory use.
Queues | CursorFull Cursor Full If the cursor reached its memory limit forpaged messages.Available only in 5.7 and later releases.
Queues | AverageEnqueueTime Average Enqueue Time (ms) Average amount of time, in milliseconds,that messages remained in the destinationbefore being consumed.Available only in 5.7 and later releases.
Queues | ProductCount Producer Count Number of producers connected to thedestination.Available only in 5.7 and later releases.
Chapter 6 Metrics for vCenter Operations Manager Components
VMware, Inc. 71

Broker MetricsTable 6-16. Broker Metrics for the ActiveMQ Service
Metric Key Metric Name Description
Broker | TotalEnqueueCount Total Enqueue Count Total enqueue count.
Broker | TotalDequeueCount Total Dequeue Count Total dequeue count.
Broker | TotalConsumerCount Total Consumers Count Total consumers count.
Broker | TotalMessageCount Total Messages Count Total messages count.
Broker | MemoryPercentUsage Total used memory Total used memory.
Broker | MemoryLimit Total memory limit Total memory limit.
Database Metrics
NOTE These metrics are available only in 5.7 and later releases.
Table 6-17. Database Metrics for the ActiveMQ Service
Metric Key Metric Name Description
kahaDB | fileCount File Count Total kahaDB log file count.
kahaDB | fileSize File Size (MB) Total size of the log files inthe /data/activemq/data/kahadbfolder.
Garbage Collector Metrics
NOTE These metrics are available only in 5.7 and later releases.
Table 6-18. Garbage Collector Metrics for the ActiveMQ Service
Metric Key Metric Name Description
garbageCollector | collectionCount Collection Count Garbage collectdion count during the lastcollection interval.
garbageCollector | collectionTime Collection Time (ms) Time spent in garbage collection duringthe last collection interval.
Web Server MetricsThe vCenter Operations adapter collects garbage collector and global request metrics for the vCenterOperations Web Server and vCenter Operations Web Std Server components. It also collects CapacityIQmetrics for the Web Server component.
Table 6-19. Web Server Metrics
Metric Key Metric Name Description
UsersCount Users Count User count.
ActiveSessionsCount Active Sessions Active sessions count.
CurrentHeapSize Current heap size (MB) Current heap size.
MaxHeapSize Max heap size (MB) Maximum heap size.
CommittedMemory Committed memory (MB) Committed memory.
VMware vCenter Adapter Installation and Configuration Guide
72 VMware, Inc.

Table 6-19. Web Server Metrics (Continued)
Metric Key Metric Name Description
FreePhysicalMemory Free physical memory Free physical memory.
UsedMemory Used physical memory Used physical memory.
CPUUsage CPU usage (%) Percent CPU use.
Threads Threads Number of threads.
Global Request MetricsTable 6-20. Global Request Metrics for the Web Server Component
Metric Key Metric Name Description
globalRequest | processingTime Request Processing Time (ms) Time spent processing globalrequests during the last collectioninterval.
globalRequest | processingtimeAvg Request Processing TimeAverage (ms)
Average time spent processing globalrequests.Available only in 5.7 and laterreleases.
globalRequest | requestCount Request Count Catalina global request count.
globalRequest | requestCountRate Request Count Rate Request count rate during the lastcollection interval.Available only in 5.7 and laterreleases.
globalRequest | requestCountRateAvg Request Count Rate Average Average request count rate.Available only in 5.7 and laterreleases.
CIQ MetricsThese metrics are available only in 5.7 and later releases.
Table 6-21. CIQ Metrics for the Web Server Component
Metric Key Metric Name Description
ciq | CiqPreCompTime Pre Computation Time (ms) Time spent precomputing metrics inCIQ during the last collectioninterval.
ciq | CiqSingleVaueMetricCompTime Single Value MetricComputation Time (ms)
Time spent computing single-valuemetrics during the last collectioninterval.
Garbage Collector MetricsThese metrics are available only in 5.7 and later releases.
Table 6-22. Garbage Collector Metrics for the Web Server Component
Metric Key Metric Name Description
garbageCollector | collectionCount Garbage Collector Garbage collection count during thelast collection interval.
garbageCollector | collectionTime Collection Time (ms) Time spent in garbage collectionduring the last collection interval.
Chapter 6 Metrics for vCenter Operations Manager Components
VMware, Inc. 73
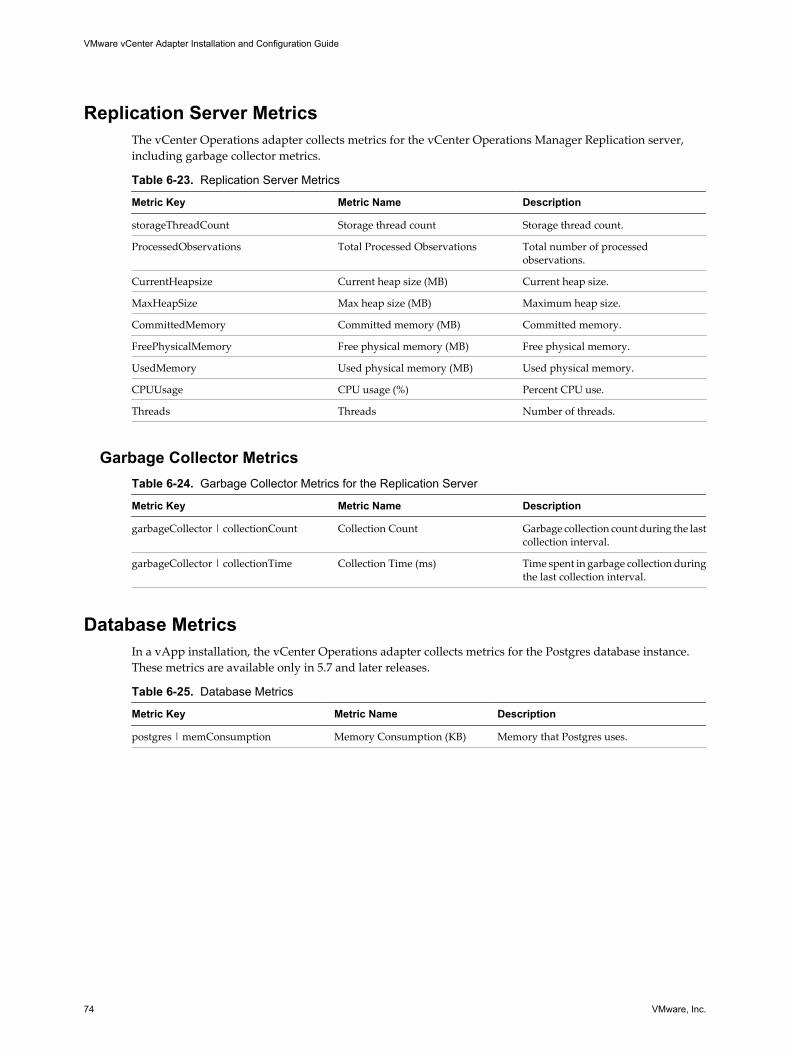
Replication Server MetricsThe vCenter Operations adapter collects metrics for the vCenter Operations Manager Replication server,including garbage collector metrics.
Table 6-23. Replication Server Metrics
Metric Key Metric Name Description
storageThreadCount Storage thread count Storage thread count.
ProcessedObservations Total Processed Observations Total number of processedobservations.
CurrentHeapsize Current heap size (MB) Current heap size.
MaxHeapSize Max heap size (MB) Maximum heap size.
CommittedMemory Committed memory (MB) Committed memory.
FreePhysicalMemory Free physical memory (MB) Free physical memory.
UsedMemory Used physical memory (MB) Used physical memory.
CPUUsage CPU usage (%) Percent CPU use.
Threads Threads Number of threads.
Garbage Collector MetricsTable 6-24. Garbage Collector Metrics for the Replication Server
Metric Key Metric Name Description
garbageCollector | collectionCount Collection Count Garbage collection count during the lastcollection interval.
garbageCollector | collectionTime Collection Time (ms) Time spent in garbage collection duringthe last collection interval.
Database MetricsIn a vApp installation, the vCenter Operations adapter collects metrics for the Postgres database instance.These metrics are available only in 5.7 and later releases.
Table 6-25. Database Metrics
Metric Key Metric Name Description
postgres | memConsumption Memory Consumption (KB) Memory that Postgres uses.
VMware vCenter Adapter Installation and Configuration Guide
74 VMware, Inc.
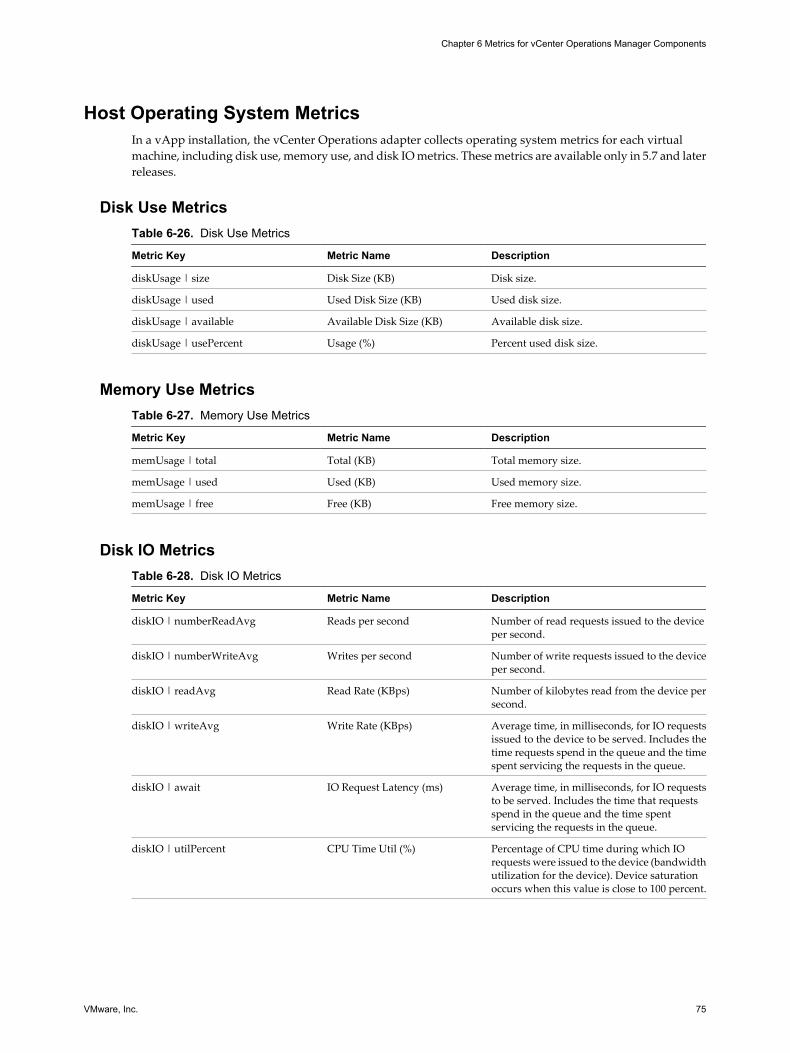
Host Operating System MetricsIn a vApp installation, the vCenter Operations adapter collects operating system metrics for each virtualmachine, including disk use, memory use, and disk IO metrics. These metrics are available only in 5.7 and laterreleases.
Disk Use MetricsTable 6-26. Disk Use Metrics
Metric Key Metric Name Description
diskUsage | size Disk Size (KB) Disk size.
diskUsage | used Used Disk Size (KB) Used disk size.
diskUsage | available Available Disk Size (KB) Available disk size.
diskUsage | usePercent Usage (%) Percent used disk size.
Memory Use MetricsTable 6-27. Memory Use Metrics
Metric Key Metric Name Description
memUsage | total Total (KB) Total memory size.
memUsage | used Used (KB) Used memory size.
memUsage | free Free (KB) Free memory size.
Disk IO MetricsTable 6-28. Disk IO Metrics
Metric Key Metric Name Description
diskIO | numberReadAvg Reads per second Number of read requests issued to the deviceper second.
diskIO | numberWriteAvg Writes per second Number of write requests issued to the deviceper second.
diskIO | readAvg Read Rate (KBps) Number of kilobytes read from the device persecond.
diskIO | writeAvg Write Rate (KBps) Average time, in milliseconds, for IO requestsissued to the device to be served. Includes thetime requests spend in the queue and the timespent servicing the requests in the queue.
diskIO | await IO Request Latency (ms) Average time, in milliseconds, for IO requeststo be served. Includes the time that requestsspend in the queue and the time spentservicing the requests in the queue.
diskIO | utilPercent CPU Time Util (%) Percentage of CPU time during which IOrequests were issued to the device (bandwidthutilization for the device). Device saturationoccurs when this value is close to 100 percent.
Chapter 6 Metrics for vCenter Operations Manager Components
VMware, Inc. 75

VMware vCenter Adapter Installation and Configuration Guide
76 VMware, Inc.
Index
AActiveMQ metrics 71adapter instances 20analytics metrics 65audience information 5auto-discovery 9
Bbadge metrics 63Balanced profile 20
Ccapacity planning metrics 59Cluster Compute Resource metrics 30collection states 22collection status values 23Collector metrics 70configuration steps 19credentials 19
Ddata collection 9Datacenter resource metrics 28Datastore metrics 55
Hhost operating system metrics 75Host System metrics 37
Iinstalling the adapter 15, 16introduction 9
Llog files 23
Mmanual discovery 9metrics 25metrics profiles 20
PPostgres database metrics 74
Rreducing metrics collected 20Replication server metrics 74requirements 10resource identifiers 11Resource Pool metrics 35
Sself-monitoring metrics 65
Ttroubleshooting steps 21
Uupdated information 7
VvCenter Operations Manager metrics 65vCenter Server metrics 25vcenter_adapter3 folder 16viewing collection information 21Virtual Machine metrics 48VM Entity status tag 10
WWeb server metrics 72
VMware, Inc. 77

VMware vCenter Adapter Installation and Configuration Guide
78 VMware, Inc.