
VBP Bootcamp Series Session 2 · VBP Bootcamp Series . Session 2. Region 3: New York City (Bronx,...
135
VBP Bootcamp Series Session 2 Region 3: New York City (Bronx, Brooklyn, Manhattan, Staten Island) August 2016
Transcript of VBP Bootcamp Series Session 2 · VBP Bootcamp Series . Session 2. Region 3: New York City (Bronx,...

VBP Bootcamp Series Session 2
Region 3: New York City (Bronx, Brooklyn, Manhattan, Staten Island)
August 2016

2
Welcome
Anesa Brkanovic, DirectorBureau of Managed Care Fiscal OversightDivision of Health Plan Contracting & Oversight (OHIP)
Susan Bentley, DirectorBureau of Managed Care Certifications & Surveillance Division of Health Plan Contracting & Oversight (OHIP)
August 2016
3
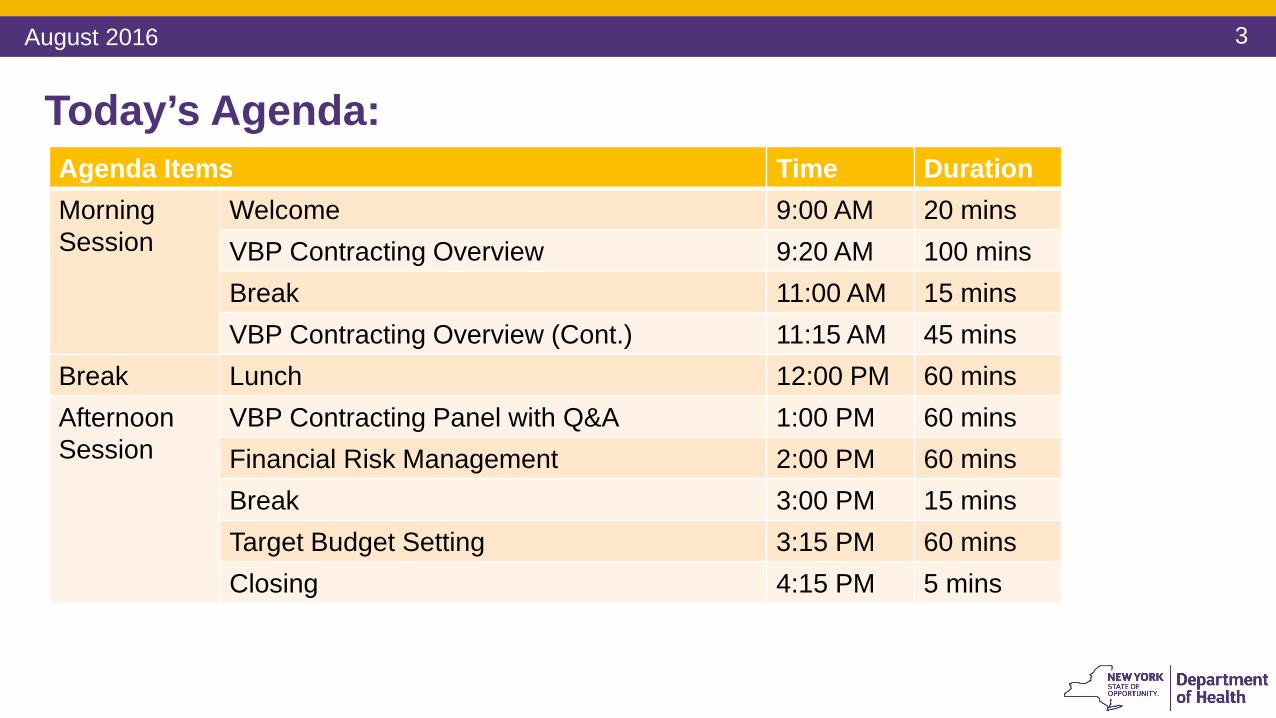
Agenda Items Time DurationMorning Session
Welcome 9:00 AM 20 minsVBP Contracting Overview 9:20 AM 100 minsBreak 11:00 AM 15 minsVBP Contracting Overview (Cont.) 11:15 AM 45 mins
Break Lunch 12:00 PM 60 minsAfternoon Session
VBP Contracting Panel with Q&A 1:00 PM 60 minsFinancial Risk Management 2:00 PM 60 minsBreak 3:00 PM 15 minsTarget Budget Setting 3:15 PM 60 minsClosing 4:15 PM 5 mins
Today’s Agenda:
August 2016

4
VBP Bootcamp Session 1 Summary
August 2016
5
What are VBP Bootcamps? • This learning series will provide foundational knowledge about Value-Based Payment (VBP)
structure and prepare you for VBP implementation • Bootcamps will be held in 5 regions across NYS between June and October of 2016
• Each Bootcamp will consist of 3 all-day sessions held approximately one month apart in a centralized location
• You are highly encouraged to attend all 3 sessions• If unable to attend a session in your region, you may register for sessions in other regions.
Also, webcast recordings are going to be available in the VBP Library• The content of sessions are applicable statewide
• Networking is highly encouraged, so please bring appropriate staff to extract the most value out of these sessions. These will include: business and clinical leadership, contracting staff, finance staff, IT staff, etc.
August 2016

6
VBP Bootcamp Regions
Region 1: Capital Region, Southern Tier, Mid-Hudson
Region 2: Mohawk Valley, North Country, Tug Hill Seaway
Region 3: New York City (excluding Queens)
Region 4: Central NY, Finger Lakes, Western NY
Region 5: Long Island and Queens
August 2016
7
Explore the VBP Bootcamp Website
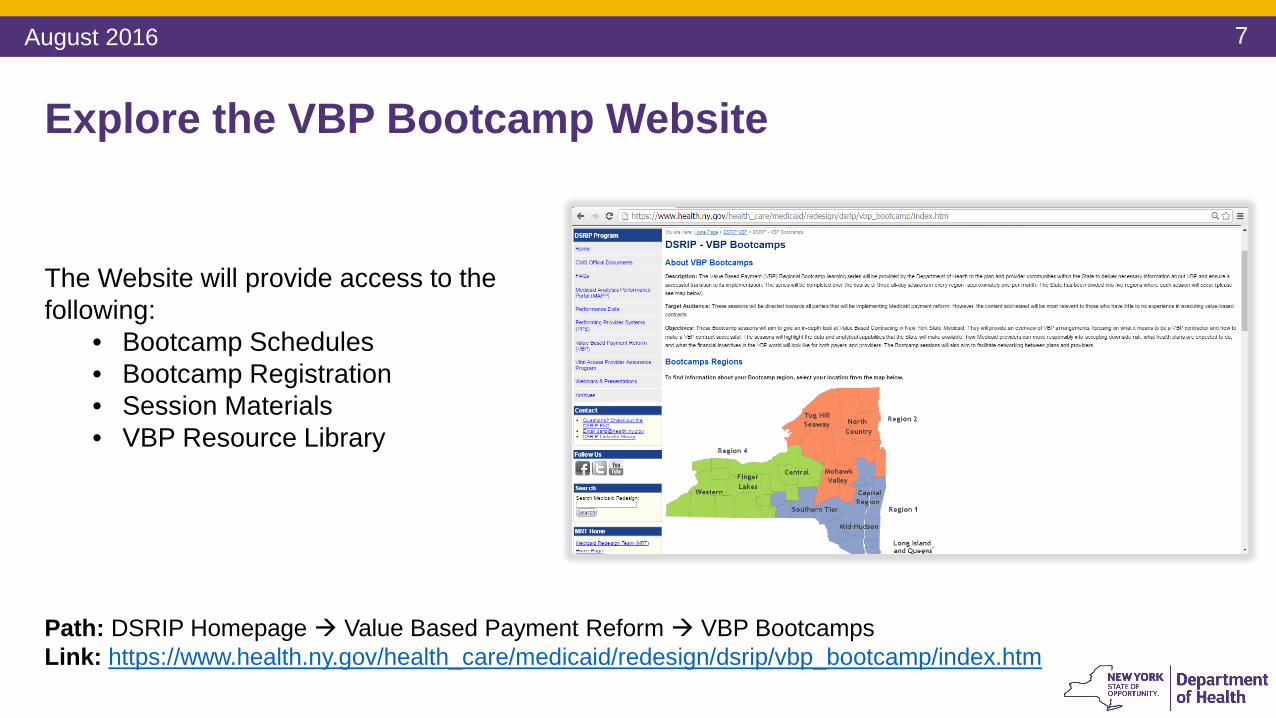
The Website will provide access to the following:
• Bootcamp Schedules • Bootcamp Registration • Session Materials• VBP Resource Library
Path: DSRIP Homepage Value Based Payment Reform VBP BootcampsLink: https://www.health.ny.gov/health_care/medicaid/redesign/dsrip/vbp_bootcamp/index.htm
August 2016
8
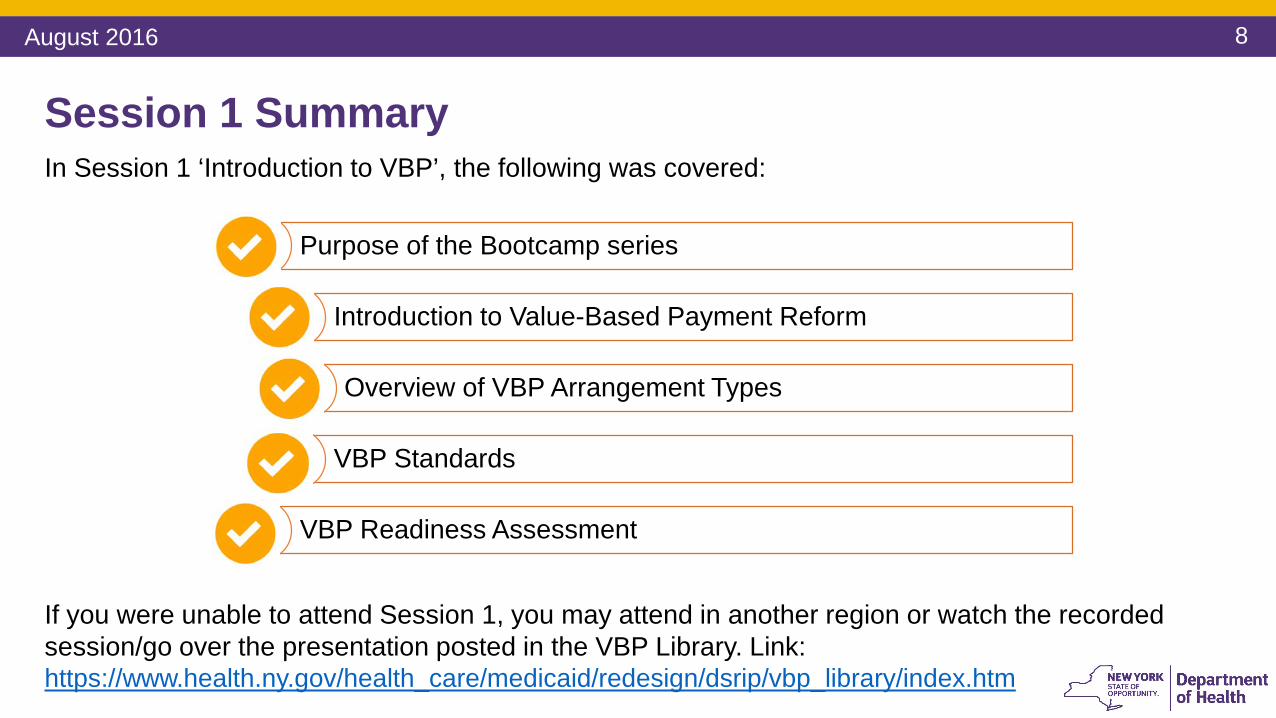
Session 1 SummaryIn Session 1 ‘Introduction to VBP’, the following was covered:
If you were unable to attend Session 1, you may attend in another region or watch the recorded session/go over the presentation posted in the VBP Library. Link: https://www.health.ny.gov/health_care/medicaid/redesign/dsrip/vbp_library/index.htm
Purpose of the Bootcamp series
Introduction to Value-Based Payment Reform
Overview of VBP Arrangement Types
VBP Standards
VBP Readiness Assessment
August 2016
9
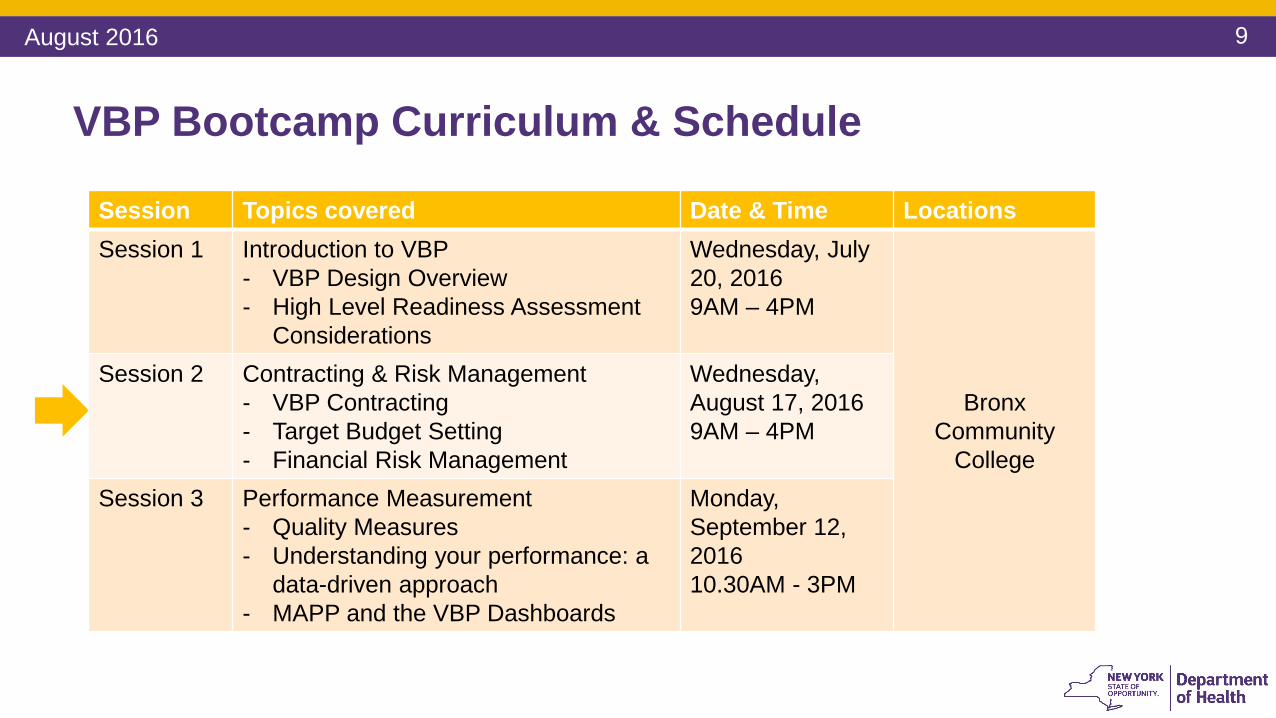
VBP Bootcamp Curriculum & Schedule
August 2016
Session Topics covered Date & Time LocationsSession 1 Introduction to VBP
- VBP Design Overview- High Level Readiness Assessment
Considerations
Wednesday, July 20, 20169AM – 4PM
Bronx Community
College
Session 2 Contracting & Risk Management - VBP Contracting- Target Budget Setting- Financial Risk Management
Wednesday, August 17, 2016 9AM – 4PM
Session 3 Performance Measurement- Quality Measures- Understanding your performance: a
data-driven approach- MAPP and the VBP Dashboards
Monday, September 12, 201610.30AM - 3PM
10
Network, network, network!
August 2016

11
VBP Contracting Overview
August 2016
12
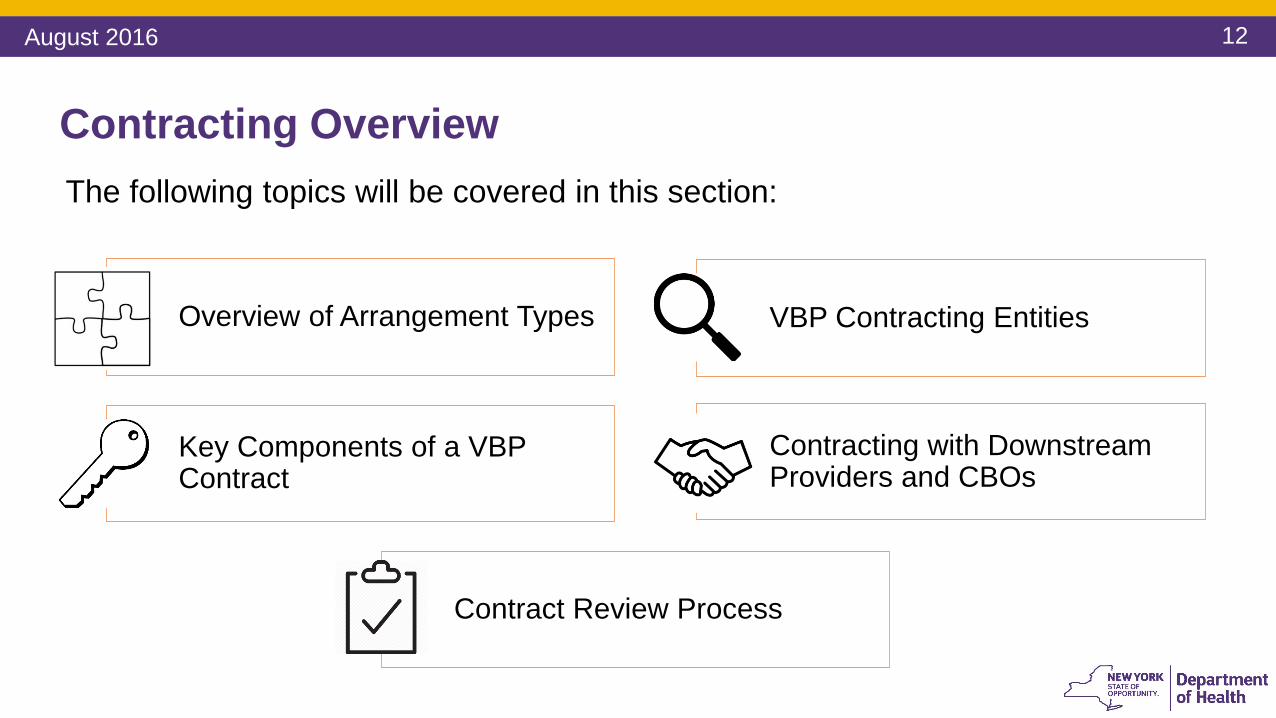
Contracting OverviewThe following topics will be covered in this section:
Overview of Arrangement Types VBP Contracting Entities
Key Components of a VBP Contract
Contracting with Downstream Providers and CBOs
Contract Review Process
August 2016
13
Types of VBP Arrangements
August 2016
14
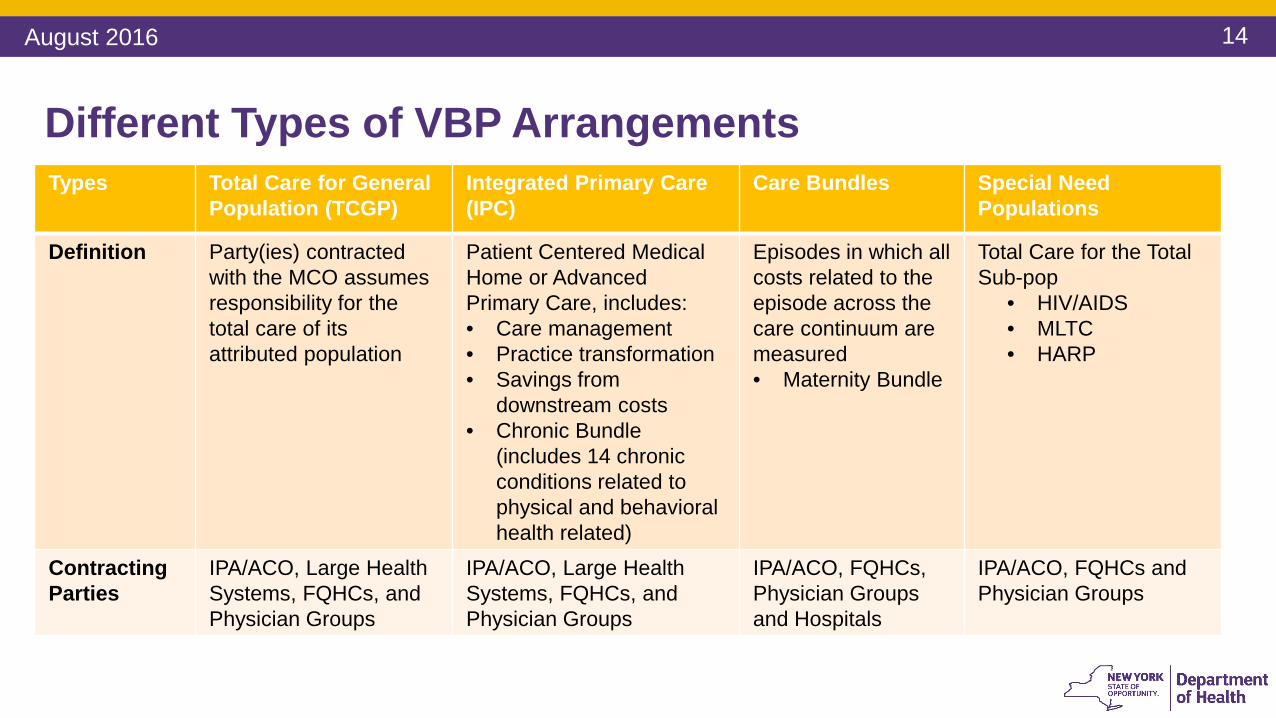
Different Types of VBP Arrangements Types Total Care for General
Population (TCGP)Integrated Primary Care (IPC)
Care Bundles Special Need Populations
Definition Party(ies) contracted with the MCO assumes responsibility for the total care of its attributed population
Patient Centered Medical Home or Advanced Primary Care, includes:• Care management• Practice transformation • Savings from
downstream costs • Chronic Bundle
(includes 14 chronic conditions related to physical and behavioral health related)
Episodes in which all costs related to the episode across the care continuum are measured • Maternity Bundle
Total Care for the Total Sub-pop
• HIV/AIDS• MLTC• HARP
Contracting Parties
IPA/ACO, Large HealthSystems, FQHCs, and Physician Groups
IPA/ACO, Large HealthSystems, FQHCs, and Physician Groups
IPA/ACO, FQHCs, Physician Groups and Hospitals
IPA/ACO, FQHCs and Physician Groups
August 2016
15
Contracting Entities/VBP Contractors
August 2016

16
Contracting Entities/VBP Contractors 1. Independent Practice Associations (IPA) 2. Accountable Care Organizations (ACO)3. Individual Providers
• Hospital Systems• FQHCs and large medical groups • Smaller providers including community based organizations (CBOs)
1. Individual provider could either assume all responsibility and upside/downside risk or make arrangements with other providers; or
2. MCOs may want to create a VBP arrangement through individual contracts with these providers
August 2016
17
VBP Contractors: Independent Practice Association• An Independent Practice Association is a corporation (nonprofit or for-profit)
and/or LLC that contracts directly with providers of medical or medically related services, or another IPA in order to contract with one or more MCOs to make the services of such providers available to the enrollees of an MCO.
• Who negotiates the IPA contract? • What is the governance of the IPA? • Who should the individual provider look to if there are questions and/or
concerns?
August 2016

18
VBP Contractors: Independent Practice Association • IPAs facilitate network development and access
• Single signature authority• Typically for a category of services amongst competing providers
(could be with providers across the care continuum)• Allows providers to maintain independence regarding governance and
clinical decision-making• IPAs are not unions or guilds
• Antitrust concerns related to collective negotiation• To avoid antitrust concerns, IPAs are usually entities that share risk or are
clinically integrated• IPAs can provide administrative services to providers who participate in
the IPA and/or management services to MCOs
August 2016
19
VBP Contractors: Accountable Care Organization
• An Accountable Care Organization is an organization of clinically integrated health care providers that work together to provide, manage, and coordinate health care (including primary care) for a defined population; with a mechanism for shared governance; the ability to negotiate, receive, and distribute payments; and accountability for the quality, cost, and delivery of health care to the ACO’s patients
• Medicare-only ACO (approved by CMS) for Medicare population• Medicare ACO does not make you a Medicaid ACO and vice versa*• IPAs may be certified by DOH as an ACO
*There is an expedited approval process for Medicare ACOs to become Medicaid ACOs.
August 2016

20
Where Do You Fit in the Structure of a VBP Arrangement:Total Care for General PopulationFlow of Funds
DOH
MCO
IPA/ACO
Hospitals Physicians FQHCs BH Providers Pharmacies CBOs Ancillary
Providers
August 2016
21
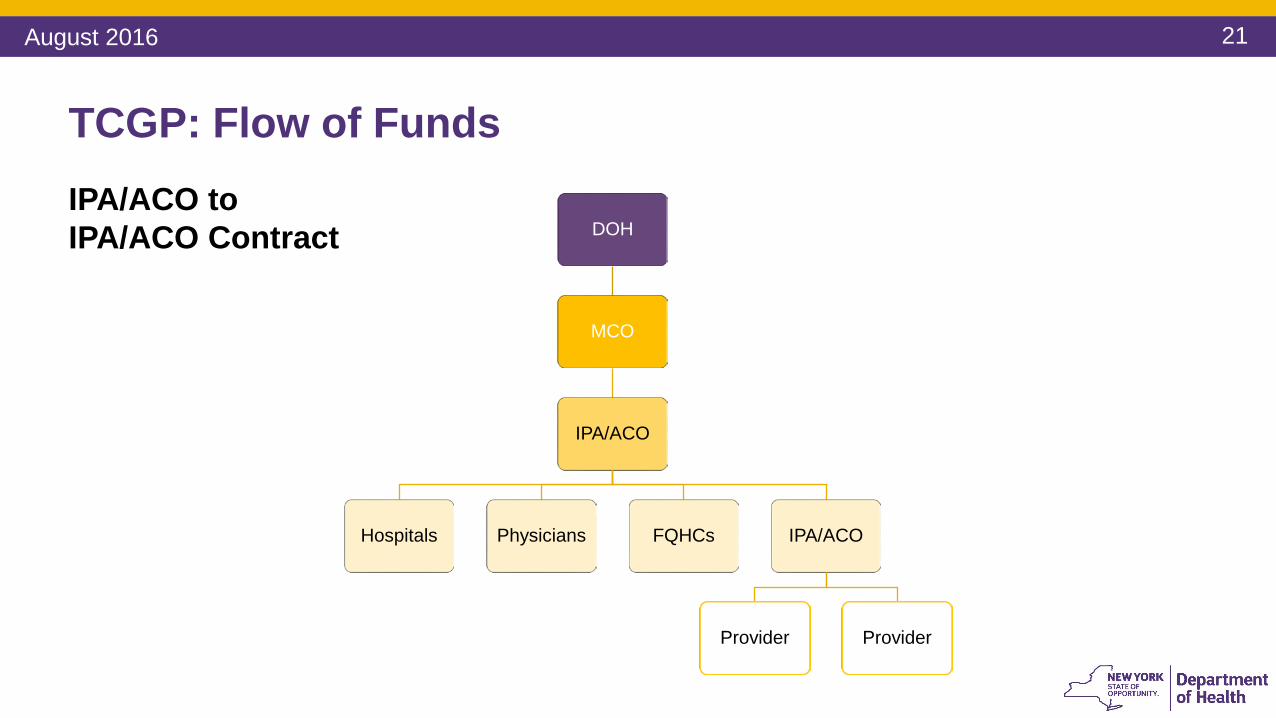
TCGP: Flow of FundsIPA/ACO to IPA/ACO Contract DOH
MCO
IPA/ACO
Hospitals Physicians FQHCs IPA/ACO
Provider Provider
August 2016

22
Where Do You Fit in the Structure of a VBP Arrangement:Total Care for a SubpopulationFlow of Funds
DOH
MCO
FQHC IPA/ACO
BH Provider Physicians Hospitals HCBS Provider CBOs
Physician Group
August 2016

23
Where Do You Fit in the Structure of a VBP Arrangement:Integrated Primary Care (IPC)Flow of Funds
DOH
MCO
FQHCs
DOH
MCO
Physician Groups
DOH
MCO
Hospital
August 2016

24
DOH
MCO
IPA/ACO
Hospital System
Physician
IPA/ACO
Hospital Physician
FQHCs
Hospital
Physician Group
Hospital
Where Do You Fit in the Structure of a VBP Arrangement:Maternity Care BundleFlow of Funds
August 2016

25
Components of a VBP Contract
August 2016
26
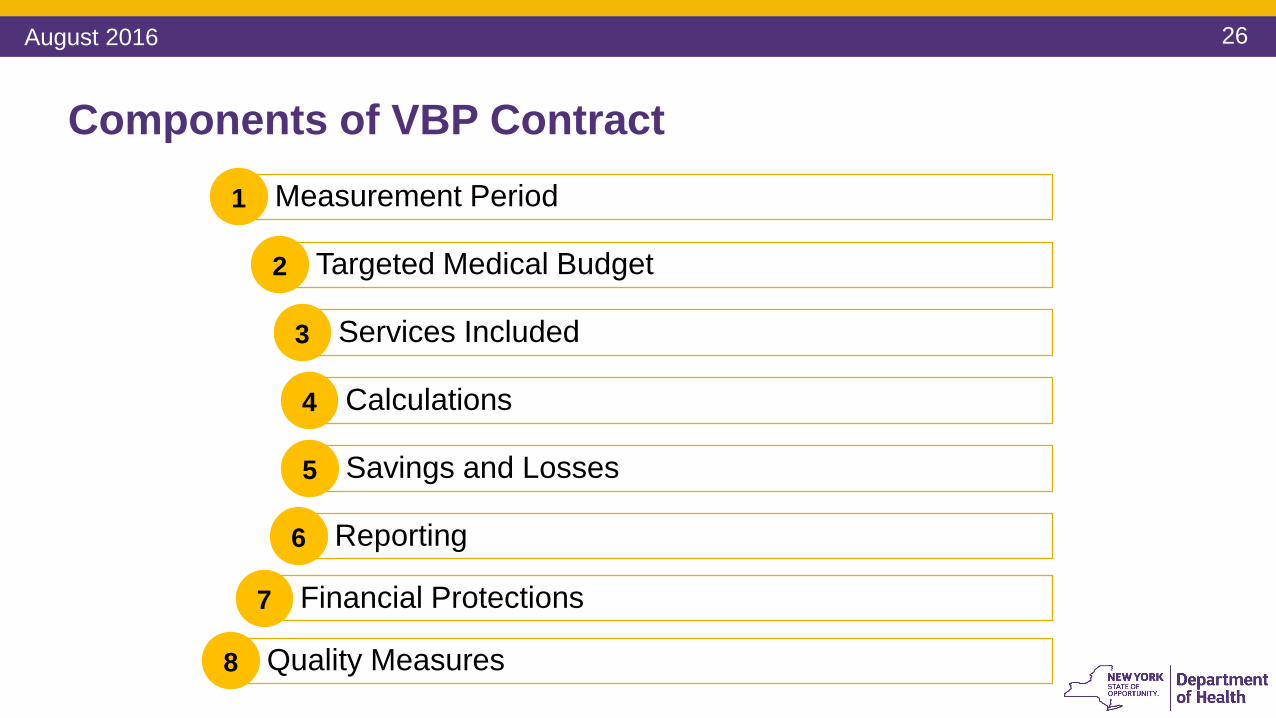
Components of VBP Contract Measurement Period1
Targeted Medical Budget2
Services Included 3
Calculations4
Savings and Losses5
Reporting 6
Financial Protections7
Quality Measures 8
August 2016

27
Components of a VBP Contract
1. Measurement Period• Annual
2. Targeted Medical Budget• Percentage of Premium• Set dollar amount• Medical Loss Ratio• Risk Adjustment
3. Services Included
August 2016
28
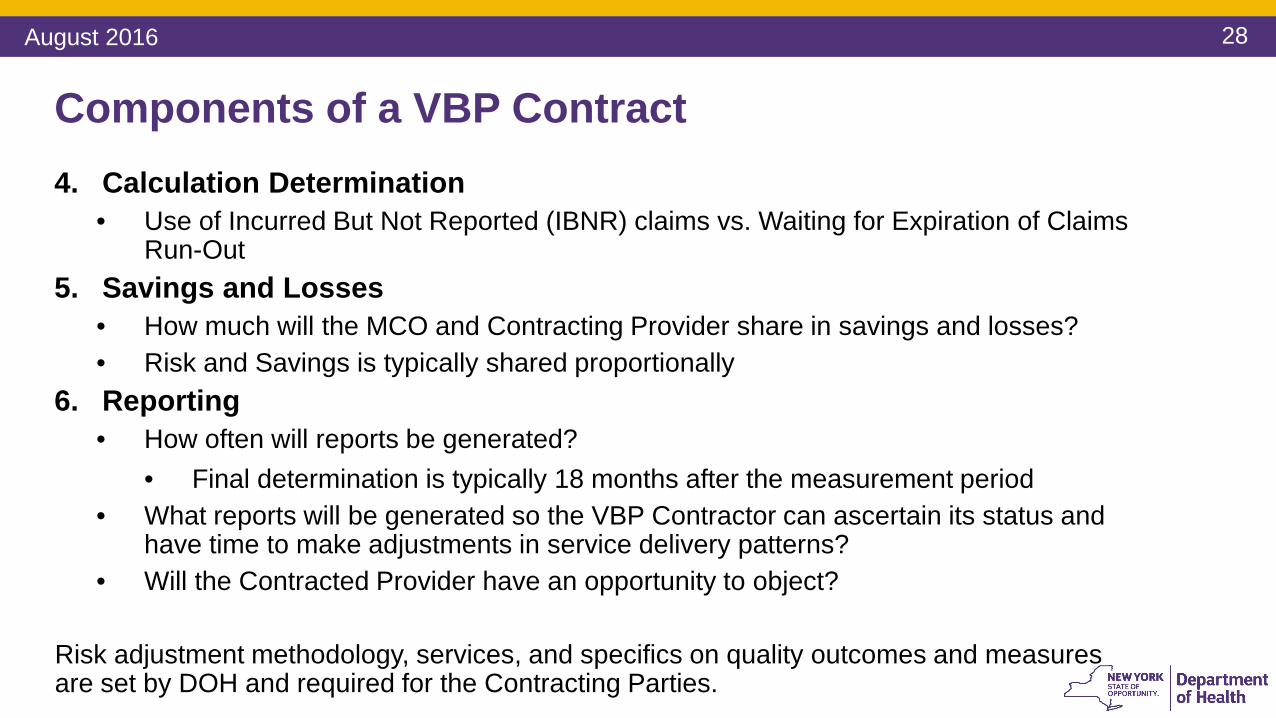
Components of a VBP Contract 4. Calculation Determination
• Use of Incurred But Not Reported (IBNR) claims vs. Waiting for Expiration of Claims Run-Out
5. Savings and Losses • How much will the MCO and Contracting Provider share in savings and losses?• Risk and Savings is typically shared proportionally
6. Reporting • How often will reports be generated?
• Final determination is typically 18 months after the measurement period• What reports will be generated so the VBP Contractor can ascertain its status and
have time to make adjustments in service delivery patterns?• Will the Contracted Provider have an opportunity to object?
Risk adjustment methodology, services, and specifics on quality outcomes and measures are set by DOH and required for the Contracting Parties.
August 2016

29
Components of a VBP Contract 7. Financial Protections
• Letter of Credit• Reserve Fund• Stop Loss• Certified Financials
8. Quality Measures• Reports• Submission of data• Payment
August 2016
30
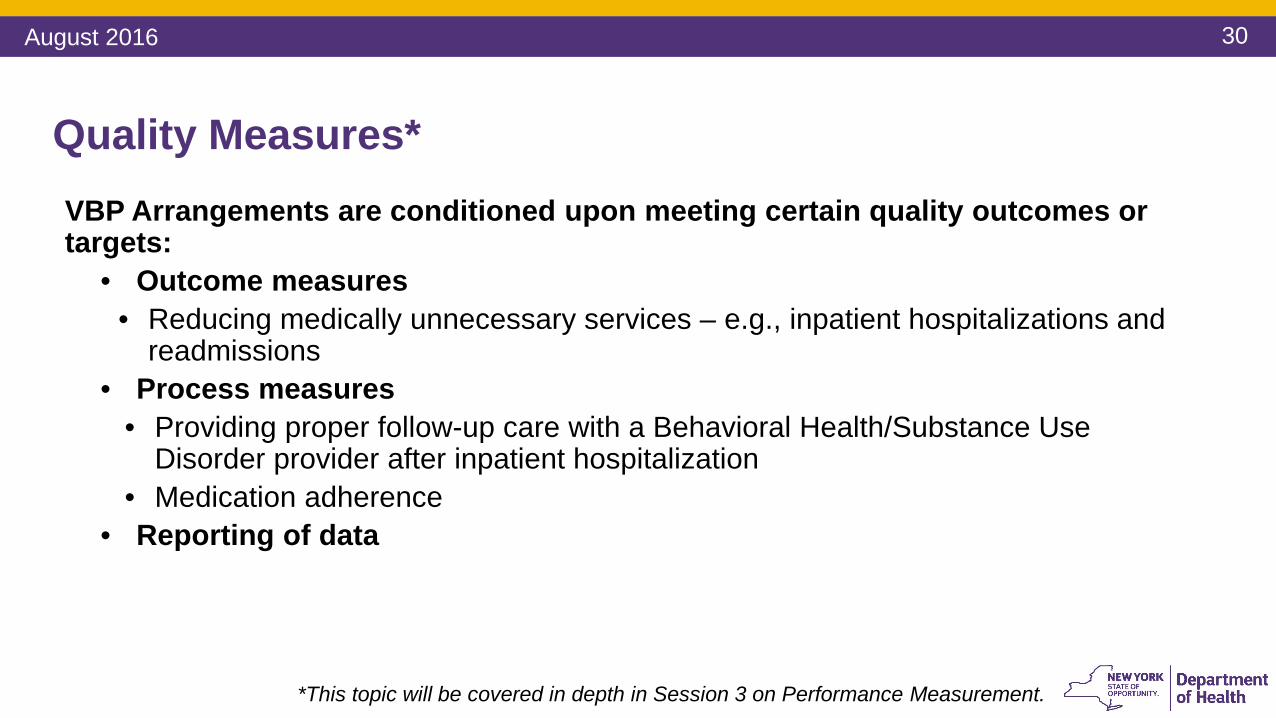
Quality Measures*VBP Arrangements are conditioned upon meeting certain quality outcomes or targets:
• Outcome measures• Reducing medically unnecessary services – e.g., inpatient hospitalizations and
readmissions• Process measures
• Providing proper follow-up care with a Behavioral Health/Substance Use Disorder provider after inpatient hospitalization
• Medication adherence • Reporting of data
*This topic will be covered in depth in Session 3 on Performance Measurement.
August 2016
31
Negotiable Items
• Attribution • Target Budget• Shared savings and losses• Reconciliation Time Periods• Financial Protections
August 2016

32
Questions
August 2016

33
Contracting with Downstream Providers
August 2016
34
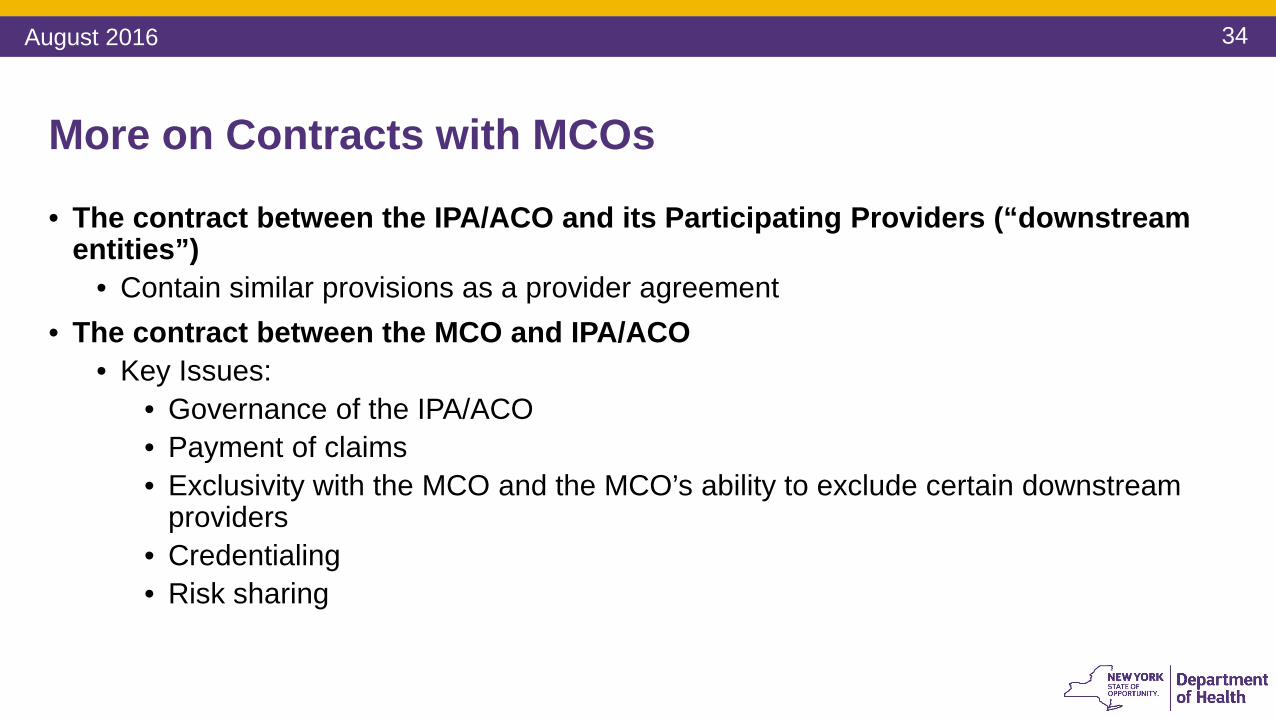
More on Contracts with MCOs
• The contract between the IPA/ACO and its Participating Providers (“downstream entities”)
• Contain similar provisions as a provider agreement • The contract between the MCO and IPA/ACO
• Key Issues: • Governance of the IPA/ACO• Payment of claims• Exclusivity with the MCO and the MCO’s ability to exclude certain downstream
providers• Credentialing• Risk sharing
August 2016

35
Typical Provider Contract Terms 1. Parties and Definitions2. Scope of Services and Access to Services3. Payment Adjustments 4. MCO Administrative Requirements (i.e. timely filing) 5. Insurance 6. Indemnification and Liability7. Compliance with all laws and Medicaid Model Contract8. Term and Termination 9. Representations and Warranties10.Amendment 11.Assignment 12.Notices to MCO13.Dispute resolution or litigation14.Audits, monitoring and oversight
August 2016
36
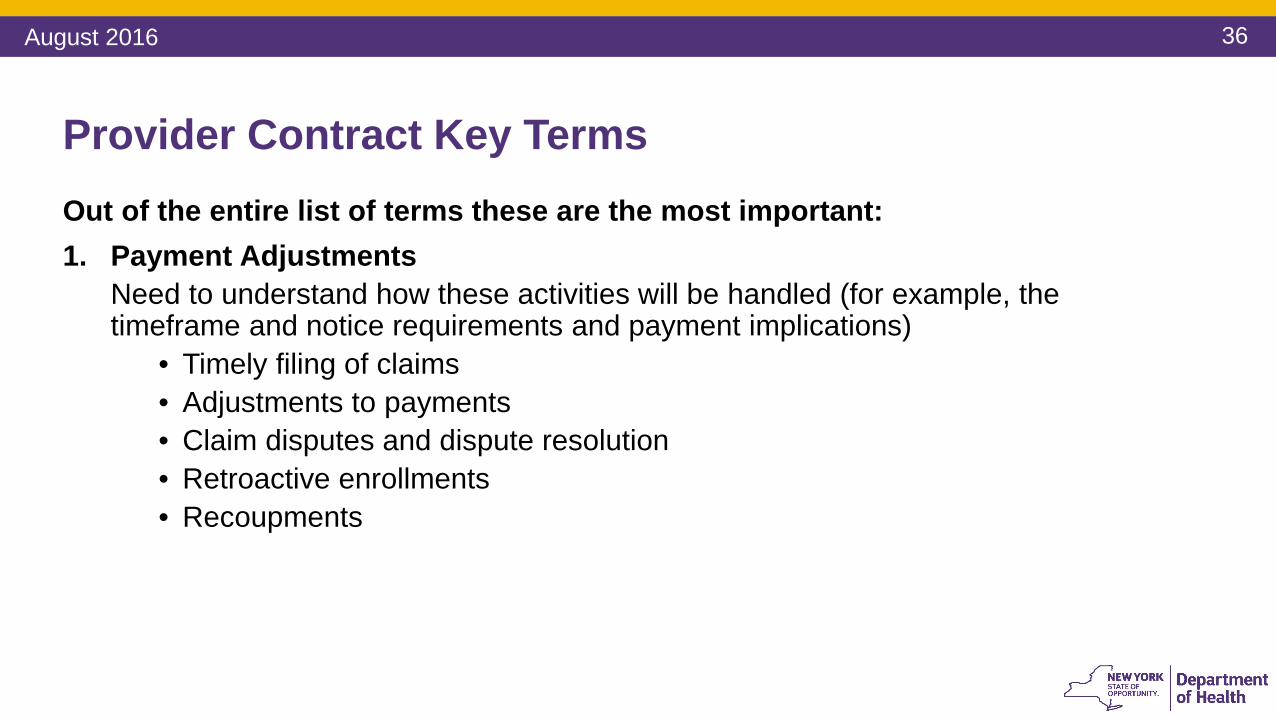
Out of the entire list of terms these are the most important: 1. Payment Adjustments
Need to understand how these activities will be handled (for example, the timeframe and notice requirements and payment implications)
• Timely filing of claims • Adjustments to payments • Claim disputes and dispute resolution • Retroactive enrollments• Recoupments
Provider Contract Key Terms
August 2016
37
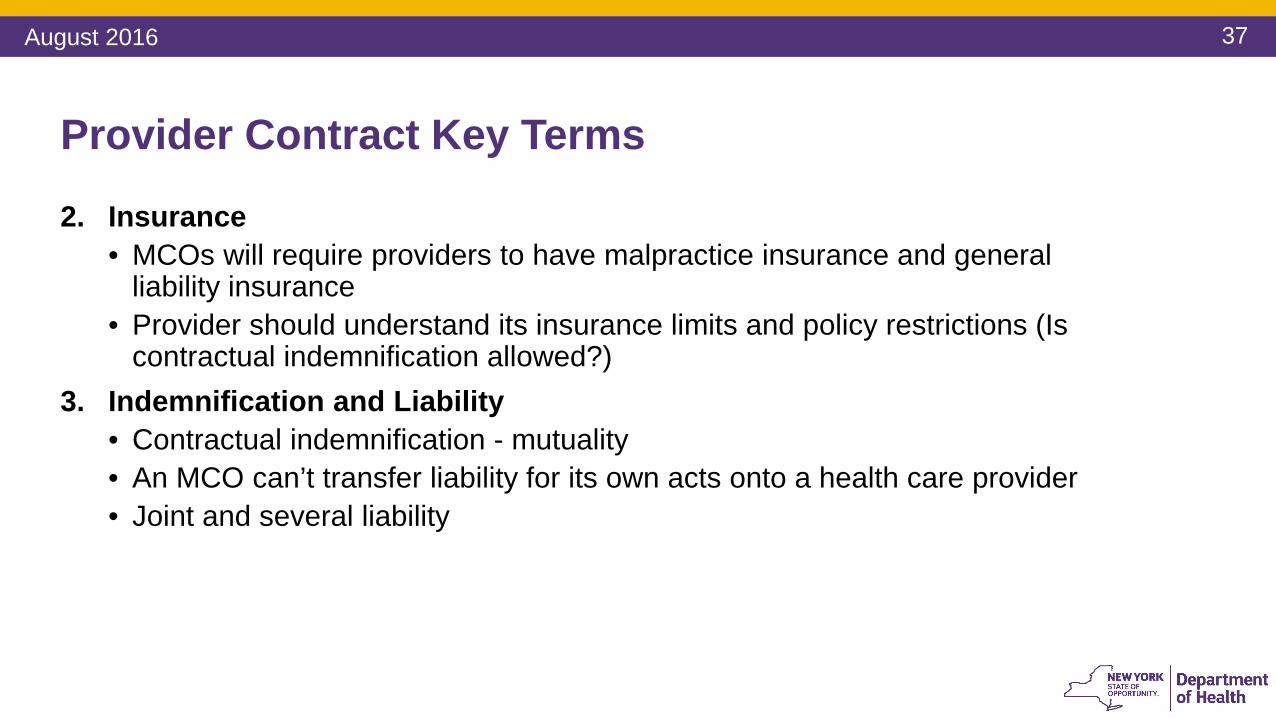
2. Insurance • MCOs will require providers to have malpractice insurance and general
liability insurance• Provider should understand its insurance limits and policy restrictions (Is
contractual indemnification allowed?)3. Indemnification and Liability
• Contractual indemnification - mutuality• An MCO can’t transfer liability for its own acts onto a health care provider • Joint and several liability
Provider Contract Key Terms
August 2016

38
4. Term and Termination • Automatic renewal or defined contract term• “For cause” versus “without cause” termination
• Standard for material breach• Length of notice for termination and non-renewal • Due process rights
5. Representations and Warranties• Valid corporation and properly licensed, certified or designated by DOH, OMH
or OASAS (licensure obligations can also apply to employees of the provider)• Legally binding and enforceable• Neither provider nor employees have been suspended or terminated from a
federal health care program or convicted of a criminal offense related to Medicaid or Medicare
Provider Contract Key Terms
August 2016
39
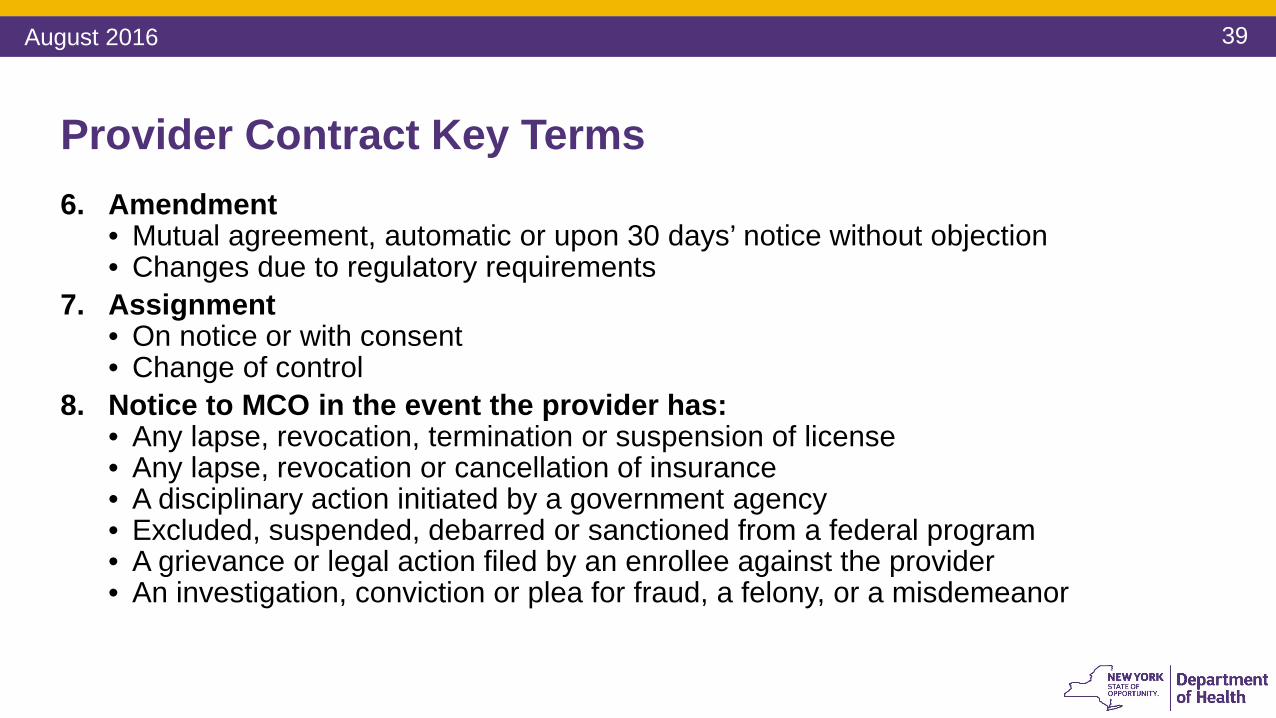
6. Amendment• Mutual agreement, automatic or upon 30 days’ notice without objection • Changes due to regulatory requirements
7. Assignment • On notice or with consent• Change of control
8. Notice to MCO in the event the provider has:• Any lapse, revocation, termination or suspension of license• Any lapse, revocation or cancellation of insurance• A disciplinary action initiated by a government agency • Excluded, suspended, debarred or sanctioned from a federal program • A grievance or legal action filed by an enrollee against the provider • An investigation, conviction or plea for fraud, a felony, or a misdemeanor
Provider Contract Key Terms
August 2016

40
9. Dispute Resolution / Litigation• Claim disputes vs. other disputes• Venue and choice of law• Internal dispute resolution mechanism
• Timeframe for resolution• Identify key management titles with the authority to resolve disputes
• Alternative dispute resolution or mediation• Binding or non-binding• American Arbitration Association, American Health Lawyers Association, etc.
10. MCO’s right to monitor and audit its participating providers
Provider Contract Key Terms
August 2016
41
Provider Contract Key Terms
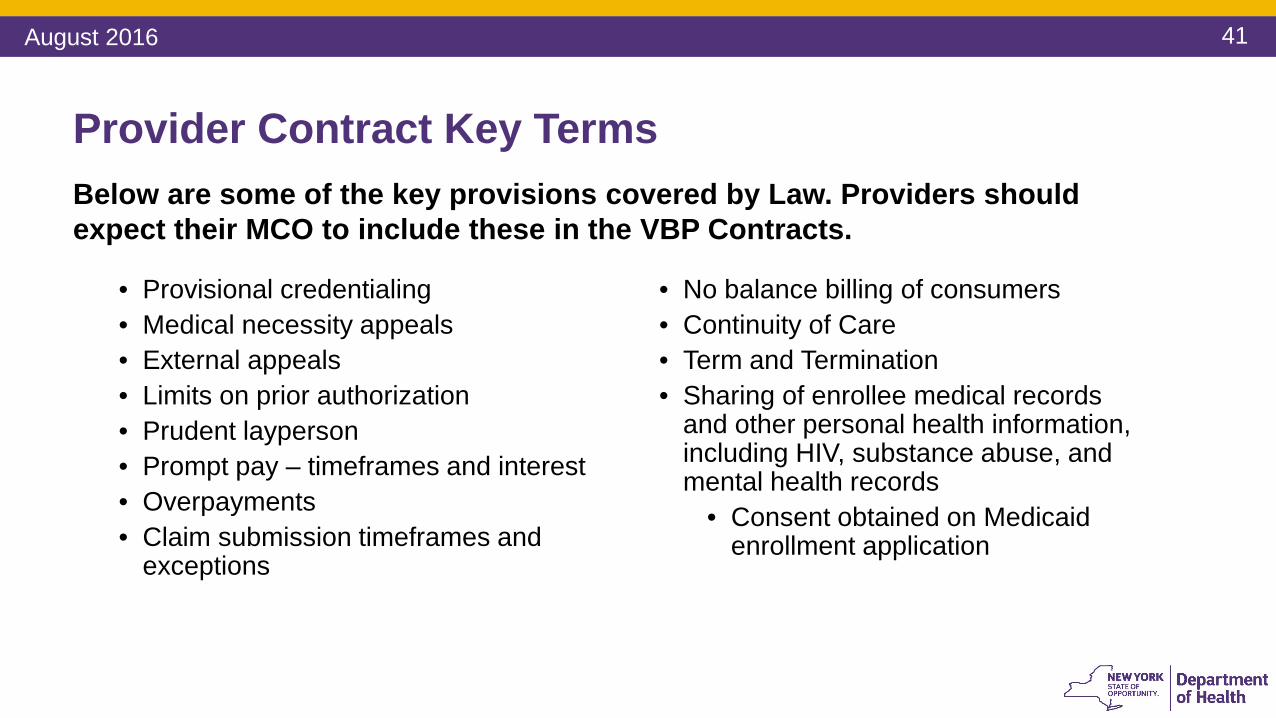
• Provisional credentialing• Medical necessity appeals• External appeals • Limits on prior authorization • Prudent layperson • Prompt pay – timeframes and interest • Overpayments• Claim submission timeframes and
exceptions
Below are some of the key provisions covered by Law. Providers should expect their MCO to include these in the VBP Contracts.
• No balance billing of consumers• Continuity of Care • Term and Termination • Sharing of enrollee medical records
and other personal health information, including HIV, substance abuse, and mental health records
• Consent obtained on Medicaid enrollment application
August 2016

42
Reminder: Contracting with CBOs
Standard Summary*Every Level 2 or 3 VBP arrangement will include a minimum of one Tier 1 CBO (non-profit, non-Medicaid billing, community-based social and human service organization) starting January 2018. The State will, however, make financial incentives available immediately for plans and providers who contract with Tier 1 CBOs.**
*Please refer to the Master Subcommittee Recommendation Report to review the complete language of this Standard recommendation. Link: https://www.health.ny.gov/health_care/medicaid/redesign/dsrip/2016/docs/2016-feb_sub_comm_recommend_rpt_consol.pdf**Note: The State recognizes that CBOs may not exist within a reasonable distance to providers in some regions of New York. In such situations, providers/provider networks can apply to the State for a rural exemption.
The SDH & CBO Subcommittee put forth several additional recommendations focusing on CBO involvement in VBP networks and the integration of SDH interventions into clinical care. While the recommendations are not requirements, contract language could include details on the intentions of the provider network and MCO regarding these initiatives.
August 2016

43
Questions
August 2016

44
Break – 15 mins
August 2016
45
VBP Contract Review Process
August 2016

46
Contract Review Process Moves from 5 to 3 TiersThe existing five contract review levels per the existing Provider Contract Guidelines have been collapsed into three tiers.
Tier 1
• The File and Use Tier includes all VBP Level 1 arrangements (upside only arrangements) and all other arrangements that do not meet the minimum review thresholds for DOH Review (Tier 2) or Multi-Agency Review (Tier 3).
Tier 2
• The DOH Review Tier includes VBP Level 2, VBP Level 3, and all other arrangements that do not trigger Regulation 164, but contain over $1,000,000 of potential payments at risk AND ANY of the following factors listed on Slide 29.
Tier 3
• The Multi-Agency Review Tier includes all contractual arrangements which trigger Regulation 164.
Note: Regardless of which Tier a particular agreement falls in, the financial and/or programmatic reviews referenced here only apply from the State’s perspective to assess financial and programmatic risks to the Medicaid program. The State is not providing legal advice to either plans or providers nor is the State determining whether the contractual arrangement is a fair business deal between the parties.
August 2016
47
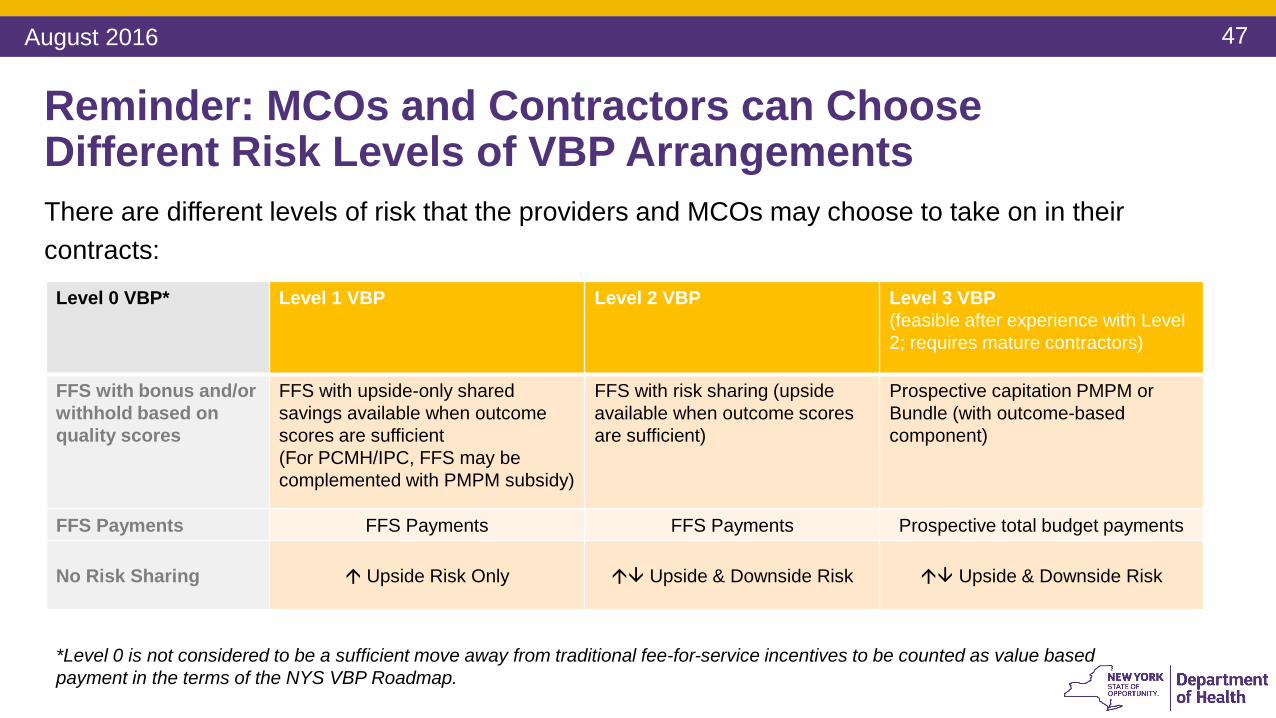
Reminder: MCOs and Contractors can Choose Different Risk Levels of VBP ArrangementsThere are different levels of risk that the providers and MCOs may choose to take on in their contracts:
Level 0 VBP* Level 1 VBP Level 2 VBP Level 3 VBP (feasible after experience with Level 2; requires mature contractors)
FFS with bonus and/or withhold based on quality scores
FFS with upside-only shared savings available when outcome scores are sufficient(For PCMH/IPC, FFS may be complemented with PMPM subsidy)
FFS with risk sharing (upside available when outcome scores are sufficient)
Prospective capitation PMPM or Bundle (with outcome-based component)
FFS Payments FFS Payments FFS Payments Prospective total budget payments
No Risk Sharing Upside Risk Only Upside & Downside Risk Upside & Downside Risk
*Level 0 is not considered to be a sufficient move away from traditional fee-for-service incentives to be counted as value based payment in the terms of the NYS VBP Roadmap.
August 2016
48
DFS Regulation 164: Background
• An insurer or MCO has a contractual obligation to provide coverage to its subscribers.
• Regulation 164 allows (1) the insurer/MCO to transfer its financial risk (but not its contractual obligations) to a health care provider, and (2) the insurer/MCO to reduce its corresponding claims liabilities.
• Regulation 164 only applies to pre-paid, full capitation payments.
• The agreement must be approved by DFS.
• The insurer/MCO must demonstrate to DFS the “financial responsibility” of the health care provider.
August 2016
49
No
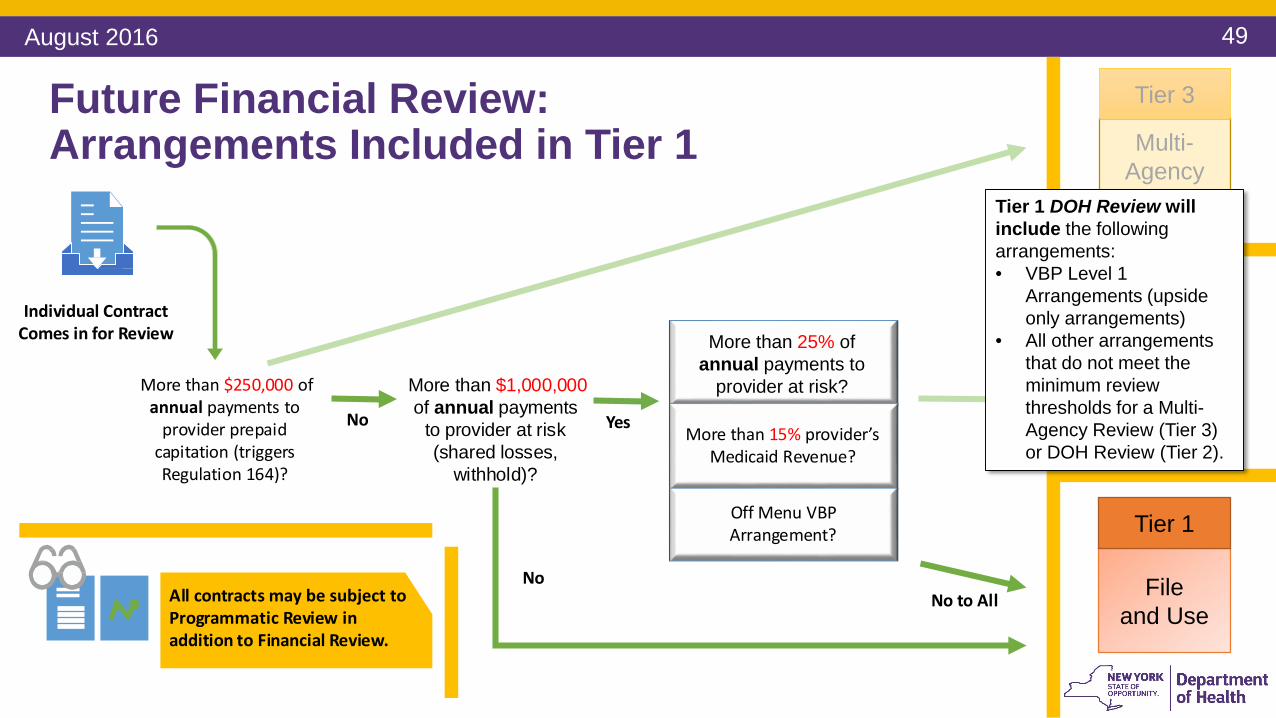
Individual ContractComes in for Review
More than $250,000 ofannual payments to
provider prepaidcapitation (triggersRegulation 164)?
Yes
No to AllNo
More than $1,000,000of annual payments
to provider at risk(shared losses,
withhold)?
Future Financial Review: Arrangements Included in Tier 1
More than 15% provider’sMedicaid Revenue?
Off Menu VBP Arrangement?
More than 25% of annual payments to
provider at risk?
Multi-Agency Review
Tier 3
DOH Review
Tier 2
Tier 1 DOH Review will include the following arrangements:• VBP Level 1
Arrangements (upside only arrangements)
• All other arrangements that do not meet the minimum review thresholds for a Multi-Agency Review (Tier 3) or DOH Review (Tier 2).
File and Use
Tier 1
All contracts may be subject to Programmatic Review inaddition to Financial Review.
August 2016

50
Multi-Agency Review
Tier 3Future Financial Review: Arrangements Included in Tier 2
No
Individual ContractComes in for Review
More than $250,000 ofannual payments to
provider prepaidcapitation (triggersRegulation 164)?
More than 15% provider’sMedicaid Revenue?
Off Menu VBP Arrangement?
Yes Yes to Any
More than $1,000,000of annual payments
to provider at risk(shared losses,
withhold)?
More than 25% of annual payments to
provider at risk?
Tier 2 DOH Review will include the following arrangements:• VBP Levels Two and Three Prepaid capitation arrangements
that do not exceed the $250,000 threshold; OR• VBP Level Two FFS arrangements (no prepaid capitation); OR• Off-menu VBP arrangements that are either FFS or do not
exceed the $250,000 prepaid capitation threshold;AND:
• Exceed the $1,000,000 at risk payment threshold; AND• Meet one of more of the three highlighted criteria
DOH Review
Tier 2
File and Use
Tier 1
All contracts may be subject to Programmatic Review inaddition to Financial Review.
August 2016
51
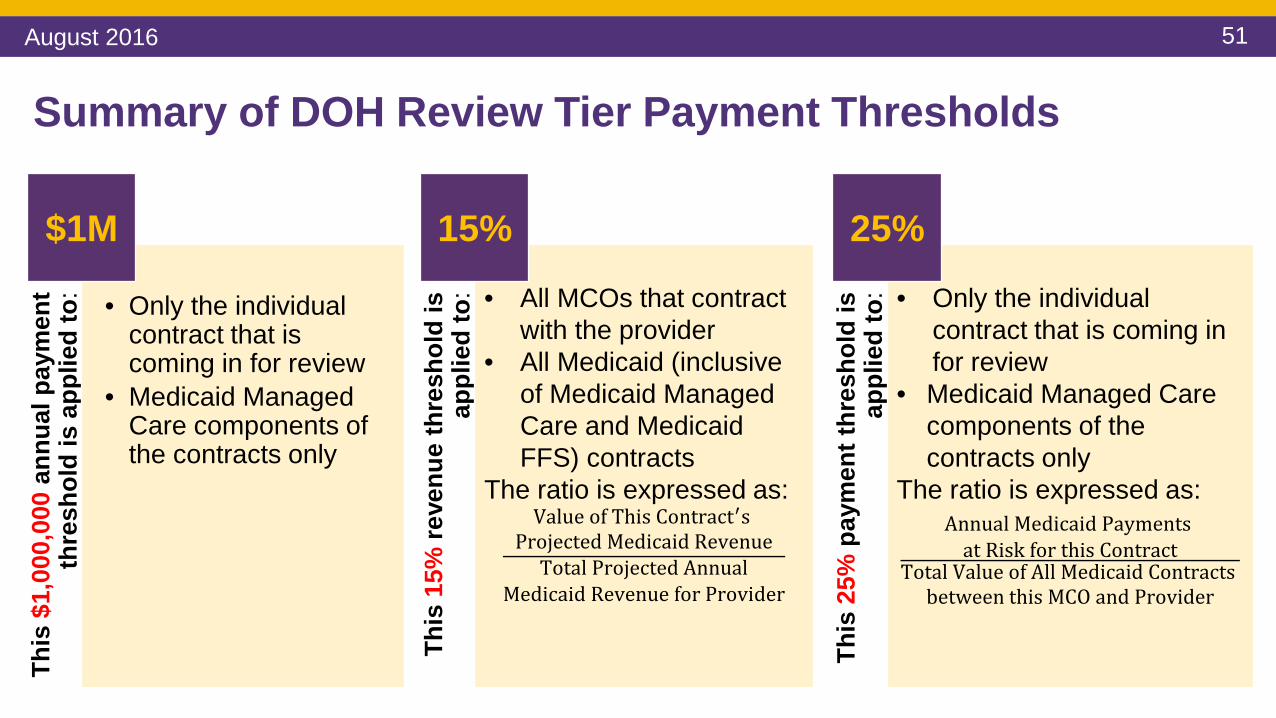
Summary of DOH Review Tier Payment Thresholds
This
$1,
000,
000
annu
al p
aym
ent
thre
shol
d is
app
lied
to: • Only the individual
contract that is coming in for review
• Medicaid Managed Care components of the contracts only
$1M
This
15%
reve
nue
thre
shol
d is
ap
plie
d to
: • All MCOs that contract with the provider
• All Medicaid (inclusive of Medicaid Managed Care and Medicaid FFS) contracts
The ratio is expressed as:Value of This Contract′s
Projected Medicaid RevenueTotal Projected Annual
Medicaid Revenue for Provider
15%
This
25%
pay
men
t thr
esho
ld is
ap
plie
d to
: • Only the individual contract that is coming in for review
• Medicaid Managed Care components of the contracts only
The ratio is expressed as:Annual Medicaid Payments
at Risk for this ContractTotal Value of All Medicaid Contracts
between this MCO and Provider
25%
August 2016

52
Future Financial Review for DOH Review Tier (Tier 2)VBP Contracts which are determined to fall under DOH Review Tier 2 will undergo both programmatic and financial review prior to approval.
For all Contracts that fall under the DOH Review Tier, the financial viability of the contracting provider must be demonstrated.
FSD only required when providers in this column fail to demonstrate financial viability
FSD required for all arrangements involving participating provider
networks
Financial Security Deposit (FSD)
Demonstration of Provider financial viability
Services provided directly by contracting provider
Services paid through a participating provider network (IPA, ACO, etc.)
August 2016

53
Financial Viability and Financial Security Deposits• Provider financial viability will be determined by demonstrating a positive net worth. Accepted
documentation includes but is not limited to:• Certified audited financial statements, or comparable means, such as an accountant’s
compilation;• Positive net worth of the guaranteeing parents’ certified audited financial statements;• Other.
• Financial Security Deposits (FSD) criteria*: the provider/IPA must establish and provide evidence of a FSD equal to 12.5% of the estimated annual medical costs for the medical services covered under the risk arrangement
• The FSD is provider funded, must consist of cash and/or short-term marketable securities, and will be held “in escrow” by the plan
• Under limited circumstances, a parental guarantee may be allowed• Out of network services already retained by the plan are not subject to the FSD• The above requirements may be mitigated to the extent that limits on the amount of
financial risk are imposed *This is not a new regulation.
August 2016

54
File and Use
Tier 1
DOH Review
Tier 2
Future Financial Review: Arrangements Included in Tier 3
Yes
Program Review will be completed in addition toFinancial Review for all contracts
Individual ContractComes in for Review
More than $250,000 ofannual payments to
provider prepaidcapitation (triggersRegulation 164)?
More than 15% provider’sMedicaid Revenue?
Off Menu VBP Arrangement?
Yes to Any
More than $1,000,000of annual payments
to provider at risk(shared losses,
withhold)?
More than 25% of annual payments to
provider at risk?
Tier 3 Multi-Agency Review will include the following arrangements that exceed the $250,000 prepaid capitation threshold:• VBP Level Three
arrangements; OR• VBP Level Two partial
capitation arrangements; OR• Off-menu VBP options that
include prepaid capitation
Multi-Agency Review
Tier 3
August 2016

55
Future Financial Review: Bucketing into Tiers
Yes
No
All contracts may be subject to Programmatic Review inaddition to Financial Review.
Individual ContractComes in for Review
More than $250,000 ofannual payments to
provider prepaidcapitation (triggersRegulation 164)?
More than 15% provider’sMedicaid Revenue?
Off Menu VBP Arrangement?
Yes Yes to Any
No to AllNo
More than $1,000,000of annual payments
to provider at risk(shared losses,
withhold)?
More than 25% of annual payments to
provider at risk?
Multi-Agency Review
Tier 3
DOH Review
Tier 2
File and Use
Tier 1
August 2016

56
Possible Risk Contract Review Tiers by VBP Arrangement Levels: Tier 3
Level 0 VBP* Level 1 VBP** Level 2 VBP** Level 3 VBP**Tier 3:
Multi-Agency Review
(DOH, DFS)
An arrangement that triggers Reg 164 but has NO quality component.
A risk arrangement that triggers Reg 164 but is NOT fully prepaid.
A fully prepaid arrangement that triggers Reg 164.
* = Level 0 VBP arrangements include a cost-savings component or a quality component, but not both.** = Level 1, 2, and 3 VBP arrangements must include a quality component in addition to a cost-savings component.*** = There are a few exceptions such as P4P where there is a FFS arrangement with a quality bonus, but no cost-savings component.
= This type of VBP arrangement will not be subject to this particular Tier of contract review.
August 2016

57
Possible Risk Contract Review Tiers by VBP Arrangement Levels: Tier 2
Level 0 VBP* Level 1 VBP** Level 2 VBP** Level 3 VBP**Tier 2:
DOH ReviewAn arrangement that does NOT trigger Reg 164, has NO quality component, and contains:1) >$1,000,000 of potential provider payments at risk; AND 2) At least one of the following: a) >25% of annual Medicaid MC or MLTC payments at risk; ORb) >15% of a provider's total Medicaid revenue; ORc) An Off-Menu arrangement.
A risk arrangement that does NOT trigger Reg 164 and contains:1) >$1,000,000 of potential provider payments at risk; AND 2) At least one of the following: a) >25% of annual Medicaid MC or MLTC payments at risk; ORb) >15% of a provider's total Medicaid revenue; ORc) An Off-Menu arrangement.
* = Level 0 VBP arrangements include a cost-savings component or a quality component, but not both.** = Level 1, 2, and 3 VBP arrangements must include a quality component in addition to a cost-savings component.*** = There are a few exceptions such as P4P where there is a FFS arrangement with a quality bonus, but no cost-savings component.
= This type of VBP arrangement will not be subject to this particular Tier of contract review.
August 2016
58
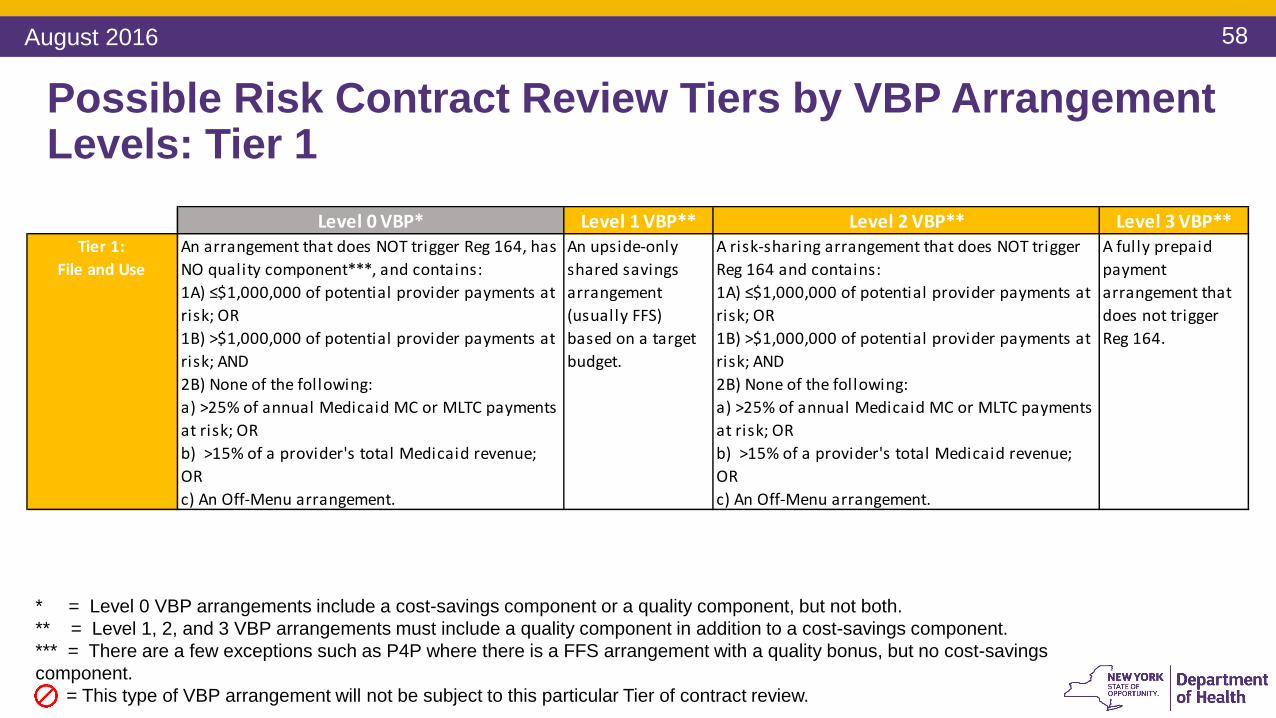
Possible Risk Contract Review Tiers by VBP Arrangement Levels: Tier 1
Level 0 VBP* Level 1 VBP** Level 2 VBP** Level 3 VBP**Tier 1:
File and UseAn arrangement that does NOT trigger Reg 164, has NO quality component***, and contains: 1A) ≤$1,000,000 of potential provider payments at risk; OR1B) >$1,000,000 of potential provider payments at risk; AND2B) None of the following: a) >25% of annual Medicaid MC or MLTC payments at risk; ORb) >15% of a provider's total Medicaid revenue; ORc) An Off-Menu arrangement.
An upside-only shared savings arrangement (usually FFS) based on a target budget.
A risk-sharing arrangement that does NOT trigger Reg 164 and contains: 1A) ≤$1,000,000 of potential provider payments at risk; OR1B) >$1,000,000 of potential provider payments at risk; AND2B) None of the following: a) >25% of annual Medicaid MC or MLTC payments at risk; ORb) >15% of a provider's total Medicaid revenue; ORc) An Off-Menu arrangement.
A fully prepaid payment arrangement that does not trigger Reg 164.
* = Level 0 VBP arrangements include a cost-savings component or a quality component, but not both.** = Level 1, 2, and 3 VBP arrangements must include a quality component in addition to a cost-savings component.*** = There are a few exceptions such as P4P where there is a FFS arrangement with a quality bonus, but no cost-savings component.
= This type of VBP arrangement will not be subject to this particular Tier of contract review.
August 2016
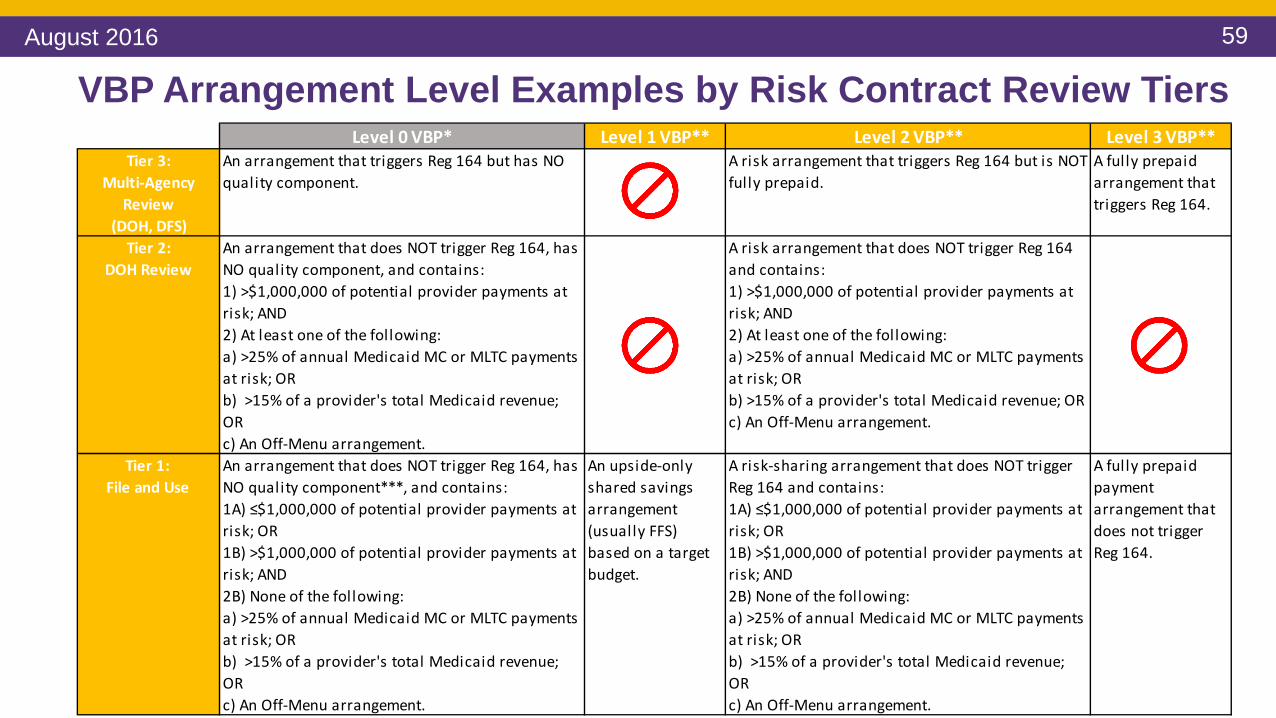
59
Level 0 VBP* Level 1 VBP** Level 2 VBP** Level 3 VBP**Tier 3:
Multi-Agency Review
(DOH, DFS)
An arrangement that triggers Reg 164 but has NO quality component.
A risk arrangement that triggers Reg 164 but is NOT fully prepaid.
A fully prepaid arrangement that triggers Reg 164.
Tier 2: DOH Review
An arrangement that does NOT trigger Reg 164, has NO quality component, and contains:1) >$1,000,000 of potential provider payments at risk; AND 2) At least one of the following: a) >25% of annual Medicaid MC or MLTC payments at risk; ORb) >15% of a provider's total Medicaid revenue; ORc) An Off-Menu arrangement.
A risk arrangement that does NOT trigger Reg 164 and contains:1) >$1,000,000 of potential provider payments at risk; AND 2) At least one of the following: a) >25% of annual Medicaid MC or MLTC payments at risk; ORb) >15% of a provider's total Medicaid revenue; ORc) An Off-Menu arrangement.
Tier 1: File and Use
An arrangement that does NOT trigger Reg 164, has NO quality component***, and contains: 1A) ≤$1,000,000 of potential provider payments at risk; OR1B) >$1,000,000 of potential provider payments at risk; AND2B) None of the following: a) >25% of annual Medicaid MC or MLTC payments at risk; ORb) >15% of a provider's total Medicaid revenue; ORc) An Off-Menu arrangement.
An upside-only shared savings arrangement (usually FFS) based on a target budget.
A risk-sharing arrangement that does NOT trigger Reg 164 and contains: 1A) ≤$1,000,000 of potential provider payments at risk; OR1B) >$1,000,000 of potential provider payments at risk; AND2B) None of the following: a) >25% of annual Medicaid MC or MLTC payments at risk; ORb) >15% of a provider's total Medicaid revenue; ORc) An Off-Menu arrangement.
A fully prepaid payment arrangement that does not trigger Reg 164.
VBP Arrangement Level Examples by Risk Contract Review TiersAugust 2016

60
Possible
Level 2 VBP
Possible
Possible
Likely
Never
Level 1 VBP
Never
Level 3 VBP
Possible
Likely
Never
Level 0 VBP
Possible
Possible
Possible
Tier 1(File and Use)
Tier 3: (Multi-Agency
Review)
Tier 2 (DOH Review)
Possible Risk Contract Review Tiers by VBP Arrangement Levels
August 2016
61
DOH and DFS Will Sign a Memorandum of Understanding
• DOH and DFS are coming together to agree on a Memorandum of Understanding (MOU) to clarify and distinguish the responsibilities of both DOH and DFS related to Tier 3 Contract Review (Multi-Agency Review).
• Approval of this MOU is forthcoming and is expected this summer.
August 2016

62
Questions
August 2016

63
Lunch Break – 60 mins
August 2016
64
VBP Contracting Panel
August 2016

65
Contracting Panel – Real Life Experience
Contracting and risk management through the eyes of VBP contractors.
Please listen to hear challenges, best practices and lessons learned from the VBP panelists on strategizing and implementing VBP arrangements.
August 2016

66
PanelistsPanelist Role Organization Details June Keenan, MS, MPH
Senior VP, Delivery System Transformation Executive Director
Westchester Medical Center, Regional Healthcare Innovation Center
Provider, Healthcare Network
Theresa Riordan Vice President, Strategic Alliances
Healthfirst Not-for-profit health insurance company
John Kastan, Ph.D.
Chief Program Officer
The Jewish Board A large community-based social services and behavioral health organization, we provide a wide range of ambulatory and residential services to individuals, (and often entire families), of all ages.
Paloma Hernandez
President and CEO Urban Health Plan, Inc.
Federally qualified community health center providing primary and specialty care.
August 2016
67
Panel Questions 1. What has your organization done to get ready for VBP?
2. Can you please share a success story, challenge faced/overcome, and/or lessons learned from your organization’s current experience with VBP/ VBP-like contracts?
3. What is the best advice that you would give to entities that are beginning the VBP contracting process?
4. In your opinion, what made your organization most successful – any specific “Dos and Don’ts” that you would like share?
August 2016

68
Questions
August 2016
69
Financial Risk Management
August 2016
70
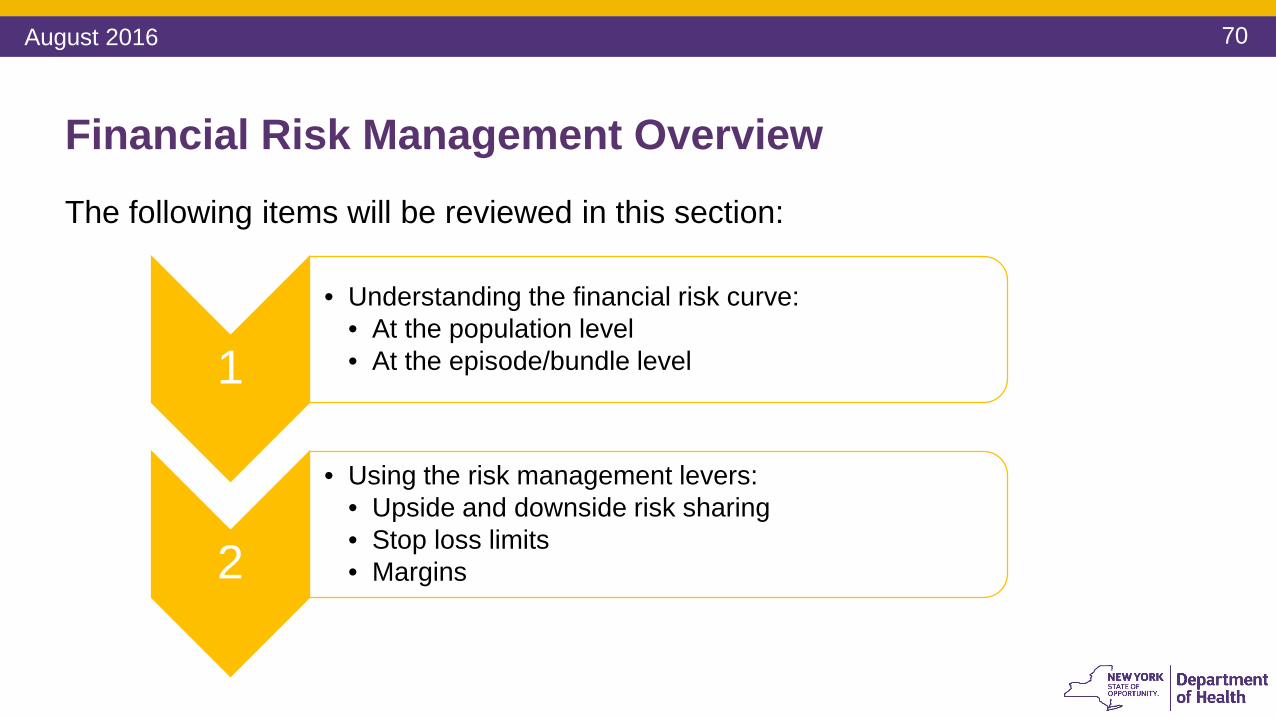
Financial Risk Management OverviewThe following items will be reviewed in this section:
1• Understanding the financial risk curve:
• At the population level• At the episode/bundle level
2
• Using the risk management levers:• Upside and downside risk sharing• Stop loss limits• Margins
August 2016

71
Chronic Illness, Acute Conditions, Procedures
Num
ber o
f Pla
n M
embe
rs
Average Costs Per Member Per Year
Total Cum
ulative Costs
The Different Zones of Health Care Spending
Routine Sick and Preventive Care
Uncommon Conditions & Procedures$
$$
$$$$
Also known as ‘tail end’
August 2016

72
How it Plays Out in DSRIP and VBP Pilots
PMPY TCGPIPC-CB
Maternity HIV/AIDS HARPIPC CB
Volume 45,000 35,000 15,000 2,000 500 1,000Average $5,000 $700 $2,700 $10,500 $32,250 $20,750 10th %ile $200 $0 $0 $6,400 $6,300 $2,10025th %ile $450 $60 $121 $7,500 $13,700 $5,60075th %ile $3,750 $800 $2,500 $11,200 $41,000 $25,75090th %ile $10,150 $1,500 $7,000 $15,300 $55,200 $45,000
Coefficient of Variation 4.6 2.4 2.6 0.7 0.8 1.2
Each cohort has its own distribution of costs and the coefficient of variation provides an indication of the length of the “tail” of the distribution. The longer the tail, the more variation and high cost cases. Small swings in high cost cases can impact the rest of the cohort.
The table below contains a random sample of 50K plan members, 2014 Medicaid Claims (numbers rounded up):
August 2016

73
The Effect of Small Samples on Financial ResultsSample Size: Number of Patients With Asthma
Cum
ulat
ive
Varia
nce
of E
xpec
ted-
to-
Act
ual C
osts
of A
sthm
a as
a P
erce
nt o
f A
ctua
l
Small population sample
Large population sample
August 2016
74
Population Size Considerations
• The size of your population matters – larger samples help better understand cost trends and population behaviors
• That said, more people doesn’t mean less individual case variation
• It is not recommended to contract VBP arrangements for small population groups
• Severity adjustment does work when applied properly (on larger population samples)
August 2016
75
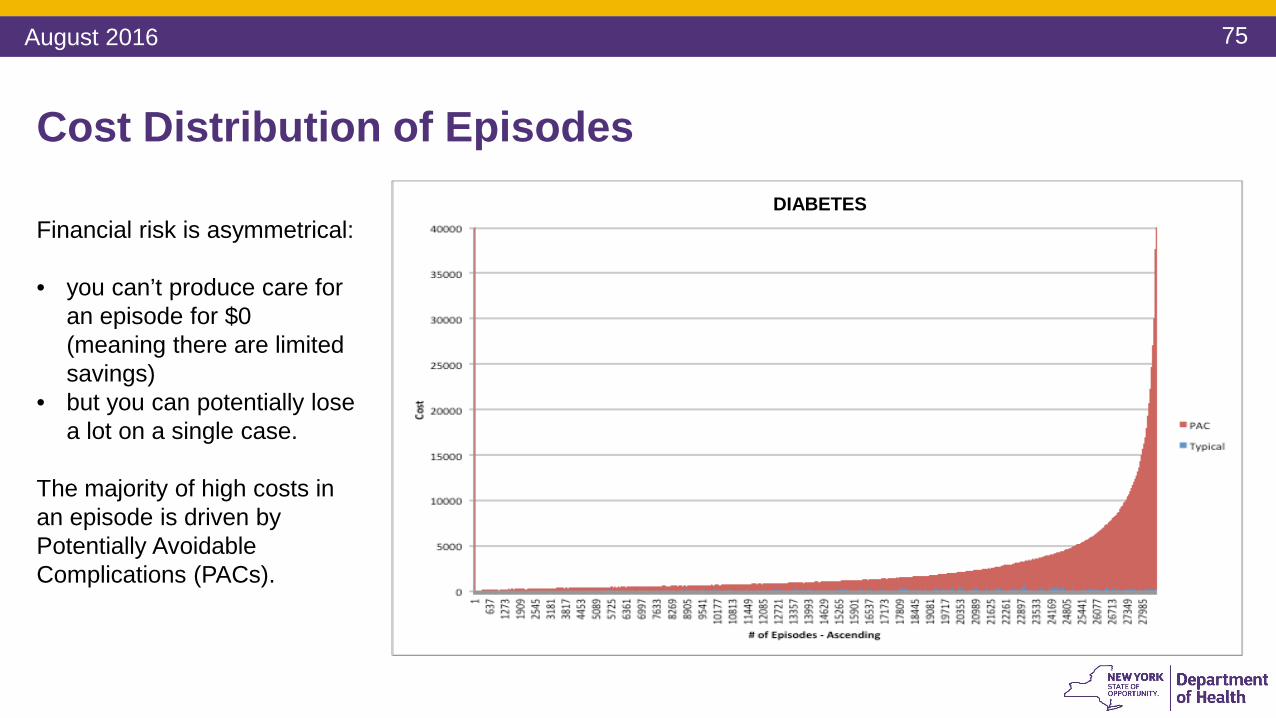
Cost Distribution of Episodes
Financial risk is asymmetrical:
• you can’t produce care for an episode for $0 (meaning there are limited savings)
• but you can potentially lose a lot on a single case.
The majority of high costs in an episode is driven by Potentially Avoidable Complications (PACs).
DIABETES
August 2016

76
There are Significant Opportunities to Increase Value
Reduce PACs & Episode Costs to be a High Performer
Reduce PACs to be a High Performer
August 2016

77
Questions
August 2016

78
Understanding Asymmetrical Risk – Case Study
• We randomized 200 patients in 1000 physicians, created severity adjusted budgets and compared the budget to actual, and netted out the variance across all 200 patients to end up with a net saving or loss.
• We then simulated the effect on providers based on four different types of risk contracts – upside only, 100% upside/60% downside, 50/50 up/down, 100/100 up/down.
• We then simulated the effect when (a) patients are randomly distributed, (b) the provider has a moderately higher rate of severe patients, (c) a much higher rate of severe patients, and (d) a very high rate of severe patients.
August 2016

79
Potential for Savings/Losses by Provider for Diabetes
Almost impossible case scenario
OverweightOverweight
This graph depicts a scenario with highly unlikely negative population health characteristics
Overweight
August 2016

80
Potential for Savings/Losses by Provider for Diabetes (cont.)
OverweightOverweightOverweight
August 2016
81
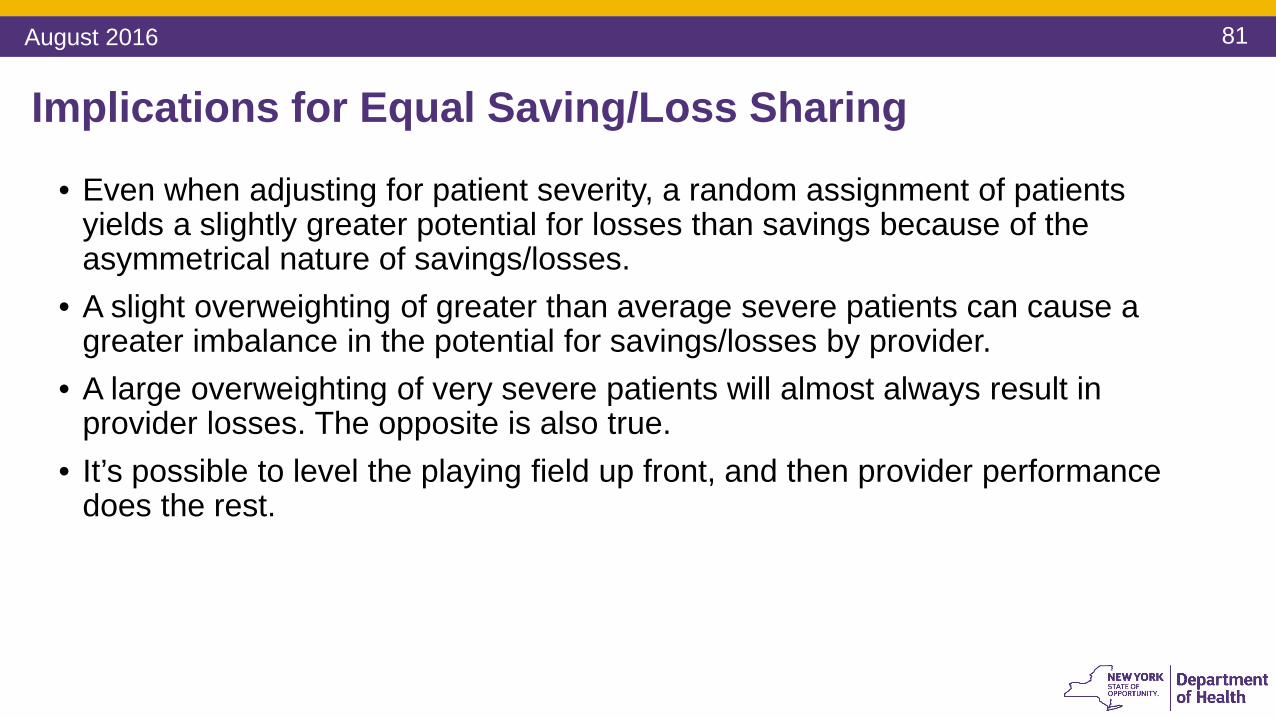
Implications for Equal Saving/Loss Sharing
• Even when adjusting for patient severity, a random assignment of patients yields a slightly greater potential for losses than savings because of the asymmetrical nature of savings/losses.
• A slight overweighting of greater than average severe patients can cause a greater imbalance in the potential for savings/losses by provider.
• A large overweighting of very severe patients will almost always result in provider losses. The opposite is also true.
• It’s possible to level the playing field up front, and then provider performance does the rest.
August 2016
82
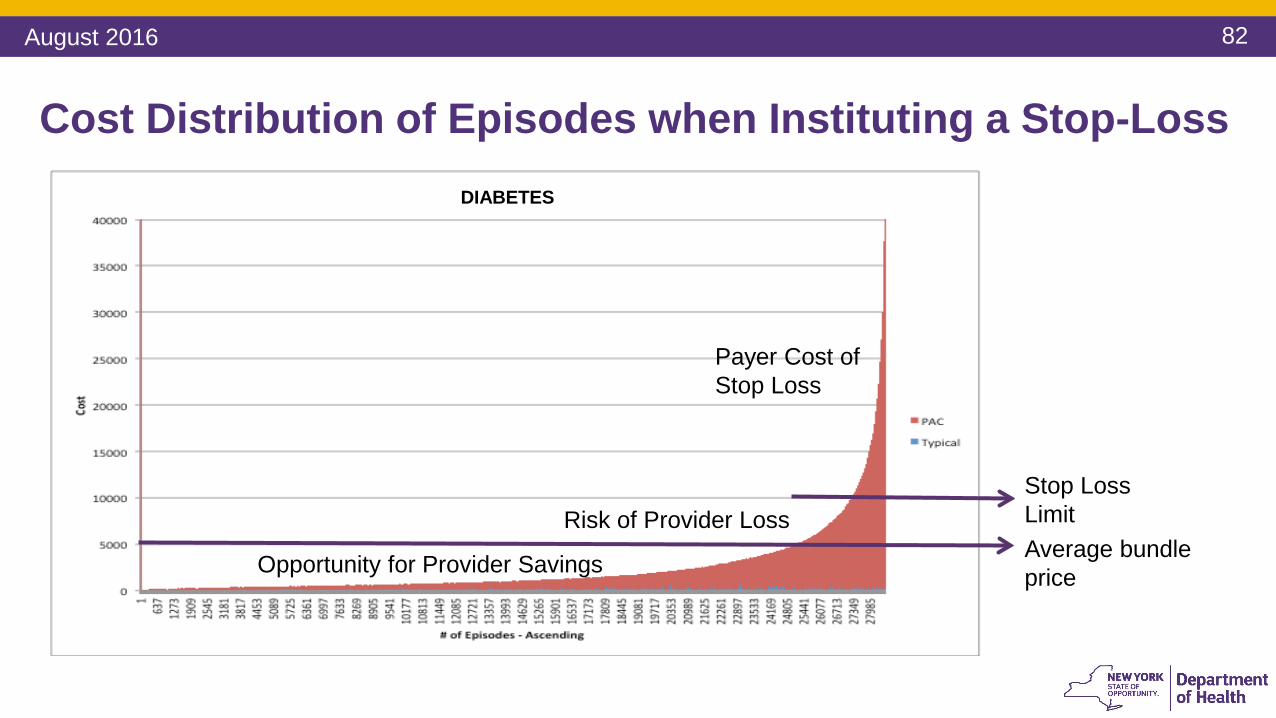
Opportunity for Provider Savings
Risk of Provider Loss
Payer Cost of Stop Loss
Average bundle price
Stop Loss Limit
Cost Distribution of Episodes when Instituting a Stop-LossDIABETES
August 2016
83
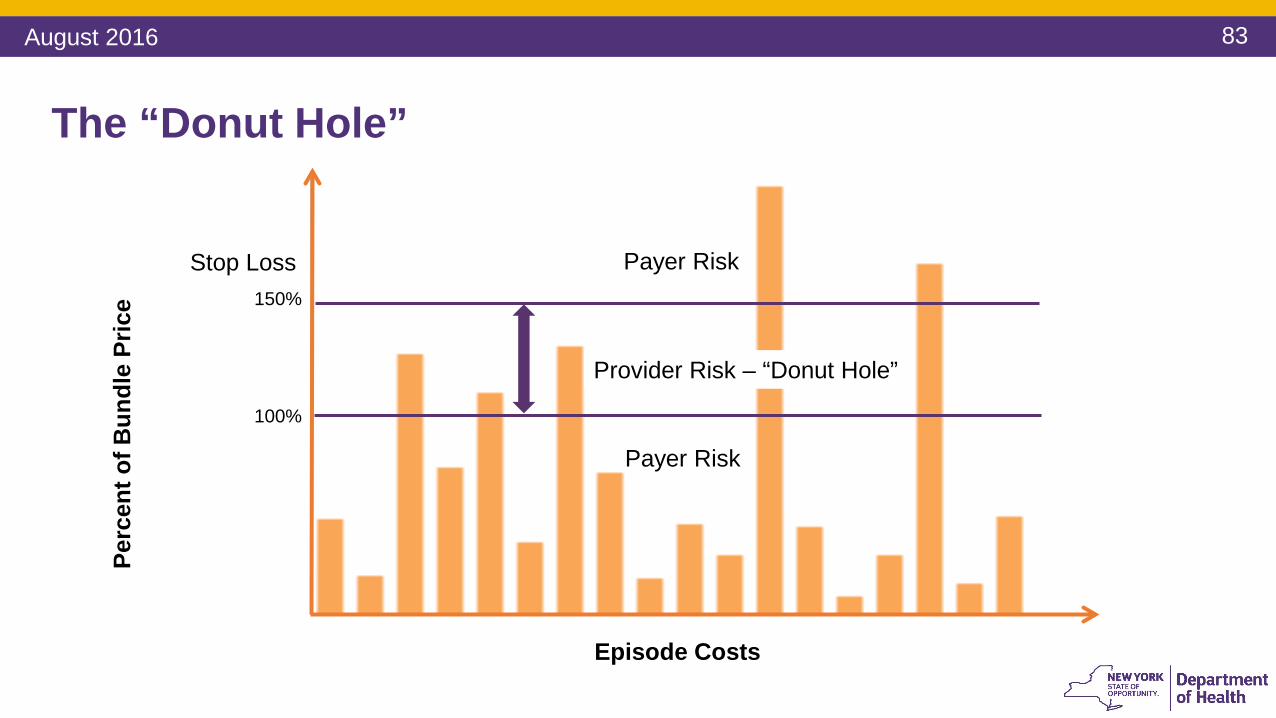
The “Donut Hole”
Payer Risk
Payer Risk
Provider Risk – “Donut Hole”
Perc
ent o
f Bun
dle
Pric
e
100%
Episode Costs
Stop Loss150%
Payer Risk
Provider Risk – “Donut Hole”
Payer Risk
August 2016
84
Managing Financial Risk in a Fixed Price Contract• The provider is at risk for the excess costs over the prospective budget, up to
the stop loss per episode• The budget is severity adjusted• The extent to which a provider is already highly efficient, a margin can be
negotiated• The “Donut Hole” contains manageable risk
• There can be an aggregate stop loss in addition to a per episode stop-loss• In the Level 1 “upside only risk” model, the stop loss = budget
• But there is a cost to stop-loss for the payer
August 2016

85
Considerations on Stop Loss1. Payers and providers have to think thoroughly about the stop loss amount.
Providers should be ready to pay stop loss premiums or reconsider their % of shared savings in order to stay protected
2. It is important to remember that the lower the stop loss threshold, the higher the stop loss “premium” and vice versa
3. Payers and providers can negotiate a “premium” for the stop loss, which would be equivalent to the payer’s estimated costs for instituting the stop loss, spread across all of a provider’s bundles and result in a budget reduction.
August 2016

86
Considerations on Stop Loss (cont.)
4. The payer cost of stop-loss can be estimated by calculating the total costs in the tail of the episode cost distribution above the individual episode stop-loss
5. The potential for provider loss (the “Donut Hole”) can be estimated by calculating the area of the episode cost distribution above the average bundle price and the stop loss limit
6. The potential for provider savings can be estimated by calculating the area of the distribution above the actual and up to the average bundle price
August 2016
87
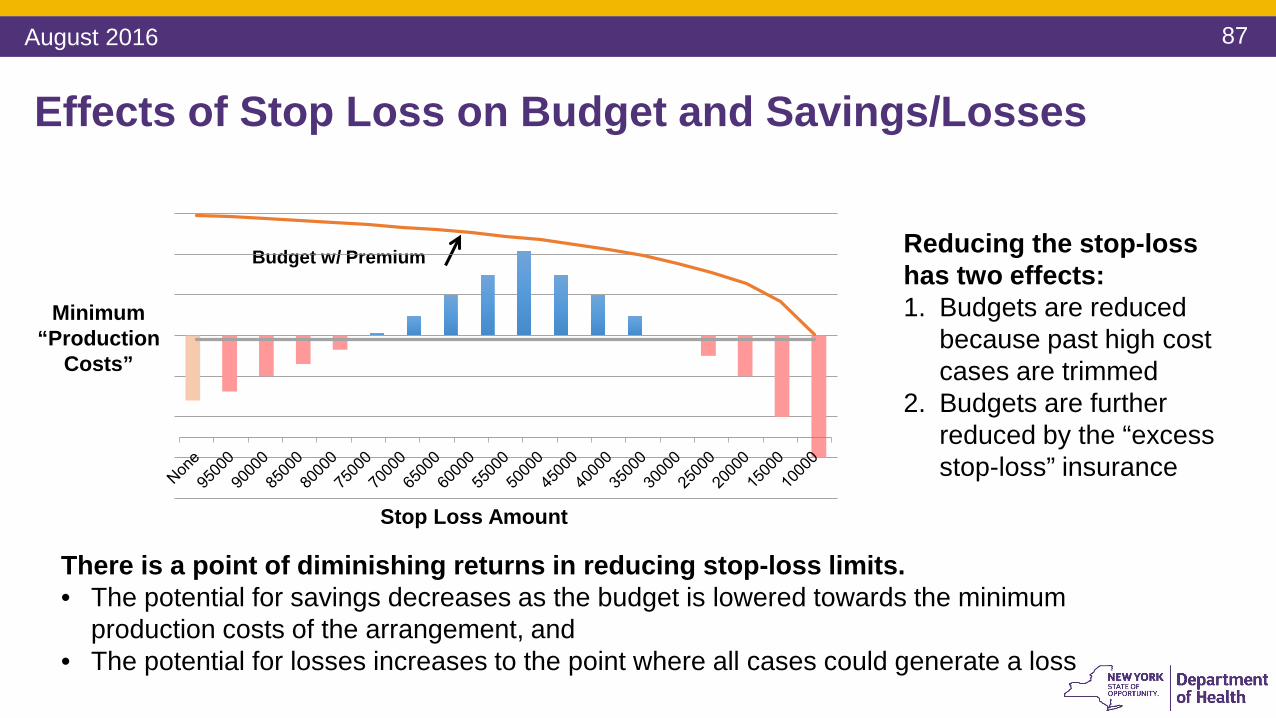
Effects of Stop Loss on Budget and Savings/Losses
Minimum “Production
Costs”
Budget w/ Premium
Stop Loss Amount
Reducing the stop-loss has two effects:1. Budgets are reduced
because past high cost cases are trimmed
2. Budgets are further reduced by the “excess stop-loss” insurance
There is a point of diminishing returns in reducing stop-loss limits. • The potential for savings decreases as the budget is lowered towards the minimum
production costs of the arrangement, and • The potential for losses increases to the point where all cases could generate a loss
August 2016

88
Margins Could be Considered for Highly Efficient Providers
A margin is a percentage negotiated by the payer and provider, which is added to the expected or budgeted typical costs (not to costs of potentially avoidable complications).
You can’t produce a bundle for $0, and there is an absolute
floor that could be calculated. Providers close to the floor need
a margin to reinvest in continuous performance
improvement.
August 2016

89
Summary of Financial Risk Management Strategies
1 Upside/downside risk sharing arrangements don’t have to be symmetrical
2 Stop losses are for individual cases and can be in aggregate. There is a cost to a stop loss because the payer assumes the risk. “Excess” stop-loss insurance should come in reduction of the target budget/price
3 Defined margins are important to insulate providers from incurring losses because their potential for achieving further efficiencies is low
4 Quality scorecards can be used to encourage continued quality improvement even when providers have a bad financial year, and can be used to limit upside risk when quality doesn’t improve or fails to meet a certain threshold performance
August 2016

90
Questions
August 2016

91
Break – 15 mins
August 2016

92
Guidance on Setting Target Budget for a VBP Arrangement (between MCO and Provider)
August 2016

93
Methodology
August 2016
94
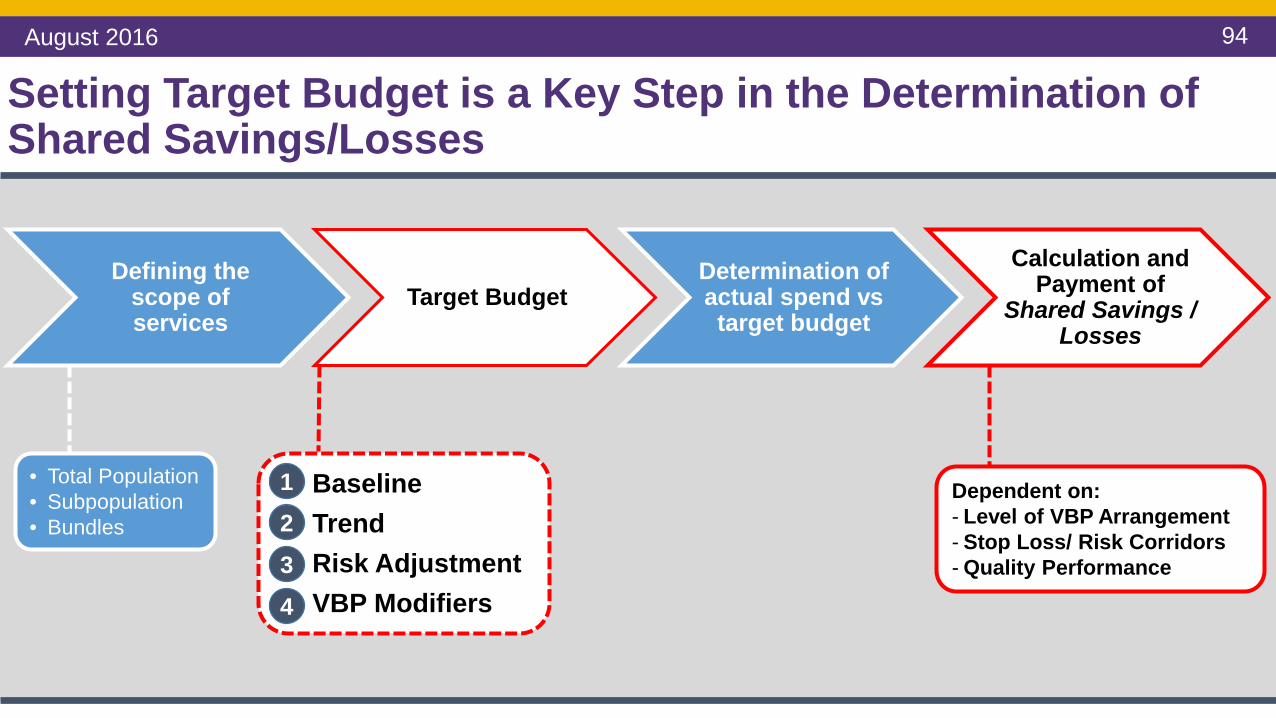
Setting Target Budget is a Key Step in the Determination of Shared Savings/Losses
• Total Population• Subpopulation• Bundles
1. Baseline2. Trend3. Risk Adjustment4. VBP Modifiers
1234
Defining the scope of services
Target BudgetDetermination of actual spend vs target budget
Calculation and Payment of
Shared Savings / Losses
Dependent on:- Level of VBP Arrangement- Stop Loss/ Risk Corridors- Quality Performance
August 2016

95
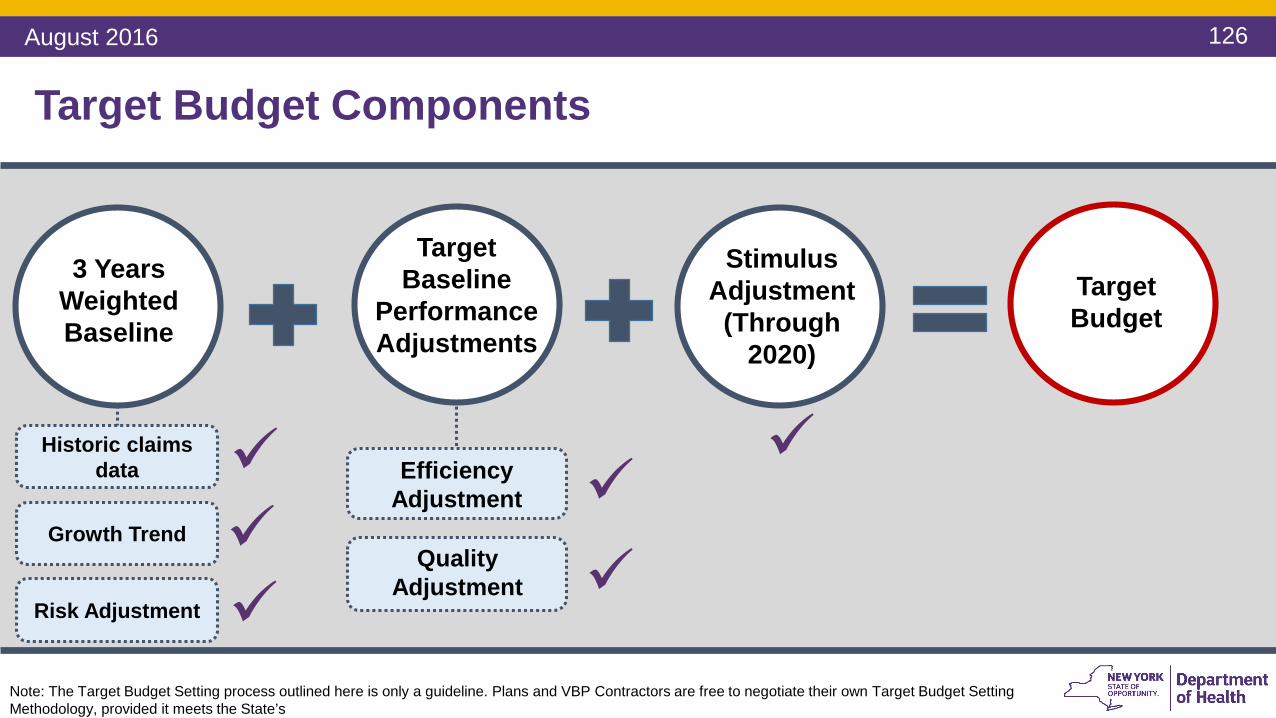
3 Years WeightedBaseline
Target Baseline
Performance Adjustments
Historic claims data
Stimulus Adjustment
(Through 2020)
Quality Adjustment
Efficiency Adjustment
Target Budget
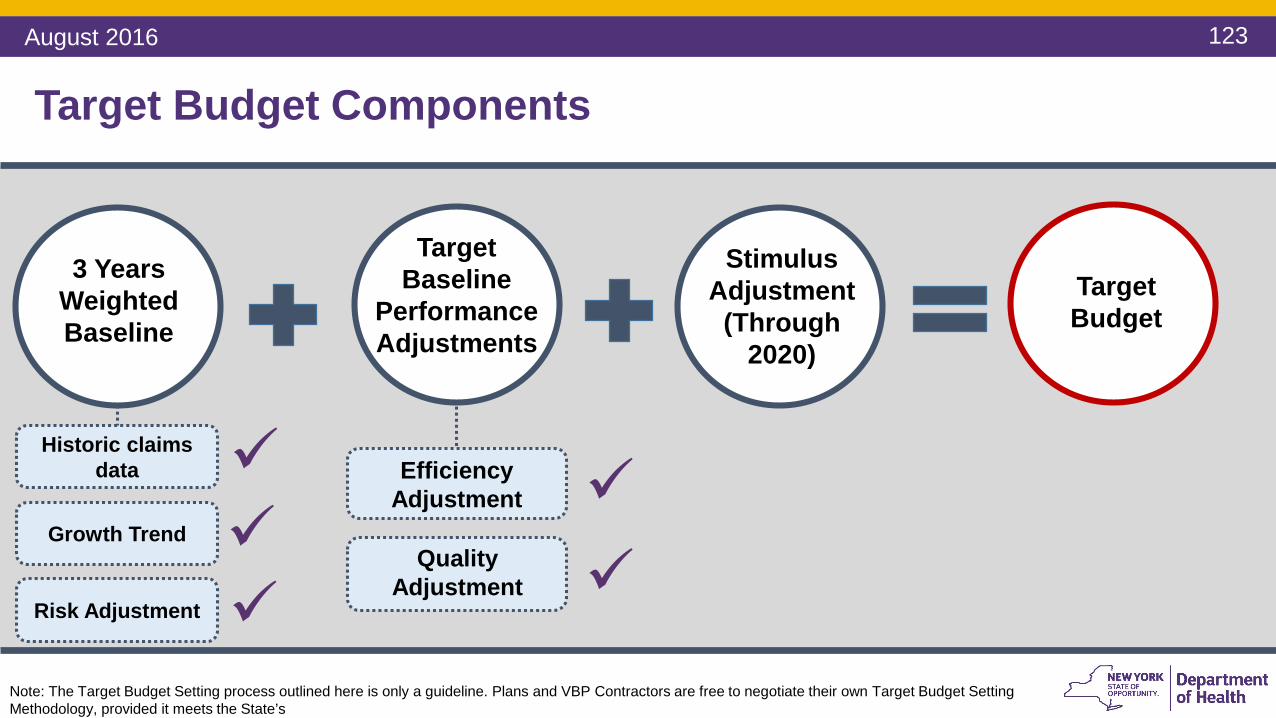
Target Budget Components
Growth Trend
Risk Adjustment
Note: The Target Budget Setting process outlined here is only a guideline. Plans and VBP Contractors are free to negotiate their own Target Budget Setting Methodology.
August 2016
96
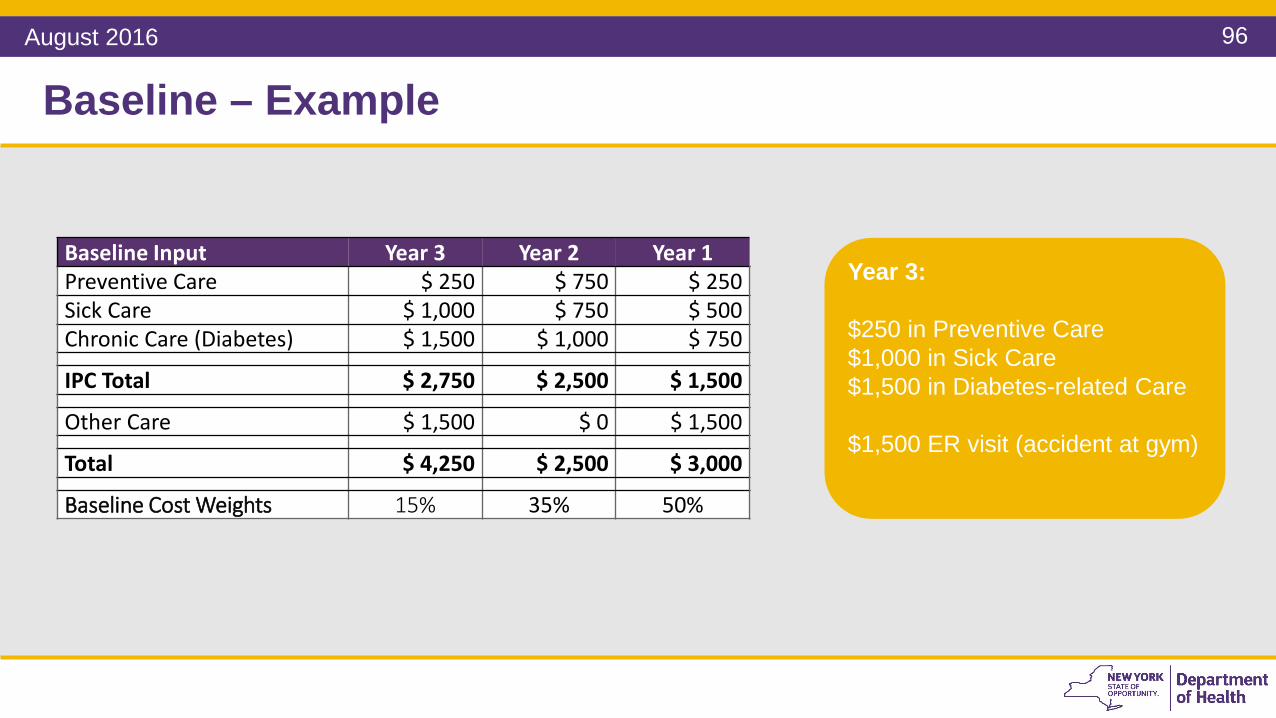
Baseline – Example
Baseline Input Year 3 Year 2 Year 1Preventive Care $ 250 $ 750 $ 250Sick Care $ 1,000 $ 750 $ 500Chronic Care (Diabetes) $ 1,500 $ 1,000 $ 750
IPC Total $ 2,750 $ 2,500 $ 1,500
Other Care $ 1,500 $ 0 $ 1,500
Total $ 4,250 $ 2,500 $ 3,000
Baseline Cost Weights 15% 35% 50%
Year 3:
$250 in Preventive Care$1,000 in Sick Care$1,500 in Diabetes-related Care
$1,500 ER visit (accident at gym)
August 2016

97
Baseline – Example
Baseline Input Year 3 Year 2 Year 1Preventive Care $ 250 $ 750 $ 250Sick Care $ 1,000 $ 750 $ 500Chronic Care (Diabetes) $ 1,500 $ 1,000 $ 750
IPC Total $ 2,750 $ 2,500 $ 1,500
Other Care $ 1,500 $ 0 $ 1,500
Total $ 4,250 $ 2,500 $ 3,000
Baseline Cost Weights 15% 35% 50%
Year 2:
$750 in Preventive Care$750 in Sick Care$1,000 in Diabetes-related Care
No other care provided
August 2016

98
Baseline – Example
Baseline Input Year 3 Year 2 Year 1Preventive Care $ 250 $ 750 $ 250Sick Care $ 1,000 $ 750 $ 500Chronic Care (Diabetes) $ 1,500 $ 1,000 $ 750
IPC Total $ 2,750 $ 2,500 $ 1,500
Other Care $ 1,500 $ 0 $ 1,500
Total $ 4,250 $ 2,500 $ 3,000
Baseline Cost Weights 15% 35% 50%
Year 1:
$250 in Preventive Care$500 in Sick Care$750 in Diabetes-related Care
$1,500 in IP for Migraines
August 2016

99
Baseline – Formula
Formula Year 3 Year 2 Year 1 (most recent)
Baseline Cost Weights 15% 35% 50%
(Year 3 *0.15) + (Year 2*0.35) + (Year 1*0.50)
The baseline cost is a weighted average of actual per-member per-month (PMPM) or per-bundle payments over 3 years with the most recent year, “Year 1,” weighted the most.
Formula:
Purpose: to determine the weighted member-specific historical costs over a three year period.
Example Data Year 3 Year 2 Year 1 (most recent)
Baseline Cost:TCGP $ 4,250 $ 2,500 $ 3,000
(4,250*0.15) + (2,500*0.35) + (3,000*0.50) = $ 3,012
Formula: TCGP
August 2016

100
3 Years WeightedBaseline
Target Baseline
Performance Adjustments
Historic claims data
Stimulus Adjustment
(Through 2020)
Quality Adjustment
Efficiency Adjustment
Target Budget
Target Budget Components
Growth Trend
Risk Adjustment
Note: The Target Budget Setting process outlined here is only a guideline. Plans and VBP Contractors are free to negotiate their own Target Budget Setting Methodology, provided it meets the State’s
August 2016

101
Note: The Downstate Region consists of the five counties comprising New York City, and the counties of Nassau, Suffolk, Westchester, Rockland, Orange, Putnam, and Dutchess. The Upstate Region consists of all counties in the State other than those counties included in the Downstate Region. This aligns with NYS’ ambulatory patient groups definitions for up/down state
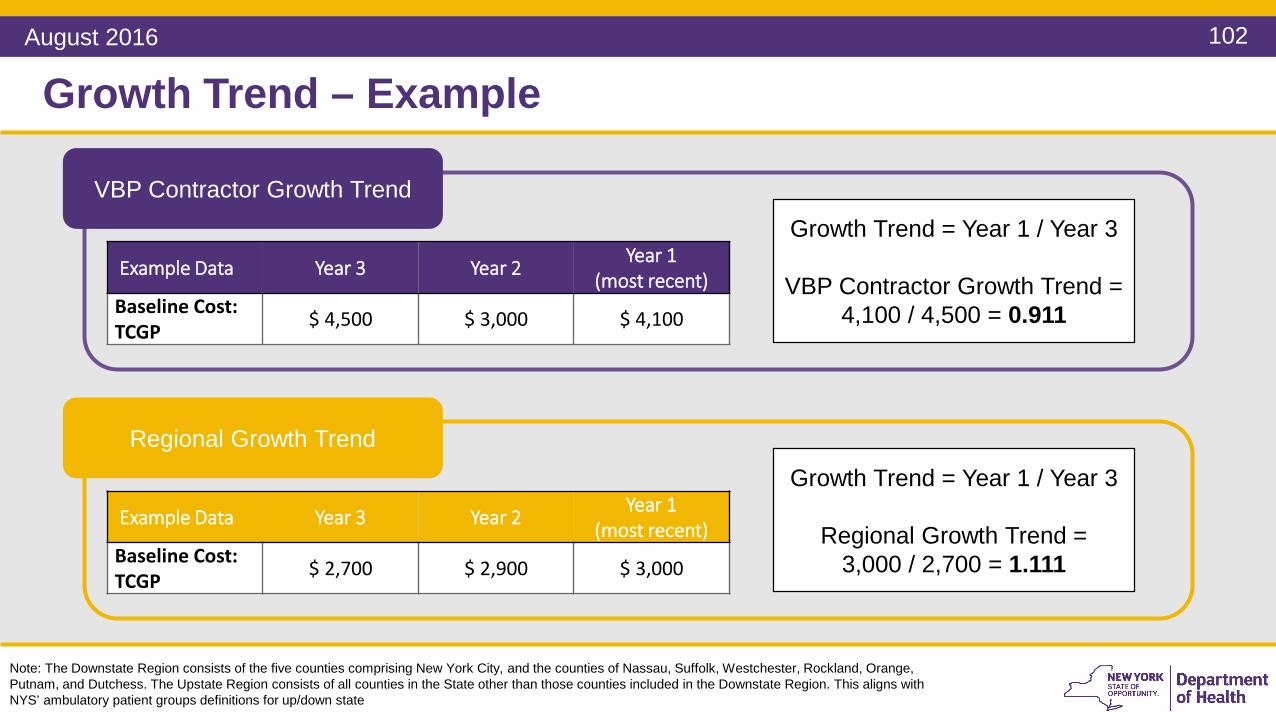
Growth Trend – Example
VBP Contractor Growth Trend
Example Data Year 3 Year 2 Year 1 (most recent)
Baseline Cost:TCGP $ 4,500 $ 3,000 $ 4,100
$ 4,500
$ 3,000
$ 4,100
Regional Growth Trend
Example Data Year 3 Year 2 Year 1 (most recent)
Baseline Cost:TCGP $ 2,700 $ 2,900 $ 3,000
$ 2,700$ 2,900
$ 3,000
August 2016
102
Note: The Downstate Region consists of the five counties comprising New York City, and the counties of Nassau, Suffolk, Westchester, Rockland, Orange, Putnam, and Dutchess. The Upstate Region consists of all counties in the State other than those counties included in the Downstate Region. This aligns with NYS’ ambulatory patient groups definitions for up/down state
Growth Trend – Example
VBP Contractor Growth Trend
Example Data Year 3 Year 2 Year 1 (most recent)
Baseline Cost:TCGP $ 4,500 $ 3,000 $ 4,100
Regional Growth Trend
Example Data Year 3 Year 2 Year 1 (most recent)
Baseline Cost:TCGP $ 2,700 $ 2,900 $ 3,000
Growth Trend = Year 1 / Year 3
VBP Contractor Growth Trend = 4,100 / 4,500 = 0.911
Growth Trend = Year 1 / Year 3
Regional Growth Trend = 3,000 / 2,700 = 1.111
August 2016

103
• The growth trend of costs during the performance period is calculated by averaging the regional growth trend (upstate or downstate) and a VBP contractor-specific growth trend.
• The trend is computed over the same three years as the baseline.
Formula:Weighted Baseline * (Regional Growth Trend + VBP Contractor Specific Growth Trend) * .5
Note: The Downstate Region consists of the five counties comprising New York City, and the counties of Nassau, Suffolk, Westchester, Rockland, Orange, Putnam, and Dutchess. The Upstate Region consists of all counties in the State other than those counties included in the Downstate Region. This aligns with NYS’ ambulatory patient groups definitions for up/down state
Growth Trend – Formula
Purpose: to account for changes in cost of delivering care by applying a growth trend to the weighted baseline cost
Example:$ 3,012 x ( 1.111 + 0.911 ) x .5$ 3,012 x 1.011
$ 3,012 x 1.011 = $ 3,045.13
August 2016

104
3 Years WeightedBaseline
Target Baseline
Performance Adjustments
Historic claims data
Stimulus Adjustment
(Through 2020)
Quality Adjustment
Efficiency Adjustment
Target Budget
Target Budget Components
Growth Trend
Risk Adjustment
Note: The Target Budget Setting process outlined here is only a guideline. Plans and VBP Contractors are free to negotiate their own Target Budget Setting Methodology, provided it meets the State’s
August 2016

105
Risk Adjustment – Methods
• If the risk adjustment coefficient is different, the target budget is changed accordingly. This only happens at the start of the contract year.
Methods:
Comparing 3M CRG or HCI3 Risk Adjustment Coefficient of Baseline data to attributed population at start of contract.
Purpose: At the start of the contract year the risk-profile of the population may be different from the historical baseline. The target budget may therefore need to be adjusted accordingly. This ensures that variance in the risk profile of member populations does not skew the target budget calculation.
August 2016

106
Risk Adjustment
This only happens at the start of the contract year.
Method:Compare 3M CRG or HCI3 Risk Adjustment Coefficient of Baseline data to attributed population at
start of contract.
Case Mix Factor x Target Budget = Risk-adjusted Target Budget
Purpose: At the start of the contract year the risk-profile of the population may be different from the historical baseline. The target budget may therefore need to be adjusted accordingly. This ensures that variance in the risk profile of member populations does not skew the target budget calculation.
Example:Case Mix Factor x Target Budget = Risk-adjusted Target Budget
1.025 x $ 3,045.13 = $ 3,121.26
August 2016

107
3 Years WeightedBaseline
Target Baseline
Performance Adjustments
Historic claims data
Stimulus Adjustment
(Through 2020)
Quality Adjustment
Efficiency Adjustment
Target Budget
Target Budget Components
Growth Trend
Risk Adjustment
Note: The Target Budget Setting process outlined here is only a guideline. Plans and VBP Contractors are free to negotiate their own Target Budget Setting Methodology, provided it meets the State’s
August 2016

108
Questions
August 2016

109
Performance Adjustments
August 2016

110
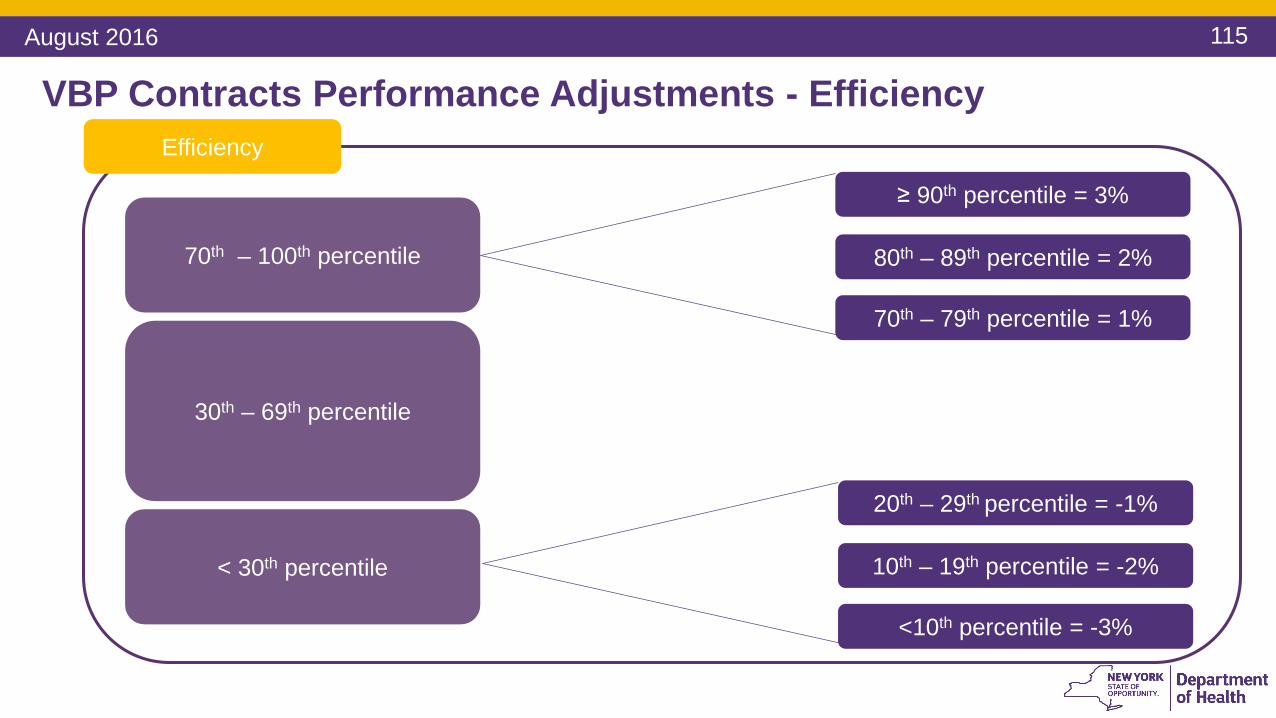
VBP Contracts Performance Adjustments - EfficiencyEfficiency
70th – 100th percentile
30th – 69th percentile
< 30th percentile
≥ 90th percentile = 3%
80th – 89th percentile = 2%
70th – 79th percentile = 1%
20th – 29th percentile = -1%
10th – 19th percentile = -2%
<10th percentile = -3%
August 2016
111
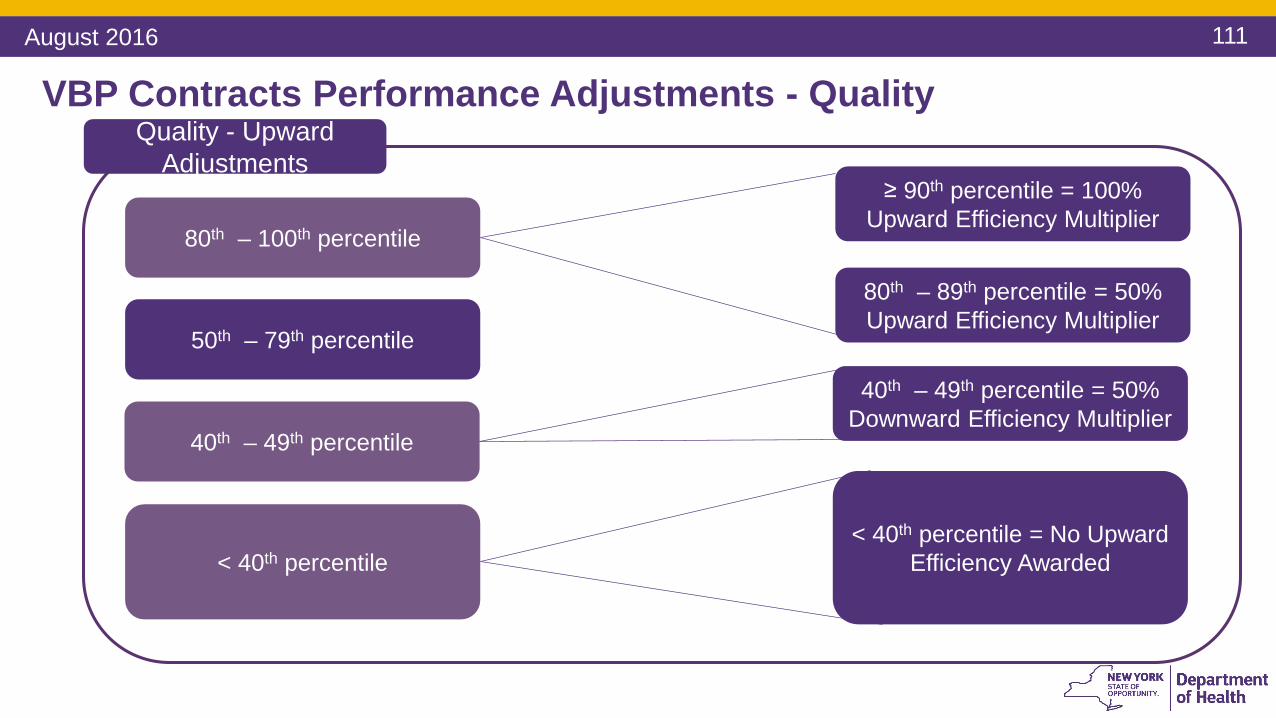
VBP Contracts Performance Adjustments - QualityQuality - Upward
Adjustments
80th – 100th percentile
40th – 49th percentile
< 40th percentile
80th – 89th percentile = 50% Upward Efficiency Multiplier
≥ 90th percentile = 100% Upward Efficiency Multiplier
< 40th percentile = No Upward Efficiency Awarded
50th – 79th percentile
40th – 49th percentile = 50% Downward Efficiency Multiplier
August 2016
112
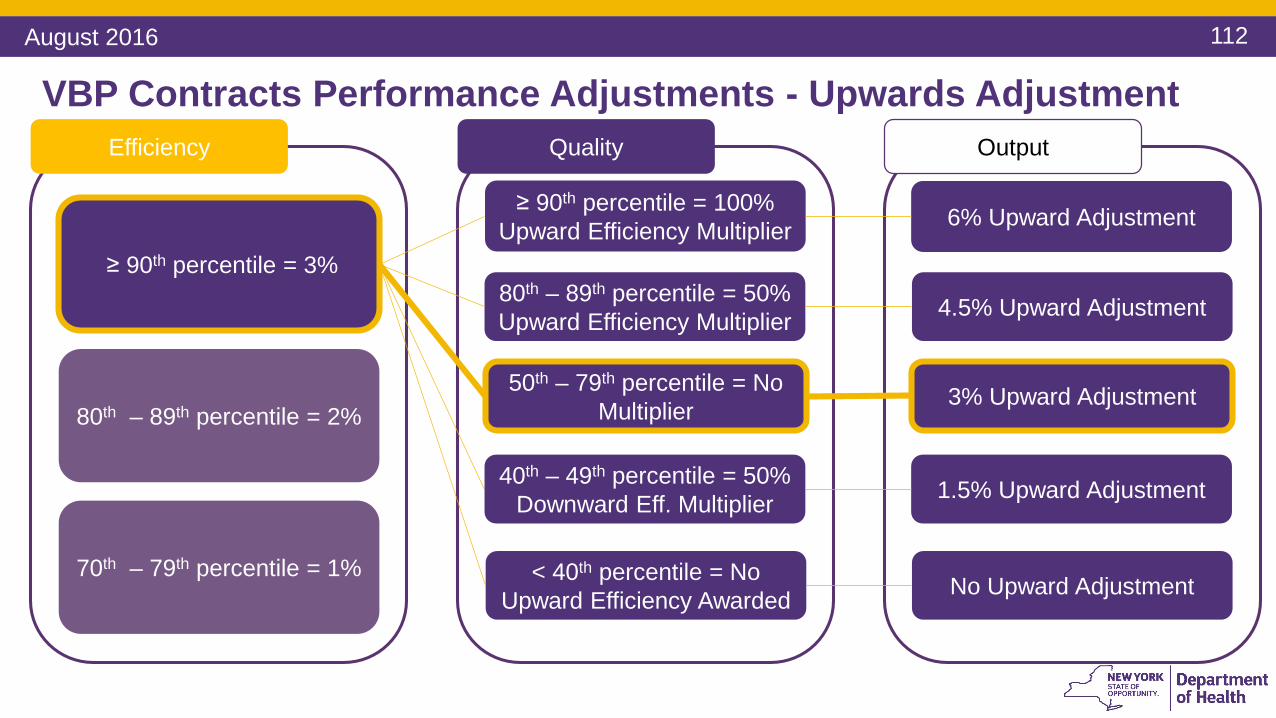
VBP Contracts Performance Adjustments - Upwards AdjustmentEfficiency
≥ 90th percentile = 3%
80th – 89th percentile = 2%
70th – 79th percentile = 1%
Quality
≥ 90th percentile = 100% Upward Efficiency Multiplier
80th – 89th percentile = 50% Upward Efficiency Multiplier
Output
40th – 49th percentile = 50% Downward Eff. Multiplier
< 40th percentile = No Upward Efficiency Awarded
6% Upward Adjustment
4.5% Upward Adjustment
1.5% Upward Adjustment
No Upward Adjustment
50th – 79th percentile = No Multiplier 3% Upward Adjustment
August 2016

113
VBP Contracts Performance Adjustments - Upwards AdjustmentEfficiency
≥ 90th percentile = 3%
80th – 89th percentile = 2%
70th – 79th percentile = 1%
Quality
≥ 90th percentile = 100% Upward Efficiency Multiplier
80th – 89th percentile = 50% Upward Efficiency Multiplier
Output
40th – 49th percentile = 50% Downward Eff. Multiplier
< 40th percentile = No Upward Efficiency Awarded
4% Upward Adjustment
3% Upward Adjustment
1% Upward Adjustment
No Upward Adjustment
50th – 79th percentile = No Multiplier 2% Upward Adjustment
August 2016

114
VBP Contracts Performance Adjustments - Upwards AdjustmentEfficiency
≥ 90th percentile = 3%
80th – 89th percentile = 2%
70th – 79th percentile = 1%
Quality
≥ 90th percentile = 100% Upward Efficiency Multiplier
80th – 89th percentile = 50% Upward Efficiency Multiplier
Output
40th – 49th percentile = 50% Downward Eff. Multiplier
< 40th percentile = No Upward Efficiency Awarded
2% Upward Adjustment
1.5% Upward Adjustment
.5% Upward Adjustment
No Upward Adjustment
50th – 79th percentile = No Multiplier 1% Upward Adjustment
August 2016
115
VBP Contracts Performance Adjustments - EfficiencyEfficiency
70th – 100th percentile
30th – 69th percentile
< 30th percentile
≥ 90th percentile = 3%
80th – 89th percentile = 2%
70th – 79th percentile = 1%
20th – 29th percentile = -1%
10th – 19th percentile = -2%
<10th percentile = -3%
August 2016

116
VBP Contracts Performance Adjustments - QualityQuality - Downward
Adjustments
≥ 80th percentile
30th – 79th percentile
< 30th percentile
≥ 80th percentile = 50% Upward Efficiency Multiplier
< 15th percentile = 100% Downward Efficiency Multiplier
15th – 29th percentile = 50% Downward Efficiency Multiplier
August 2016
117
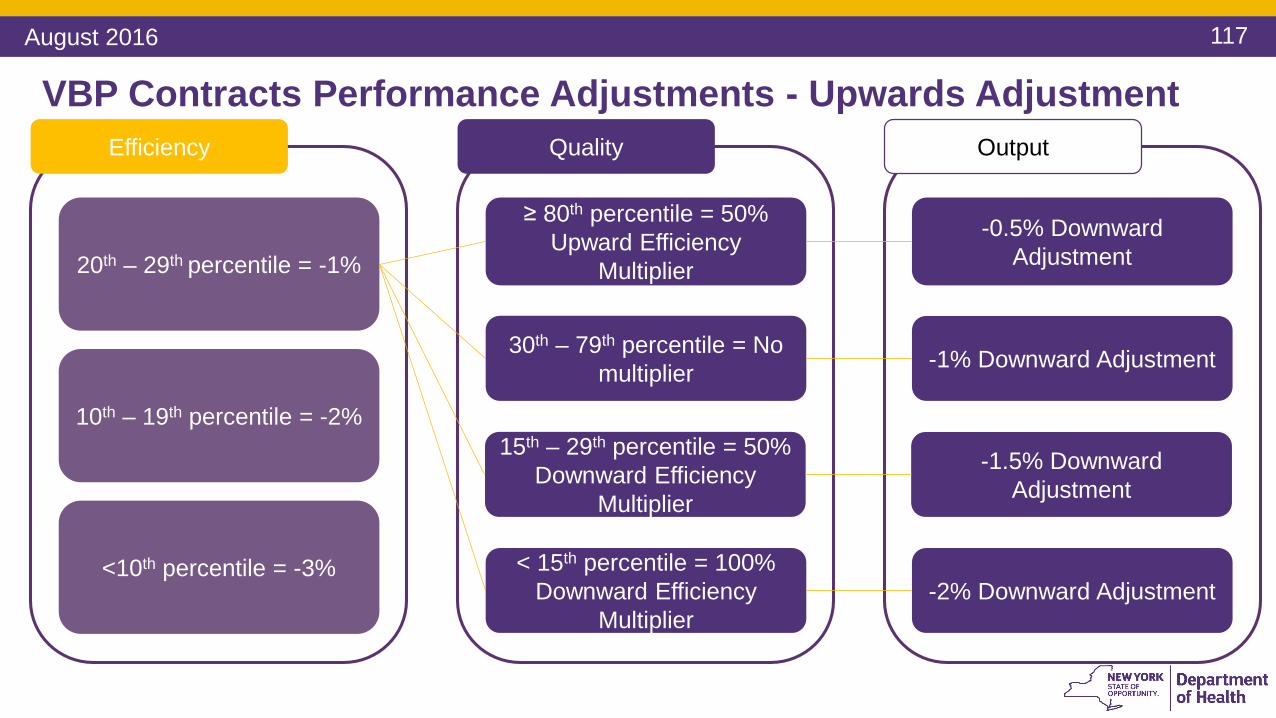
VBP Contracts Performance Adjustments - Upwards AdjustmentEfficiency
20th – 29th percentile = -1%
10th – 19th percentile = -2%
<10th percentile = -3%
Quality
≥ 80th percentile = 50% Upward Efficiency
Multiplier
30th – 79th percentile = No multiplier
Output
15th – 29th percentile = 50% Downward Efficiency
Multiplier
< 15th percentile = 100% Downward Efficiency
Multiplier
-0.5% Downward Adjustment
-1% Downward Adjustment
-1.5% Downward Adjustment
-2% Downward Adjustment
August 2016

118
VBP Contracts Performance Adjustments - Upwards AdjustmentEfficiency
20th – 29th percentile = -1%
10th – 19th percentile = -2%
<10th percentile = -3%
Quality
≥ 80th percentile = 50% Upward Efficiency
Multiplier
30th – 79th percentile = No multiplier
Output
15th – 29th percentile = 50% Downward Efficiency
Multiplier
< 15th percentile = 100% Downward Efficiency
Multiplier
-1% Downward Adjustment
-2% Downward Adjustment
-3% Downward Adjustment
-4% Downward Adjustment
August 2016

119
VBP Contracts Performance Adjustments - Upwards AdjustmentEfficiency
20th – 29th percentile = -1%
10th – 19th percentile = -2%
<10th percentile = -3%
Quality
≥ 80th percentile = 50% Upward Efficiency
Multiplier
30th – 79th percentile = No multiplier
Output
15th – 29th percentile = 50% Downward Efficiency
Multiplier
< 15th percentile = 100% Downward Efficiency
Multiplier
-1.5% Downward Adjustment
-3% Downward Adjustment
-4.5% Downward Adjustment
-6% Downward Adjustment
August 2016

120
First Target Budget Adjustment: Efficiency Ranking
Purpose: An efficiency ranking is applied to the baseline to reward providers that exhibit lower historic costs to keep them in VBP arrangements while
bringing higher cost providers closer to the State average.
Example:
VBP Contractor in the example. Above the 90th Percentile in efficiency.
For this example, the VBP Contractor is in the 90th Percentile for Efficiency. Thus there is a 3% efficiency adjustment.
August 2016

121
First Target Budget Adjustment: Quality Ranking
Purpose: The quality ranking rewards historically high-quality providers but also discourages providers from reducing costs to the
point where there is a deterioration of care.
Example:
VBP Contractor in the example. Between the 70th and 80th percentile
High performing
Low performing
For this example, assume the VBP Contractor is in the 70th Percentile for Quality. Thus there is no quality multiplier.
August 2016
122
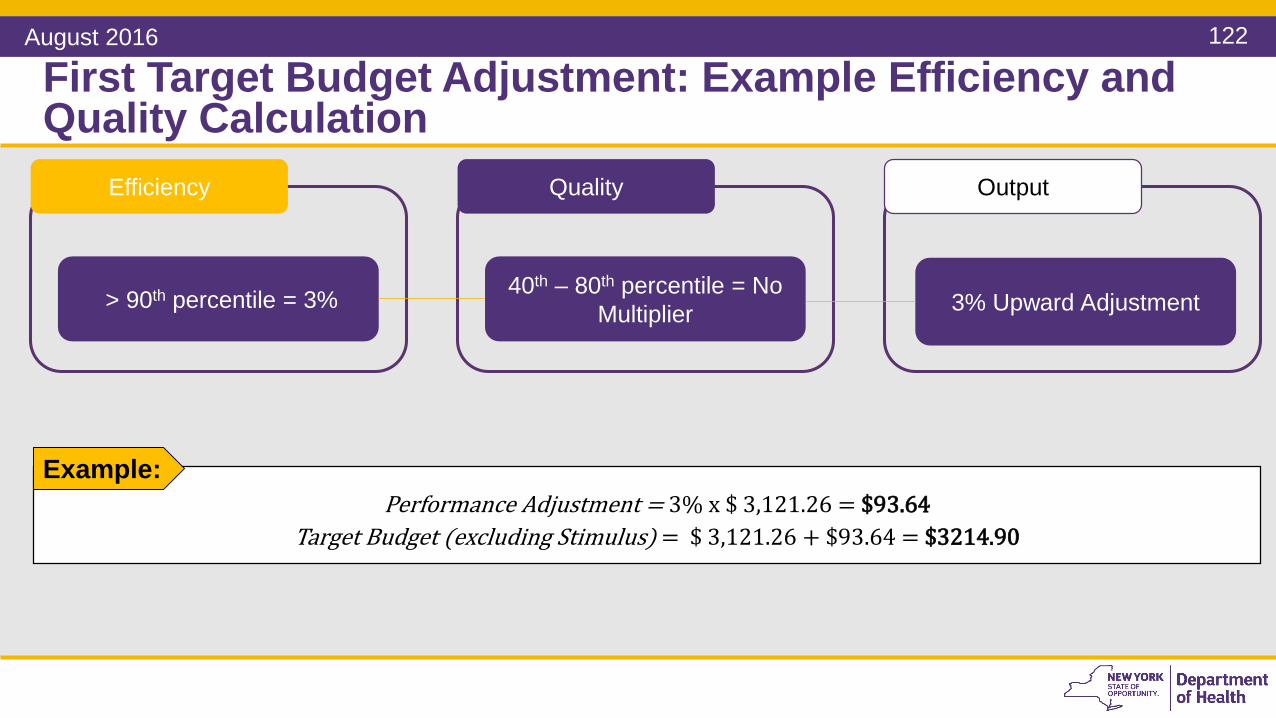
First Target Budget Adjustment: Example Efficiency and Quality Calculation
Example:Performance Adjustment = 3% x $ 3,121.26 = $93.64
Target Budget (excluding Stimulus) = $ 3,121.26 + $93.64 = $3214.90
Efficiency Quality Output
40th – 80th percentile = No Multiplier 3% Upward Adjustment> 90th percentile = 3%
August 2016
123
3 Years WeightedBaseline
Target Baseline
Performance Adjustments
Historic claims data
Stimulus Adjustment
(Through 2020)
Quality Adjustment
Efficiency Adjustment
Target Budget
Target Budget Components
Growth Trend
Risk Adjustment
Note: The Target Budget Setting process outlined here is only a guideline. Plans and VBP Contractors are free to negotiate their own Target Budget Setting Methodology, provided it meets the State’s
August 2016
124
Second Target Budget Adjustment: Stimulus Adjustment
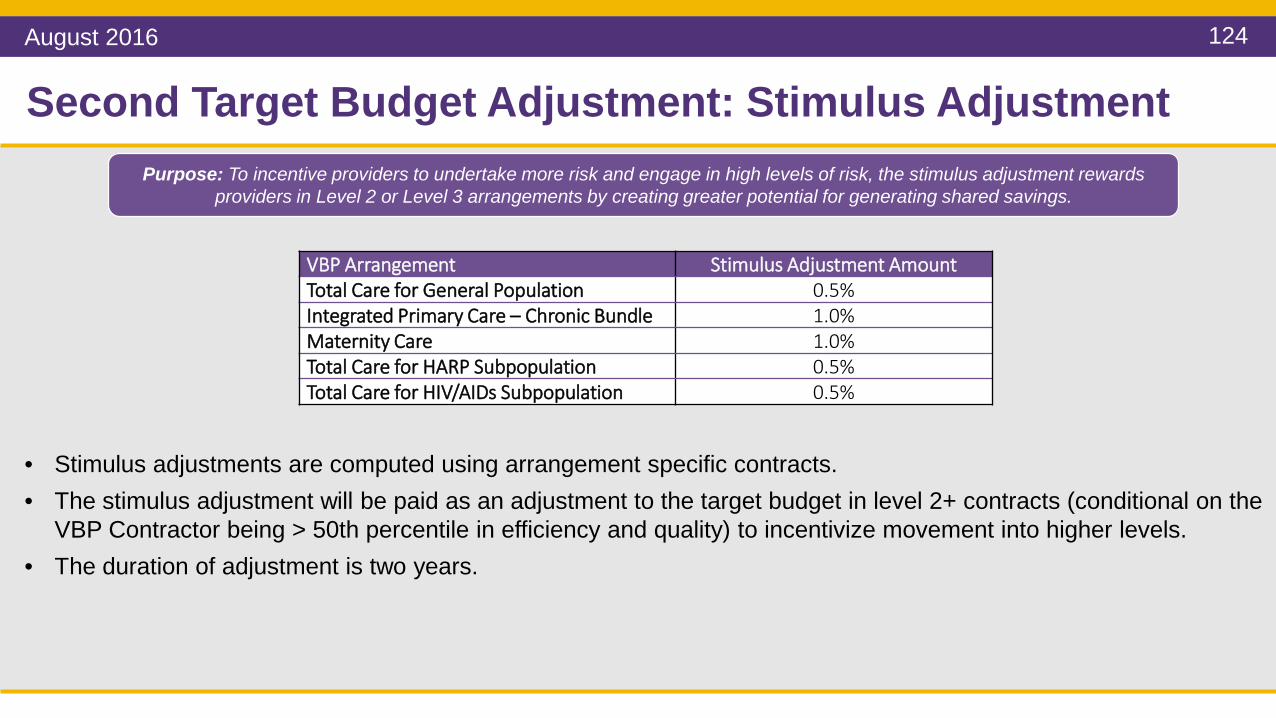
VBP Arrangement Stimulus Adjustment AmountTotal Care for General Population 0.5%Integrated Primary Care – Chronic Bundle 1.0%Maternity Care 1.0%Total Care for HARP Subpopulation 0.5%Total Care for HIV/AIDs Subpopulation 0.5%
• Stimulus adjustments are computed using arrangement specific contracts.• The stimulus adjustment will be paid as an adjustment to the target budget in level 2+ contracts (conditional on the
VBP Contractor being > 50th percentile in efficiency and quality) to incentivize movement into higher levels.• The duration of adjustment is two years.
Purpose: To incentive providers to undertake more risk and engage in high levels of risk, the stimulus adjustment rewards providers in Level 2 or Level 3 arrangements by creating greater potential for generating shared savings.
August 2016
125
Second Target Budget Adjustment: Example Stimulus Adjustment
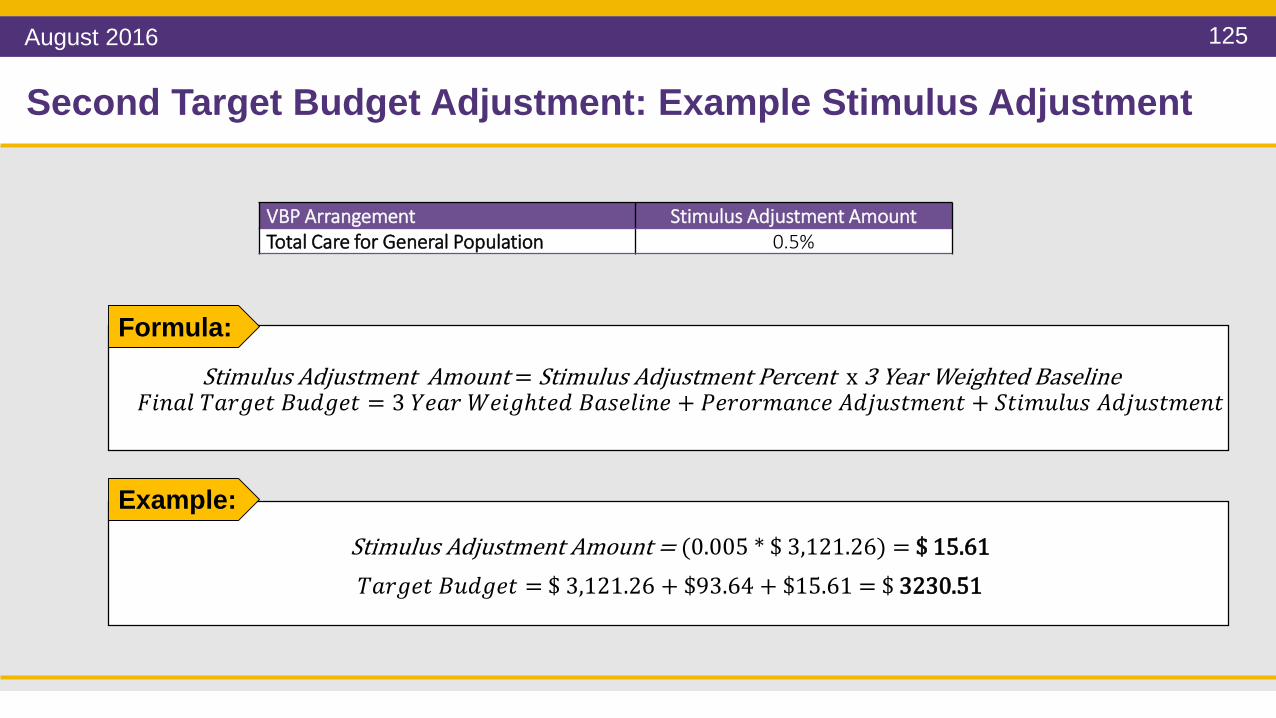
VBP Arrangement Stimulus Adjustment AmountTotal Care for General Population 0.5%
Formula:
Stimulus Adjustment Amount = Stimulus Adjustment Percent x 3 Year Weighted Baseline𝐹𝐹𝐹𝐹𝐹𝐹𝐹𝐹𝐹𝐹 𝑇𝑇𝐹𝐹𝑇𝑇𝑇𝑇𝑇𝑇𝑇𝑇 𝐵𝐵𝐵𝐵𝐵𝐵𝑇𝑇𝑇𝑇𝑇𝑇 = 3 𝑌𝑌𝑇𝑇𝐹𝐹𝑇𝑇 𝑊𝑊𝑇𝑇𝐹𝐹𝑇𝑇𝑊𝑇𝑇𝑇𝑇𝐵𝐵 𝐵𝐵𝐹𝐹𝐵𝐵𝑇𝑇𝐹𝐹𝐹𝐹𝐹𝐹𝑇𝑇 + 𝑃𝑃𝑇𝑇𝑇𝑇𝑃𝑃𝑇𝑇𝑃𝑃𝐹𝐹𝐹𝐹𝑃𝑃𝑇𝑇 𝐴𝐴𝐵𝐵𝐴𝐴𝐵𝐵𝐵𝐵𝑇𝑇𝑃𝑃𝑇𝑇𝐹𝐹𝑇𝑇 + 𝑆𝑆𝑇𝑇𝐹𝐹𝑃𝑃𝐵𝐵𝐹𝐹𝐵𝐵𝐵𝐵 𝐴𝐴𝐵𝐵𝐴𝐴𝐵𝐵𝐵𝐵𝑇𝑇𝑃𝑃𝑇𝑇𝐹𝐹𝑇𝑇
Example:Stimulus Adjustment Amount = (0.005 * $ 3,121.26) = $ 15.61𝑇𝑇𝐹𝐹𝑇𝑇𝑇𝑇𝑇𝑇𝑇𝑇 𝐵𝐵𝐵𝐵𝐵𝐵𝑇𝑇𝑇𝑇𝑇𝑇 = $ 3,121.26 + $93.64 + $15.61 = $ 3230.51
August 2016
126
3 Years WeightedBaseline
Target Baseline
Performance Adjustments
Historic claims data
Stimulus Adjustment
(Through 2020)
Quality Adjustment
Efficiency Adjustment
Target Budget
Target Budget Components
Growth Trend
Risk Adjustment
Note: The Target Budget Setting process outlined here is only a guideline. Plans and VBP Contractors are free to negotiate their own Target Budget Setting Methodology, provided it meets the State’s
August 2016

127
Questions
August 2016

128
Setting Shared Savings/Losses Percentages
VBP Arrangement Guideline
Level 1 • Starting point for shared savings percentage negotiations should be 50% of savings to be retained by providers, other 50% - by MCO
Level 2
• Starting point for shared savings percentage negotiations should be 90% of savings to be retained by providers, 10% by MCO
• Shared savings and losses percentages may be modified dependent on the type of risk protection mechanisms (such as stop loss or risk corridors) that are implemented to limit total provider risk.
Below is a guideline for the distribution of the shared savings. This should be subject to contract negotiations.
August 2016

129
Distribution of Shared Savings/Losses Amongst Providers
• Funds are to be distributed according to provider effort and provider performance in realizing the overall efficiencies, outcomes, and savings.
• Required investments and losses are taken into consideration.
• The relative budget of the comparative providers should not be the default distribution mechanism.
• The distribution of shared savings should follow the same principles as the distribution of shared losses.
• For shared losses, smaller providers, financially vulnerable providers or providers with a regulatory limitation on accepting certain losses (e.g. FQHCs) may be treated differently to protect these individual providers from financial harm. It is legitimate that this ‘special treatment’ would weigh in as an additional factor in determining the amount of shared savings that these providers would receive
Guiding Principles:
August 2016

130
Target budget ($ 3,121.26)
Modified target budget ($ 3,230.51)
$ pe
r bun
dle
or m
embe
r
Actual performance ($ 3,100)
Amount of Shared Savings With Modified Target Budget.
Performance Adjustment & Shared Savings
Effect of modifying the target budget on the amount of shared savings
In the first year (2017), only uptick adjustments will be available for VBP contractors entering into VBP contracts. The specific percentages and operational details mentioned below are directional. The State has the flexibility to adjust these in accordance with the integrity of the Medicaid Global Cap.
Shared Savings with out adjustments = $ 3,121.26 - $ 3,100 = $ 21.26
Shared Savings with adjustments = $ 3,230.51 - $ 3,100 = $ 130.51
Example:
August 2016

131
Questions
August 2016

132
Recap & Closing: What Have We Learned?
VBP Contracting Overview
• Types of contracting entities
• Types of VBP arrangements
• Contract Key Components
• Contracting with CBOs
• New Contract review process
Guidance on Target Budget
Setting
• Setting the Budget
• Performance Adjustments
Financial Risk Management
• Understanding the financial risk curve
• Manageable Provider Risk
• Stop Loss
VBP Contracting Panel
• Shared Lessons Learned
• Key Considerations for Success
Today, we have shared information on the following:
August 2016

133
Next SessionRegistration for Session 3 is open. It will close on September 5th. Links to Registration – click here:https://www.health.ny.gov/health_care/medicaid/redesign/dsrip/vbp_bootcamp/index.htm
Session Topics covered Date & Time LocationsSession 3 Performance Measurement
- Quality Measures- Understanding your performance: a
data-driven approach- MAPP and the VBP Dashboards
Monday, September 12, 201610.30AM - 3PM
Bronx Community College
August 2016

VBP Bootcamps Contact Info
Website: www.health.ny.gov/health_care/medicaid/redesign/dsrip/vbp_bootcamp
Twitter Account:@NYSMedicaidVBP

Thank you