VATTENFALL PRESENTATIONVATTENFALL PRESENTATION Johan ... Head of Investor Relations (acting) Credit...
48
VATTENFALL PRESENTATION Johan Gyllenhoff, Group Treasurer Tomas Björnsson, Head of Strategy and Market Intelligence Albrecht Bläsi-Bentin, Head of Investor Relations (acting) Credit Suisse Energy & Corporate Hybrids Conference, London, 6 June 2017
Transcript of VATTENFALL PRESENTATIONVATTENFALL PRESENTATION Johan ... Head of Investor Relations (acting) Credit...

VATTENFALL PRESENTATION Johan Gyllenhoff, Group Treasurer
Tomas Björnsson, Head of Strategy and Market Intelligence Albrecht Bläsi-Bentin, Head of Investor Relations (acting)
Credit Suisse Energy & Corporate Hybrids Conference, London, 6 June 2017

AGENDA
2
1 Company overview + strategy
2 Selected deep dives in Business Areas
3 Financials

WE POWER CLIMATE SMARTER LIVING
3
We will help power our customers to live free from fossil fuels
within one generation

4
VATTENFALL’S VALUE CHAIN
Energy services and decentralised generation
Vattenfall offers energy services, such as charging solutions for electric vehicles, solar panels, heat pumps and smart control of energy consumption. We also provide wholesale energy market services and access to marketplaces for customers that enable them to buy and sell electricity.
Sales of electricity, heat and gas
Vattenfall sells electricity, heat and gas to consumers and business customers. We focus on optimising the customer experience by offering different price and service models and by giving customers opportunities to reduce their environmental impact.
District heating
We are one of Europe’s largest producers and distributors of district heating, supplying households and industries in metropolitan areas. In partnership with cities and regions, we are driving the transformation towards fossil-free heating solutions.
Electricity distribution
Vattenfall operates electricity distribution networks in Sweden and Germany and has ongoing development of smart grid solutions which ensure security of supply. We enable customers to feed self-generated power into the network, becoming so-called “prosumers”. Electricity distribution is a regulated monopoly business monitored by national authorities.
Production
Vattenfall produces electricity from hydro power, nuclear power, coal, natural gas, wind power, solar power, biomass, and waste. Vattenfall is investing in more renewable generation and is phasing out fossil-based production.
We are striving to provide reliable and innovative energy solutions to meet our customers’ needs. Vattenfall’s ambition is to make a positive impact across its value chain.

One of Europe’s largest producers of electricity and heat
100% owned by the Swedish state
Main products: electricity, heat, gas, energy services
Main markets are Sweden, Germany, Netherlands, UK, Denmark and Finland
20,000 employees
5
VATTENFALL AT A GLANCE
Biomass, peat, waste
Wind power
Fossil-based power
Nuclear power
Hydro power
Vattenfall’s total electricity production in 2016: 119.0 TWh
Sweden 80.0 Biomass, waste 0.3 Wind power 1.0 Nuclear power 46.9 Hydro power 31.8
Finland 0.4 Hydro power 0.4
Denmark 1.0 Wind power 1.0
UK 2.0 Wind power 2.0
Netherlands 15.2 Wind power 0.4 Fossil-based power 14.7 Hydro power 0.1
Germany 20.6 Biomass, waste 0.5 Wind power 1.5 Fossil-based power 16.1 Hydro power 2.5
Net sales in 2016: SEK 139bn
Underlying operating profit1 in 2016: SEK 22bn
1) Underlying operating profit excluding items affecting comparability

2016- Towards a fossil-free future
6
VATTENFALL’S HISTORY
2010–2015 New strategic direction
2000-2009 Major expansion in Europe
1992 Vattenfall is commercialised
2008 Lehman brothers defaults
1999–2006 Acquisitions in Germany, Denmark and Poland
2010 New vision and clearer assignment from owner
2011–2015 Divestments of operations in Belgium, Germany, Finland, Poland and Denmark
1995 Sweden joins the EU
1990-2000 Part of developing the Swedish energy system
2016 Divestments of lignite operations in Germany
From a domestic Swedish hydro power generator to an European energy company.
1996 Deregulation of Swedish energy market
1999 Vattenfall acquires 25.1% of HEW
2009 Vattenfall acquires Nuon in the Netherlands
2011 Germany decides to stop nuclear by 2022
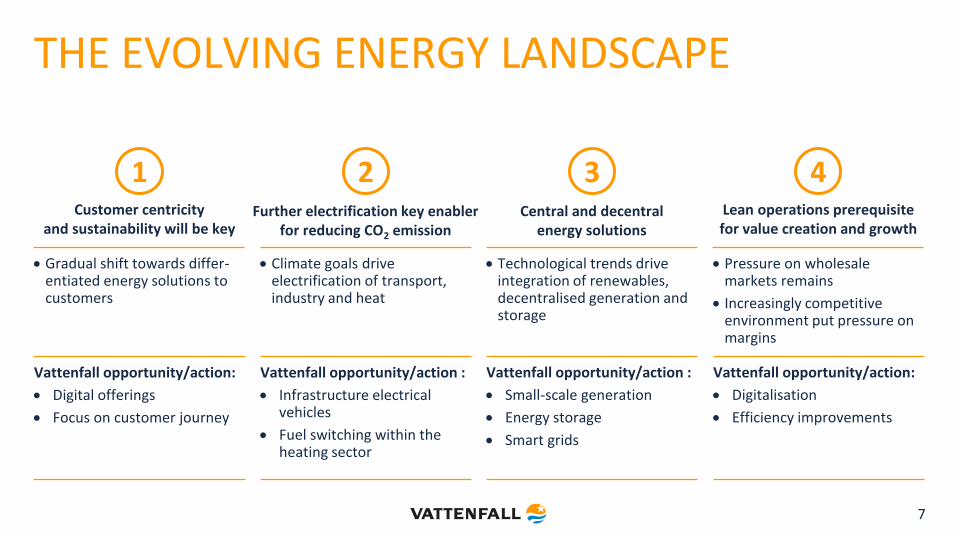
Further electrification key enabler for reducing CO2 emission
THE EVOLVING ENERGY LANDSCAPE
7
Gradual shift towards differ-entiated energy solutions to customers
Customer centricity and sustainability will be key
1 2 3 4 Central and decentral
energy solutions
Lean operations prerequisite for value creation and growth
Climate goals drive electrification of transport, industry and heat
Technological trends drive integration of renewables, decentralised generation and storage
Pressure on wholesale markets remains
Increasingly competitive environment put pressure on margins
Vattenfall opportunity/action :
Infrastructure electrical vehicles
Fuel switching within the heating sector
Vattenfall opportunity/action:
Digital offerings
Focus on customer journey
Vattenfall opportunity/action:
Digitalisation
Efficiency improvements
Vattenfall opportunity/action :
Small-scale generation
Energy storage
Smart grids

8
STRATEGY AND STRATEGIC TARGETS Our strategic objectives and prioritised areas Strategic targets to 2020 FY 2016
Grow in renewables, maintain efficient operations within hydro and nuclear
power and implement
our CO2 roadmap
Customer engagement, NPS +2 (Net Promoter Score) +7
Aggregated commissioned new renewables capacity 2016-2020: ≥2,300 MW
297
Absolute CO2 emissions, pro rata, continuing operations: ≤21 Mtonnes
Absolute CO2 emissions, pro rata, Total Vattenfall (incl. lignite)
23.2
67.6
ROCE: ≥9% (continuing operations) ROCE: ≥9% (Total Vattenfall)
0.5 -8.5
Safety as LTIF (Lost Time Injury Frequency): ≤1.25 2.0
Employee Engagement Index: ≥70% 57
1
2
3
4
5
6
Increase customer centricity and build a sizable position in decentralized energy
Develop culture, competence and brand
Reduce costs and improve operational efficiency

WE SEE MANY GROWTH OPPORTUNITIES
9
Grow
Customer attractiveness Long term viability Strong Vattenfall capabilities Attractive returns
• Wind • Solar • District heating
• Regulated • Non-regulated • Services
• Trading • Aggregation
Optimization Marketing
• Electricity retail • Decentralised
solutions** • Storage
Keep and develop
Long term viability – Limited growth opportunities
• Hydro • Nuclear • Gas condensing • Hard coal CHP*
• Gas retail
Non core
– Limited long term viability – Not supporting the transition
• Hard coal condensing
• Lignite
Commodity sales and decentralised solutions
Wholesale markets Grids Central Production
** E.g. aggregation services, heat pumps and solar panels
Actions
* Hard coal CHP to be converted to gas end of economic life time
10
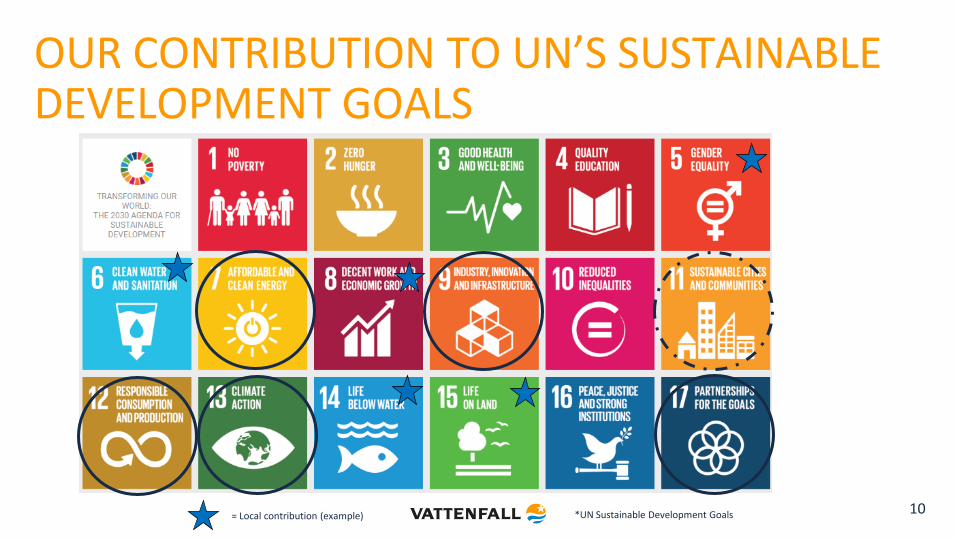
OUR CONTRIBUTION TO UN’S SUSTAINABLE DEVELOPMENT GOALS
*UN Sustainable Development Goals = Local contribution (example)

11
CORNERSTONES TOWARDS CLIMATE NEUTRALITY
426
300
165
Vattenfall 2015 Peer average * Vattenfall 2016
Specific CO2 (g/kWh)
from
50%
fossil power
Climate neutrality 2050 Climate neutrality Nordic 2030
Continued CO2 phase out Supporting our partners Portfolio transformation Major shift in 2016 following lignite divestment
Ongoing initiatives support the targeted ambition
Enabling partners to reach climate targets
Phase out of coal, e.g., Klingenberg conversion
Efficient gas-fired CHPs
New smart energy and heat solutions
Electrification of industrial processes and transport
Life Cycle Analysis and Environmental Performance Declarations
Cooperate with partners, suppliers cities and customers to set joint CO2 targets
Preliminary numbers for 2016 (incl. heat). Vattenfall absolute CO2 2015: 84 MT, 2016: 23 MT*Source: Company reports 2015 –RWE, Enel, E.ON, EDP, EnBW, Iberdrola, DONG, Fortum, Centrica, EDF, Statkraft
to

12
BUSINESS AREAS
Heat
Customers & Solutions
Wind
Generation
Markets
Distribution
… an operator of high quality
networks with superior service
to enable a sustainable
energy society
…the best partner for customers &
communities where we jointly
develop sustainable district heating solutions
… a leading developer and
operator of wind power in our
markets
… a trusted provider of wholesale
market services, and responsible
trader
… a leading operator of safe
and efficient large-scale low CO2
emitting production
... a supplier of a full range of
energy management products and
services to B2B and B2C
customers

13
OUR CUSTOMER BASE IS GROWING (2016)
6,340,000 electricity customers
2,190,000 gas customers
2,040,000 heat customers
3,270,000 electricity network customers
+ 70,000 customers (2016)
Strong Net Promoter Score development
Lowered Cost to Serve
Innovative product launches
+ 20,000 customers (2016)
High quality focus
Growth driven by urbanization
Deployment of digital grid solutions for improved service, quality and more renewables
+ 29,000 customers (2016)
Less than 1% churn
Strong political support
Attractive growth potential with solutions orientation
Customers & Solutions Heat Distribution

14
3 AREAS WHERE DIGITALIZATION IS KEY
Opportunities
Customer experience
Digital talent and utility knowledge
Digital platform
Culture and governance Enablers
Examples
Operational excellence New business models
InCharge
Alltid.se
O&M optimization
Predictive maintenance
Power peers
Micro grids
4 Lean operations prerequisite for value creation and growth

CHALLENGING MARKET CONDITIONS
15
0
10
20
30
40
50
60
70
80
90
100
2007 2008 2009 2010 2011 2012 2013 2014 2015 2016
EUR/MWh
Germany Nordpool SYS
Source: EEX
China induced commodity boom
High fuel prices
Low coal prices, strong hydro
supply
Financial crisis
Fukushima
Increase of German renewables, dropping
CO2 prices, lower demand
Challenging market conditions in previous years, with depressed electricity prices, has lead to impairments.
15
0
-5
10
20
25
5
30
35
40
5.5
2009
4.2
2010 2012
10.0
23.8
1.5
0.7
22.0
2011
30.1
-0.3
12.3
3.0
6.6
8.3
3.7
8.6
10.5
2013
2.5
10.9
4.3
4.1
2016
0.1
2014
36.3
32.9
28.9
17.0
2015
19.3
3.5 0.0
0.4
0.1
9.8
SEK bn
Other
Renewable assets Nuclear
Goodwill Thermal assets
Total impairments of SEK 160.3bn Front year contract price (EUR/MWh)

Commodity prices Electricity futures Spot power prices average
Nordic spot prices 30% higher vs. Q1 2016 mainly owing to stronger fuel prices and a weaker hydrological balance
Stronger fuel prices pushed German and Dutch spot prices to approx. 65% and 55% higher respectively vs. Q1 2016
Electricity futures prices higher in all of Vattenfall’s markets mainly owing to recovery in coal and gas prices
Recovery of coal and gas prices, lower prices of CO2 allowances 16
5
15
25
35
45
55
65
2015 2016 2017
EPEX APX NordPool
5
15
25
35
45
55
65
2015 2016 2017
EEX 2018 EEX 2019
ICE 2018 ICE 2019
NPX 2019 NPX 2020
0
5
10
15
20
25
30
20
30
40
50
60
70
80
2015 2016 2017
Coal (USD/t), API2, Front YearEmission allowances CO2 (EUR/t), MidDecGas (EUR/MWh), TTF, Front Year
EUR/MWh EUR/MWh USD EUR
IMPROVED RECENT PRICE DEVELOPMENT DRIVEN BY STRONGER FUEL PRICES

STABILISED FINANCIAL DEVELOPMENT
17
Debt Sales and underlying EBIT
0
5
10
15
20
25
30
0
50
100
150
200
SEK bn SEK bn
Net sales (scale on left)
Underlying EBIT (scale on right)
2016 2014 2013 2015 2012 20
40
60
80
0
50
100
150
200
% SEK bn
Net debt
Adjusted net debt
Debt/equity ratio, net (%)
2012 2013 2014 2015 2016
Earnings and return
-10
-5
0
5
10
-50
0
50
100
150
200
% SEK bn
Profit for the year attributable to the owners of the parent
Return on capital employed (%)
Return on capital employed, excluding IAC (%)
2013 2014 2015 2016 2012
After several years of challenging market conditions leading to recognition of substantial impairment losses and pressure on profitability, profit levels have now stabilised.

THREE EVENTS HAS IMPROVED OUR RISK PROFILE
18
Events in 2016
Lignite divestment– reduced exposure to power prices, fossil-based generation and CO2.
Swedish energy agreement – The elimination of the nuclear capacity tax (EBITDA effect of ~SEK 3bn p.a.) and substantial reduction of the real-estate tax for hydro power plants (EBITDA effect of ~SEK 2bn p.a.) are essential for future competitiveness.
German nuclear fund– regulatory clarity on the externalisation of liabilities for interim and final storage to be transferred to the state. Law passed by German parliament, EU approval pending.
Key focus areas
Continued safe, reliable and efficient nuclear and hydro power. Focus on operational excellence across the fleet. Continue modernization program in hydro.
Increase flexibility in the power plants.
Responsible decommissioning and dismantling of R1 (2020) and R2 (2019) and German nuclear (all German reactors to be closed by 2022).
Highlights 2016
Akkats
Completion of
Refurbishment and
expansion
Forsmark
Strategic investments
Krümmel and Brunsbüttel
Defueling

19
A NEW VATTENFALL IS TAKING SHAPE A new Vattenfall is taking shape, both from a strategic and financial perspective.
Vattenfall has moved from a heavy fossil-based production towards a more sustainable porfolio in 2016
Regulated
Quasi-regulated
Non-regulated
2020
~23%
~47%
~30%
2015
~25%
~32%
~43%
24%33%
19%
33%
52%
29%
2016
1% 5%
2015
1% 4%
Vattenfall production mix 2015-2016 Vattenfall future value pools - EBITDA
Biomass and waste
Wind power
Hydro power
Nuclear power
Fossil-based power
… and are further moving towards more quasi-regulated business with more limited risk exposure going forward

AGENDA
20
1 Company overview + strategy
2 Selected deep dives in Business Areas
3 Financials

Horns Rev 3
Sandbank
Aberdeen
Danish Kriegers Flak
Danish Near Shore
Norfolk Vanguard
Alpha Ventus
Kentish Flats Extension
Utgrunden
Lillgrund
Sandbank Plus Horns Rev 1
Dan Tysk
Norfolk Boreas
Thanet Kentish Flats
Thanet Extension
Ormonde
Egmond aan Zee
18
9
6
2
14
WIND POWER – GEOGRAPHICAL FOOTPRINT
Offshore project in operation
Offshore project in development
Number of onshore projects country wide
21
636
121108158
590
19
257281246258
DE SE NL DK UK2
Onshore (1,061 MW) Offshore (1,613 MW)
2,674 MW Operating capacity1 Q1 2017
1) Total capacity of the wind farms that Vattenfall has an ownership in. Minority shares included as 100%. 2) Including 5 MW solar in onshore capacity
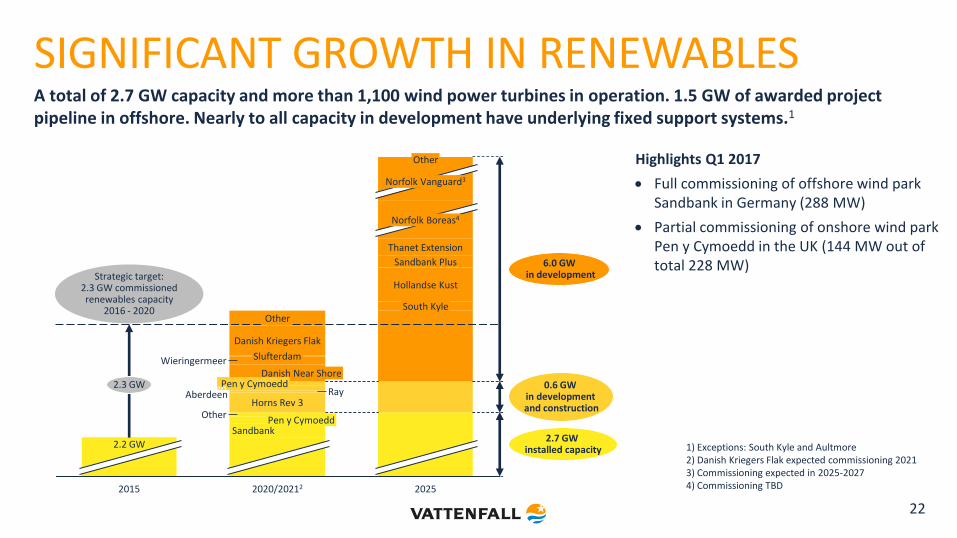
Highlights Q1 2017
Full commissioning of offshore wind park Sandbank in Germany (288 MW)
Partial commissioning of onshore wind park Pen y Cymoedd in the UK (144 MW out of total 228 MW)
22
6.0 GW in development
Other
2015
2.2 GW
South Kyle
Hollandse Kust
Sandbank Plus
Thanet Extension
Norfolk Boreas4
2.7 GW installed capacity
Norfolk Vanguard3
0.6 GW in development and construction
2.3 GW
2025 2020/20212
Wieringermeer Danish Near Shore
Pen y Cymoedd Aberdeen
Other
Horns Rev 3 Other
Pen y Cymoedd Sandbank
Danish Kriegers Flak
Slufterdam
Ray
1) Exceptions: South Kyle and Aultmore 2) Danish Kriegers Flak expected commissioning 2021 3) Commissioning expected in 2025-2027 4) Commissioning TBD
Strategic target: 2.3 GW commissioned renewables capacity
2016 - 2020
A total of 2.7 GW capacity and more than 1,100 wind power turbines in operation. 1.5 GW of awarded project pipeline in offshore. Nearly to all capacity in development have underlying fixed support systems.1
Aberdeen
SIGNIFICANT GROWTH IN RENEWABLES

Growth strategy in solar decided in Q1 2017, consisting of two pillars
1. Decentralized solar PV & storage Offering solutions for commercial and residential customers. Besides winning new customers Vattenfall will also leverage the existing customer base of 6 million.
2. Large-scale solar Installing solar PV at our wind farms or other existing sites offers synergies from using joint grid connections and infrastructure.
Strategic fit with Vattenfall’s purpose and strategy
Solar PV powers climate smarter living
Substantial experience in solar PV and storage already gained
Attractive growth in our main markets, notably the Netherlands
Leverage on synergies by installing solar PV at existing wind farms by using joint grid connection, infrastructure etc.
23
GROWING IN BOTH LARGE SCALE AND DECENTRALISED SOLAR PV

24
Gold rating for Vattenfall’s sustainability performance by EcoVadis1
Increase of customer base by ~95,000 contracts and strong NPS2 value
Vattenfall to provide CO2 neutral district cooling to GE Healthcare in Uppsala
Chinese high-tech company Canaan Creative chooses Vattenfall as energy supplier for a datacenter in Boden
Vattenfall acquired 35% of BrainHeart Energy Sweden, largest supplier of geothermal solutions to private customers in Sweden
1) EcoVadis methodology based on CSR standards such as GRI (Global Reporting Initiative), UN Global Compact and ISO 26000. 2) Net Promoter Score (NPS) is a score ranging from -100 to 100 that measures the willingness of customers to recommend a company’s products or services to others.
Highlights Q1 2017
8.0009.000
Heat Distribution Customers & Solutions
78 000
Customer growth Q1 2017 (approx. number of customers)
MAKING PROGRESS IN CUSTOMER GROWTH AND SUSTAINABILITY RATINGS
25
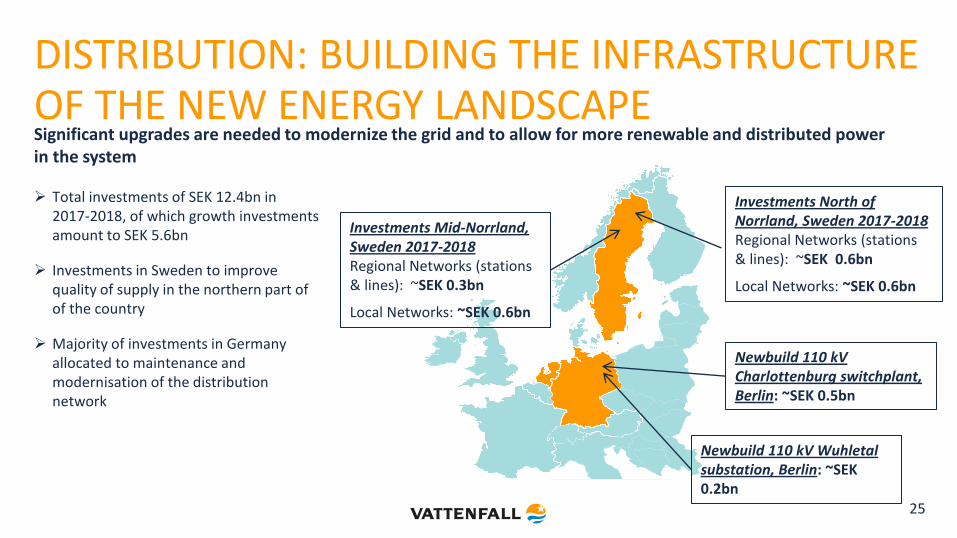
Investments Mid-Norrland, Sweden 2017-2018 Regional Networks (stations & lines): ~SEK 0.3bn
Local Networks: ~SEK 0.6bn
Investments North of Norrland, Sweden 2017-2018 Regional Networks (stations & lines): ~SEK 0.6bn
Local Networks: ~SEK 0.6bn
Newbuild 110 kV Charlottenburg switchplant, Berlin: ~SEK 0.5bn
Newbuild 110 kV Wuhletal substation, Berlin: ~SEK 0.2bn
Total investments of SEK 12.4bn in 2017-2018, of which growth investments amount to SEK 5.6bn
Investments in Sweden to improve quality of supply in the northern part of of the country
Majority of investments in Germany allocated to maintenance and modernisation of the distribution network
Significant upgrades are needed to modernize the grid and to allow for more renewable and distributed power in the system
DISTRIBUTION: BUILDING THE INFRASTRUCTURE OF THE NEW ENERGY LANDSCAPE

HEAT: POTENTIAL FOR PROFITABLE GROWTH
26
100%
52%
30%
100%
12%
30%
49%
2%
100%
4%
86%
4%
Other District Heating
Oil
Gas
Renewables, heat pumps
Netherlands <15% DH in
cities
Germany 20-30% DH in
Berlin and Hamburg
Sweden ~80% DH in Uppsala
and Stockholm
Netherlands – young DH market Strong growth in Amsterdam and surroundings (+6% p.a.) Ambition to replace gas by 2050; an opportunity for district heating
growth District heating with high usage of third party heat sources (waste, etc.),
growth of heat pumps
Germany – developing DH market Hamburg and Berlin “boom” towns of the future District heating based on climate neutral solutions in densely populated
areas; modern decentralised solutions (gas based, heat pumps) replacing old oil and gas boilers elsewhere
Sweden – mature DH market Strong growth in metropolitan areas expected (esp. Stockholm, Uppsala) District heating providing CO2-free base supply, heat pumps taking
larger market share
Residential heat market structure1
Our (current) footprint
1) Source: Vattenfall analysis
A well balanced market mix allows Vattenfall to capitalize on growth opportunities

Increase in nuclear production and high availability
Positive regulatory developments
Swedish energy agreement concretized in the form of Government propositions to parliament
Abolishment of capacity tax
Payments to the nuclear waste fund over 50 years operational lifetime and broader investment mandate
27
0
2
4
6
8
10
12
14
16
7.1
8.5
Q1 2016
15.3
6.8
Q1 2017
6.5
13.6
TWh
60
40
0
20
100
80
%
Q1 2017
98.4
77.7
96.0
Q1 2016
99.9
Forsmark Ringhals
Production Availability
GENERATION: STRONG PERFORMANCE IN NUCLEAR AND IMPROVED REGULATIONS

GENERATION: LIABILITY FOR NUCLEAR WASTE COSTS IN GERMANY
Financial consequences for Vattenfall
• Expected transfer of EUR 1.8bn (SEK 17.0bn)
– Base amount EUR 1.3bn (SEK 12.3bn)
– Risk premium + interest EUR 0.5bn (SEK 4.7bn)
Impact in Vattenfall’s accounts in Q4 2016
• Negative impact on earnings of SEK 5.4bn1, relating to the risk premium and interest
• Adjusted net debt increased by SEK 4.7bn1
Background
• Nuclear power operators to shift their liability for nuclear waste costs through payment into a public fund
• Approved law by German parliament
• EU approval of the law expected in Q2 2017
• Payment will happen once the fund has been implemented, not earlier than 1 July 2017
• Unrelated to the arbitration proceeding at the International Centre for Settlement of Investment Disputes (ICSID), where a decision is expected in mid 2017
Summer 2015
October 2015
April 2016
December 2016
Stress test Review report published
Recommendation by German nuclear
commission
Law passed by German parliament
EU approval expected in Q2 2017
Payment into the fund
28
July 2017
1) The difference of SEK 0.7bn (5.4-4.7) is explained by the fact that EBIT effect includes 100% Brunsbüttel due to full consolidation, whereas adjusted net debt only considers the pro rata shares
AGENDA
29
1 Company overview + strategy
2 Selected deep dives in Business Areas
3 Financials
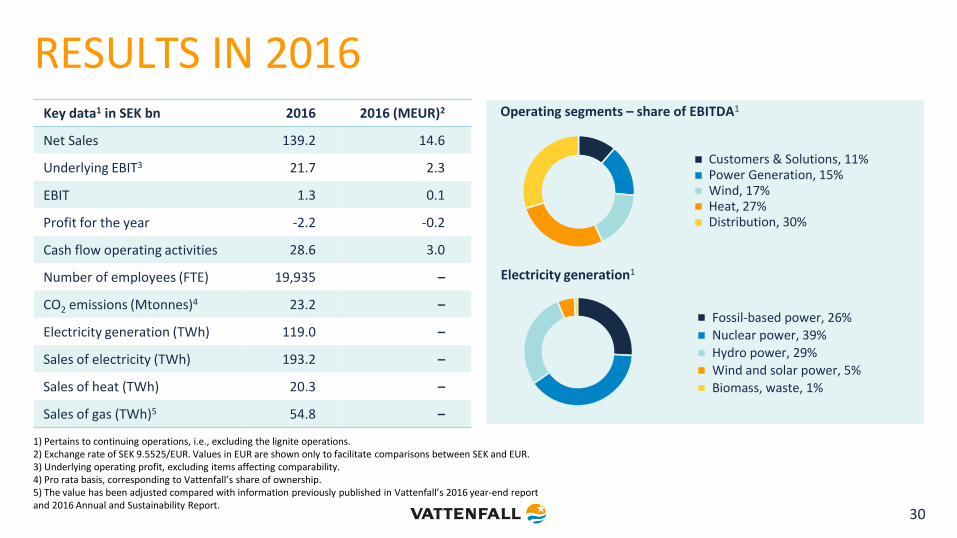
RESULTS IN 2016
30
Key data1 in SEK bn 2016 2016 (MEUR)2
Net Sales 139.2 14.6
Underlying EBIT3 21.7 2.3
EBIT 1.3 0.1
Profit for the year -2.2 -0.2
Cash flow operating activities 28.6 3.0
Number of employees (FTE) 19,935 –
CO2 emissions (Mtonnes)4 23.2 –
Electricity generation (TWh) 119.0 –
Sales of electricity (TWh) 193.2 –
Sales of heat (TWh) 20.3 –
Sales of gas (TWh)5 54.8 –
Operating segments – share of EBITDA1
Customers & Solutions, 11% Power Generation, 15% Wind, 17% Heat, 27% Distribution, 30%
Electricity generation1
Fossil-based power, 26% Nuclear power, 39%
Hydro power, 29%
Wind and solar power, 5%
Biomass, waste, 1%
1) Pertains to continuing operations, i.e., excluding the lignite operations. 2) Exchange rate of SEK 9.5525/EUR. Values in EUR are shown only to facilitate comparisons between SEK and EUR. 3) Underlying operating profit, excluding items affecting comparability. 4) Pro rata basis, corresponding to Vattenfall’s share of ownership. 5) The value has been adjusted compared with information previously published in Vattenfall’s 2016 year-end report and 2016 Annual and Sustainability Report.

Stable underlying EBIT, SEK bn Lower debt levels, SEK bn
31
Stable underlying EBIT development: lower production margins in the Power Generation operating segment was mitigated by higher earnings contribution from the wind and heat operations
Lower reported EBIT mainly attributable to a one-time gain from divestments in Q1 2016 (SEK 1.8 billion) and lower valuation of derivatives (SEK -2.0 billion) and inventories (SEK -0.5 billion) in Q1 2017 as a result of weaker commodity prices (no cash effect)
Lower net debt and adjusted net debt vs. Q1 2016
Stable FFO adjusted for positive tax effect in Q1 2016. Cash flow from operating activities impacted by seasonally negative cash flow from changes in working capital
Continued efficiency measures across the full operations + support units
Q1 2017
6.0 8.3
Q1 20161
10.2 8.3
Q1 2017
127.1
54.7
Q1 2016
137.4
60.7
Adjusted net debt Net debt
Q1 2017
-1.2
8.2
Q1 20161
-4.2
8.6
Cash flow operating activities FFO
Seasonal effects on cash flow, SEK bn
EBIT Underlying EBIT
1) Excluding lignite
Q1 2017 FINANCIAL HIGHLIGHTS

32 1) Last 12 months 2) Excluding lignite
SEK bn Q1 2017 Q1 20162
Net Sales 40.1 41.6
EBITDA 9.7 13.7
Underlying EBIT 8.3 8.3
EBIT 6.0 10.2
Financial items, net -1.0 -1.6
Profit for the period 3.8 6.8
Cash flow (FFO) 8.2 8.6
Cash flow operating activities -1.2 -4.2
Net debt 54.7 60.7
Adjusted net debt 127.1 137.4
FFO/adjusted net debt (%) 20.91 19.71
Adjusted net debt/EBITDA (times) 5.51 4.21
Q1 2017 FINANCIAL OVERVIEW

ITEMS AFFECTING COMPARABILITY
33
SEK bn Q1 2017 Q1 20161
Capital gains 0.2 1.8
Capital losses - -0.1
Impairment losses - -
Reversed impairment losses - -
Provisions - -
Unrealised changes in the fair value of energy derivatives -2.0 0.4
Unrealised changes in the fair value of inventories -0.5 0.2
Restructuring costs - -0.3
Other items affecting comparability - -0.1
Total -2.3 1.9
Unrealized changes in the fair value of
energy derivatives (SEK -2.0 billion) and
inventories (SEK -0.5 billion) pertain
mainly to temporary effects related to
sourcing activities
Capital gains of SEK 1.8bn in Q1 2016
pertain to the sales of the network
services operations in Hamburg and the
sale of property in Bramfeld
1) Excluding lignite

UNDERLYING EBIT PER OPERATING SEGMENT
SEK bn Q1 2017 Q1 20162
Customers & Solutions 0.7 0.8
Power Generation 2.6 2.9
Wind 0.9 0.7
Heat 2.2 2.1
Distribution 2.2 1.9
Other1 -0.1 -
Eliminations -0.2 -0.1
Total 8.3 8.3
34
Customer & Solutions: Almost on par with previous year
Power Generation: Lower production margins resulting from average lower prices achieved and lower production volumes in hydro. Higher realised result contribution from sourcing and trading activities
Wind: New capacity added (Sandbank in Germany, Ray and Pen Y Cymoedd in the UK)
Heat: Lower operating expenses and lower depreciation as a result of the impairments in 2016
Distribution: Increased revenues as a result of lower number of power outages and higher network tariffs in Sweden and Germany
1) “Other” pertains mainly to all Staff functions, including Treasury and Shared Service Centres 2) Excluding lignite

FINANCIAL TARGETS
Financial metric Target Q1 2017 Q1 20162
Return on Capital Employed (ROCE)1
(ROCE excl. items affecting comparability) 9%
-1.1
(8.6) -1.0
(7.6)
FFO/adjusted net debt1 22-30% 20.9 19.7
Net debt/equity 50-90% 62.6 48.8
Dividend policy (% of the year’s profit after tax) 40-60% - -
35 1) Last 12 months 2) Excluding lignite
127176
55
141
0
100
200
300
20
10
0
30
% SEK bn
Q1 2017
21
2011
22
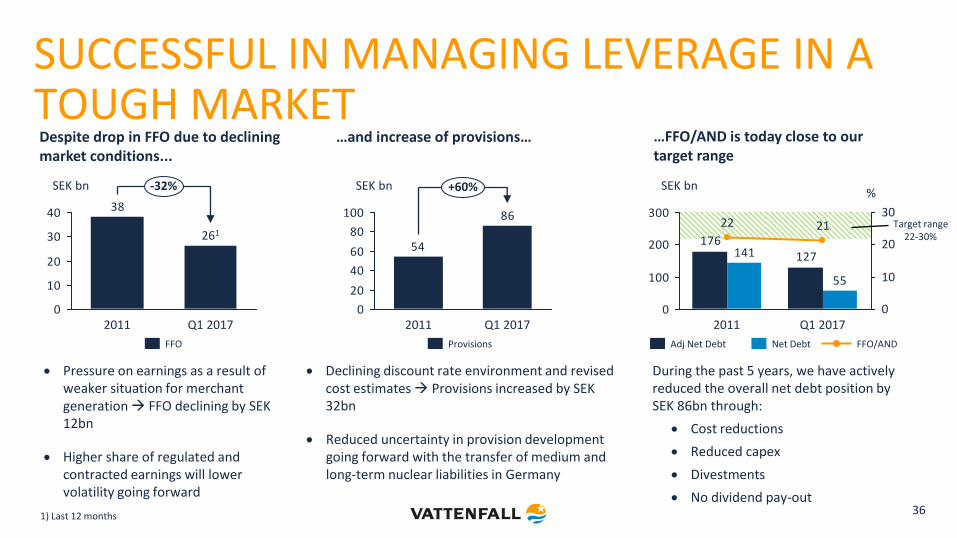
SUCCESSFUL IN MANAGING LEVERAGE IN A TOUGH MARKET
36
38
0
10
20
30
40
SEK bn -32%
Q1 2017
261
2011
FFO FFO/AND Net Debt Adj Net Debt
Despite drop in FFO due to declining market conditions...
Pressure on earnings as a result of weaker situation for merchant generation FFO declining by SEK 12bn
Higher share of regulated and contracted earnings will lower volatility going forward
54
86
0
20
40
60
80
100
SEK bn +60%
Q1 2017 2011
Provisions
Declining discount rate environment and revised cost estimates Provisions increased by SEK 32bn
Reduced uncertainty in provision development going forward with the transfer of medium and long-term nuclear liabilities in Germany
…and increase of provisions… …FFO/AND is today close to our target range
During the past 5 years, we have actively reduced the overall net debt position by SEK 86bn through:
Cost reductions
Reduced capex
Divestments
No dividend pay-out
Target range 22-30%
1) Last 12 months

IMPAIRMENT HISTORY 2009 – Q1 2017
37
2009 2010 2011 2012 2013 2014 2015 2016 Total
The Netherlands Thermal assets 4.31 0.42 8.62 14.7 2.6 2.8 33.4 Trading 6.51 10.01 0.7 17.2 Other 1.2 1.2 1.52 1.9 5.8
Germany
Thermal assets 0.3 4.3 5.7 19.2 26.1 55.6 Nuclear assets 10.5 10.5 Transmission 5.1 5.1 Other 0.1 1.1 0.3 2.3 3.8
The Nordic Countries
Renewable assets 1.4 0.1 1.5 Thermal assets 4.1 3.0 0.1 7.2 Nuclear assets 17.0 0.4 17.4 Other 0.3 0.3
UK Renewable assets 1.1 0.2 1.3 Not allocated 0.2 0.5 0.1 0.8 Impairment Liberia 1.3 1.3 Impairments; shares in Enea S.A. Poland 2.4 2.4 Impairments; shares in Brokdorf and Stade 1.1 1.1 Impairments 5.5 11.1 11.3 12.3 30.1 23.8 36.8 33.8 164.7 Reversed impairment losses -1.3 -1.3 -0.4 0.0 0.0 0.0 -0.5 -0.9 -4.4 Impairments (net) 4.2 9.8 10.9 12.3 30.1 23.8 36.3 32.9 160.3
1) Impairment of goodwill 2) Impairment of assets and goodwill

Before lignite divestment After lignite divestment
38
Electricity price
price
time
“Variable fuel cost” (gas, coal, CO2)
Electricity price
price
time
“Fixed fuel cost” (lignite)
From fixed fuel to
variable fuel dominated in
Germany
123
31
Base load
Condensing coal & gas
Renewables
160 7
82
7 31
119 Renewables
Condensing coal & gas
Base load
Group base load
production hours reduced
by ~33%
Continental/UK
51%
Nordic
49% Continental/UK 32%
Nordic
68%
C/UK power production
share reduced from 49% to
32%
TWh 2016
TWh 2016
TWh 2016
TWh 2016
Lower hedge ratio
Hedging primarily Nordic exposure
Hedging closer to delivery
ADAPTING THE HEDGE STRATEGY TO CHANGING POWER PRICE EXPOSURE

PRICE HEDGING
39
Vattenfall continuously hedges its future electricity generation through sales in the forward and futures markets. Spot prices therefore have only a limited impact on Vattenfall’s earnings in the near term.
Estimated Nordic hedge ratio (%) and indicative prices
Average indicative Nordic hedge prices
Sensitivity analysis – Continental portfolio
28 29 36
14%
42%
63%
2020 2019 2018
Market quoted
+/- 10% impact on future profit before tax, MSEK1
Observed yearly volatility
2017 2018 2019
Electricity +/- 275 +/- 391 +/- 742 22% - 23%
Coal -/+ 7 -/+ 221 -/+ 214 31% - 32%
Gas -/+ 146 -/+ 395 -/+ 371 25% - 27%
CO2 -/+ 21 -/+ 59 -/+ 67 54% - 55%
1) The denotation +/- entails that a higher price affects operating profit favourably, and -/+ vice versa
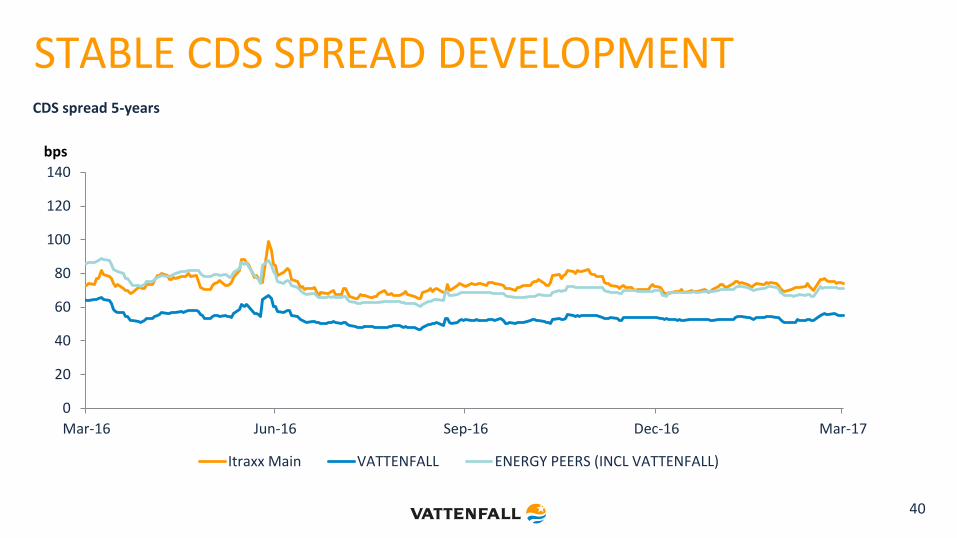
STABLE CDS SPREAD DEVELOPMENT
40
0
20
40
60
80
100
120
140
Mar-16 Jun-16 Sep-16 Dec-16 Mar-17
Itraxx Main VATTENFALL ENERGY PEERS (INCL VATTENFALL)
CDS spread 5-years
bps

Group liquidity MSEK
Cash and cash equivalents 18,010
Short term investments 21,298
Reported cash, cash equivalents & short term investments
39,308
Unavailable liquidity1 -6,998
Available liquidity 32,310
Committed credit facilities Facility size MSEK
RCF (maturity Dec 2021) 2,000
MEUR
19,064
Total undrawn 19,064
Debt maturities2 MSEK
Within 90 days 5,352
Within 180 days 6,216
1) German nuclear ”Solidarvereinbarung” 3,245 MSEK, Margin calls paid (CSA) 2,550 MSEK, Insurance “Provisions for claims outstanding” 1,202 MSEK
2) Excluding loans from minority owners and associated companies
41
CONTINUED STRONG LIQUIDITY POSITION

DEBT DEVELOPMENT
0
25
50
75
100
125
150
175
2003
0.0
6.2
01
3
31
.03
.20
13
30
.09
.20
13
31
.03
.20
17
30
.06
.20
14
30
.09
.20
14
31
.12
.20
13
31
.03
.20
14
30
.06
.20
15
30
.09
.20
15
31
.12
.20
14
31
.03
.20
15
31
.12
.20
15
31
.12
.20
16
30
.09
.20
16
30
.06
.20
16
31
.03
.20
16
Adjusted net debt
Net debt
Gross debt
Net debt increased by SEK 4.0 billion compared with the level at 31 Dec. 2016. Adjusted net debt increased by SEK 2.3 billion, compared with the level at 31 Dec. 2016. For the calculation of adjusted net debt, see slide 32.
SEK bn
42
Net debt increased as a result of negative cash flow after investments. Adjusted net debt increased as a result of higher net debt, which was partly offset by lower amount of nuclear provisions.

BREAKDOWN OF GROSS DEBT Total debt: SEK 96bn (EUR 10bn)
External market debt: SEK 83bn (EUR 9bn)
51%
20%
7%
Hybrid capital
Bank loans and others
Loans from minority shareholders 3%
11%
4%
Loans from associated companies
Margin calls (CSA)
Commercial paper
4%
EMTN
Debt issuing programmes Size
(MEUR) Utilization
(MEUR)
EUR 10bn Euro MTN 10,000 4,610
EUR 2bn Euro CP 2,000 415
SEK 15bn Domestic CP 1,574 0
Total 13,574 5,025
All public debt is issued by Vattenfall AB
The main part of debt portfolio has no currency exposure that has an impact on the income statement. Debt in foreign currency is either swapped to SEK or booked as hedge against net foreign investments.
No structural subordination
43

1) Loans from associated companies, minority owners, margin calls received (CSA) and valuation at fair value are excluded and currency derivatives for hedging debt in foreign currency are included
DEBT MATURITY PROFILE1
0
10 000
20 000
30 000
2017 2019 2021 2023 2025 2027 2029 2031 2033 2035 2037 2039
Hybrid capital Debt (ex hybrid cap) Undrawn back-up facilitiesMSEK
31 Mar. 2017 31 Dec. 2016
Duration (years) 5.6 5.6
Average time to maturity (years) 8.3 8.5
Average interest rate (%) 4.5 4.4
Net debt (SEK bn) 54.7 50.7
Available group liquidity (MSEK) 32,310 36,297
Undrawn committed credit facilities (MSEK) 19,064 19,105
44

REPORTED AND ADJUSTED NET DEBT
45
Reported net debt (SEK bn)
31 Mar.
2017
31 Dec.
2016
Hybrid capital -19.1 -19.2
Bond issues and commercial papers and liabilities to credit institutions
-56.0 -55.8
Liabilities to associated companies -3.1 -2.8
Liabilities to minority shareholders -10.3 -10.1
Other liabilities -7.5 -8.8
Total interest-bearing liabilities -96.0 -96.7
Reported cash, cash equivalents & short-term investments
39.3 43.3
Loans to minority owners of foreign subsidiaries
2.0 2.7
Net debt -54.7 -50.7
Adjusted net debt (SEK bn)
31 Mar.
2017
31 Dec.
2016
Total interest-bearing liabilities -96.0 -96.7
50% of Hybrid capital 9.5 9.6
Present value of pension obligations -40.6 -40.6
Wind & other environmental provisions -4.3 -4.4
Provisions for nuclear power (net) -40.9 -41.9
Margin calls received 3.7 4.0
Liabilities to minority owners due to consortium agreements
9.2 9.0
= Adjusted gross debt -159.4 -161.0
Reported cash, cash equivalents & short-term investments
39.3 43.3
Unavailable liquidity -7.01 -7.01
= Adjusted cash, cash equivalents & short-term investments
32.3 36.3
= Adjusted net debt -127.1 -124.7
1) Of which: German nuclear ”Solidarvereinbarung” 3.2, Margin calls paid (CSA) 2.6, Insurance “Provisions for claims outstanding” 1.2

NUCLEAR PROVISIONS Reactor Net capacity
(MW)
Start (year) Vattenfall share (%)
Vattenfall provisions, MSEK (IFRS accounting)
Vattenfall provisions, MSEK (pro rata)
Sw nuclear waste fund MSEK (Vattenfall pro
rata share)
Ringhals 1 879 1976 70.4
Ringhals 2 809 1975 70.4
Ringhals 3 1,070 1981 70.4
Ringhals 4 942 1983 70.4 Total Ringhals: 25,635 Total Ringhals: 25,6351
Forsmark 1 984 1980 66.0
Forsmark 2 1,120 1981 66.0
Forsmark 3 1,170 1985 66.0 Total Forsmark: 22,019 Total Forsmark: 14,533
Total Sweden 6,974 - 47,8842 40,3982 30,9853
Brunsbüttel 771 1977 66.7 19,990 13,327
Brokdorf 1,410 1986 20.0 0 5,634
Krümmel 1,346 1984 50.0 12,948 12,948
Stade4 640 1972 33.3 0 2,691
Total Germany 4,167 - - 32,938 34,601
Total SE & DE 11,141 80,822 74,999
1) Vattenfall is 100% liability of Ringhals decommissioning, while owning only 70.4% 2) Total provisions in Sweden (IFRS accounting) include provisions of 230 MSEK related to Ågesta 3) Vattenfall’s share of the Nuclear Waste Fund (book value). IFRS consolidated value is 36,943 MSEK. 4) Stade is being dismantled 46

Investment split by type: SEK 50 bn
Growth investments, 56% Replacement investments, 13% Maintenance investments, 31%
Growth investment by technology: SEK 28 bn
Wind power, 62% Distribution grids, 20% Solar PV, 6% Heat grids, 4% Other, 8%
47
INVESTMENT PLAN 2017-2018 The investment plan reflects a clear shift in our strategy with a large part dedicated to growth investments, with the majority in wind power, solar power and distribution networks.

CAPITAL EXPENDITURES
Continuing operations SEK bn Q1 2017 Q1 2016 FY 2016
Electricity generation 1.7 1.9 13.1
CHP/Heat 0.4 0.5 3.1
Electricity networks 0.8 0.8 5.2
Other 1.1 0.2 0.5
Total 4.0 3.3 21.9
- of which maintenance and replacement
2.4 2.3 10.6
- of which growth 1.6 1.0 11.4
48


![Lectura caso iberdrola [1]](https://static.fdocuments.us/doc/165x107/55b4065bbb61eb275f8b47e7/lectura-caso-iberdrola-1.jpg)