Vattenfall FY and Q4 Results 2017 · PDF fileDividend policy Dividend: 40%-70% of the...
38
Vattenfall FY and Q4 Results 2017 Magnus Hall, CEO and Anna Borg, CFO Press Conference 7 February 2018
-
Upload
vuongthuan -
Category
Documents
-
view
217 -
download
0
Transcript of Vattenfall FY and Q4 Results 2017 · PDF fileDividend policy Dividend: 40%-70% of the...

Vattenfall FY and Q4 Results 2017
Magnus Hall, CEO and Anna Borg, CFO
Press Conference 7 February 2018

• Returning to profit on the bottom line
• Profit for the period 9.6 SEK bn
• Underlying EBIT 23.3 SEK bn
• Resilient capital structure with FFO/AND at 21.5%
• Large investments towards climate neutral growth despite years of market challenges
• Strong production across the Nordic hydro and nuclear fleet
• Increased contribution from wind following commissioning of new assets
• Growth of decentralised solutions and electric vehicle charging
• Continued investments in Distribution to increase quality of delivery
• Phase-out of coal-fired power generation to natural gas in Berlin
Highlights Key data
VATTENFALL 2017 – A STRONGER AND MORE RESILIENT COMPANY
SEK bn FY 2017 FY 20161 Δ
Net Sales 135.3 139.2 -3.9
Underlying EBIT 23.3 21.7 1.7
EBIT 18.6 1.3 17.3
Profit for the period 9.6 -2.2 11.8
ROCE, % 7.7 0.5 7.2
ROCE excl. IAC, % 9.7 8.7 1
FFO/adj net debt, % 21.5 21.6 -0.1
TWh FY 2017 FY 20161 Δ
Electricity generation 127.3 119.0 8.3
Customer sales, electricity 108.8 123.2 -14.4
Customer sales, heat 18.8 20.3 -1.5
Customer sales, gas 56.4 54.8 1.6
2
1. Continuing operations (excluding divested lignite operations)

Customer engagement, Net Promoter Score relative to peers (NPS relative) +2
Aggregated commissioned new renewables capacity 2016-2020: ≥2,300 MW
Absolute CO2 emissions, pro rata, continuing operations: ≤21 Mtonnes
Return on Capital Employed (ROCE), last 12 months: ≥8%
Safety as LTIF (Lost Time Injury Frequency): ≤1.25
Employee Engagement Index: ≥70%1
VATTENFALL IS WELL ON TRACK TO MEET ITS STRATEGIC TARGETS UNTIL 2020
Our strategic objectives and prioritised areas Strategic targets to 2020 FY 2017 Comments
Grow in renewables,
maintain efficient operations within
hydro and nuclear power and implement
our CO2
roadmap
Increase customer centricity and build a sizable position in decentralisedenergy
Develop culture, competence and brand
Reduce costs and improve operational efficiency
1
2
3
4
5
6
+2
652 MW
23.1 Mt1
7.7%
1.5
64%
Continued improvement at lower pace
Strong continuous growth
CO2 roadmap continues
Significant improvement towards adjusted target
Core focus
Improved but not satisfactory
1) Consolidated values for 2017. Consolidated emissions are approximately 0.5 Mt higher than pro rata values, corresponding to Vattenfall’s share of ownership.
FY 2016
+7
297 MW
23.2 Mt1
0.5%
2.0
57%
3
LARGE INVESTMENTS TOWARDS CLIMATE NEUTRAL GROWTH DESPITE YEARS OF MARKET CHALLENGES
4
48%
35%
17%
Growth, 22bn SEKMaintenance, 16bn SEKReplacement, 8 bn SEK
Total capex 2018-2019
46bn SEK
59%
14%
9%
4%
14%
Wind power, 13bn SEKDistribution grids, 3bn SEKHeat grids, 2bn SEKSolar energy, 1bn SEKNew businesses*, 3bn SEK
Growth capex per technology 2018-2019
22bn SEK
Growth capex per country 2018-2019
39%
16%
13%
11%
9%
12%
Denmark, 8 bn SEKGermany, 4 bn SEKNetherlands, 3 bn SEKSweden, 2 bn SEKGreat Britain, 2 bn SEKOther, non-assigned, 3 bn SEK
22bn SEK
* Mainly decentralised solutions, energy storage and e-mobility

• Nuclear capacity tax fully abolished as of Jan 1, 2018• Independent Core Cooling investment decision for
Ringhals (Forsmark decided in 2016)• Increase in payments to Swedish nuclear fund 2018-
2020 from avg. 0,04 SEK/kWh to 0,05 SEK/kWh meaning a total of approx. SEK 200 mn p.a.
• Higher nuclear production (+5 TWh1) as a result of high availability (85%) and restart of Ringhals 2
• The underlying operating profit decreased due to lower gross margin resulting from hedging activities
• Land and Environmental Court recommends further assessment before decision on final nuclear storage in Sweden
• Strong hydro balance and more favourable market environment benefitted our hydro business (+0.8 TWh)2
Highlights Nuclear Improvement Program
Target Indicator AC 2016 AC 2017 KPI 2021
Safe and available Availability 75% 85% >90%
Cost effectiveness Cost/kWh3,4 35 öre 24 öre 19 öre
Capital Discipline Total Capex SEK 2 bn SEK 2 bn SEK 1 bn
SEK bn FY 2017 FY 2016Net sales 94.4 99.0
Underlying operating profit 10.8 11.4
POWER GENERATION – A YEAR OF STRONG PRODUCTION ACROSS OUR MAJOR NORDIC UNITS
1. Nuclear production - 2017: 51.9 TWh; 2016: 46.9 TWh 2. Hydro production - 2017: 35.6 TWh; 2016: 34.8 TWh3. Cost of purchase , O&M cost, depreciation, financing cost, 4. 29 öre/kWh in 2016 excl. IAC, incl. capacity taxcapacity tax 4 öre/kWh in 2017 and 7 öre/kWh in 2016
5
10
15
20
25
30
35
40
45
50
2015 2016 2017
EEX 2018 EEX 2019 ICE 2018ICE 2019 NPX 2018 NPX 2019
Price development – Electricity futures (EUR/MWh)

• Wind Power more than doubled its result, mainly due to further growth in operating assets. Production increased by 1.8 TWh1 and availability was 97%2
✓ Completion of the Sandbank offshore wind farm (288 MW) in Germany
✓ Pen y Cymoedd (228 MW), which is our largest onshore wind farm in the UK, started operating at full capacity
• Construction start of Horns Rev III (406 MW) in Denmark. Last foundation was piled in place in January
• In the development pipeline, the final investment decision and complementary acquisition around Wieringermeer in the Netherlands (all together 295 MW) should be noted
• Vattenfall decided to participate in the offshore wind tender for Hollandse Kust Zuid, the first non-subsidized tender in the world
Highlights
SEK bn FY 2017 FY 2016Net sales 9.4 6.7
Underlying operating profit 2.1 0.9
1. Wind production - 2017: 7.6 TWh; 2016: 5.8 TWh 2. Wind availability - 2017: 97%; 2016: 97%
Under construction and pipeline
WIND – CONTINUED RENEWABLES GROWTH POSITIVELY IMPACTS VATTENFALL’S RESULT DEVELOPMENT
42%
58%
Onshore Offshore
Operating assets
36%
14%13%
13%
24%
UK DenmarkThe Netherlands SwedenGermany
2.8 GW
2.8 GW
Split by type of generation
Split by geography
6
>700 MWWind projects under
construction
~6 GWWind projects in
development
375 MW Large scale solar pipeline
17 MW Decentral solar pipeline
37 MW Batteries pipeline

CUSTOMERS AND SOLUTIONS – STABLE DEVELOPMENT IN A COMPETITIVE LANDSCAPE
• Growing customer base despite competitive pressure with lower sold volumes mainly in the B2B segment for Germany and France
• Continue to outperform peer average in Net Promoter Score (NPS)
• Strong focus on lowering cost to serve contributed to lower operating expenses and increased underlying operating profit in spite of decrease in net sales
• Market entry into the UK through iSupplyEnergy
• Expansion of decentralised solutions, e.g. Vattenfall InHouse (SE), solar lease for house owners (NL) and acquisition of platform solution Trianel (DE)
Net Promoter Score (NPS) relative to peers
2017
+2
2016
+7
2016Q1
+3
Charging for electric vehicles (k)Retail sales development
Highlights Key data
SEK bn FY 2017 FY 2016Net sales 69.1 69.2Underlying operating profit 1.9 1.8
1. Adjusted for re-allocation of resellers in 2016 to Power Generation2. Data collection initiated in 2017
Target 2020
8
24
5
20162015 2017
Charging stations
Online charging points2
7
848994
6.3
53
2015
2.1
6.2
51
2.3
2017
6.4
55
2016
2.2
Sales of gas (TWh)
Sales of electricity (TWh)1
Gas customers (million)
Electricity customers (million)
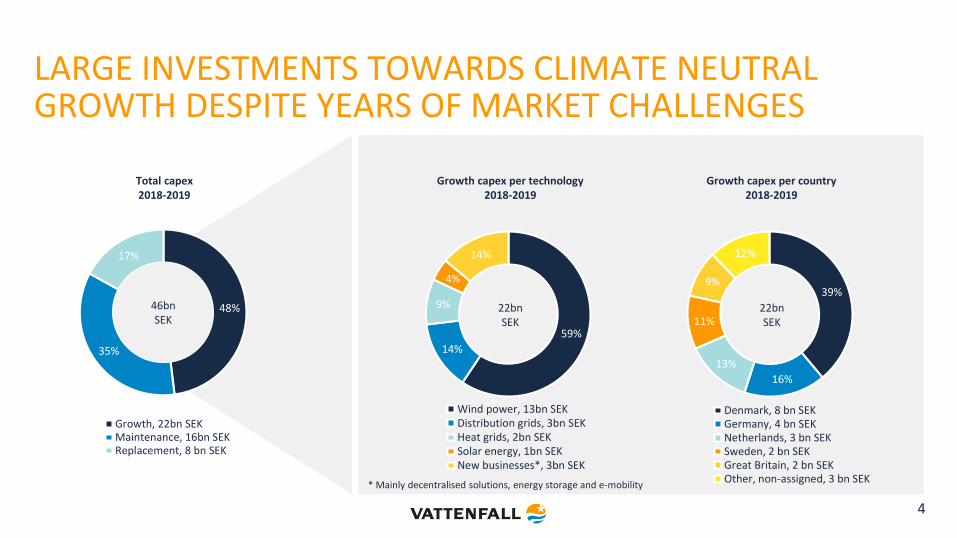
DISTRIBUTION – POSITIVE RESULT DEVELOPMENT SUPPORTS REQUIRED NETWORK UPGRADES
• Adjusted tariffs in Sweden support continued investments and major upgrades in the network
• New network prices in Sweden applied from 1 January 2018
• Adjusted tariffs in Germany reflecting higher upstream costs
• Swedish revenue frames for 2016-2019 settled with WACC at 5.85%
• Concession process in Berlin not finalised
Service level (SAIDI, min)1
285335 315
1029599
111011
201720162015
Investments (SEK bn)Customers and volumes
Highlights Key data
SEK bn FY 2017 FY 2016Net sales 21.5 19.7Underlying operating profit 6.1 4.9
Berlin2
Sweden South
Sweden North
1.5
2017
1.6
3.5
1.2
2016
4.0
2015
3.8
Sweden Germany
8687
3,203
2015
83
20172016
3,2903,270
Customer base (thousand)
Transited volume (TWh)
1. Excl. storms and other major weather related outages (SE North 2015: 199min, 2016: 224min; SE South 2015: 64min)2. Significantly lower SAIDI in Berlin as a result of being a city grid. Vattenfall’s Swedish grid covers both urban areas and large rural areas.
8

-20
-10
0
10
20
30
2018201720162015
• Positive sales and result development mainly related to higher electricity production and subsidies for gas-fired CHPs1
• Supporting Berlin’s target of coal phase out by 2030
✓ Klingenberg (590 MWth) conversion
✓ Marzahn (230 MWth) construction start
! Reuter C (331 MWth) to be closed
! Investment decision to build power-to-heat asset (120 MWth) and gas-fired heat-only boilers in Spandau
• Investment decision to convert a heat only boiler peat-fired plant in Uppsala (120 MWth) to biomass
• New decentralised product launches, e.g. on-site solar production and micro CHPs
Spreads2 (EUR/MWh)Sales and production
Highlights Key data
SEK bn FY 2017 FY 2016Net sales 30.7 28.4
Underlying operating profit 3.4 3.2
1. CHP = Combined Heat and Power Plant
2. CSS NL with 50% efficiency, CDS DE with 38% efficiency
HEAT – DELIVERING ON THE PHASE OUT OF COAL
Clean Dark Spread DEClean Spark Spread NL
9
192021
323230
2017
1,987 2,094
2016
2,040
2015
Heat sales (TWh)1
Electricity generation (TWh)Customer base (thousand)
FINANCIALS
Anna Borg, CFO
10

Increased earnings, SEK bn
9.6
1.3
21.7
-2.2
FY 2017
18.623.3
FY 20161
FY 2017 FINANCIAL HIGHLIGHTS
Stable debt levels, SEK bn
11
• Underlying EBIT increased by SEK 1.6 bn to SEK 23.3 bn due to increased earnings in wind and distribution
• EBIT increased by SEK 17.3 bn to SEK 18.6 bn and Profit for the year by SEK 11.7 bn to SEK 9.6 bn. 2016 was affected by impairments
• Decrease in cash flow operating activities by SEK 3 bn to SEK 25.6 bn mainly related to changes in working capital
• FFO and debt levels stable, with FFO/adjusted net debt at 21.5%, below target of 22%
• Net debt increased by SEK 8.5 bn vs. 31 December 2016, mainly due to reclassification from nuclear provisions into debt. Adjusted net debt remain in line with last year
124.4
59.3
FY 2016
124.7
FY 2017
50.7
Adjusted net debtNet debt
FY 20161
28.626.9
FY 2017
25.626.7
Cash flow operating activitiesFFO
Stable funds from operations, SEK bn
Profit for the yearEBITUnderlying EBIT
1. Continuing operations (excluding divested lignite operations)

IMPROVING OUTCOME VS. FINANCIAL TARGETS
12
Financial objectives
New target Old target Outcome 2017
Outcome 2016
Profitability Return on capital employed: >8% Return on capital employed: >9% 7.7%(9.7%) 2
0.5%1
(8.7%) 2
Capital Structure FFO/Adjusted net debt: 22-27% FFO/Adjusted net debt: 22-30% 21.5% 21.6%1
Capital structure N/A Net debt/equity ratio: 50-90% 63.0% 60.5%
Dividend policy Dividend: 40%-70% of the year’s profit after tax
Dividend: 40%-60% of the year’s profit after tax
SEK 2 bndividend proposal
-
1. Continuing operations (excluding divested lignite operations)
2. Excluding Items Affecting Comparability (IAC)

35
53
Net div., growth
and other
-16
20172010 Cost savings
-2
DELIVERING ON COST CONTROLOPEX, SEK bn Growth capex as
% of total investment
13
▪ Optimising structure and scope of staff and support functions, SEK 2 bn
▪ Operational efficiency measures
▪ Leading the development in lowering LEC
▪ Best in class cost to serve
▪ Focus on effective operations and investment efficiency
▪ Strengthen operational performance
• Significantly decreased cost base in our existing businesses. Never compromising on safety.
• Maintained headroom for growth investments is largely attributable to cost saving measures, mitigating the effect of decreased market prices
• Cost reductions are an integral part of our strategy with several initiatives ongoing both in the business as well as for overhead and IT
Key cost reduction measures
1. Continuing operations (excluding divested lignite operations)
49% 48%
2018-19
100%SEK 235 bn SEK 46 bn
2010-17
Sample initiatives:
• Re-organisations and FTE reductions
• Outsourcing
• Project scrutiny, procurement savings
• Staff function reductions

DEVELOPMENT OF UNDERLYING EBIT FY 2017
14
Improvement following higher contribution mainly from distribution and wind operations
SEK bn
Underlying EBIT FY 2017
23.3
Net other effects
-0.7
Distribution
1.3
Wind
1.3
Trading
1.1
Swedish energy agreement
1.3
Production margins
(Pow.Gen.Segm)
-2.7
Underlying EBIT FY 20161
21.7
1. Continuing operations (excluding divested lignite operations)
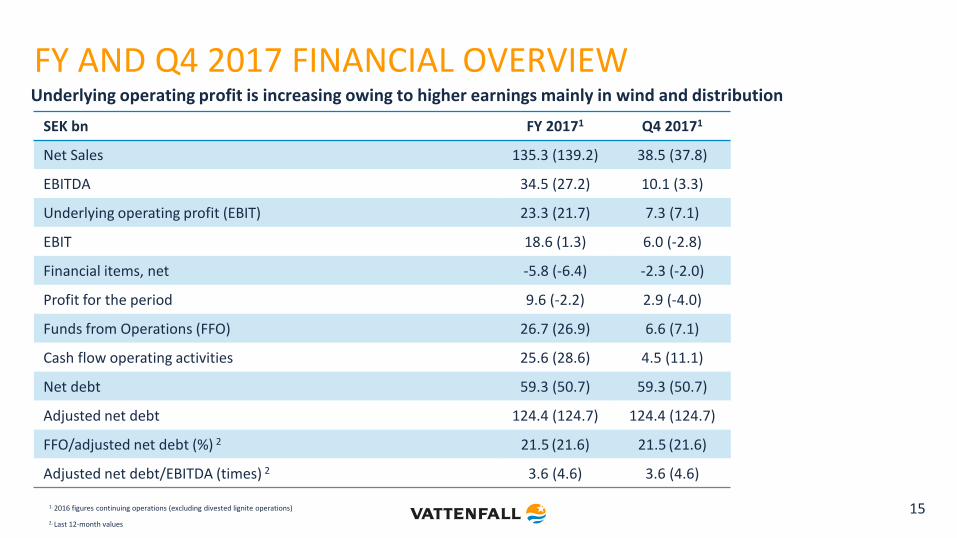
FY AND Q4 2017 FINANCIAL OVERVIEW
15
SEK bn FY 20171 Q4 20171
Net Sales 135.3 (139.2) 38.5 (37.8)
EBITDA 34.5 (27.2) 10.1 (3.3)
Underlying operating profit (EBIT) 23.3 (21.7) 7.3 (7.1)
EBIT 18.6 (1.3) 6.0 (-2.8)
Financial items, net -5.8 (-6.4) -2.3 (-2.0)
Profit for the period 9.6 (-2.2) 2.9 (-4.0)
Funds from Operations (FFO) 26.7 (26.9) 6.6 (7.1)
Cash flow operating activities 25.6 (28.6) 4.5 (11.1)
Net debt 59.3 (50.7) 59.3 (50.7)
Adjusted net debt 124.4 (124.7) 124.4 (124.7)
FFO/adjusted net debt (%) 2 21.5 (21.6) 21.5 (21.6)
Adjusted net debt/EBITDA (times) 2 3.6 (4.6) 3.6 (4.6)
Underlying operating profit is increasing owing to higher earnings mainly in wind and distribution
1. 2016 figures continuing operations (excluding divested lignite operations)
2. Last 12-month values

ITEMS AFFECTING COMPARABILITY
16
SEK bn FY 20171 Q4 20171
Capital gains 0.7 (2.2) 0.1 (0.1)
Capital losses -0.1 (-0.4) -0.1 (-0.3)
Impairment losses -0.4 (-12.4) -0.0 (-3.3)
Reversed impairment losses 0.0 (0.9) - (0.9)
Provisions -1.8 (-8.2) -1.2 (-8.4)
Unrealised changes in the fair value of energy derivatives -3.6 (-2.4) 0.1 (1.0)
Unrealised changes in the fair value of inventories 0.0 (1.0) 0.2 (0.4)
Restructuring costs -0.3 (-0.8) -0.1 (-0.5)
Other items affecting comparability 0.9 (-0.3) -0.3 (0.1)
Total -4.7 (-20.4) -1.3 (-9.9)
▪ Capital gains of SEK 0.7 bn mainly due to sale of shares in Waste incineration plants T.A Lauta and Rüdersdorf
▪ Provisions of SEK -1.8 bn mainly because of change of discount rate for Ringhals
▪ Unrealised changes in the fair value of energy derivatives and inventories SEK -3.6 bn
Highlights 2017
1. 2016 figures continuing operations (excluding divested lignite operations)

UNDERLYING EBIT PER OPERATING SEGMENT
SEK bn FY 20172 Q4 20172
Customers & Solutions 1.9 (1.8) 0.7 (0.4)
Power Generation 10.8 (11.4) 2.7 (3.9)
Wind 2.1 (0.9) 1.4 (0.4)
Heat 3.4 (3.2) 1.0 (1.5)
Distribution 6.1 (4.9) 1.7 (1.1)
Other1 -1.0 (-0.5) -0.2 (-0.4)
Eliminations -0.1 (-0.0) 0.1 (0.2)
Total 23.3 (21.7) 7.3 (7.1)
17
▪ Customer & Solutions: increase by SEK 0.1 bn mainly explained by lower operational expenses
▪ Power Generation: decrease by SEK 0.6 bn mainly due to lower gross margin offset by lower operating expenses
▪ Wind: increase by SEK 1.3 bn following new capacity added
▪ Heat: increase by SEK 0.1 bn mainly due to retroactive compensation in 2017 for 2016
▪ Distribution: underlying operating profit increased by SEK 1.3 bn as a result of a higher gross margin in Sweden and lower operating expenses in Germany
Highlights 2017
1. “Other” pertains mainly to all Staff functions, including Treasury and Shared Service Centres
2. 2016 figures continuing operations (excluding divested lignite operations)
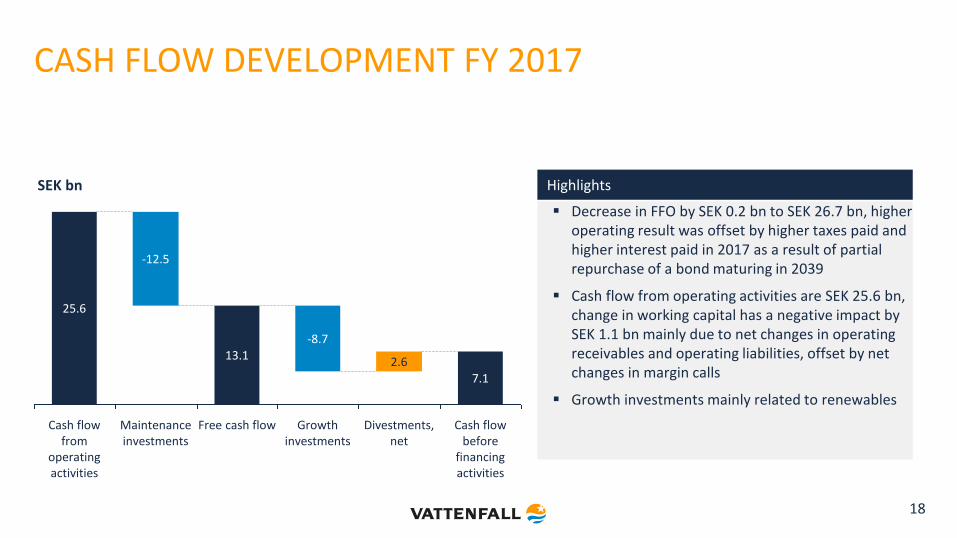
CASH FLOW DEVELOPMENT FY 2017
18
Divestments, net
2.6
Growth investments
-8.7
Free cash flow
13.1
Cash flow before
financing activities
7.1
Maintenance investments
-12.5
Cash flow from
operating activities
25.6
SEK bn
▪ Decrease in FFO by SEK 0.2 bn to SEK 26.7 bn, higher operating result was offset by higher taxes paid and higher interest paid in 2017 as a result of partial repurchase of a bond maturing in 2039
▪ Cash flow from operating activities are SEK 25.6 bn, change in working capital has a negative impact by SEK 1.1 bn mainly due to net changes in operating receivables and operating liabilities, offset by net changes in margin calls
▪ Growth investments mainly related to renewables
Highlights

APPENDIX
19

CONTINUED STRONG LIQUIDITY POSITION
Group liquidity SEK bn
Cash and cash equivalents 8.8
Short term investments 18.1
Reported cash, cash equivalents & short term investments
26.9
Unavailable liquidity1 -7.0
Available liquidity 19.9
Committed credit facilities Facility size SEK bn
RCF (maturity Dec 2021)2.0
EUR bn19.7
Total undrawn 19.7
Debt maturities2 SEK bn
Within 90 days 4.4
Within 180 days 9.4
20
• SEK 17.3 bn have been paid out to the German nuclear energy fund in 2017, and the available liquidity amount to SEK 19.9 bn
• Despite the large payment, the liquidity of Vattenfall remains strong
1. German nuclear ”Solidarvereinbarung” 3.4 SEK bn, Margin calls paid (CSA) 2.7 SEK bn, Insurance “Provisions for claims outstanding” 0.9 SEK bn
2. Excluding loans from minority owners and associated companies

DEVELOPMENT OF UNDERLYING EBIT Q4 2017
21
Wind and distribution are the main contributors to the small positive development
SEK bn
7.1
0.1
Distribution
0.5
Heat
-0.6
Wind Underlying EBIT Q4 2017
7.3
Other
1.0
Power Generation
-1.2
Customer & Solutions
0.3
Underlying EBIT Q4 2016
1) Excluding divested lignite operations

CASH FLOW DEVELOPMENT Q4 2017
22
6.4
Maintenance investments
-4.7
Cash flow from
operating activities
11.1
Cash flow before
financing activities
4.3
Divestments, net
0.3
Growth investments
-2.5
Free cash flow
SEK bn▪ FFO decreased by SEK 0.5 bn due to higher tax paid
in 2017 and interest paid as a result of partial repurchase of bond maturing 2039
▪ Changes in working capital have a negative impact by SEK 2.1 bn on cash flow from operating activities mainly due to changes in margin calls, increase in inventory lower receivables in BA Customer & Solutions following the seasonal pattern
▪ Net cash flow from investing activities is SEK -6.9 bn
Highlights

IMPAIRMENT HISTORY 2009 – FY 2017
23
SEK bn 2009 2010 2011 2012 2013 2014 2015 2016 2017 Total
The NetherlandsThermal assets 4.31 0.42 8.62 14.7 2.6 2.8 33.4Trading 6.51 10.01 0.7 17.2Other 1.2 1.2 1.52 1.9 5.8
Germany
Thermal assets 0.3 4.3 5.7 19.2 26.1 55.6Nuclear assets 10.5 10.5Transmission 5.1 5.1Other 0.1 1.1 0.3 2.3 0.4 4.2
The Nordic Countries
Renewable assets 1.4 0.1 1.5Thermal assets 4.1 3.0 0.1 7.2Nuclear assets 17.0 0.4 17.4Other 0.3 0.3
UK Renewable assets 1.1 0.2 1.3Not allocated 0.2 0.5 0.1 0.8Impairment Liberia 1.3 1.3Impairments; shares in Enea S.A. Poland 2.4 2.4Impairments; shares in Brokdorf and Stade 1.1 1.1Impairments 5.5 11.1 11.3 12.3 30.1 23.8 36.8 33.8 0.4 165.1Reversed impairment losses -1.3 -1.3 -0.4 0.0 0.0 0.0 -0.5 -0.9 0.0 -4.4Impairments (net) 4.2 9.8 10.9 12.3 30.1 23.8 36.3 32.9 0.4 160.7
1) Impairment of goodwill 2) Impairment of assets and goodwill

Before lignite divestment After lignite divestment
24
Electricity price
price
time
“Variable fuel cost” (gas, coal, CO2)
Electricity price
price
time
“Fixed fuel cost” (lignite)
From fixed fuel to
variable fuel dominated in
Germany
123
31
Base load
Condensing coal & gas
Renewables
1607
82
731
119Renewables
Condensing coal & gas
Base load
Group base load
production hours reduced
by ~33%
Continental/UK
51%
Nordic
49% Continental/UK32%
Nordic
68%
C/UK power production
share reduced from 49% to
32%
TWh2016
TWh2016
TWh2016
TWh2016
▪ Lower hedge ratio
▪ Hedging primarily Nordic exposure
▪ Hedging closer to delivery
ADAPTING THE HEDGE STRATEGY TO CHANGING POWER
PRICE EXPOSURE
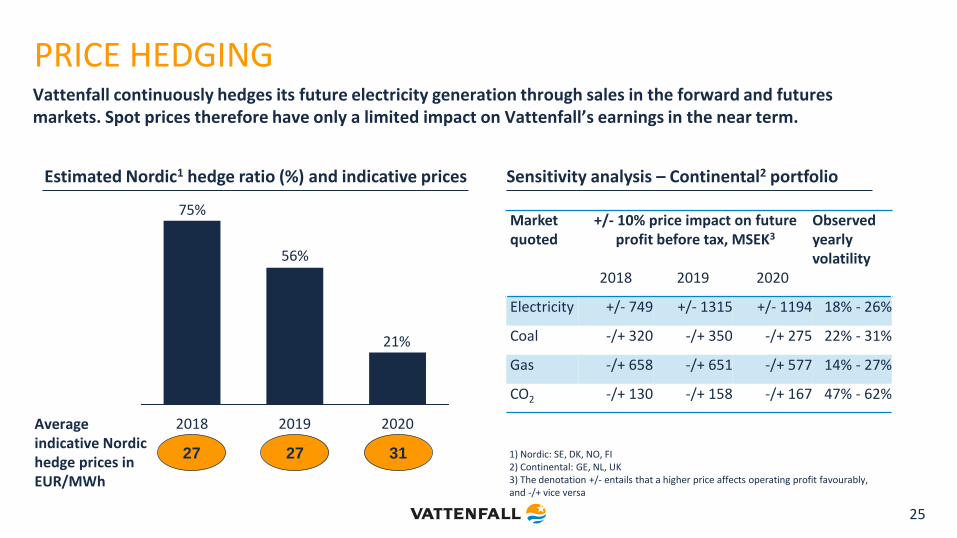
PRICE HEDGING
25
Vattenfall continuously hedges its future electricity generation through sales in the forward and futures markets. Spot prices therefore have only a limited impact on Vattenfall’s earnings in the near term.
Estimated Nordic1 hedge ratio (%) and indicative prices
Average indicative Nordic hedge prices in EUR/MWh
Sensitivity analysis – Continental2 portfolio
27 27 31
21%
56%
75%
202020192018
Market quoted
+/- 10% price impact on future profit before tax, MSEK3
Observedyearly volatility
2018 2019 2020
Electricity +/- 749 +/- 1315 +/- 1194 18% - 26%
Coal -/+ 320 -/+ 350 -/+ 275 22% - 31%
Gas -/+ 658 -/+ 651 -/+ 577 14% - 27%
CO2 -/+ 130 -/+ 158 -/+ 167 47% - 62%
1) Nordic: SE, DK, NO, FI2) Continental: GE, NL, UK3) The denotation +/- entails that a higher price affects operating profit favourably, and -/+ vice versa

DEBT DEVELOPMENT
0
25
50
75
100
125
150
175
200
30
.09
.20
17
30
.06
.20
14
31
.03
.20
14
31
.12
.20
13
30
.06
.20
17
31
.03
.20
17
31
.12
.20
16
30
.09
.20
16
30
.06
.20
16
31
.03
.20
16
31
.12
.20
15
30
.09
.20
15
30
.06
.20
15
31
.03
.20
15
31
.12
.20
14
30
.09
.20
14
31
.12
.20
17
Adjusted net debt
Gross debt
Net debt
Net debt increased by SEK 8.5 bn compared with the level at 31 Dec. 2016. Adjusted net debt remains in line with 31 Dec. 2016 at SEK 124.4 bn. For the calculation of adjusted net debt, see slide 30.
SEK bn
26
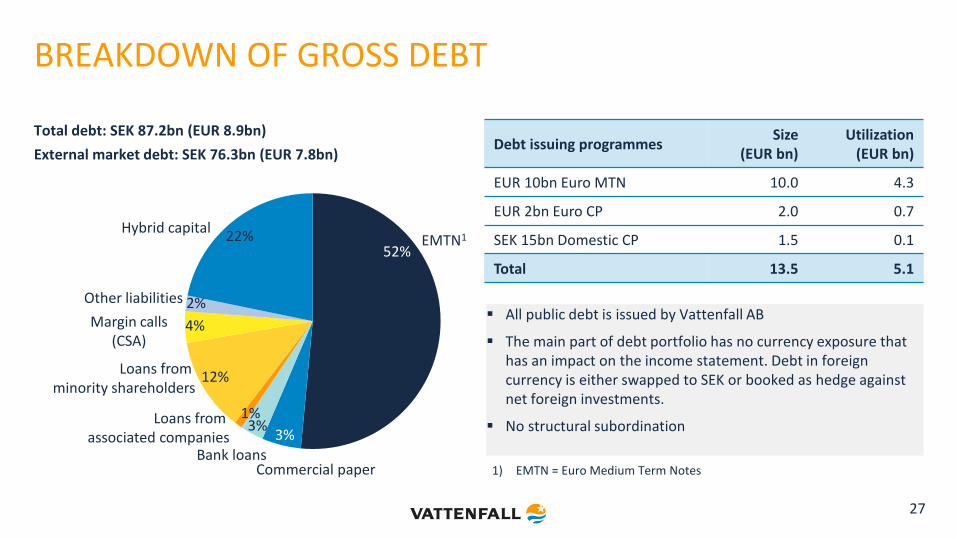
BREAKDOWN OF GROSS DEBT
Total debt: SEK 87.2bn (EUR 8.9bn)
External market debt: SEK 76.3bn (EUR 7.8bn)
1%
52%22%
2%
Hybrid capital
Other liabilities
Loans from minority shareholders
3%
12%
4%
Loans from associated companies
Margin calls (CSA)
Commercial paper
3%
EMTN1
Debt issuing programmesSize
(EUR bn)Utilization
(EUR bn)
EUR 10bn Euro MTN 10.0 4.3
EUR 2bn Euro CP 2.0 0.7
SEK 15bn Domestic CP 1.5 0.1
Total 13.5 5.1
▪ All public debt is issued by Vattenfall AB
▪ The main part of debt portfolio has no currency exposure that has an impact on the income statement. Debt in foreign currency is either swapped to SEK or booked as hedge against net foreign investments.
▪ No structural subordination
27
3%
Bank loans1) EMTN = Euro Medium Term Notes

1) Loans from associated companies, minority owners, margin calls received (CSA) and valuation at fair value are excluded and currency derivatives for hedging debt in foreign currency are included.
DEBT MATURITY PROFILE1
0
10
20
30
2018 2020 2022 2024 2026 2028 2030 2032 2034 2036 2038 2040
Hybrid capital Debt (ex hybrid cap) Undrawn back-up facilitiesSEK bn
31 Dec. 2017 31 Dec. 2016
Duration (years) 4.3 5.6
Average time to maturity (years) 6.9 8.5
Average interest rate (%) 4.4 4.4
Net debt (SEK bn) 59.3 50.7
Available group liquidity (SEK bn) 19.9 36.3
Undrawn committed credit facilities (SEK bn) 19.7 19.1
28
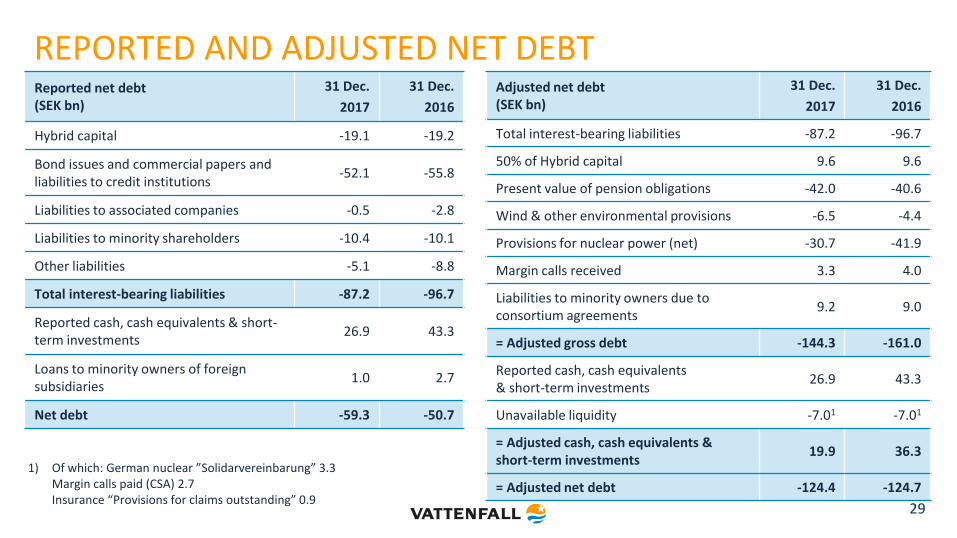
REPORTED AND ADJUSTED NET DEBT
29
Reported net debt(SEK bn)
31 Dec.
2017
31 Dec.
2016
Hybrid capital -19.1 -19.2
Bond issues and commercial papers and liabilities to credit institutions
-52.1 -55.8
Liabilities to associated companies -0.5 -2.8
Liabilities to minority shareholders -10.4 -10.1
Other liabilities -5.1 -8.8
Total interest-bearing liabilities -87.2 -96.7
Reported cash, cash equivalents & short-term investments
26.9 43.3
Loans to minority owners of foreign subsidiaries
1.0 2.7
Net debt -59.3 -50.7
Adjusted net debt(SEK bn)
31 Dec.
2017
31 Dec.
2016
Total interest-bearing liabilities -87.2 -96.7
50% of Hybrid capital 9.6 9.6
Present value of pension obligations -42.0 -40.6
Wind & other environmental provisions -6.5 -4.4
Provisions for nuclear power (net) -30.7 -41.9
Margin calls received 3.3 4.0
Liabilities to minority owners due to consortium agreements
9.2 9.0
= Adjusted gross debt -144.3 -161.0
Reported cash, cash equivalents & short-term investments
26.9 43.3
Unavailable liquidity -7.01 -7.01
= Adjusted cash, cash equivalents & short-term investments
19.9 36.3
= Adjusted net debt -124.4 -124.7
1) Of which: German nuclear ”Solidarvereinbarung” 3.3 Margin calls paid (CSA) 2.7 Insurance “Provisions for claims outstanding” 0.9

NUCLEAR PROVISIONSReactor Net capacity
(MW)Start (year) Vattenfall share
(%)Vattenfall provisions,
SEK bn (IFRS accounting)Vattenfall provisions,
SEK bn (pro rata)Sw nuclear waste fundSEK bn (Vattenfall pro
rata share)
Ringhals 1 879 1976 70.4
Ringhals 2 809 1975 70.4
Ringhals 3 1,070 1981 70.4
Ringhals 4 942 1983 70.4 Total Ringhals: 29.0 Total Ringhals: 29.01
Forsmark 1 984 1980 66.0
Forsmark 2 1,120 1981 66.0
Forsmark 3 1,170 1985 66.0 Total Forsmark: 24.6 Total Forsmark: 16.3
Total Sweden 6,974 - 53.82 45.52 32.43
Brunsbüttel 771 1977 66.7 11.4 7.6
Brokdorf 1,410 1986 20.0 0 2.9
Krümmel 1,346 1984 50.0 6.6 6.6
Stade4 640 1972 33.3 0 0.9
Total Germany 4,167 - - 18.0 18.1
Total SE & DE 11,141 71.9 63.6
1) Vattenfall is 100% liability of Ringhals decommissioning, while owning only 70.4%2) Total provisions in Sweden (IFRS accounting) include provisions of SEK 0.2 bn related to Ågesta3) Vattenfall’s share of the Nuclear Waste Fund (book value). IFRS consolidated value is SEK 38.3 bn.4) Stade is being dismantled 30

31 Dec2017
30 June 2017
Impact (SEK bn)
Sweden 2.50% 2.75% +0.5
Germany 1.75% 2.00% +1.3
INCREASED PENSION PROVISIONS
31
▪ Following the decrease in market rates, the discount rate for both Swedish and German pension provisions is decreased by 25bp
▪ Leading to a total increase of provisions by SEK 1.8 bn
Highlights

CAPITAL EXPENDITURES
Continuing operations SEK bn FY 2017 Q4 2017
Electricity generation 9.1 (13.1) 3.2 (3.7)
CHP/Heat 3.5 (3.1) 1.8 (1.4)
Electricity networks 5.3 (5.2) 2.1 (2.2)
Other 3.3 (0.5) 0.1 (0.2)
Total 21.2 (21.9) 7.1 (7.6)
- of which maintenance and replacement 12.5 (10.4) 4.7 (3.8)
- of which growth 8.7 (11.6) 2.5 (3.8)
32

33
KEY DEVELOPMENTS IN MAIN MARKETS Q4 2017
United Kingdom• Granted licence to operate
distribution networks
Germany• Vattenfall subsidiary Stromnetz Berlin won contract for public
lighting in Berlin• Feasibility study on coal phase-out in Berlin
Sweden• Investment decision for independent
core cooling for the Ringhals 3 and 4 reactors
The Netherlands• Participation in the first non-subsidised
tender for offshore wind in the Netherlands• Ten-year wind power supply contract with
Microsoft
Overall• Increase in underlying EBIT• Launch of efficiency program within staff
functions
Denmark• All foundations for Horns Rev 3 (406 MW) offshore wind farm
were installed in January 2018

WIND - INSTALLED CAPACITY (MW1) Q4 2017
Onshore
Offshore
Vattenfall ownership%
1) Capacity in operation: total capacity of the wind farms that Vattenfall has an ownership in. Minority shares included as 100%
2) 5 MW Solar
3) Kulle (1 MW), Stenkyrka (1 MW), Ruuthsbo (1 MW)
United Kingdom – ROC schemeThanet 300Ormonde (51%) 150Kentish Flats 90Kentish Flats Extension 50Pen Y Cymoedd 228Ray 54Edinbane 41Clashindarroch 37Swinford 22Parc Cynog incl. Solar2 9Pendine 5
Installed capacity (MW) 986
Denmark – FIT schemeHorns Rev 1 (60%) 158Klim (98%) 67Nørrekær Enge 1 (99%) 30Rejsby Hede 23Hagesholm 23Nørre Økse Sø 17Tjæreborg Enge 17Hollandsbjerg 17Bajlum (89%) 15DræbyFed 9Ryå 8Ejsing (97%) 7Nordjyllandsværket 6Lyngmose 5Vellingmærsk 1
Installed capacity (MW) 403
Sweden – certificate schemeLillgrund 111Utgrunden 10Stor-Rotliden 78Högabjär-Kärsås (50%) 38Höge Väg (50%) 38Hjuleberg (50%) 36Juktan (50%) 29Östra Herrestad 16Näsudden 11Hedeskoga 6Other assets3 3
Installed capacity (MW) 376
The Netherlands – MEP/SDE(+)NoordzeeWind (50%) 108Prinses Alexia 122Eemmeerdijk 17Irene Vorrink 17Jaap Rodenburg 17Windpoort (40%) 13Hoofdplaatpolder (70%) 10Reyndersweg (50%) 9Echteld 8De Bjirmen 6Oom Kees (12%) 6Oudendijk 5Mariapolder 5Hiddum Houw 4Enkhuizen 2
Installed capacity (MW) 349
Germany – EEG schemeDanTysk (51%) 288Sandbank (51%) 288alpha ventus (26%) 60Jänschwalde 12Westküste (20%) 7
Installed capacity (MW) 655
Onshore2 Offshore TotalUnited Kingdom 396 590 986Denmark 245 158 403The Netherlands 241 108 349Sweden 255 121 376Germany 19 636 655Total (MW) 1,156 1,613 2,769
34

Country Name No. of Turbines
Capacity(MW) 1
Supportscheme
Awarded Duration of support
Owner-ship (%)
Com-missioning
Current status
UK Aberdeen 11 92 ROC X 20 yrs 100 2018 Under constructionDK Horns Rev 3 49 406 FIT X 50.000hrs 100 2019 Under constructionNL Slufterdam 8 29 SDE+ X 15yrs 100 2019 Under constructionNL Wieringermeer 50 180 SDE+ X 15yrs 100 2020 Under construction
Total 707 MW
Country Name No. of Turbines
Capacity(MW)1
Supportscheme
Awarded Duration of support
Owner-ship (%)
Com-missioning
Current status
NL Wieringermeer ext. 32 ~118 SDE+ X 15 yrs 100 2019 Procurement
SEBlakliden + Fäbodberget
84 ~354 Certs N/A 15 yrs 100 2022 Procurement, preparing for FID in Feb 2018
NL Moerdijk 7 ~27 SDE+ X 15 yrs 100 2020 ProcurementNL Haringvliet 6 ~21 SDE+ X 15 yrs 100 2020 ProcurementNL Nieuwe Hemweg 6 ~20 SDE+ 15 yrs 100 2020 Applied for subsidyUK South Kyle ~50 ~200 None N/A N/A 100 2021 Preparing for procurementDK NK II 40 ~120 None N/A N/A 100 2021 EIA expected in March 2018SE Velinga 12 ~40 Certs N/A 15 yrs 100 2021 Procurement H1 2018DK Danish Near Shore 41 344 FIT X 50.000hrs 100 2021 Tender won & concession signedDK Danish Kriegers Flak 72 602 FIT X 50.000hrs 100 2021 Tender won & concession signedDE Sandbank Plus ~15 <250 FIT (new EEG) 20 yrs 100 2024 Participate in next tenderUK Thanet Extension 34 272 CFD 15 yrs 100 2024 Concept/Early planningUK Norfolk Vanguard 120-180 1,800 CFD 15 yrs 100 2027 Concept/Early planningUK Norfolk Boreas 120-180 1,800 CFD 15 yrs 100 2028 Concept/Early planning
Total ~6GW
1) Capacity in operation: total capacity of the wind farms that Vattenfall has an ownership in. Minority shares included as 100%
35
In construction
PIPELINE OF KEY WIND FARMS 5 CORE COUNTRIES
Onshore
Offshore
Development
Construction

Country Name Capacity(MW)
Supportscheme
Awarded Duration of support
Owner-ship (%)
Commissioning Current status
NL Velsen 2.3 SDE+ X Full-load yrs 100 2018 Preparing for constructionNL Eemshaven 5.5 SDE+ X Full-load yrs 100 2018 Preparing for constructionNL Hemweg 2.4 SDE+ X Full-load yrs 100 2018 Preparing for construction
NL Haringvliet 36 SDE+ Full-load yrs 100 2019Permit received, waiting for SDE
approval
NL Floriade 4 SDE+ Full-load yrs 100 2018Permit received, waiting for SDE
approval
NL Wieringermeer 28 SDE+ Full-load yrs 100 2019Preparing for permit and bid
submission
NL Oudendijk 15 SDE+ Full-load yrs 100 2019preparing for permit and bid
submission
NL Echteld1 5 SDE+ Full-load yrs 100 2019preparing for permit and bid
submission
NL Diemen 1.9 SDE+ Full-load yrs 100 2019preparing for permit and bid
submission
NL TG0 projects 200 SDE+ Full-load yrs 100 >2019Early development, preparing for
permit
UK TG0 projects 75 n.a. Full-load yrs 100 TBDEarly development, preparing for
permit
Total 375
36
PIPELINE OF SOLAR & BATTERIESLARGE SCALE SOLAR PIPELINE
Construction
Development
Country Name Capacity(MW)
Supportscheme
Awarded Duration of support
Owner-ship (%)
Commissioning Current status
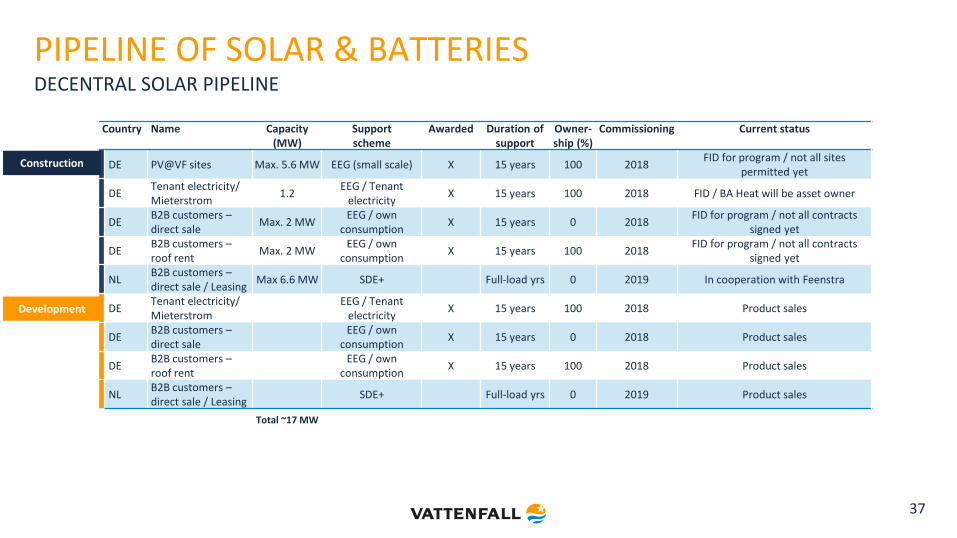
DE PV@VF sites Max. 5.6 MW EEG (small scale) X 15 years 100 2018FID for program / not all sites
permitted yet
DETenant electricity/ Mieterstrom
1.2EEG / Tenant
electricityX 15 years 100 2018 FID / BA Heat will be asset owner
DEB2B customers –direct sale
Max. 2 MWEEG / own
consumptionX 15 years 0 2018
FID for program / not all contracts signed yet
DEB2B customers –roof rent
Max. 2 MWEEG / own
consumptionX 15 years 100 2018
FID for program / not all contracts signed yet
NLB2B customers –direct sale / Leasing
Max 6.6 MW SDE+ Full-load yrs 0 2019 In cooperation with Feenstra
DETenant electricity/ Mieterstrom
EEG / Tenant electricity
X 15 years 100 2018 Product sales
DEB2B customers –direct sale
EEG / own consumption
X 15 years 0 2018 Product sales
DEB2B customers –roof rent
EEG / own consumption
X 15 years 100 2018 Product sales
NLB2B customers –direct sale / Leasing
SDE+ Full-load yrs 0 2019 Product sales
Total ~17 MW
37
PIPELINE OF SOLAR & BATTERIESDECENTRAL SOLAR PIPELINE
Construction
Development

Country Name Capacity(MW)
Supportscheme
Awarded Duration of support
Owner-ship (%)
Commissioning Current status
NL Battery @ Alexia 3Primary Control Reserve (PCR)
weekly 100 2018 Preparing for commissioning
UK Battery @ PyC 22
EnhancedFrequency response (EFR) and Capacity Mechanism (CM)
X1-4 yrs EFR
5-15 CM100 2018 Preparing for commissioning
DE Hafenbatterie 1
Cooperation with BMW and Bosch;Primary Control Reserve (PCR)
weeklyPreparing for commissioning
DE NEW 4.0 1
Funding in R&D operation and
Primary Control Reserve (PCR)
Weekly for PCR
1-3 yrsfunding
4-15 yrs PCRFID taken; construction to be started
DEDecentral - Pilot project
0,26No support scheme Peak shaving
2018FID taken, Procurement process
finalized
UK Ray 10
EnhancedFrequency response (EFR) and Capacity Mechanism (CM)
X1-4 yrs EFR
5-15 CM 100 2019 Development ongoing, permit received
DE Decentral No support scheme Peak shaving
2018 / 2019 Sales of product
Total 37
38
Construction
PIPELINE OF SOLAR & BATTERIESBATTERIES PIPELINE
Development