Vattenfall Full Year Results 2008 · Profit before taxes 23 498 23 933 -1.8 ... Credit support...
47
© Vattenfall Full Year Results 2008 Conference call, 12 February 2009 Presentations by Lars G. Josefsson, CEO and Dag Andresen, CFO Vattenfall AB
Transcript of Vattenfall Full Year Results 2008 · Profit before taxes 23 498 23 933 -1.8 ... Credit support...
©
Vattenfall Full Year Results 2008
Conference call, 12 February 2009
Presentations by
Lars G. Josefsson, CEO andDag Andresen, CFO
Vattenfall AB

2
©
Agenda
CEO Lars G. Josefsson:
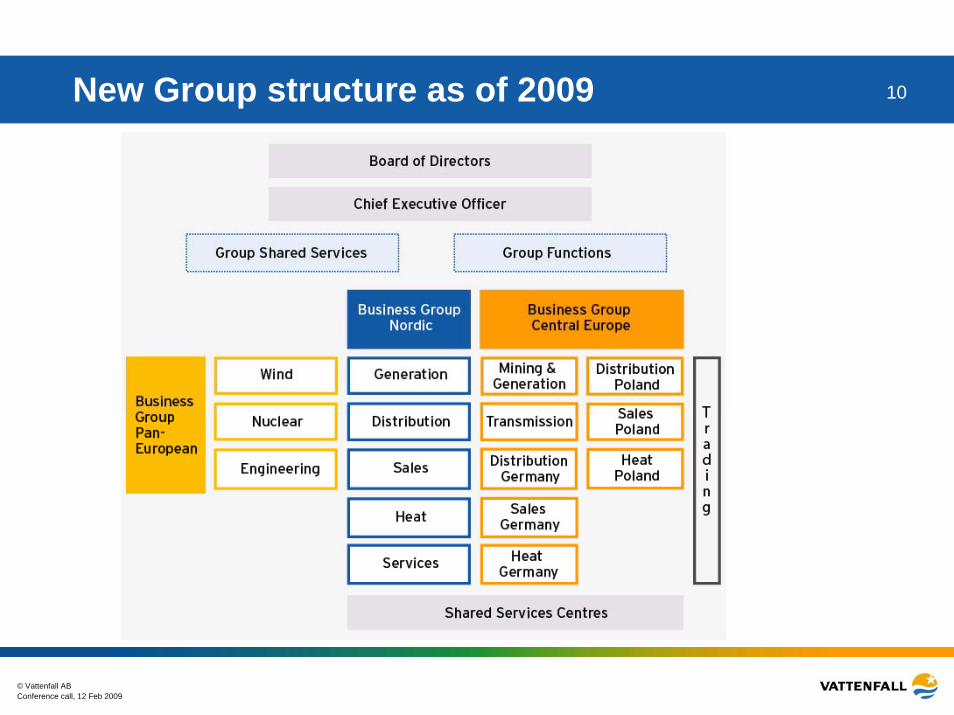
• Sales & earnings• Generation volumes• Important events during 2008• New Group structure
CFO Dag Andresen:
• Prices & hedge position• P&L and Cash Flow• Debt & liquidity position• Capex programme
Conference call, 12 Feb 2009Vattenfall AB

Conference call, 12 Feb 2009© Vattenfall AB
3Financial highlights - Full year 2008
Net sales increased14.6% to SEK 164.5 million (143.6)
EBITDA increased 0.3% to SEK 46,0 bn (45.8)
EBIT increased 4.6% to SEK 29.9 bn (28.6)
Profit after tax decreased14.1% to SEK 17.8 bn (20.7)
Net debt increased by SEK 22,3 bn to SEK 66.0 bn compared with 31 December 2007
Conference call, 12 Feb 2009© Vattenfall AB
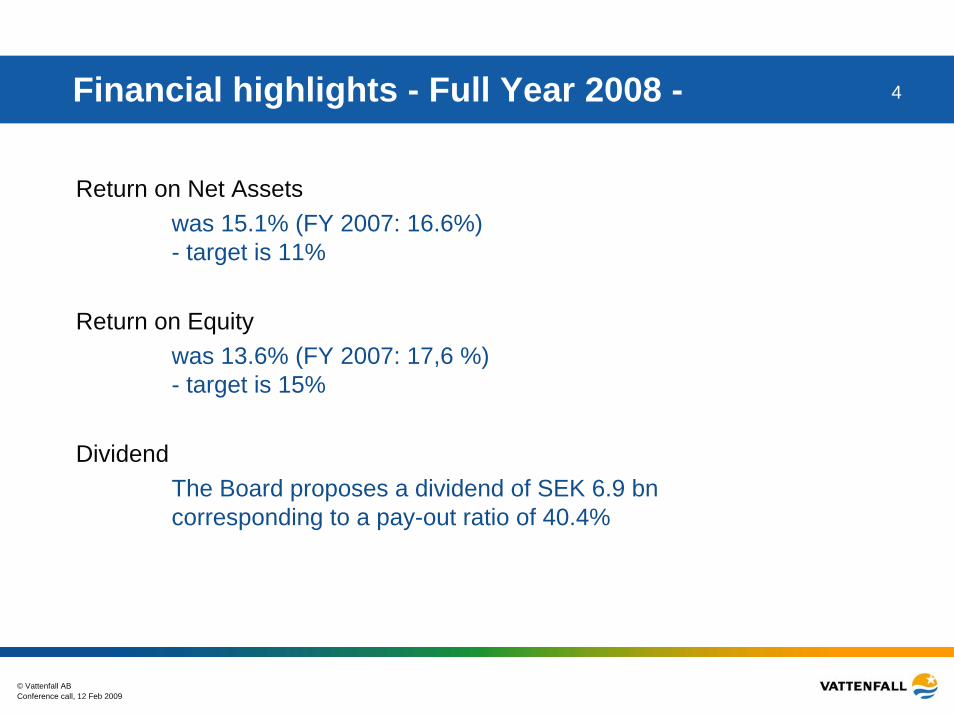
4Financial highlights - Full Year 2008 -
Return on Net Assetswas 15.1% (FY 2007: 16.6%)- target is 11%
Return on Equitywas 13.6% (FY 2007: 17,6 %)- target is 15%
DividendThe Board proposes a dividend of SEK 6.9 bncorresponding to a pay-out ratio of 40.4%

Conference call, 12 Feb 2009© Vattenfall AB
5Financial highlights - Q4 2008
Net sales increased22.3% to SEK 46.9 bn (38.3)
EBITDA decreased 8.8% to SEK 11.4 bn (12.5)
EBIT decreased 2.8% to SEK 6.6 bn (6.8)
Profit after tax increased10.3% to SEK 4.1 bn (3.7)

Conference call, 12 Feb 2009© Vattenfall AB
6EBIT development
Quarterly figures, SEK million
Quarterly figures in SEK million, excluding items affecting comparabilityLast 12 months figures in SEK million, excluding items affecting comparability
02 0004 0006 0008 000
10 00012 00014 00016 00018 00020 00022 00024 00026 00028 00030 00032 000
Q42000
Q22001
Q42001
Q22002
Q42002
Q22003
Q42003
Q22004
Q42004
Q22005
Q42005
Q22006
Q42006
Q22007
Q42007
Q22008
Q42008
HEW consolidated
Bewagconsolidated
GZE consolidated
Danish assets consolidated

Conference call, 12 Feb 2009© Vattenfall AB
7
77.7
51.3
36.61.9
14.0
21.6
8.20.8
21 %
FY 2007 total: 167.6 TWh
Q4 2007 total: 44.7 TWhQ4 2008 total: 41.6 TWh
9.6
10.7
20.7
0.7
39.5
46.2
75.1
2.4
FY 2008 total: 163.1 TWh
Nuclear FossilHydro Other Other = wind, biomassfuel, waste
Lower electricity generation output

Conference call, 12 Feb 2009© Vattenfall AB
8Slightly lower heat sales
21 %FY 2008 total: 35.6 TWh FY 2007 total: 36.2 TWh
Q4 2007 total: 12.8 TWhQ4 2008 total: 12.2 TWh 3.2
9.7
3.5
8.7
10.4
25.3
10.7
25.5
Central EuropeNordic

Conference call, 12 Feb 2009© Vattenfall AB
9Important events 2008
• CCS pilot oxy-fuel plant ”Schwarze Pumpe” inaugurated
• Launch of climate vision - climate neutral by 2050
• Major wind power acquisitions in the UK
• Purchase of 18.7% in Polish ENEA
• Building permit for Moorburg CHP, Hamburg, Germany
• Increased retail market shares in the Nordic market and net gainof customers in Germany
• Divestment process of German Transmission network initiated
Conference call, 12 Feb 2009© Vattenfall AB
10New Group structure as of 2009

© Vattenfall AB
Financials
Dag Andresen, CFO

Conference call, 12 Feb 2009© Vattenfall AB
12Electricity price development
Sharp drop in spot pricesin 2nd half of 2008 but
higher avg. FY prices vs. FY 2007Nord Pool +60%, EEX +72%
Sharp drop in forward prices during
2nd half of 2008
Daliy Forward Closing Prices
20,00
30,00
40,00
50,00
60,00
70,00
80,00
90,00
100,00
jan-06 apr-06 jun-06 sep-06 dec-06 mar-07 jun-07 sep-07 dec-07 mar-08 jun-08 sep-08 dec-08
ENOYR-09 EEXYR-09 ENOYR-10 EEXYR-10
EUR/MWh
Monthly Spot Average
15
25
35
45
55
65
75
85
95
jan-06 apr-06 jul-06 okt-06 jan-07 apr-07 jul-07 okt-07 jan-08 apr-08 jul-08 okt-08 jan-09
NordPool (SYSEUR) EEX

Conference call, 12 Feb 2009© Vattenfall AB
13Hedging position as of 31 December 2008
% hedged of planned electricity generation (rounded values)
Nordic
0%
10%
20%
30%
40%
50%
60%
70%
80%
90%
100%
2009 2010 2011
Central Europe
0%
10%
20%
30%
40%
50%
60%
70%
80%
90%
100%
2009 2010 2011
Virtually no changes for 2009-2010 compared with 30 September 2008

Conference call, 12 Feb 2009© Vattenfall AB
14Consolidated income statement FY 2008Amounts in MSEK FY 2008
IFRSFY 2007
IFRSChange
%
Net Sales 164 549 143 639 14.6
Cost of products sold -122 961 -103 404 18.9Gross Profit 41 588 40 235 3.4Operating profit (EBIT)Operating profit, excl. IAC*
29 89529 797
28 583
28 497
4.6
3.8
Financial income 3 412 2 276 49.9
Financial expenses
Financial net
-9 809-6 397
-6 926
-4 650
41.6
37.6Profit before taxes 23 498 23 933 -1.8
Taxes -5 735 -3 247Profit for the period 17 763 20 686 -14.1
* IAC = items affecting comparability

Conference call, 12 Feb 2009© Vattenfall AB
15Consolidated income statement Q4 2008
Amounts in MSEK Q4 2008 Q4 2007 Change%
Net Sales 46 870 38 329 22.3Cost of products sold -37 395 -27 791 34.6Gross Profit 9 475 10 538 -10.1Operating profit (EBIT) 6 562 6 752 -2.8Operating profit, excl. IAC* 6 561 6 776 -3.2
Financial income 1 617 173 834.7Financial expenses -3 768 -2 225 69.3Financial net -2 151 -2 052 4.8Profit before taxes 4 411 4 700 -6.1Taxes -356 -1 024Profit for the period 4 055 3 676 10.3
* IAC = items affecting comparability

Conference call, 12 Feb 2009© Vattenfall AB
16EBIT development, FY 2008
28 58329 895
12 660
935
9891 131
4 262
5 902
Full Year2007
Price Volume O&M Fuel Emissionallowances
Other Full Year2008
SEK million

Conference call, 12 Feb 2009© Vattenfall AB
17EBIT development Q4 2008
6 752 6 5622 212
2 221
2 254
1 416
891
4 380
Q4 2007 Price Volume O&M Fuel Emissionallowances
Other Q4 2008
SEK million

Conference call, 12 Feb 2009© Vattenfall AB
18EBIT development FY 2008 – secondary segments
28 58329 8952 262
481
1 631
1 681 419
Full Year 2007
Generation Heat Networks Markets Other Full Year 2008
SEK million

Conference call, 12 Feb 2009© Vattenfall AB
19EBIT development Q4 2008 – secondary segments
6 5626 752
441 222
714
912
1 273
Q4 2007 Generation Heat Networks Markets Other Q4 2008
SEK million

Conference call, 12 Feb 2009© Vattenfall AB
20Cash flow
36 194
18 963
(8 092)
(25 065)
(17 231)
(8 066) (22 260)
Cash flowfrom
operations
MaintenanceCapex
Free cashflow
Growthinvestments
Dividend Other Net debtincreases
SEK million

Conference call, 12 Feb 2009© Vattenfall AB
21Gross debt development 2008
0,2
107,3
67,2
4,2
1,810,8
4,5
27,6
Gross debt31 Dec,
2007
Redemp-tions
Newborrowings
Loans fromassoc.
Companies
Exchangerate
differences
Valuation atfair value
Other Gross debt31 Dec,
2008
SEK billion

Conference call, 12 Feb 2009© Vattenfall AB
22Net debt development 2008
36,2 41,3
8,1
7,21,8
43,7
Net debt31 Dec, 2007
Cash flowfrom
operatingactivities
Cash flowfrom investing
activities
Dividend paid Exchangerate
differences
Valuation atfair value
Net debt31 Dec, 2008
66,0
SEK billion

Conference call, 12 Feb 2009© Vattenfall AB
23Break down of group liquidity and credit lines31 Dec. 2008Group liquidity
SEK millionCash and cash equivalents 20,904
Short term investments 19,332
Total 40,2361)
1) Of which 23,432 million is available. Non-available liquidity consist of German nuclear ”Solidarvereinbarunshare of German nuclear subsidiaries cash position 3,744, Credit support Annex (Margin Calls); 7,439, and oth
g” 3,724 million, minority owners er non available liquidity 1,897
Committed credit facilitiesRCF (Feb. 2013) EUR 1,000 million 10,940
Bilateral (Apr. 2009) EUR 400 million 4,376
Overdraft facility (Dec. 2009) SEK 100 million 100
Total undrawn 15,416
Debt maturities 2)
-within 90 days 902 -within 180 days 6,892
2) Excluding loans from minority owners and associated companies

Conference call, 12 Feb 2009© Vattenfall AB
24Increased capex programme
SEK 202 billion 2009-2013 (2008-2012 was SEK 173 billion)
169
32
0,80
20406080
100120140160
Generation incl. Heat
Networks Other
43%
17%40%
Nordic Germany Poland
86 bn SEK
35 bn SEK
81 bn SEK
Decided projects (>SEK 2 bn)
Germany
CommissioningMoorburg end 20121,640 MW (hard coal)
Boxberg end 2010675 MW (lignite)
Reichwalde mine end 2010
U.KOffshore wind Thanet 2011300 MW
Offshore wind Ormonde 2011/12150 MW
DenmarkAmager I (coal/biomass) 200971MWe/250 MW heat
SwedenOnshore wind programme 2010/2011200 MW
Conference call, 12 Feb 2009© Vattenfall AB
25Summary & conclusions
• Good results despite challenging conditions
• Financial crisis had limited impact on earnings but price and credit risks have increased
• Vattenfall’s geographic and fuel diversification has paid off
• Breakthrough of wind investments in the UK
• Increased debt but still very strong credit metrics
• Electricity generation for 2009 already 80% hedged
• Major progress for our CCS projects
• Further enhanced climate strategy
Our vision: A Leading European Energy Company

Conference call, 12 Feb 2009© Vattenfall AB
26Questions & Answers
Kentish flats offshore wind farm, UK

© Vattenfall AB
Back-up slides

Conference call, 12 Feb 2009© Vattenfall AB
28Oil, coal, gas and CO2 allowances
0
50
100
150
200
250
jan-
06
apr-0
6
jul-0
6
okt-0
6
jan-
07
apr-0
7
jul-0
7
okt-0
7
jan-
08
apr-0
8
jul-0
8
okt-0
8
jan-
09
0
10
20
30
40
50
60
70
80
Oil (USD/bbl), Brent Front Month Coal (USD/t), API#2, Front Year Emission allowances CO2 (EUR/t), 2009 Gas (EUR/MWh), NBP, Front Year
USD EUR
Conference call, 12 Feb 2009© Vattenfall AB
29
-50
-40
-30
-20
-10
0
10
20
30
40
0
100
200
300
400
500
600
700
800
900
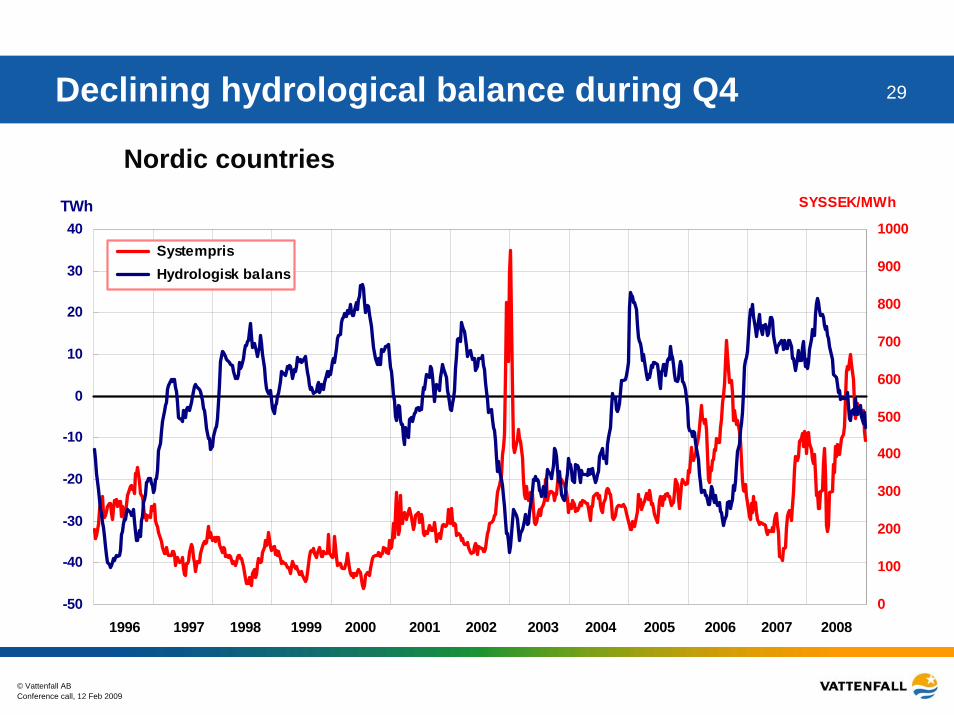
1000 Systempris Hydrologisk balans
SYSSEK/MWhTWh
1996 199919981997 2003200220012000 2004 2005 2006 2007 2008
Nordic countries
Declining hydrological balance during Q4

Conference call, 12 Feb 2009© Vattenfall AB
30Consolidated balance sheetAmounts in MSEK 31/12/08 31/12/07 Change
IFRS IFRS %
Non-current assets 317 912 264 864 20,0
Current assets 127 915 73 372 74.3
Total assets 445 827 338 236 31.8
Equity 140 886 124 132 13.5
Interest-bearing liabilities 107 347 67 189 59.8
Interest-bearing provisions 69 047 56 250 22.8
Pension provisions 20 752 17 735 17.0
Deferred tax liabilities 28 602 26 632 7.4Other non-interest-bearing liabilities 79 193 46 298 71.1
Total equity and liabilities 445 827 338 236 31.8

Conference call, 12 Feb 2009© Vattenfall AB
31Consolidated cash flow statement
Amounts in MSEK Q4 2008 Q4 2007 Change FY2008 FY2007IFRS IFRS %
Funds from operations (FFO) 10 886 10 909 -0.2 30 735 34 049Change in working capital -3 328 -2 527 31.7 5 459 -1 718Cash Flow fromoperating activities 7 558 8 382 -9.8 36 194 32 331Investments -18 184 -6 753 169.3 -42 296 -18 964Divestments 323 291 11.0 865 925Cash and cash equivalentsin aquired/divested companies 146 -1 -14700.0 158 2Cash Flow from investing activities -17 715 -6 463 174.1 -41 273 -18 037Cash Flow beforefinancing activities -10 157 1 919 -629.3 -5 079 14 294Cash Flow from financing activities 15 380 2 024 659.9 14 294 -18 662Cash Flow for the period 5 223 3 943 32.5 9 215 -4 368Net debt at the end of the period -66 000 -43 740 50.9 -66 000 -43 740

Conference call, 12 Feb 2009© Vattenfall AB
32Cash flow development
Figures according to Sw GAAP until Q4 2004 and according to IFRS from Q1 2005
-40 000
-30 000
-20 000
-10 000
0
10 000
20 000
30 000Q
4Q
1Q
2Q
3Q
4Q
1Q
2Q
3Q
4Q
1Q
2Q
3Q
4Q
1Q
2Q
3Q
4Q
1Q
2Q
3Q
4Q
1Q
2Q
3Q
4Q
1Q
2Q
3Q
4Q
1Q
2Q
3Q
4Q
1Q
2Q
3Q
4
-99 2000 2001 2002 2003 2004 2005 2006 2007 2008
Quarter/Year
SEK
mill
ion
Free cash flow from operations - Rolling 4 quarterCash flow before financing activities - Rolling 4 quarter

Conference call, 12 Feb 2009© Vattenfall AB
33Return on equity
0%
5%
10%
15%
20%
25%
30%
1992
1993
1994
1995
1996
1997
1998
1999
2000
2001
2002
2003
2004
2005
2006
2007
2008
Rolling 4-quarterIFRS excl IAC
Rolling 4-quarter SwGAAP excl IAC
Average 4-years (16quarter) Sw. GAAP.IFRS from Q4 2004.Excl. IACRequirement 15%
Conference call, 12 Feb 2009© Vattenfall AB
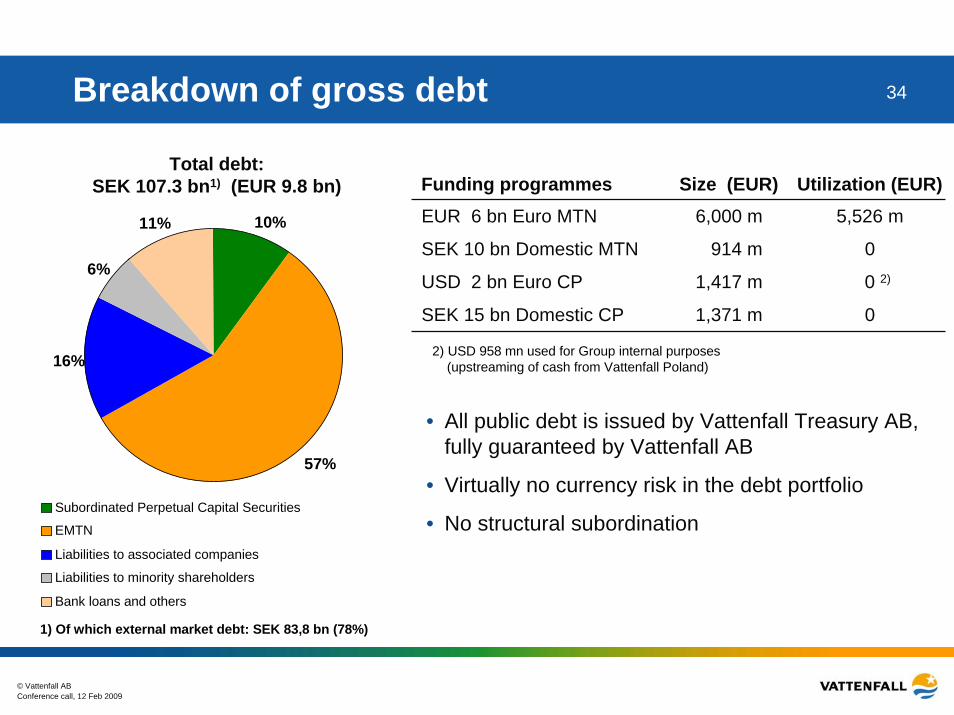
34Breakdown of gross debt
10%
57%
16%
6%
11%
Subordinated Perpetual Capital Securities
EMTN
Liabilities to associated companies
Liabilities to minority shareholders
Bank loans and others
Total debt:SEK 107.3 bn1) (EUR 9.8 bn)
1) Of which external market debt: SEK 83,8 bn (78%)
Funding programmes Size (EUR) Utilization (EUR)EUR 6 bn Euro MTN 6,000 m 5,526 m
SEK 10 bn Domestic MTN 914 m 0
USD 2 bn Euro CP 1,417 m 2)0
SEK 15 bn Domestic CP 1,371 m 0
2) USD 958 mn used for Group internal purposes(upstreaming of cash from Vattenfall Poland)
• All public debt is issued by Vattenfall Treasury AB, fully guaranteed by Vattenfall AB
• Virtually no currency risk in the debt portfolio
• No structural subordination

Conference call, 12 Feb 2009© Vattenfall AB
35Vattenfall debt maturity profile
Excluding loans from associated companies and minority owners
Capital Securities
0
2000
4000
6000
8000
10000
12000
14000
16000
2007 2009 2011 2013 2015 2017 2019 2021 2023 2025 2027 2029 2031 2033 2035 2037
2008 12 30Undrawn back-up facilities
SEK million
Dec 31, 2008 Dec 31, 2007Duration (years) 2,9 1) 3,3Average time to maturity (years) 6,5 1) 6,7Net debt (SEK bn) 66,0 43,7
1) Based on external debt. Excluding Capital Securities the duration is 2,4 years and average time to maturity 6,5 years.

Conference call, 12 Feb 2009© Vattenfall AB
36Adjusted gross and net debtSEK million 31 Dec 2008 31 Dec 2007
Reported gross debt 1)-107 347 -67 189
Present value of net pension obligations (incl actuarial gains/losses) -21 867 -17 073
Mining & environmental provisions -14 604 -11 975
50% of Hybrid securities 5 406 4 671
Cross currency swaps 3 131 -574
Hedge of net investments in foreign operations 3 337 438
= Adjusted gross debt
Reported cash, cash equivalents & short term investments
-131 9442)
40 236
-91 702
22 659
German nuclear "Solidarvereinbarung" -3 724 -3 224
Minority owner´s share of German nuclear subsidiaries cash position -3 744 -3 531
= Adjusted cash, cash equivalents & short term investments 32 768 15 904= Adjusted net debt -99 176 -75 798
1) Of which CSA, Credit Support Annex (Margin calls) 1 856
2) Of which CSA, Credit Support Annex (Margin calls) 7 439

Conference call, 12 Feb 2009© Vattenfall AB
37Financial targets and outcome
Key Ratio Targets 2008
Return on Equity (RoE) 15 % on average equity 13.6%
Return on Net Assets(RoNA, excl. IAC)
11 % before tax (= 15 % RoE recalculated into the Groups RoNA requirement)
15.1%
Cash flow interest coverage after maintenance investments
3.5 – 4.5 times 4.1
Credit Rating Single A category ratingA2/A-
Stable outlook
Dividend pay-out 40-60 % 40.4 % *
*) Proposed dividend

© Vattenfall ABConference call, 12 Feb 2009
38Key ratios
Key Ratios (% unless otherwise stated) 2008 2007RoNA 15.1 16.6
RoE 13.6 17.6
Operating margin 18.2 19.9
Pre-tax profit margin 14.3 16.7
Cash Flow interest coverage aftermaintenance investments, (x) 4.1 6.4
FFO/net debt 46.6 77.8
Equity/assets ratio 31.6 36.7
Net Gearing - Net debt/equity 46.8 35.2
Capitalisation - Net debt/net debt + equity 31.9 26.1
Net debt / EBITDA, (x) 1.4 1.0

Conference call, 12 Feb 2009© Vattenfall AB
39Capex programme – breakdown by type
20%
4%
16%
10%3%2%6%
8%
4%
27%
SEK 202 billion 2009-2013
WindBiomassHard coalLigniteGasWasteCO2 related investmentsNuclearHydro Other (mainly networks)
14%
3%
19%
12%0,3%2%
4%9%
5%
32%
SEK 173 billion 2008-2012

Conference call, 12 Feb 2009© Vattenfall AB
40
30 December 2008
SEK 115,906 million30 December 2007
SEK 97,689 million
20752
39778
14604
26107
1681
50477937
PensionsNuclearMiningTaxesOtherPersonnelLegal
17735
29813
11975
23704
2109
48047549
Group provisions (IFRS)

Conference call, 12 Feb 2009© Vattenfall AB
41Key data – BG Nordic
Q4 Q4 % FY FY Amounts in SEK million 2008 2007 Change 2008 2007
Net sales 13 794 12 928 6.7 48 851 46 713External net sales * 15 942 14 052 13.5 54 732 44 429EBIT ** 3 649 3 915 -6.8 16 760 12 418
Net assets *** 111 263 91 122 22.1 111 263 91 122
Electr. generation, TWh 22.2 24.1 -7.9 90.7 91.1Heat generation, TWh 3.5 3.2 9.4 10.4 10.7
Employees **** 9 992 9 993 0.0 9 507 9 489
* Excl. intra group transactions** Excl. items affecting comparability (IAC)*** At the end of the period**** Full time equivalents (FTE)

Conference call, 12 Feb 2009© Vattenfall AB
42Key data – BG Central Europe
Q4 Q4 % FY FY Amounts in SEK million 2008 2007 Change 2008 2007
Net sales 40 503 32 622 24.2 142 260 122 256External net sales * 27 973 23 291 20.1 99 182 86 736EBIT ** 3 850 3 174 21.3 15 042 16 517
Net assets *** 92 344 78 714 17.3 92 344 78 714
Electr. generation, TWh 19.4 20.5 -5.4 72.4 76.6Heat generation, TWh 8.7 9.7 -10.3 25.3 25.5
Employees **** 20 914 20 934 -0.1 19 692 19 656
* Excl. intra group transactions** Excl. items affecting comparability (IAC)*** At the end of the period**** Full time equivalents (FTE)

Conference call, 12 Feb 2009© Vattenfall AB
43Nuclear update - Germany
• The German Krümmel and Brunsbüttel nuclear power plants are still off-line due to technical problems detected during the inspection and testing programmes:
• The plants will remain shut down until all necessary renovation work is fully completed.Re-start date is still open.
• Financial impact (EBIT):
Q4 2008: EUR -169 million (SEK -1,727 million).FY 2008: EUR -573 million (SEK –5,537 million)
Krümmel (1,346 MW)50% ownership
Brunsbüttel (771 MW)67% ownership

Conference call, 12 Feb 2009© Vattenfall AB
44Major wind power transactions in the UK
Partnership between Vattenfall and ScottishPower Renewables- Alliance for joint bids in the UK
Round 3 offshore wind• Vattenfall’s offshore
experience combined with Iberdrola’s track record andlocal presence
• Ambition 6,000 MW (3,000 MW each) until 2020
Thanet Offshore Wind Ltd• 300 MW, ~ 1 TWh• Commissioning in 2010
AMEC Wind• Pipeline ~ 500-750
MW, ~ 1.5-2 TWh onshore in Scotland
• Alliance for future wind power expertise in the UK
Eclipse Wind Energy• Pipeline
150 MW offshore 60 MW onshore90 MW gas
~ 1 TWh
Investments until ~2018: ~ EUR 2,500 million (if 100% hit rate) excl. Round 3.Alliance on Round 3 expected to fill post 2018 UK investment pipeline

Conference call, 12 Feb 2009© Vattenfall AB
45Vattenfall development in the UKInvestment highlights
• AMEC Wind – now Vattenfall Wind Power Ltd
Total pipeline ~ 500-750 MW incl. extensions
Acquired for GBP 126.7 million
• Eclipse Energy UK PLC
Total pipeline 300 MW, of which 150 MW are fully consented offshore
Acquired for GBP 51.5 million
• Thanet
300 MW
Acquired for GBP 35 million
UK pipeline
Aultmore, 30MW
Edinbane, 30MWUnder construction
Aberdeen Bay, 86MW
Clashindarroch, 41MW
Kyle, 255MW
Logiealmond, 32MWMinch Moor, 28MW
Ray, 48MW
Whitton, 23MW
Total pipeline of ~1,000 MW + 360 MW (extensions)
Ormonde wind, 150MW
Ormonde gas, 90MW
Gwynt yr Hafan, 60MW Kentish
Flats, 90MW
Thanet, 300MW

Conference call, 12 Feb 2009© Vattenfall AB
46Acquisition of 18.7% in Polish ENEA
ENEA S.A. (Parent company) 8% share at domestic generation
16% share at distribution and electricity sale marketElectricity sales 16.8 TWhSales customers 2.3 million
ENEA Operator Ltd. (Distribution company)Distribution area 58,192 km2
Power lines length 107,035 kmTechnical status of the network – similar to VDP assetsDistribution and sales at well developed regions
Elektrownia Kozienice S.A.(Generation company – 2nd biggest Polish Power Station)Electricity generation (2007) 12.7 TWhInstalled capacity 2,880 MWNew 1,000 MW unit CCS ready is planned till 2015
22 smaller subsidiariesSmall hydro-power stations: around 60 MW and 140 GWh/aWind power: about 300 MW under development
Vattenfall has acquired18.7% of ENEA forSEK 4.5 billion

Conference call, 12 Feb 2009© Vattenfall AB
47Transmission update
• At the end of July 2008, Vattenfall approached potential investors for the possible sale of our German Transmission operations (Vattenfall Europe Transmission GmbH)
• Indicative bids were received in October – high level of interest
• The intent to finalize a sale within the first half of 2009 is still valid – within this timeframe we remain flexible regarding single process steps and may adapt to external developments (e.g. regulation)
• Important criteria to be applied on investors. They must:• have a long-term focus• ensure substantial investments in network extension• grant continued free grid access for all power producers• promote the flow of electricity across European borders
• Final decision has not yet been made