VAT fraud detection : the mysterious case of the missing trader
24
SAS founded in 2013 in Paris | http://linkurio.us | @linkurious VAT fraud : the mysterious case of the missing trader.
-
Upload
linkurious -
Category
Data & Analytics
-
view
13.653 -
download
1
Transcript of VAT fraud detection : the mysterious case of the missing trader

SAS founded in 2013 in Paris | http://linkurio.us | @linkurious
VAT fraud : the mysterious case of the missingtrader.

Introduction.
Co-Founder of Linkurious
>5 years in consulting
MSc Political sciences and Competitive
Intelligence
JeanVilledieu
ScottMongeau
Data Scientist @ SARK7
Fraud Expert
PhD in Business Analytics Mgmt and
MBA
A mix of fraud and graph expertise.

Father Of
Father Of
Siblings
What is a graph ?
This is a graph.

Father Of
Father Of
Siblings
This is a node
This is a relationship
What is a graph ? / Nodes & relationshipsWhat is a graph : nodes and relationships.
A graph is a set of nodes linked by relationships.

Some of the domains in which our customers use graphs.
People, objects, movies, restaurants, music…
Suggest new contacts, help discover new music
Antennas, servers, phones, people…
Diminish network outages
Supplier, roads, warehouses, products…
Diminish transportation cost, optimize delivery
Supply chains Social networks Communications
Differents domains where graphs are important.
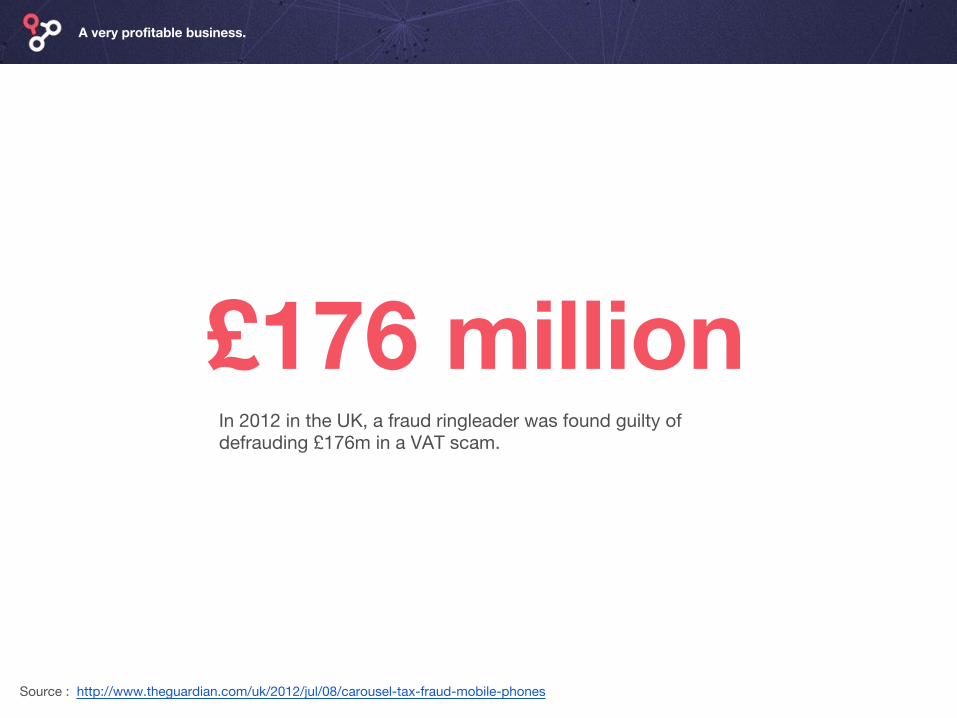
Source : http://www.theguardian.com/uk/2012/jul/08/carousel-tax-fraud-mobile-phones
£176 million
A very profitable business.
In 2012 in the UK, a fraud ringleader was found guilty of defrauding £176m in a VAT scam.

How does the VAT fraud works.
Company B sells the phones to company D (US) and claims a VAT refund.
The directors of A and D disappear with €2M in stolen taxes.
Company B sells the phones to company C. It charges €10M + €1M for the VAT.
Company A (US) sells to Company B (Europe) €10M worth of phones.
€10MA B C€10M + €1M VAT
€10M
€1M VAT refund
D
TaxAgency
€1M for A and €1M for B
Step 1 Step 2 Step 3 Step 4

The execution of the fraud can take place in just a few weeks.
The tax agencies have data but it exists in silos making it hard to piece it together.
The 3 challenges all tax authorities face.
Why it is so hard to catch the fraud.
Apparences Speed Silos
The companies and transactions used for the fraud appear legitimate.

How to make sense of complex data.
How can graph technologies helps?
Company registry, transaction history, financial criminals list, tax claims...
Different data sources.

Graphs help make sense of complex data.
A graph model help see the connections in the data.
country : Italyage : 29criminal_status : unknown
Paul(Person)
Nicole(Person)
Company A(Company)
Company C(Company)
Company B(Company)
country : USAtype : LLCcreation_date : 08/10/1983
country : Italytype : SRLcreation_date : 04/09/1984
country : Italytype : SRLcreation_date : 18/04/1990
SELLS_TO
COLLECTS_VAT
item : phonesdate :05/08/2014amount : 1M
SELLS_TO
PARENT_OF
country : USAage : 53criminal_status : unknown
DIRECTOR_OF
DIRECTOR_OFDIRECTOR_OF

Can we use the data to detect fraud cases?
How to use the information.

A fraud expert designs a fraud detection pattern.
Designing a fraud detection pattern.
I know what to look for. Usually my fraud cases
involve :
● a set of at least three transaction that includes
companies from two different countries ;
● the company in the middle has been created
less than 90 days ago ;
● the transactions occur in a less than 15 days ;

The pattern is translated in a graph language.
Designing a fraud detection pattern.
MATCH p=(a:Company)-[rs:SELLS_TO*]->(c:Company)WHERE a.country <> c.countryWITH p, a, c, rs, nodes(p) AS nsWITH p, a, c, rs, filter(n IN ns WHERE n.epoch - 1383123473 < (90*60*60*24)) AS bsWITH p, a, c, rs, head(bs) AS bWHERE NOT b IS NULLWITH p, a, b, c, head(rs) AS r1, last(rs) AS rnWITH p, a, b, c, r1, rn, rn.epoch - r1.epoch AS dWHERE d < (15*60*60*24)RETURN a, b, c, d, r1, rn

A graph database handles the data analysis at scale.
Graph databases can tackle big datasets.
ETL
Traditional databases.
Graph database.
The graph databases helps store the data from various sources and analyse it in real-time to identify potential fraud cases.

A fraud analyst investigates the potential fraud cases.
An analyst examines the potential fraud cases.
I need to make sure the alerts detected by our
detection system are legitimate. If they are, I need to
understand which companies and which individual
are involved.

Visualization transforms alerts into actions..
ETL API
Traditional database.
Graph database.
Graph visualization.
Graph visualization facilitate the data investigation.
Graph visualization solutions like Linkurious help data analysts investigate graph data faster.
Visualizing the results of our pattern.
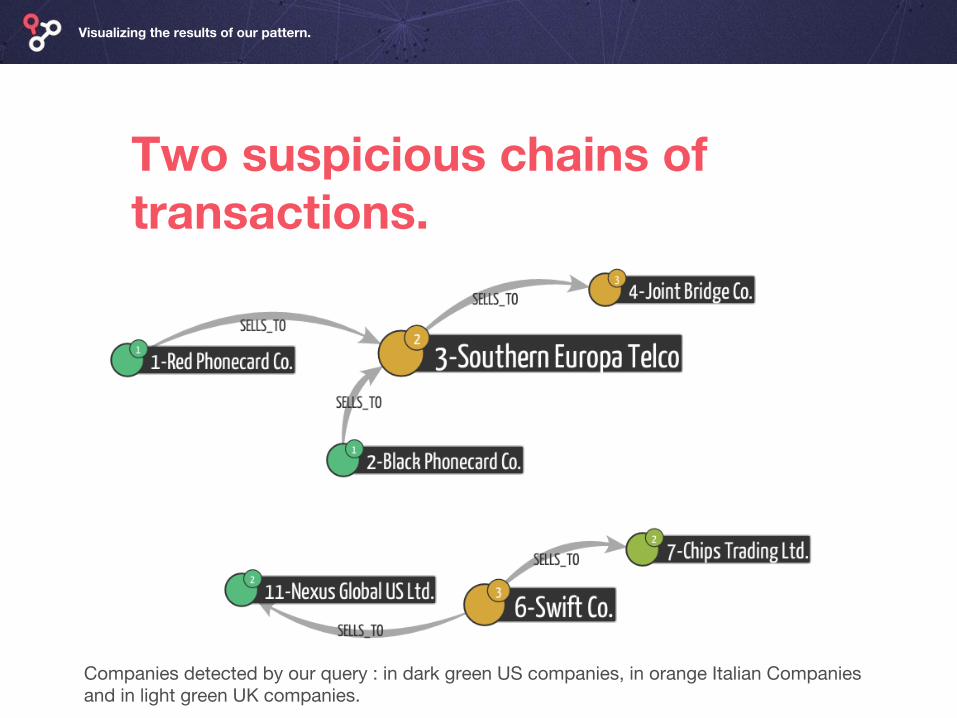
Two suspicious chains of transactions.
Companies detected by our query : in dark green US companies, in orange Italian Companies and in light green UK companies.
Looking at the full VAT fraud scheme.
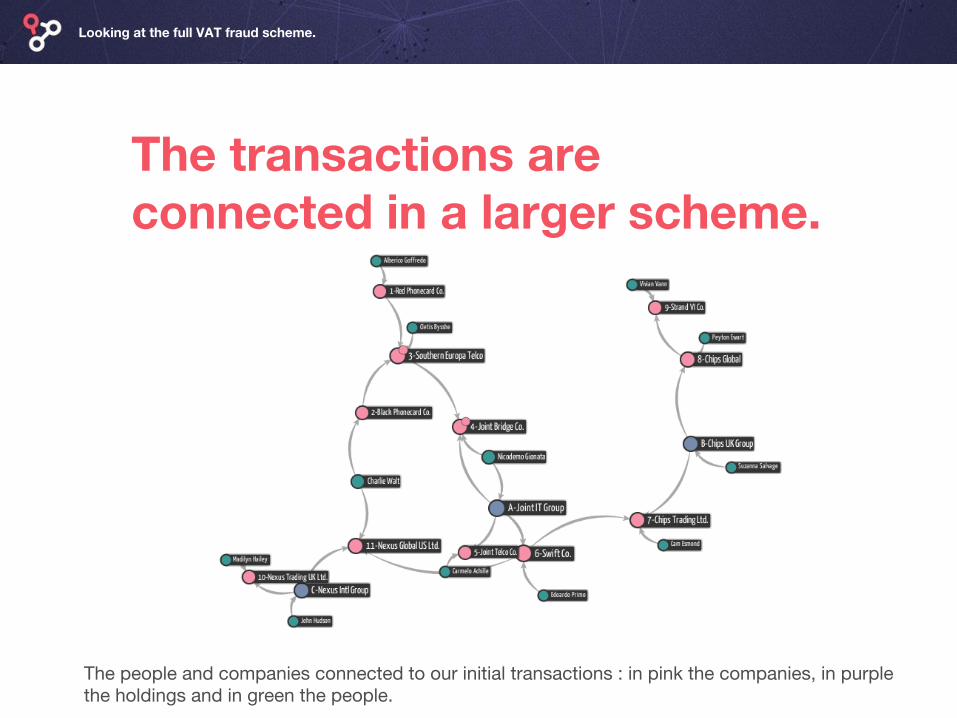
The transactions are connected in a larger scheme.
The people and companies connected to our initial transactions : in pink the companies, in purple the holdings and in green the people.
Zooming in on a potential criminal.
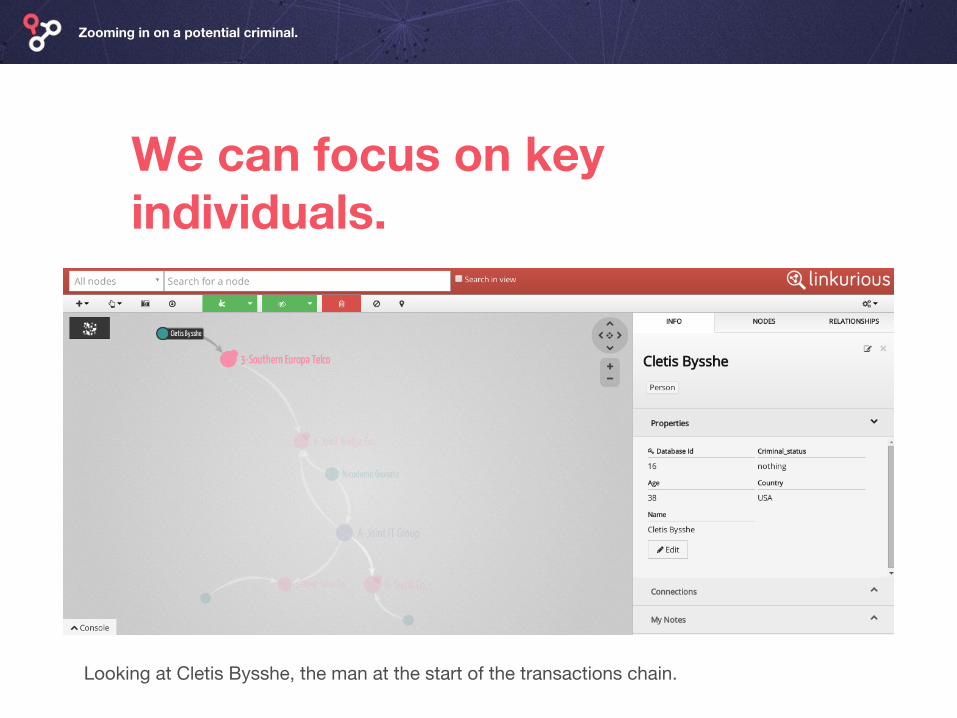
We can focus on key individuals.
Looking at Cletis Bysshe, the man at the start of the transactions chain.

Graphs can improve your fraud detection system.
Linkurious allows the fraud teams to go deep in the data and build cases against fraud rings.
The fraud teams acts faster and more fraud cases can be avoided.
Graph databases can find suspicious patterns hidden in big data.
Detect fraud cases
Accelerate the investigations
Savemoney
Graphs and fraud detection.

GraphGist : http://gist.neo4j.org/?d882df51a4775a6b7588
Blog post on the carousel fraud : http://linkurio.us/vat-fraud-mysterious-case-missing-trader/
Article on fraud and network analysis : http://sctr7.com/2014/08/18/571/
Sample dataset : https://www.dropbox.com/s/t63hzqt2omh9c36/VAT%20fraud%20detection%20neo4j.zip?dl=0
Additional resources.