VASCULAR SYNPHENOLOGY OF PLANT COMMUNITIES … · Miller-Rushing 2010). The phenology of plants is...
6
REPORT 2018 9 POLAR KNOWLEDGE Aqhaliat VASCULAR SYNPHENOLOGY OF PLANT COMMUNITIES AROUND CAMBRIDGE BAY, VICTORIA ISLAND, NUNAVUT, DURING THE GROWING SEASON OF 2015 facilitate the overview of the phenological development of enre plant communies as well as the comparison of different years. Résumé La phénologie est l’étude de la chronologie des événements du cycle de vie, et le développement phénologique des espèces végétales dépend fortement des variaons saisonnières des facteurs environnementaux, en parculier la température. Les enregistrements phénologiques de communautés végétales enères – la « synphénologie » [synphenology] – sur des périodes de nombreuses années peuvent servir de repères précieux pour les changements de température interannuels aribuables au changement climaque et au réchauffement de la planète. Bien que la synphénologie des écosystèmes tempérés ait fait l’objet de recherches assez poussées, il y a relavement moins d’observaons phénologiques dans l’Arcque, et des travaux synphénologiques n’ont jamais été effectués dans les régions de haute latude à Cambridge Bay, sur l’île Victoria, au Nunavut. La phénologie des espèces de plantes vasculaires les plus représentaves de la région a été enregistrée pendant la saison de croissance de 2015, de la mi-juin au début de septembre. Le développement végétaf (feuilles) ainsi que généraf Suggested citation: Wagner, J., McLennan, D.S., and Pedersen, A.K. 2018. Vascular synphenology of plant communities around Cambridge Bay, Victoria Island, Nunavut, during the growing season of 2015. Polar Knowledge: Aqhaliat 2018, Polar Knowledge Canada, p. 9–19. DOI: 10.35298/pkc.2018.02 Abstract Phenology is the study of the ming of life cycle events, and the phenological development of plant species is strongly dependent on seasonal variaons in environmental factors, especially temperature. Phenological records of enre plant communies— synphenology—over periods of many years can serve as invaluable proxies for interannual changes in temperature that are due to climate change and global warming. While the synphenology of temperate ecosystems has been fairly well researched, there are comparavely fewer phenological observaons in the Arcc, and synphenological work has never been performed in the high-latude regions around Cambridge Bay, Victoria Island, Nunavut. The phenology of the most representave vascular plant species in the region was recorded during the growing season of 2015, from mid-June to the beginning of September. Vegetave (leaf) as well as generave (flower/seed) development in shrubby, herbaceous, and graminoid plant species was assessed at weekly intervals using a phenological key with 11 phenological stages, from the development of the first leaf / first floral bud to leaf death/seed dispersal. In addion, the different phenological stages of plants were documented by digital photographs that were taken at the me of phenological assessment. This phenological data has been assembled into synphenological diagrams, which Johann Wagner 1 * , Donald S. McLennan 1 , and A.K. Pedersen 1 1 Polar Knowledge Canada, Cambridge Bay, Nunavut, Canada * [email protected] POLAR KNOWLEDGE Aqhaliat
Transcript of VASCULAR SYNPHENOLOGY OF PLANT COMMUNITIES … · Miller-Rushing 2010). The phenology of plants is...
REPORT 2018 9
POLAR KNOWLEDGE Aqhaliat
REPORT 20188
POLAR KNOWLEDGE Aqhaliat
VASCULAR SYNPHENOLOGY OF PLANT COMMUNITIES AROUND CAMBRIDGE BAY, VICTORIA ISLAND, NUNAVUT, DURING THE GROWING SEASON OF 2015
facilitate the overview of the phenological development of entire plant communities as well as the comparison of different years.
RésuméLa phénologie est l’étude de la chronologie des événements du cycle de vie, et le développement phénologique des espèces végétales dépend fortement des variations saisonnières des facteurs environnementaux, en particulier la température. Les enregistrements phénologiques de communautés végétales entières – la « synphénologie » [synphenology] – sur des périodes de nombreuses années peuvent servir de repères précieux pour les changements de température interannuels attribuables au changement climatique et au réchauffement de la planète. Bien que la synphénologie des écosystèmes tempérés ait fait l’objet de recherches assez poussées, il y a relativement moins d’observations phénologiques dans l’Arctique, et des travaux synphénologiques n’ont jamais été effectués dans les régions de haute latitude à Cambridge Bay, sur l’île Victoria, au Nunavut. La phénologie des espèces de plantes vasculaires les plus représentatives de la région a été enregistrée pendant la saison de croissance de 2015, de la mi-juin au début de septembre. Le développement végétatif (feuilles) ainsi que génératif
Suggested citation:
Wagner, J., McLennan, D.S., and Pedersen, A.K. 2018. Vascular synphenology of plant communities around Cambridge Bay, Victoria Island, Nunavut, during the growing season of 2015. Polar Knowledge: Aqhaliat 2018, Polar Knowledge Canada, p. 9–19. DOI: 10.35298/pkc.2018.02
AbstractPhenology is the study of the timing of life cycle events, and the phenological development of plant species is strongly dependent on seasonal variations in environmental factors, especially temperature. Phenological records of entire plant communities—synphenology—over periods of many years can serve as invaluable proxies for interannual changes in temperature that are due to climate change and global warming. While the synphenology of temperate ecosystems has been fairly well researched, there are comparatively fewer phenological observations in the Arctic, and synphenological work has never been performed in the high-latitude regions around Cambridge Bay, Victoria Island, Nunavut. The phenology of the most representative vascular plant species in the region was recorded during the growing season of 2015, from mid-June to the beginning of September. Vegetative (leaf) as well as generative (flower/seed) development in shrubby, herbaceous, and graminoid plant species was assessed at weekly intervals using a phenological key with 11 phenological stages, from the development of the first leaf / first floral bud to leaf death/seed dispersal. In addition, the different phenological stages of plants were documented by digital photographs that were taken at the time of phenological assessment. This phenological data has been assembled into synphenological diagrams, which
Johann Wagner1 *, Donald S. McLennan1, and A.K. Pedersen1
1 Polar Knowledge Canada, Cambridge Bay, Nunavut, Canada
Fauchald, P., Park, T., Tømmervik, H., Myneni, R., and Hausner, V.H. 2017. Arctic greening from warming promotes declines in caribou populations. Science Advances 3:e1601365.
Green, T.G.A., Sancho, L.G., Tuerk, R., Seppelt, R.D., and Hogg, I.D. 2011. High diversity of lichens at 84º S suggests preglacial survival of species in the Ross Sea Region, Antarctica. Polar Biology 34:1211–1220.
McLennan, D.S., MacKenzie, W.H., Meidinger, D., Wagner, J., and Arko, C. 2018. A standardized ecosystem classification for the coordination and design of long-term terrestrial ecosystem monitoring in Arctic-Subarctic biomes. Arctic 71(Suppl. 1):1–15. Available from https://doi.org/10.14430/arctic4621.
Meidinger, D., MacKenzie, W., and Wagner, J. 2015. Vegetation and ecosystems. Anon 2015. (pp. 29-46)
Persson, H. and Holmen, K. 1961. Bryophytes collected during the Arctic field trip of the 9th International Botanical Congress. The Bryologist 64:179–198.
Thomas, P.A., Sheard, J.W., and Swanson, S. 1994. Transfer of 210Po and 210Pb through the lichen-caribou-wolf food chain of northern Canada. Health Physics 66:666–677.
Thomson, J.W. and Weber, W. A. 1992. Lichens collected on the Arctic excursion of the 9th International Botanical Congress. The Bryologist 95:392–405.
allow growth rates to be determined could be used to establish the ages of rock surfaces or detect changes in climate. Local lichen communities need to be described with input from local people (e.g., elders) to assess how communities may have changed over time and how snow cover might influence the occurrence of lichen communities. The actual biomass of lichens present and their annual contribution to ecosystem productivity also need to be determined, as this is relevant to predicting effects of climate change.
AcknowledgementsWe are grateful to George Angohiatok, Erin Cox, and Simona Wagner for assistance in the field and/or laboratory; to Donald McLennan, Johann Wagner, Sergei Pomanorenko, and Samantha McBeth for their input and advice; and to Monica Young for producing Figure 1. We also thank helicopter pilot Fred Jones for safely transporting us to the remote field sites.
ReferencesCanadian High Arctic Research Station. 2015. Towards the development of the Canadian High Arctic Research Station (CHARS) as a centre for science and technology in Canada and the circumpolar north: Regional social and ecological context, baseline studies, and monitoring pilots. Available from https://above.nasa.gov/Documents/CHARS_Science_Summary_June_2015_DRAFT.pdf.
Edwards, R.Y., Soos, J., and Ritcey, R.W. 1960. Quantitative observations on epidendric lichens used as food by caribou. Ecology 41:425–431.
POLAR KNOWLEDGE Aqhaliat

REPORT 201810
POLAR KNOWLEDGE Aqhaliat
REPORT 2018 11
POLAR KNOWLEDGE Aqhaliat
Thórhallsdóttir 1998; Wagner and Simons 2008; Wookey et al. 1993; Bjorkman et al. 2015; Wheeler et al. 2015). However, most methods focus on an individual species or a limited number of species (Bean and Henry 2003; Molau et al. 1996; Mark et al. 2016; Panchen and Gorelick 2015; Reynolds 1984), either using historical phenological sources (Panchen and Gorelick 2017) or studying species taken out of their plant community context (Panchen and Gorelick 2016). Synphenological approaches, which investigate the phenological rhythms of entire plant communities (Dierschke 1989b; Puppi 2007), have been employed predominantly in temperate, mostly forest ecosystems (Coldea and Wagner 1993–1994; Dierschke 1972, 1982, 1989a, 1991; Pilková 2015; Wagner 1994). Few phenological studies investigating entire plant communities have been performed in high-latitude, tundra environments.
This paper presents the results of a preliminary synphenological study in several of the Arctic ecosystems described around Cambridge Bay, Victoria Island, Nunavut (McLennan et al. 2018) during the growing season of 2015, from mid-June, shortly after snowmelt, to the beginning of September, after the senescence of most plant species.
Materials and methodsSynphenological observations were performed during the growing season of 2015, from mid-June to the beginning of September, at approximately weekly intervals at the sites presented in Table 1, in some of the more important ecosystems (ecosites) around Cambridge Bay (McLennan et al. 2018). For assessing the phenology, the method first introduced by Dierschke in 1972 and perfected in subsequent years (Dierschke 1982, 1989b, a, 1991) was used. The original phenological keys for vascular plants from Dierschke (1989b) were adapted to the characteristics of the flora of the Arctic, and are presented in Table 2. The phenological keys assess both the vegetative (leaf) and generative (flower/seed) development of the plants, and these keys were separated for shrubs, herbaceous plants, and graminoids. They characterize the phenological development of the plants through 11 stages, from early shoot / floral bud development to leaf senescence and death, as well as seed dispersal.
(fleurs/graines) chez les espèces de plantes arbustives, herbacées et graminoïdes a été évalué à intervalles hebdomadaires à l’aide d’une clé phénologique à 11 stades phénologiques, depuis le développement de la première feuille et du premier bourgeon floral jusqu’à la mort des feuilles et à la dispersion des graines. De plus, les différents stades phénologiques des plantes ont été documentés par des photographies numériques qui ont été prises au moment de l’évaluation phénologique. Ces données phénologiques ont été rassemblées en diagrammes synphénologiques, qui facilitent l’aperçu du développement phénologique de communautés végétales entières ainsi que la comparaison des différentes années.
IntroductionPhenology can be defined as the study of life cycle phases (phenophases) of plants and animals in their temporal occurrence throughout the year, whereas phytophenology is the branch of phenology studying the seasonal rhythms of plants (Puppi 2007; Forrest and Miller-Rushing 2010). The phenology of plants is strongly dependent on environmental factors in harsh and highly seasonal environments such as tundra ecosystems (Thórhallsdóttir 1998), with temperatures having the most important influence (Mooney and Billings 1961; Thórhallsdóttir 1998; Bjorkman et al. 2015), as well as photoperiod (Mooney and Billings 1961; Heide 1992; Keller and Körner 2003) and snow cover (Borner et al. 2008; Bjorkman et al. 2015) having significant roles. Plant species in all environments are shifting their phenology in response to global climate change (Cleland et al. 2007). Arctic regions are already experiencing the fastest changing climate, with increasing temperatures and changes in precipitation (IPCC 2007), which are expected to strongly influence the life cycle events of plants that are growing under significant environmental constraints. Phytophenological observation over long periods of time can serve as invaluable proxies for climate variation and change (Fang and Chen 2015).
Given the importance of monitoring the phenology of plants in polar and alpine regions, a number of studies investigate the timing of life cycle phases of plants in natural or simulated tundra environments (Borner et al. 2008; Molau 1993; Mooney and Billings 1961;
Table 1: Sites on which synphenological observations were performed during the growing season of 2015.
Site Name Mount Pelly Road
Wetland Seashore Long Point Dew Line Road
West Road
Latitude 69.15672 69.15849 69.10578 69.09373 69.15757 69.11432
Longitude -104.91185 -104.91240 -105.38382 -105.44079 -105.19082 -105.37647
Ecosite 01 – Dryas integrifolia – Saxifraga oppositifolia (lithic)
09 – Carex aquatilis
16 – Leymus mollis (marine littoral)
16 – Leymus mollis (marine littoral)
01 – Dryas integrifolia – Saxifraga oppositifolia
01 – Dryas integrifolia – Saxifraga oppositifolia with Vaccinium uliginosum
Description Mesic tundra, zonal ecosite most reflective of regional bioclimate
Sedge fen, the most common wetland type
Seashore ecosite on sandy substrate
Seashore ecosite on sandy substrate
Mesic tundra, zonal ecosite most reflective of regional bioclimate
Mesic tundra, zonal ecosite most reflective of regional bioclimate
Table 2: The phenological stages recorded for vascular plants at the site.
Shrubs
Vegetative phenological stage Generative phenological stage0 — buds completely closed 0 — no floral buds1 — buds with green tips 1 — 1st buds/inflorescence visible2 — 1–30% leaf development 2 — buds just before opening3 — 31–60% leaf development 3 — 1–30% of flowers open4 — 61–99% leaf development 4 — 31–60% of flowers open5 — maximum leaf development 5 — full flowering6 — first leaf senescence 6 — most or all flowers wilted7 — 1–30% of leaves turned colour 7 — fruits visible8 — 31–60% of leaves turned colour 8 — fruits almost at full size and green9 — 61–99% of leaves turned colour 9 — fruits almost ripe, brown or dry10 — shrub leafless or with dead leaves 10 — seeds dispersing

REPORT 201812
POLAR KNOWLEDGE Aqhaliat
REPORT 2018 13
POLAR KNOWLEDGE Aqhaliat
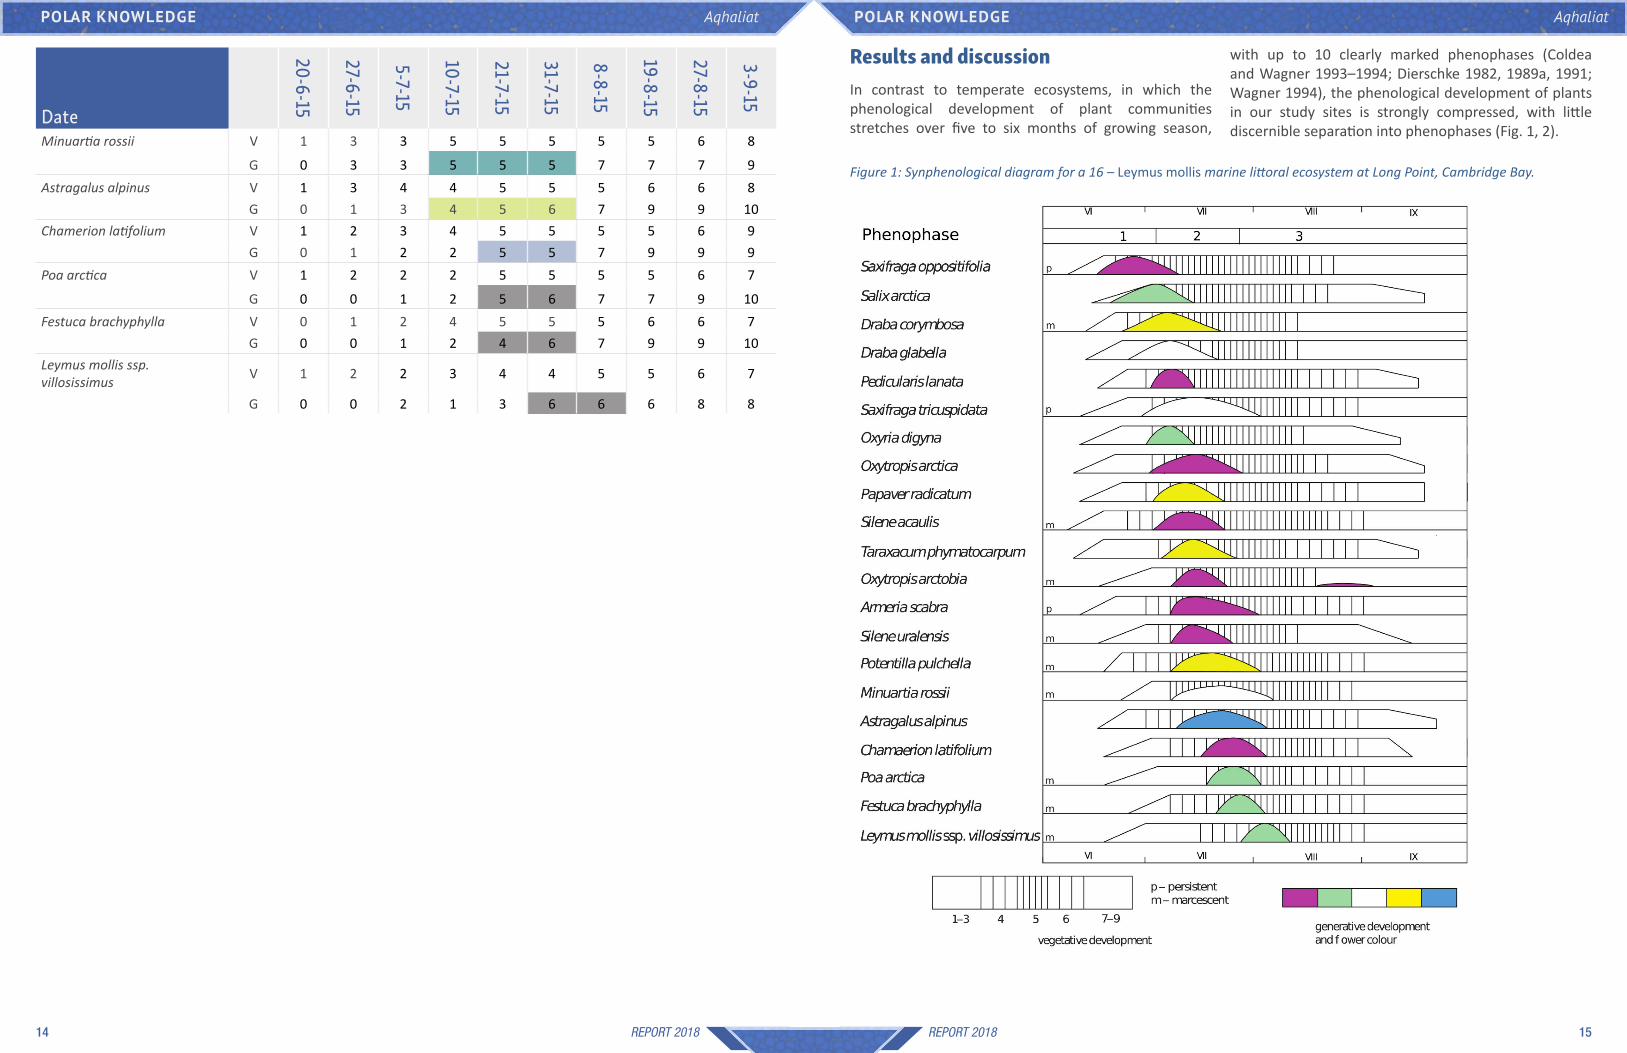
represented by vertical bars, the height of which suggest the magnitude of flowering, with colours corresponding to the flower colour. Figures 1 and 2 preliminarily present the synphenological diagrams of two of the investigated sites from Table 1.
axis, while species are presented on the vertical axis in order of their flowering phenology, from earliest to latest. Their vegetative development is depicted by horizontal bars with vertical lines, higher line densities corresponding to vegetative phenology stages closer to full leaf development. Their generative development is
and were therefore identified for the first time only later in the season, or were not found again after an initial observation. Such species, for which insufficient phenological data was collected, were eliminated from the phenological tables. While such phenological tables already offer a useful insight into the phenological phases of most of the plant species of the ecosites, in the case of a larger number of species, a graphical representation of the data from these phenological tables in the form of synphenological diagrams makes the overview and analysis of the phenological data easier. Similar to phenological tables, in which dates are in columns, in synphenological diagrams, the date is on the horizontal
During the observations, an attempt was made to record the phenology of all vascular plants visible and identifiable on the sites. Additionally, the different phenological stages of plants were recorded by digital photographs that were taken at the time of phenological assessment, both for documenting the phenological stages and for a later confirmation of the phenological stages. The observations on the various phenological stages were assembled in a phenological table, with species ordered by their flowering phenology from earliest to latest. Table 3 presents an example of such a phenological table. Some of the plant species present in these ecosystems are small and inconspicuous,
Herbaceous
Vegetative phenological stage Generative phenological stage0 — fully snow-free; only dead leaves 0 — no buds/inflorescence1 — first growth of the season/first leaf 1 — 1st buds/inflorescence visible2 — 1–30% leaf development 2 — buds just before opening3 — 31–60% leaf development 3 — 1–30% of flowers open4 — 61–99% leaf development 4 — 31–60% of flowers open5 — maximum leaf development 5 — full flowering6 — first leaf senescence 6 — most or all flowers wilted7 — 1–30% of leaves dry 7 — petals fully shed, and fruits visible8 — 31–60% of leaves dry 8 — fruits almost at full size and green9 — 61–99% of leaves dry 9 — fruits almost ripe, brown or dry10 — stem and leaves completely brown and dead 10 — fruits fully ripe and seeds dispersing (bulbils
dispersing)
Graminoids
Vegetative phenological stage Generative phenological stage0 — fully snow-free; only dead leaves 0 — no inflorescence1 — first shoot of the season/first leaf 1 — 1st inflorescence visible2 — 1–30% of shoots developed 2 — inflorescences just before opening3 — 31–60% shoots developed 3 — first anthers visible4 — 61–99% shoots developed 4 — 31–60% of anthers open5 — maximum shoot development 5 — full flowering6 — first leaf senescence 6 — anthers beginning to senesce7 — 1–30% of leaves dry 7 — anthers fully senescent, achenes visible8 — 31–60% of leaves dry 8 — fruits almost at full size and green9 — 61–99% of leaves dry 9 — fruits almost ripe, brown or dry10 — stem and leaves completely brown and dead 10 — fruits fully ripe and dispersing
p — overwintered, persistent leaves from previous year m — marcescent
Table 3: Phenological table of a marine littoral ecosystem at Long Point, Cambridge Bay.
Date
20-6-15
27-6-15
5-7-15
10-7-15
21-7-15
31-7-15
8-8-15
19-8-15
27-8-15
3-9-15
Saxifraga oppositifolia V 3 4 5 5 5 5 5 6 7 7 G 4 5 6 6 7 8 8 9 10 10Salix arctica V 1 3 4 5 5 5 5 6 10 9 G 3 5 5 6 7 8 8 10 10 10Draba corymbosa V 2 4 4 5 5 5 5 7 7 7 G 2 5 5 6 6 8 8 10 10 10Draba glabella V 2 3 3 3 5 5 5 7 7 7
G 2 4 5 5 7 8 8 10 10 10Pedicularis lanata V 1 3 5 5 5 5 5 6 6 10 G 0 1 5 5 7 8 8 9 9 10Saxifraga tricuspidata V 2 3 4 5 5 5 5 6 6 8
G 2 2 3 5 5 6 8 9 10 10Oxyria digyna V 2 3 4 5 5 5 5 7 8 9 G 2 3 5 6 7 8 10 10 10 10Oxytropis arctica V 2 3 4 5 5 5 5 6 7 8 G 1 3 5 5 5 8 9 9 9 10Papaver radicatum V 2 3 4 4 5 5 5 6 6 7
G 1 1 4 5 6 8 8 10 10 10Silene acaulis V 2 4 4 5 5 5 5 5 6 7 G 0 1 4 5 6 7 7 9 10 10Taraxacum phymatocarpum V 2 3 4 4 5 5 5 6 6 9 G 1 1 4 5 5 10 10 10 10 10Oxytropis arctobia V 1 2 3 5 5 5 5 7 7 7 G 0 3 1 5 6 8 9 9 10 10Armeria scabra V 2 3 4 5 5 5 5 6 6 7 G 1 2 2 5 6 6 7 8 10 10Silene uralensis V 1 2 4 4 5 5 5 7 7 10 G 0 1 3 5 5 8 10 10 10 10Potentilla pulchella V 1 4 4 5 5 5 5 5 6 7 G 0 3 3 5 5 6 7 9 10 10
REPORT 201814
POLAR KNOWLEDGE Aqhaliat
REPORT 2018 15
POLAR KNOWLEDGE Aqhaliat
with up to 10 clearly marked phenophases (Coldea and Wagner 1993–1994; Dierschke 1982, 1989a, 1991; Wagner 1994), the phenological development of plants in our study sites is strongly compressed, with little discernible separation into phenophases (Fig. 1, 2).
Results and discussionIn contrast to temperate ecosystems, in which the phenological development of plant communities stretches over five to six months of growing season, Date
20-6-15
27-6-15
5-7-15
10-7-15
21-7-15
31-7-15
8-8-15
19-8-15
27-8-15
3-9-15
Minuartia rossii V 1 3 3 5 5 5 5 5 6 8
G 0 3 3 5 5 5 7 7 7 9Astragalus alpinus V 1 3 4 4 5 5 5 6 6 8 G 0 1 3 4 5 6 7 9 9 10Chamerion latifolium V 1 2 3 4 5 5 5 5 6 9 G 0 1 2 2 5 5 7 9 9 9Poa arctica V 1 2 2 2 5 5 5 5 6 7
G 0 0 1 2 5 6 7 7 9 10Festuca brachyphylla V 0 1 2 4 5 5 5 6 6 7 G 0 0 1 2 4 6 7 9 9 10Leymus mollis ssp. villosissimus V 1 2 2 3 4 4 5 5 6 7
G 0 0 2 1 3 6 6 6 8 8
Figure 1: Synphenological diagram for a 16 – Leymus mollis marine littoral ecosystem at Long Point, Cambridge Bay.
REPORT 201816
POLAR KNOWLEDGE Aqhaliat
REPORT 2018 17
POLAR KNOWLEDGE Aqhaliat
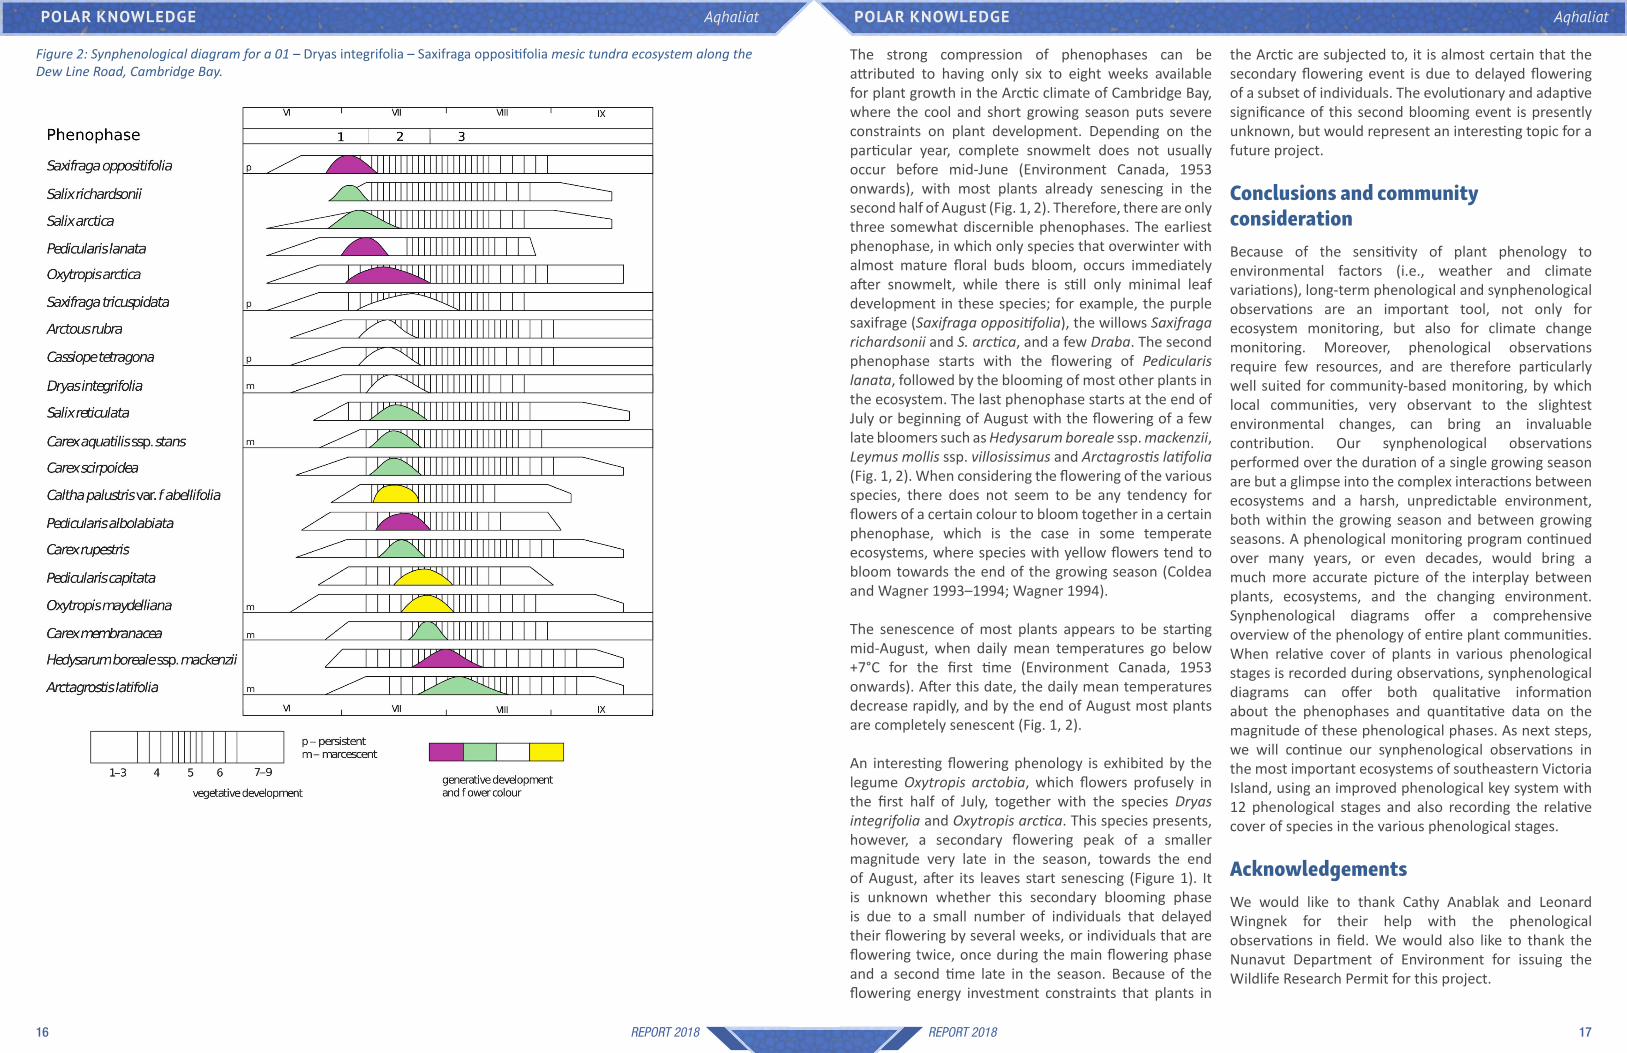
the Arctic are subjected to, it is almost certain that the secondary flowering event is due to delayed flowering of a subset of individuals. The evolutionary and adaptive significance of this second blooming event is presently unknown, but would represent an interesting topic for a future project.
Conclusions and community considerationBecause of the sensitivity of plant phenology to environmental factors (i.e., weather and climate variations), long-term phenological and synphenological observations are an important tool, not only for ecosystem monitoring, but also for climate change monitoring. Moreover, phenological observations require few resources, and are therefore particularly well suited for community-based monitoring, by which local communities, very observant to the slightest environmental changes, can bring an invaluable contribution. Our synphenological observations performed over the duration of a single growing season are but a glimpse into the complex interactions between ecosystems and a harsh, unpredictable environment, both within the growing season and between growing seasons. A phenological monitoring program continued over many years, or even decades, would bring a much more accurate picture of the interplay between plants, ecosystems, and the changing environment. Synphenological diagrams offer a comprehensive overview of the phenology of entire plant communities. When relative cover of plants in various phenological stages is recorded during observations, synphenological diagrams can offer both qualitative information about the phenophases and quantitative data on the magnitude of these phenological phases. As next steps, we will continue our synphenological observations in the most important ecosystems of southeastern Victoria Island, using an improved phenological key system with 12 phenological stages and also recording the relative cover of species in the various phenological stages.
AcknowledgementsWe would like to thank Cathy Anablak and Leonard Wingnek for their help with the phenological observations in field. We would also like to thank the Nunavut Department of Environment for issuing the Wildlife Research Permit for this project.
The strong compression of phenophases can be attributed to having only six to eight weeks available for plant growth in the Arctic climate of Cambridge Bay, where the cool and short growing season puts severe constraints on plant development. Depending on the particular year, complete snowmelt does not usually occur before mid-June (Environment Canada, 1953 onwards), with most plants already senescing in the second half of August (Fig. 1, 2). Therefore, there are only three somewhat discernible phenophases. The earliest phenophase, in which only species that overwinter with almost mature floral buds bloom, occurs immediately after snowmelt, while there is still only minimal leaf development in these species; for example, the purple saxifrage (Saxifraga oppositifolia), the willows Saxifraga richardsonii and S. arctica, and a few Draba. The second phenophase starts with the flowering of Pedicularis lanata, followed by the blooming of most other plants in the ecosystem. The last phenophase starts at the end of July or beginning of August with the flowering of a few late bloomers such as Hedysarum boreale ssp. mackenzii, Leymus mollis ssp. villosissimus and Arctagrostis latifolia (Fig. 1, 2). When considering the flowering of the various species, there does not seem to be any tendency for flowers of a certain colour to bloom together in a certain phenophase, which is the case in some temperate ecosystems, where species with yellow flowers tend to bloom towards the end of the growing season (Coldea and Wagner 1993–1994; Wagner 1994).
The senescence of most plants appears to be starting mid-August, when daily mean temperatures go below +7°C for the first time (Environment Canada, 1953 onwards). After this date, the daily mean temperatures decrease rapidly, and by the end of August most plants are completely senescent (Fig. 1, 2).
An interesting flowering phenology is exhibited by the legume Oxytropis arctobia, which flowers profusely in the first half of July, together with the species Dryas integrifolia and Oxytropis arctica. This species presents, however, a secondary flowering peak of a smaller magnitude very late in the season, towards the end of August, after its leaves start senescing (Figure 1). It is unknown whether this secondary blooming phase is due to a small number of individuals that delayed their flowering by several weeks, or individuals that are flowering twice, once during the main flowering phase and a second time late in the season. Because of the flowering energy investment constraints that plants in
Figure 2: Synphenological diagram for a 01 – Dryas integrifolia – Saxifraga oppositifolia mesic tundra ecosystem along the Dew Line Road, Cambridge Bay.
REPORT 201818
POLAR KNOWLEDGE Aqhaliat
REPORT 2018 19
POLAR KNOWLEDGE Aqhaliat
Wagner, I. 1994. Observații fenologice asupra unei pajiști mezofile din bazinul superior al Văii Huzii (Muntele Săcel, Jud. Cluj) (Phenological observations on a mesophilous meadow in the upper basin of the Huzii Valley, Săcel Mountain, Cluj county). Studia Universitatis Babeș-Bolyai, Biologia XXXIX (1):15–18.
Wagner, I. and Simons, A.M. 2008. Divergence among Arctic and alpine populations of the annual Koenigia islandica: Morphology, life history, and phenology. Ecography 32 (1):114–122. doi:10.1111/j.1600-0587.2008.05497.x.
Wheeler, H.C., Høye, T.T., Schmidt, N.M., Svenning, J-C, and Forchhammer, M.C. 2015. Phenological mismatch with abiotic conditions—implications for flowering in Arctic plants. Ecology 96 (3):775–787. doi:10.1890/14-0338.1.
Wookey, P., Parsons, A.N., Welker, J.M., Potter, J.A., Callaghan, T.V., Lee, J.A., and Press, M.C. 1993. Comparative responses of phenology and reproductive development to simulated environmental change in Subarctic and High Arctic plants. Oikos 67:490–502.
McLennan, D.S., MacKenzie, W.H., Meidinger, D.V., Wagner, J., and Arko, C. 2018. A standardized ecosystem classification for the coordination and design of long-term terrestrial ecosystem monitoring in Arctic-Subarctic biomes. Arctic 71 (Suppl. 1):1–15. Available from doi:https://doi.org/10.14430/arctic4621.
Molau, U. 1993. Relationships between flowering phenology and life history strategies in tundra plants. Arctic, Antarctic, and Alpine Research 25 (4):391–402.
Molau, U., and Mølgaard, P. 1996. ITEX manual. Danish Polar Center, Copenhagen.
Mooney, H.A. and Billings, W.D. 1961. Comparative physiological ecology of arctic and alpine populations of Oxyria digyna. Ecological Monographs 31 (1):1–29.
Panchen, Z.A. and Gorelick, R. 2015. Flowering and fruiting responses to climate change of two Arctic plant species, purple saxifrage (Saxifraga oppositifolia) and mountain avens (Dryas integrifolia). Arctic Science 1 (2):45–58. doi:10.1139/as-2015-0016.
Panchen, Z.A. and Gorelick, R. 2016. Canadian Arctic Archipelago conspecifics flower earlier in the High Arctic than the mid-Arctic. International Journal of Plant Sciences 177 (8):661–670. doi:10.1086/687984.
Panchen, Z.A. and Gorelick, R. 2017. Prediction of Arctic plant phenological sensitivity to climate change from historical records. Ecology and Evolution 7 (5):1325–1338. doi:10.1002/ece3.2702.
Pilková, I. 2015. Synphenology of herb layer of Carpinion betuli community in the Báb Forest. Acta Universitatis Agriculturae Silviculturae Mendelianae Brunensis 63 (5):1513–1521.
Puppi, G. 2007. Origin and development of phenology as a science. Italian Journal of Agrometeorology 3:24–29.
Reynolds, D.N. 1984. Alpine annual plants: phenology, germination, photosynthesis, and growth of three Rocky Mountain species. Ecology 65 (3):759–766.
Thórhallsdóttir, T.E. 1998. Flowering phenology in the central highland of Iceland and implications for climatic warming in the Arctic. Oecologia 114 (1):43–49.
Dierschke, H. 1989b. Symphänologische Aufnahme-und Bestimmungsschlüssel für Blütenpflanzen und ihre Gesellschaften in Mitteleuropa (Synphenological recording and identification keys for flowering plants and their communities in Central Europe). Tuexenia 9:477–484.
Dierschke, H. 1991. Phytophänologische Untersuchungen in Wäldern: Methodische Grundlagen und Anwendungsmöglichkeiten im passiven Biomonitoring (Plant phenology investigations in forests: Methodological basis and application possibilities in passive biomonitoring). Beihefte zu den Veröffentlichungen für Naturschutz und Landshaftspflege in Baden-Württemberg 64:76–86.
Environment Canada. Historical climate data for Cambridge Bay Airport, Nunavut (1953 onwards). Available from http://climate.weather.gc.ca/historical_data/search_historic_data_e.html [accessed 22 June 2018].
Fang, X. and Chen, F. 2015. Plant phenology and climate change. Science China Earth Sciences 58 (6):1043–1044. doi:10.1007/s11430-015-5077-7.
Forrest, J. and Miller-Rushing, A.J. 2010. Toward a synthetic understanding of the role of phenology in ecology and evolution. Philosophical Transactions of the Royal Society B: Biological Sciences 365 (1555): 3101 –3112.
Heide, O.M. 1992. Flowering strategies of the High-Arctic and high-alpine snow bed grass species Phippsia algida. Physiol Plantarum 85 (4):606–610.
Intergovernmental Panel on Climate Change. 2007. Climate change 2007: Synthesis report. Cambridge University Press, New York.
Keller, F. and Körner, C. 2003. The role of photoperiodism in alpine plant development. Arctic, Antarctic, and Alpine Research 35 (3):361–368.
Mark, A.K.G., Nanna, B., and Elisabeth, J.C. 2016. High Arctic flowering phenology and plant–pollinator interactions in response to delayed snow melt and simulated warming. Environmental Research Letters 11 (11):115006.
ReferencesBean, D. and Henry, G. 2003. CANTTEX field manual: Part A—setting up a basic monitoring site. Eman North, London.
Bjorkman, A.D., Elmendorf, S.C., Beamish, A.L., Vellend, M., and Henry, G.H.R. 2015. Contrasting effects of warming and increased snowfall on Arctic tundra plant phenology over the past two decades. Global Change Biology 21 (12):4651–4661. doi:10.1111/gcb.13051.
Borner, A.P., Kielland, K., and Walker, M.D. 2008. Effects of simulated climate change on plant phenology and nitrogen mineralization in Alaskan Arctic tundra. Arctic, Antarctic, and Alpine Research 40 (1):27–38.
Cleland, E.E., Chuine, I. and Menzel, A. 2007. Shifting plant phenology in response to global change. Trends in Ecology and Evolution 22 (7):357–365.
Coldea, G. and Wagner, I. 1993–1994. Cercetări simfenologice asupra vegetației din bazinul superior al Văii Huzii (Muntele Săcel) (Synphenological research on the vegetation of the upper basin of the Huzii Valley, Săcel Mountain). Contribuții Botanice:23–28.
Dierschke, H. 1972. Zur Aufnahme und Darstellung phänologischer Erscheinungen in Pflanzengesellschaften (About recording and representation of phenological events in plant communities). In: Grundfragen und Methoden in der Pflanzensoziologie. Dr. W. Junk N.V., pp 291–311.
Dierschke, H. (1982) Pflanzensoziologische und ökologische Untersuchungen in Wäldern Süd-Niedersachsens: 1. Phänologischer Jahresrhythmus sommergrüner Laubwälder (Plant community and ecological investigations in the forests of southern Lower Saxony: I. Annual phenological rhythm of deciduous forests). Tuexenia 2:173–194.
Dierschke, H. 1989a. Kleinräumige Vegetationsstruktur und phänologischer Rhythmus eines Kalkbuchenwaldes (Small-scale vegetation structure and phenological rhythm of a beech forest on limestone). Verhandlungen der Gesellschaft für Ökologie 17:131–143.