Varieties Under Different Environmental Conditions in Palestine · 2015-11-05 · IV...
143
An-Najah National University Faculty of Graduate Studies Morphological and Agronomic Traits Characterization of Local Durum Wheat (Triticum turgadum var. durum) Varieties Under Different Environmental Conditions in Palestine By Nasser Mohammad Mahmoud Abbadi Supervisor Dr. Hassan Abu- Qaoud Co- Supervisor Dr. Aziz Salameh This Thesis is Submitted in Partial Fulfillment of the Requirements for the Degree of Master of Plant Production, Faculty of Graduate Studies, An-Najah National University, Nablus, Palestine. 2015
Transcript of Varieties Under Different Environmental Conditions in Palestine · 2015-11-05 · IV...
An-Najah National University
Faculty of Graduate Studies
Morphological and Agronomic Traits Characterization
of Local Durum Wheat (Triticum turgadum var. durum)
Varieties Under Different Environmental Conditions
in Palestine
By
Nasser Mohammad Mahmoud Abbadi
Supervisor
Dr. Hassan Abu- Qaoud
Co- Supervisor
Dr. Aziz Salameh
This Thesis is Submitted in Partial Fulfillment of the Requirements for
the Degree of Master of Plant Production, Faculty of Graduate
Studies, An-Najah National University, Nablus, Palestine.
2015

III
Dedication
This thesis is dedicated to:
The sake of Allah, my Creator and my Master.
My great teacher and messenger, Mohammed (May Allah bless
and grant him), who taught us the purpose of life.
My homeland Palestine, the warmest womb; the great martyrs and
prisoners.
The souls of my great parents, "Lord, be merciful to them just as
they brought me up with kindness and affection."
My beloved brothers and sister; who stands by me when things
look bleak.
My dearest wife, who leads me through the valley of darkness with
light of hope and support.
My beloved kids: Ahmad, Aya and Mohammed, the flowers of my
life and hope.
My friends who encourage and support me.
All the people in my life who touch my heart.
I dedicate this research.

IV
Acknowledgments
Praise and thanks to the Almighty Allah for conciliation, and providing
patience.
Financial support by ICARDA and AFESD is greatly acknowledged.
I owe a great deal of thanks to my supervisor Dr. Hassan Abu- Qaoud
for his generous advice, excellent suggestions, kindness, and allowing me
allot of his time.
Sincere thanks go to my second supervisor Dr. Aziz Salameh head of
plant production and protection research department- NARC who
helped me to do the field work and thesis preparation.
All appreciation and thanks to Dr. Mohammad Abu- Eid, director
general of NARC for his technical and administrative support through
time of research.
Sincere thanks are extended to Dr. Rula Sameer who had put her nice
input in formatting parts of the thesis, Eng. Sameh Jarrar for his
friendly help and technical support, Alot of thanks goes to all my
colleagues in Plant production and protection department, other
departments and agricultural stations of NARC.
Special appreciation to Dr. Abdullah Alomari, ICARDA coordinator in
Palestine for his constructive criticism, invaluable assistance and
guidance.
My appreciation is also extending to Dr. Jehad Abbadi, the head of
Biology department at Al-Quds University for his scientific support
during my study.

VI
List of Contents No. Content Page
Dedication III
Acknowledgments IV
Declaration V
Lists of Abbreviations VI
List of Contents VI
List of Tables X
List of Figures XIII
List of Abbreviations XIV
Abstract XV
Chapter 1: Introduction 1
Chapter 2: Literature Review 7
2.1 Taxonomy and Classification of wheat 7
2.2 Origin, domestication and distribution of wheat 8
2.3 Wheat landraces or local varieties 10
2.3.1 Definition and synonyms 10
2.3.2 General characteristics of landraces 11
2.3.3 Importance of wheat landraces in agro-systems 12
2.3.4 Conservation and utilization of wheat landrace 13
2.3.5 Landraces and the Future of Wheat Diversity 14
2.3.6 Characterization and evaluation of wheat landraces
studies 15
2.3.7 Studying wheat landraces in Palestine 16
2.4 Growth stages of wheat 16
2.5 Characterization and variety identification of wheat 17
2.5.1 Morphological Characterization 17
2.5.1.1 Seed characteristics 17
2.5.1.2 Seedling characteristics 18
2.5.1.3 Morphological characters of plant 18
2.5.2 Chemical characterization 20
2.5.2.1 Phenol test 20
2.5.2.2 Peroxidase enzyme activity test 21
2.5.2.3 Potassium hydroxide test 21
2.5.2.4 Sodium hydroxide test 21
2.5.2.5 Seedling growth response to GA3 22
2.5.3 Molecular marker 22
Chapter 3: Materials and Methods 23
3.1 Plant Material 23
3.2 Experimental Locations and Seasons 23

VII
3.3 Field Preparation 25
3.4 Sowing 25
3.5 Cultural Practices 25
3.5.1 Weed Control 25
3.5.2 Additive fertilization 26
3.5.3 Harvesting and threshing 26
3.6 Measured Parameters 26
3.6.1 Morphological Characterization 26
3.6.1.1 Plant vegetative characteristics 27
3.6.1.1.1 Coleoptile Anthocyanin Coloration (CAC) 27
3.6.1.1.2 Flag leaf Anthocyanin Coloration of Auricles (FACA) 27
3.6.1.1.3 Frequency of plants with recurved flag leaves (FPRF) 27
3.6.1.1.4 Glaucosity of lower side of flag leaf blade (GF ) 28
3.6.1.1.5 Glaucosity of ear's neck (GN ) 28
3.6.1.1.6 Peduncle attitude (PA) 28
3.6.1.1.7 Straw pith in cross (SPC) 28
3.6.1.1.8 Plant growth habit (GH) 29
3.6.1.2 Spike Characteristics 29
3.6.1.2.1 Spike glaucosity (SG) 30
3.6.1.2.2 Spike shape (SS) 30
3.6.1.2.3 Spike density (SD) 30
3.6.1.2.4 Spike color (SC) 30
3.6.1.2.5 Awns color (AC) 31
3.6.1.2.6 Awns attitude (AA) 31
3.6.1.2.7 Awns roughness (AR) 31
3.6.1.2.8 Awns or scurs presence (ASP) 31
3.6.1.2.9 Lower glume shape (GS) 31
3.6.1.2.10 Lower glume external hairiness (GEH) 32
3.6.1.2.11 Lower glume shoulder width (GSW) 32
3.6.1.2.12 Lower glume shoulder shape (GSS) 33
3.6.1.2.13 Lower glume peak length (GPL) 33
3.6.1.2.14 Lower glume peak curvate (GPC) 33
3.6.1.3 Grain characteristics 34
3.6.1.3.1 Grain color (GC) 34
3.6.1.3.2 Grain shape (GS) 34
3.6.2 Agronomic Traits Evaluation 35
3.6.2.1 Field growth performance 35
3.6.2.1.1 Number of fertile tillers per plant (NT) 35
3.6.2.1.2 Plant Height (PTHT) 35
3.6.2.1.3 Spike length (SL) 35
3.6.2.1.4 Awns length (AL) 35

VIII
3.6.2.1.5 Days to ear emergence (DEE) 36
3.6.2.1.6 Days to maturity (DMAT) 36
3.6.2.1.7 Filling period (FP) 36
3.6.2.2 Reaction to rust and lodging 36
3.6.2.2.1 Leaf rust reaction (LRR) 36
3.6.2.2.2 Lodging reaction (LOD) 38
3.6.2.3 Yield performance 38
3.6.2.3.1 Number of spiklets per spike (NSPS) 38
3.6.2.3.2 Number of grains per spike (NGS) 38
3.6.2.3.3 Thousand Grain weight by grams (TGW) 38
3.6.2.3.4 Hectoliter Grain weight (HGW) 38
3.6.2.3.5 Biological Yield (BYLD) 39
3.6.2.3.6 Grain Yield (GYLD) 39
3.6.2.3.7 Straw Yield (SYLD) 39
3.7 Experimental Design and Data analysis 40
Chapter 4: Results and Discussion 41
4.1 Morphological Characterization 41
4.1.1 Plant vegetative characteristics 41
4.1.1.1 Coleoptile Anthocyanin Coloration (CAC) 41
4.1.1.2 Flag leaf Anthocyanin Coloration of Auricles (FACA) 42
4.1.1.3 Frequency of plants with recurved flag leaves (FPRF) 42
4.1.1.4 Glaucosity of lower side of flag leaf blade (GF ) 43
4.1.1.5 Glaucosity of ear's neck (GN ) 43
4.1.1.6 Peduncle attitude (PA) 44
4.1.1.7 Straw pith in cross (SPC) 44
4.1.1.8 Plant growth habit (GH) 45
4.1.2 Spike Characteristics 47
4.1.2.1 Spike glaucosity (SG) 47
4.1.2.2 Spike shape (SS) 47
4.1.2.3 Spike density (SD) 48
4.1.2.4 Spike color (SC) 48
4.1.2.5 Awns color (AC) 49
4.1.2.6 Awns attitude (AA) 49
4.1.2.7 Awns roughness (AR) 50
4.1.2.8 Awns or scurs presence (ASP) 50
4.1.2.9 Lower glume shape (GS) 53
4.1.2.10 Lower glume external hairiness (GEH) 53
4.1.2.11 Lower glume shoulder width (GSW) 54
4.1.2.12 Lower glume shoulder shape (GSS) 54
4.1.2.13 Lower glume peak length (GPL) 54
4.1.2.14 Lower glume peak curvate (GPC) 55

IX
4.1.3 Grain characteristics 56
4.1.3.1 Grain color (GC) 56
4.1.3.2 Grain shape (GS) 57
4.2 Agronomic Traits Evaluation 57
4.2.1 Number of fertile tillers per plant (NT) 58
4.2.2 Plant Height (PTHT) 59
4.2.3 Spike length (SL) 59
4.2.4 Awns length (AL) 60
4.2.5 Days to ear emergence (DEE) 64
4.2.6 Days to maturity (DMAT) 65
4.2.7 Filling period (FP) 66
4.2.8 Leaf rust reaction (LRR) 67
4.2.9 Lodging reaction (LOD) 70
4.2.10 Number of spiklets per Spike (NSPS) 71
4.2.11 Number of grains per Spike (NGS) 74
4.2.12 Thousand Grain weight by grams (TGW) 75
4.2.13 Hectoliter Grain weight (HGW) 76
4.2.14 Biological Yield (BYLD) 80
4.2.15 Grain Yield (GYLD) 80
4.2.16 Straw Yield (SYLD) 81
4.3 Similarity matrix and Cluster Analysis 86
4.3.1 Similarity matrix 86
4.3.2 Cluster Analysis 87
Chapter 5: Conclusions and Recommendations 89
5.1 Conclusions 89
5.2 Recommendations 90
References 91
Appendix 107
ب الملخص

X
List of Tables No. Table Page
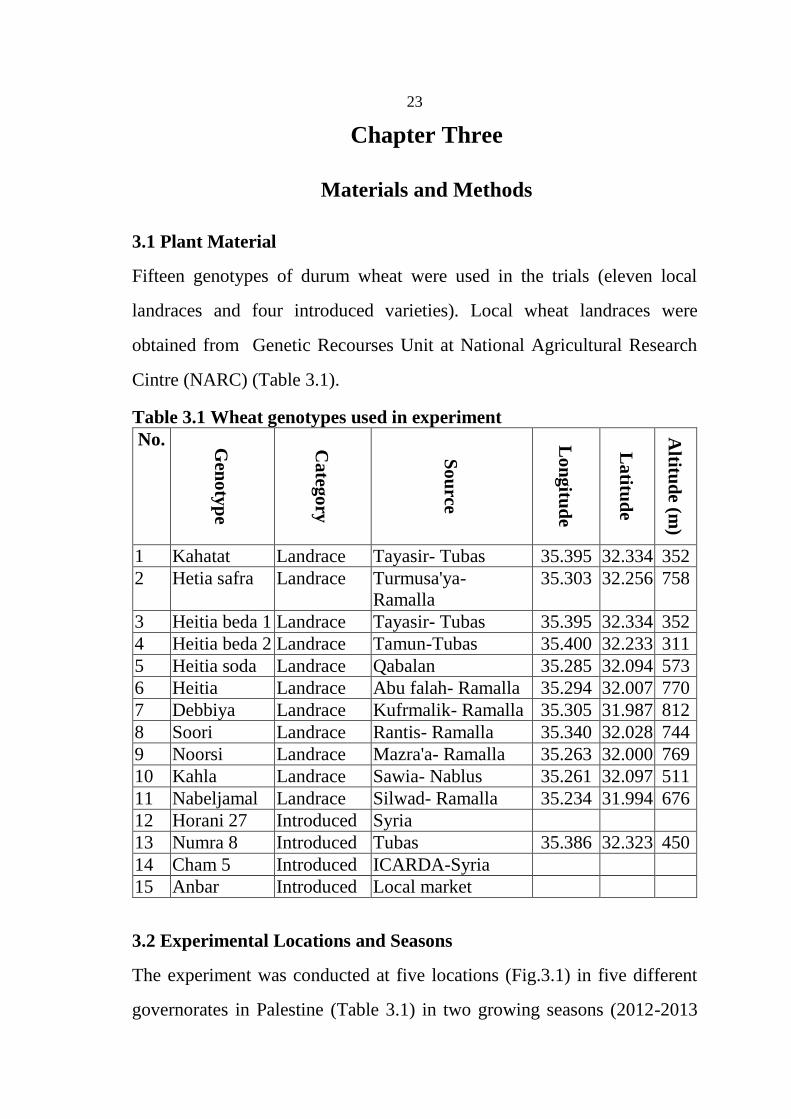
3.1 Wheat genotypes used in experiment 23
3.2 Locations of Experiment. 25
4.1
Identification wheat genotypes based on Coleoptile
Anthocyanin Coloration (CAC), Flag leaf Anthocyanin
Coloration of Auricles (FACA), Frequency of plants
with recurved flag leaves (FPRF), Glaucosity of lower
side of flag leaf blade (GF), Glaucosity of spike's neck
(GN) Peduncle attitude (PA), Straw pith in cross (SPC)
and Plant growth habit (GH).
46
4.2
Identification of wheat genotypes based on Spike
glaucosity (SG), Spike shape (SS), Spike density (SD),
and Spike color (SC) Awns color (AC), Awns attitude
(AA), Awns roughness (AR) and Awns or scurs
presence (ASP).
52
4.3
Identification of wheat genotypes based on Lower
glume shape (GS), Lower glume external
hairiness(GEH), Lower glume shoulder width (GSW),
Lower glume shoulder shape (GSS) and Lower glume
peak length (GPL).
55
4.4
Identification of wheat genotypes based on Lower
glume peak shape (GPS), Lower glume peak curvate
(GPC), Grain color (GC) and Grain shape (GS)
56
4.5
Analysis of variance of wheat genotypes based on
Number of fertile tillers per plant (NT), Plant height
(PTHT), Spike length (SL) and Awns length (AL).
62
4.6
Location and season mean of wheat genotypes based on
Number of fertile tillers per plant (NT), Plant height
(PTHT), Spike length (SL) and Awns length (AL).
62
4.7 Identification of wheat genotypes based on Number of
fertile tillers per plant (NT) and Plant height (PTHT). 63
4.8 Identification and grouping of wheat genotypes based
on Spike length (SL) and Awns length (AL). 64
4.9
Analysis of variance of wheat genotypes based on Days
to ear emergence (DEE), days to maturity (DMAT) and
filling period (FP).
68
4.10
Location and season mean of wheat genotypes based on
days to ear emergence (DEE), days to maturity
(DMAT) and filling period (FP).
68
4.11 Identification of wheat genotypes based on Days to 69

XI
Spike emergence (DSE) and days to maturity (DMAT)
and Filling period (FP).
4.12 Analysis of variance of wheat genotypes based on Leaf
rust reaction (LRR) and Lodging reaction (LOD). 72
4.13 Location and season mean of wheat genotypes based on
Leaf rust reaction (LRR) and Lodging reaction (LOD). 72
4.14 Identification of wheat genotypes based on Leaf rust
reaction (LRR) and Lodging reaction (LOD). 73
4.15
Analysis of variance of wheat genotypes based on
Number of spiklets per spike (NSPS), Number of grains
per spike (NSS), Thousand Grain weight by grams
(TGW) and Hectoliter Grain weight (HGW).
77
4.16
Location and season mean of wheat genotypes based on
Number of spiklets per spike (NSPS), Number of grains
per spike (NSS) and Thousand Grain weight by grams
(TGW)
77
4.17
Identification of wheat genotypes based on Number of
spiklets per spike (NSPS), Number of grains per spike
(NSS) and Thousand Grain weight by grams (TGW).
78
4.18 Identification of wheat genotypes based on Hectoliter
Grain weight (HGW) and Biological yield (BYLD). 79
4.19
Analysis of variance of wheat genotypes based on
Biological yield (BYLD), Grain yield (GYLD) and
Straw yield (SYLD).
83
4.20
Location and season mean of wheat genotypes based on
Biological yield (BYLD), Grain yield (GYLD) and
Straw yield (SYLD).
83
4.21 Identification of wheat genotypes based on Grain yield
(GYLD) and Straw yield (SYLD). 84
4.22 Means of wheat landraces and introduced varieties
based on all 16 agronomic traits in study. 85
4.22 Similarity coefficient among wheat cultivars based on
Jaccard similarity index. 86
5.1 Kahatat genotype descriptors and means. 108
5.2 Heitia safra genotype descriptors and means. 109
5.3 Heitia beda 1 genotype descriptors and means. 110
5.4 Heitia beda 2 genotype descriptors and means. 111
5.5 Heitia soda genotype descriptors and means 112
5.6 Heitia genotype descriptors and means. 113
5.7 Debbiya genotype descriptors and means. 114
5.8 Soori genotype descriptors and means. 115

XII
5.9 Noorsi genotype descriptors and means. 116
5.10 Kahla genotype descriptors and means. 117
5.11 Nabeljamal genotype descriptors and means. 118
5.12 Horani 27 genotype descriptors and means. 119
5.13 Numra 8 genotype descriptors and means. 120
5.14 Cham 5 genotype descriptors and means. 121
5.15 Anbar genotype descriptors and means. 122
5.16 Decimal code used to quantify the growth stages in
cereals 123
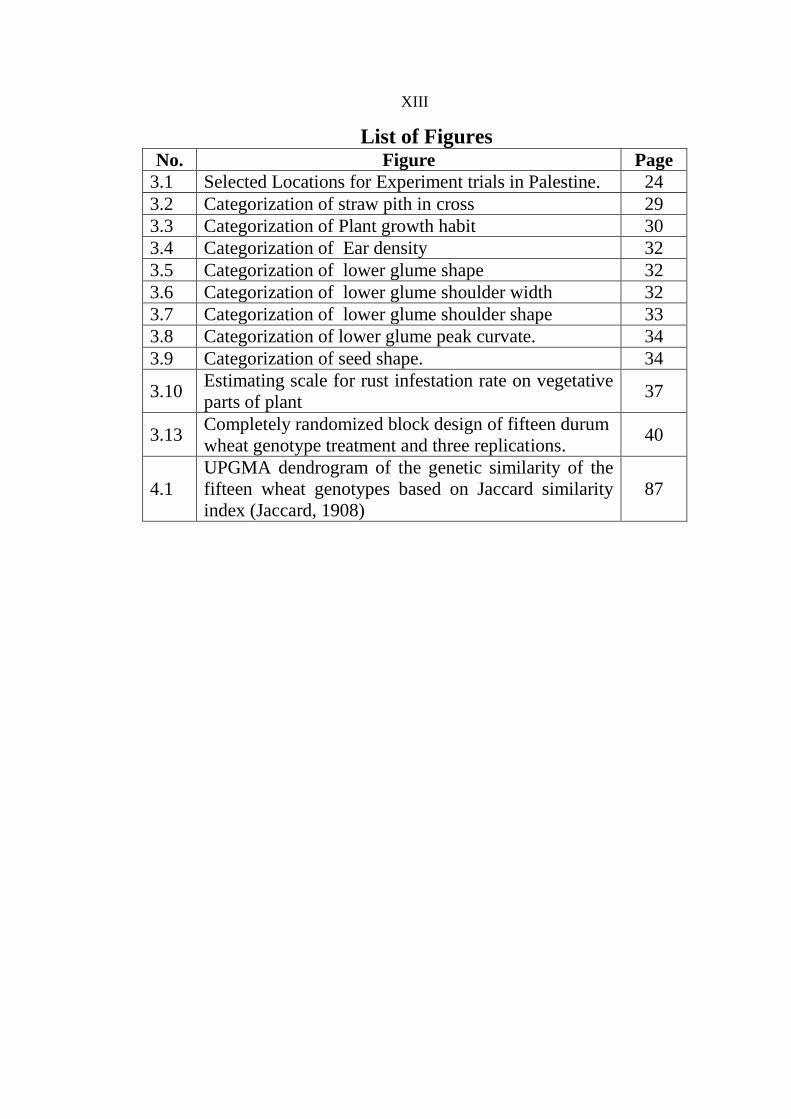
XIII
List of Figures No. Figure Page
3.1 Selected Locations for Experiment trials in Palestine. 24
3.2 Categorization of straw pith in cross 29
3.3 Categorization of Plant growth habit 30
3.4 Categorization of Ear density 32
3.5 Categorization of lower glume shape 32
3.6 Categorization of lower glume shoulder width 32
3.7 Categorization of lower glume shoulder shape 33
3.8 Categorization of lower glume peak curvate. 34
3.9 Categorization of seed shape. 34
3.10 Estimating scale for rust infestation rate on vegetative
parts of plant 37
3.13 Completely randomized block design of fifteen durum
wheat genotype treatment and three replications. 40
4.1
UPGMA dendrogram of the genetic similarity of the
fifteen wheat genotypes based on Jaccard similarity
index (Jaccard, 1908)
87

XIV
List of Abbreviations Abbreviation Full Name
2, 4- D 2,4-Dichlorophenoxyacetic acid
AFESD Arab Fund for Economic and Social Development
DUS Distinctness, uniformity and stability
FAO Food and Agriculture Organization
GENSTAT General Statistics Analysis Program
ICARDA International Center for Agricultural Research in
Dry Areas
MoA Ministry of Agriculture
NARC National Agricultural Research Center
RAPD Random amplified polymorphic DNA
RCBD Randomized Complete Block Design
UNDP United Nations Development Program
UPOV Union for the Protection of new Varieties of Plants
XV
Morphological and Agronomic Traits Characterization of Local
Durum Wheat (Triticum turgadum var. durum) Varieties Under
Different Environmental Conditions in Palestine
By
Nasser Mohammad Mahmoud Abbadi
Supervisor
Dr. Hassan Abu- Qaoud
Co- Supervisor
Dr. Aziz Salameh
Abstract
Wheat (Triticum turgadum var. durum) is one of the most important field
crops in Palestine with an area exceeds 220000 dunum and an average
productivity of 136 kg/dunum that represents less than 45% of average
world productivity. This shortage is due to the effect of unfavorable local
environmental conditions for used cultivars. The introduction of high
yielding and well adapted cultivars could be one of the best resolutions.
The establishment of national breeding program will fascilate this task
through the collection and evaluation available of genetic resources.
Palestine is rich with wild relatives of durum wheat and many landraces are
still grown in different regions in Palestine that could be considered as a
genetic resurve. Little information is available about the phenotypic
description and agronomic performance of these landraces. Moreover,
synonyms and antinomy are existed among farmers, agronomists and
scientists when dealing with wheat landraces. The need to identify
landraces and common varieties is a priority. The published data on
morphological and agronomic identification for genetic resources of durum
wheat landraces in Palestine are very scarce and not sufficient.

XVI
The main objective of this investigation was to make clear identification of
fifteen durum wheat varieties grown in Palestine through the
characterization of the phenotypic traits and agronomic performance under
different environmental conditions.
The fifteen genotypes of durum wheat under the study included eleven
local landraces (Kahatat, Heitia safra, Heitia beda 1, Heitia beda 2, Heitia
soda, Heitia, Debbiya, Soori, Noorsi, Kahla and Nabeljamal), and four
introduced varieties (Horani 27, Numra 8, Cham 5 and Anbar). All studied
genotypes were grown in randomized complete block design (RCBD) trials
at five different climatic locations (Beit- Qad station, Tubas, Tulkarm
station, Za'tara and Arroub station) during two growing seasons (2012-
2013 and 2013-2014). Forty morphological and agronomic traits were
evaluated. Data were collected according to UPOV (Union for the
Protection of new Varieties of Plants) guidelines and analyzed using
GENSTAT statistical program.
The results revealed the presence of high variations among the genotypes in
thirty eight traits. Cluster analysis grouped genotypes in five main clusters
according to relatedness and variation for all studied trait. The performance
of landraces was not stable under different environmental conditions as
most of them showed high straw but low grain yield as Nabeljamal variety
(922 Kg/du straw and 201 Kg/du grain yield).
The results obtained from this study led to a clear morphological
identification of studied varieties, especially for local landraces at levels
with synonyms and antinomy problem removed. Genetic variation revealed

XVII
that, local landraces could be considered as a primary step to launch a
national breeding program for the development of new wheat cultivars
adapted to harsh climatic conditions.

1
Chapter One
Introduction
Wheat (Triticum spp.) is one of the most important stable and economic
food crops for more than one third of the world population. It is widely
cultivated in the world with total area of 218 million hectares that
represents about 17% of total planted area and production of 713 million
tons, and productivity of 3.3 tons per hectare (FAO, 2013). Wheat
contributes more calories and proteins to the world diet than any other
cereal crops (Nimbal et al., 2009). In addition, it provides nearly 55% of
carbohydrate and 20% of the food calories. Wheat grains contains 78.10%
carbohydrate, 14.70% protein, 2.10% fat, 2.10% minerals and considerable
proportions of vitamins (thiamine and vitamin-B) and minerals mainly zinc
and iron (Kumar et al., 2011).
Historically, it was documented that wheat was grown in the earliest sites
of civilization and played a crucial role in humanity development by
providing food to one third of people in those sites (Breiman and Graur,
1995). The origin of habitat for many crops including wheat was the region
of Fertile Crescent which spread from Palestine and Jordan through Syria,
Lebanon, south Turkey to north Iraq and Iran (Nevo, 1998). Wild wheat
spread naturally in a broad spectrum of variability and many landraces are
still grown and conserved in sito by local farmers. From this primary origin
wheat was transmitted to new sites in the Mediterranean area and then to
the rest of the world (Harlan, 1981).

2
Agriculture is an essential component of the Palestinian national, cultural
and economic life. Palestinians have been pioneers in transmitting and
disseminating agricultural techniques to several countries in the region and
outside. In addition to its traditional significance for nations and states,
agriculture is particularly important for Palestinians as it embodies their
perseverance, confrontation and adherence to their land under the threat of
confiscation and settlement activities. It also provides a refuge and a source
of income and food supplies at times of crises (Agricultural Sector
Strategy, MoA, Ramallah, Palestine, 2009).
In addition, Palestine lies within the Fertile Crescent Center of diversity
where wheat, barley, lentil, and several food and feed legumes and fruit
trees have originated over the last 10,000 years. Cereals, food legumes, and
fruit trees are major crop commodities contributing to food security of the
Palestinian people (UNDP, 1998).
Wheat is the major cultivated field crop in Palestine with more than 22000
hectares. The majority of wheat produced in West Bank was in Jenin,
Tubas, and Ramallah districts. Durum wheat is the predominant type of
wheat and met more than 70% of the total planted areas with wheat in West
Bank, with about 96% is cultivated under rain fed system (PCBS, 2008).
It was documented that, average productivity of wheat in West Bank was
1360 kg/ha (PCBS, 2008). This productivity is very low as compared to
the world productivity which exceeded 3000 kg/he (FAO, 2008). This large
difference in average production may be due to many determinant effects
of biotic and abiotic conditions (Salimia and Atawnah, 2014). The well

3
known two ways to increase production are to increase the cultivated area
which is very limited in the Occupied Palestinian areas or to increase the
production per unit area which may be achieved by introducing high
yielding varieties. One strategic approach towards the second goal might be
through the establishment of a national breeding program that depends
primarily on evaluating available genetic resources of wild relatives of
wheat, cultivated landraces or local varieties, introducing lines and
cultivars in order to domesticate high yielding and/ or stress tolerant
cultivars (Gepts, 2006).
The Palestinian farmers still grow old local durum wheat varieties
(landraces) for several reasons. First, political situation, the accessibility to
obtain new improved durum varieties with high yielding potential and good
level of resistance to biotic and abiotic stress from regional and
international research institutes is very difficult. Second, there is no active
national breeding program for producing improved lines of durum wheat.
Moreover, the landraces of durum wheat are common to farmer and
adapted to local environmental harsh conditions (Jaradat, 2013). Therefore,
the intensive use of introduced cultivars of durum wheat with high
productivity and well agronomic performance threaten local varieties by
losing and disappearing from the agricultural map by the Palestinian
farmers. Consequently, many useful genes may disappear forever (Jaradat,
2013). The performance of cultivated landraces of wheat against biotic and
abiotic stress conditions is not evaluated yet.

4
Pre-breeding activities such durum wheat landraces collection,
characterization and agronomic performance evaluation are the first steps
in the long way to establish a sufficient national wheat breeding program in
Palestine. Several national institutes in Palestine already have collected
various landraces of durum wheat from farmers and started either to
conserve it in germplasm units or distribute these seeds to neighboring
farmers without sufficient agronomic data. This situation lead to what
called “synonyms phenomena”. Consequently, losses of many landraces of
wheat could be form a solid genetic basis for future national breeding
program. On other side, conserving the durum wheat without
characterization is useless since many agronomic traits and a pool of useful
genetic variation could be lost without any evaluation.
Therefore, the characterization of the collected landraces of durum wheat
and the evaluation of its agronomic performance under different climate
conditions are necessary steps in Palestine and should be implemented
prior to any breeding program.
Characterization and identification of local varieties could be done using
morphological, chemical or molecular methods (Salimia and Atawnah,
2014). Morphological methods are classical approaches that have been
used since many years in the world by using various traits side by side with
chemical and molecular methods which had been widely used in last
decades. Few researches were conducted in Palestine on identification of
local wheat varieties, and most of them based on molecular
5
characterization, while there is a big gap in using precious morphological
traits.
Objective
The main objective of this investigation is to characterize the phenotypic
and agronomic traits of fifteen durum wheat varieties (eleven landraces and
four introduced) grown in different climatic conditions in Palestine.
Study Significance and Justifications
In spite of the importance of wheat landraces in Palestine as a genetic
recourse for wheat improvement, little information is available about their
description and field performance. Moreover, synonyms and antinomy are
existed among farmers, agronomists and scientists when dealing with
landraces. This situation may confuse and mislead scientists or agronomists
and farmers. Therefore, the need to identify local landraces and varieties
through clarification and discrimination work is urgent. The published data
on previous identification for genetic resources of durum wheat in Palestine
are very rare and this study could be a comprehensive work on the
characterization of available landraces in terms of morphology and yield
components. The study doesn't stand at agronomic traits evaluation but
covers the morphological characterization as well. Using UPOV guidelines
as international standards in morphological description of varieties will
uniform the language of scientists, agronomists and genetic diversity
specialists. This research is considered the first step in the long way to
launch a national breeding program for durum wheat in Palestine.
6
Study outputs and applications:
The expected specific outputs from this study include:
Create a clear morphological characterization for wheat landraces in
Palestine with releasing a descriptive identification in the shape of a
guide manual for the benefit of farmers, agronomists and researchers.
Evaluate the agronomic traits of wheat particularly the yield
components under different climatic conditions as part of variety
characteristics.
Study the genetic variation and relatedness between genotypes of
durum wheat in Palestine in comparison with some improved or
introduced genotypes based on morphological and agronomic
characteristics and make it available for researchers to be used in
future improving programs.
7
Chapter Two
Literature Review
2.1 Taxonomy and Classification of wheat
Wheat is an annual cereal grass belongs to the family Graminae (Poaceae)
and to genus Triticum. This genus includes many wild and cultivated
species that could be classified into four main groups according to the
number of chromosomes, morphological and botanical characteristics
(Chapman and Carter, 1976)
These main wheat groups are:
1) Diploid group (1n= 7, 2n= 14): this group includes T. aegilepoids
(wild single grain wheat), T. urothum (wild wheat), T. monococcum L.
(single grain cultivated wheat in limited areas).
2) Tetraploid group (1n= 14, 2n= 28): includes Emmer ( two grain wild
wheat) and the cultivated species T. dicoccum SHS, T. durum Desf., T.
turgidum L., T. polonicum L., T. tauranicum Jak., T. persicum L., T.
peramidale (Perc), T. timo pheevi Zhukov, T. palaeq cal chicum Men
and T. carthicum Nev.
3) Hexaploid group (1n= 21, 2n= 42): Includes T. spelta L., T. macha
Dek, T. compactum Host, T. sphaerococcum Pere, T. vavilovi Jacobs,
T. aestivum and T. amplissifolium Zhuk.
4) Octaploid group (1n= 28, 2n= 56): this group includes only one
species of wheat; T. fungicidum Zhuk.

8
2.2 Origin, domestication and distribution of wheat
The domestication of wild wheat dates back to about 10000 years in the
Near East. It is documented that wild einkorn (T. monococcum sp.
aegilopoides) may have been domesticated to einkorn wheat (T.
monococcum) in Karacadag Mountains region in southeast Turkey
(Heun et al., 1997), where the wild form was cultivated also in parallel.
Also the cultivated emmer (T. dicoccon) was registered in several
regions in Syria dating back to 7500 BC. By the Bronze Age, These
wild forms of wheat had been replaced by higher yielding and free
threshing tetraploid and hexaploid wheats in cultivation, (Zohary and
Hopf 1993). Currently, einkorn is only cultivated in small areas in the
Mediterranean region (Perrino et al., 1996), while its wild form is
spread naturally in some locations of that region (Zohary and Hopf
1993).
Bread wheat (T. aestivum) appspikeed first in Transcaucasia, Southwest
of Iran in the time that Aegilops tauschii ssp. strangulate, was
predominant in the region and hybridized with cultivated emmer (T.
dicoccon) to produce T. aestivum (Dvorak, 1998).
The domesticated wheats as a result of man selection since 10000 years or
more, have acquired a stockpile of genes for high productivity but with a
narrow genetic base. In the time that wild relatives have acquired a larger
reservoir of genes due to natural adaptation to a great diversity of
environments during the evolutionary time. This wide pool in the wild
9
populations has remained largely unavailable, or at least unused by wheat
breeders (Johnson and Walnes, 1977).
At the time when domestication has occurred in the Karadagh Mountains,
Turkey. Following a cross between tetraploid T. turgidum and diploid goat
grass (Aegilops cylindrica Host), the resultant hexaploid (6x) bread wheat
was disseminated around the Caucasian region, then around the Old World.
These events, although resulted in wheat domestication, created genetic
bottlenecks (Hammer et al., 1996), which excluded potentially adaptive
alleles. More recently, the development of high yielding wheat varieties
which caused a loss of much of the diversity in wheat landraces and old
cultivars. A significant decrease of genetic diversity has been observed
related to the replacement of bread wheat landraces by high yielding
cultivars which appear to be associated with the loss of some quality traits
such as protein content and glutenine quality (Distefeld et al., 2007).
In general, domestication of wheat resulted in the enhancement changes in
some of important traits of wheat such as:
1. An increase in grain size, associated with better germination and growth
of seedlings in cultivated fields.
2. The development of non-shattering seed, which decreased natural seed
dispersal and allowed humans to harvest and collect the seed with optimal
timing (Willcox, 1998).
Wheat Distribution
After domestication, wheat cultivation was reported about 6000 years ago
in the Mesopotamian Fertile Crescent. From that region it spread to the

10
Middle East, North Africa, Asia and Europe. Wheat spread to the
Americans and Southern Africa around 1500 AD, and was introduced into
Australia in 1790. Recently, wheat is the most widely and diversely
cultivated food crop in the world. It is grown under different altitudes, from
the sea level up to 4500m, which reflects its wide cultivability and
adaptability (Harlan, 1981).
2.3 Wheat landraces or local varieties
2.3.1 Definition and synonyms
Since 1890, tens of definitions had been proposed to describe the term
"landrace" and its relative synonyms (Zeven, 1998). Teshome et al. (1997)
defined landraces as "variable plant populations adapted to local agro
climatic conditions, which are named, selected and maintained by the
traditional farmers to meet their social economic, cultural and ecological
needs. While Zeven (1998) proposed that landrace could be defined as "a
variety with a high capacity to tolerate biotic and abiotic stress, resulting in
a high yield stability and an intermediate yield level under a low input
agricultural system".
A number of synonyms for the term "landrace" have been used in
literature. Zeven (1998) reported a number of synonyms for landrace as
used in the literature, and their mutual relationship according to each
author:
Race (Leng et al., 1962)
Local variety (Brandolini, 1969, Bellon & Brush, 1994)
11
Ecotype ( Brandolini, 1969)
Landrace population (Harlan, 1975)
Local population (Camussi, 1979)
Landrace (Zeven, 1986)
Traditional cultivar (Old field & Alcon, 1987)
Farmer variety (Bellon & Brush, 1994)
Farmer population (Cleveland et al., 1994)
2.3.2 General characteristics of landraces
Thousands of years of cultivation combined with natural and human
selection have resulted in the development of a wide diversity of genotypes
in wheat species. Traditional management of wheat landraces by farmer
contributed to the conservation of a considerable level of diversity.
Therefore, a wheat landrace is not a genetically and phenotypically stable,
distinct, and uniform unit (Morris and Heisey, 1998).
The complexity genetic structure of wheat landraces populations may arise
from the number of different homozygotes and the occurrence and
frequency of heterozygotes in these populations. Therefore, characterization
of the population structure of wheat landraces is critical to identify and
interpret correctly the correlation between their functional and molecular
diversity (Brown, 2000).
Wheat landraces as compared to modern cultivars, with relatively higher
biomass, may don't develop larger root dry mass, but in increased ratio of
root mass to penetrates deeper in soil profiles, increased ability to obtain
moisture from those depths, and higher water use efficiency. In addition,
12
their higher concentration of soluble carbohydrates in the stem shortly after
anthesis ensures adequate translocation of photo assimilates to the
developing grains. These properties enable wheat landraces to face harsh
conditions especially season- late drought by early maturation (Ayed et al.,
2010). Some wheat landraces have a unique characteristic of facultative
growth habit which provides flexibility of sowing either in the fall as a
winter crop or, after the failure of the crop in winter, again in the spring.
Under limited nitrogen availability in soil, wheat landraces with a taller
growth habit and lower harvest index have the ability to absorb and
translocate more nitrogen into the grain than modern varieties (Geneç et al.,
2005). Because wheat landraces have been developed mostly in low
available nutrient environments, they represent a source of genetic
variation for selection of varieties adapted to low fertilizer input cropping
systems (Distefeld et al., 2007; Koshgoftarmanesh et al., 2010).
2.3.3 Importance of wheat landraces in agro-systems
As long time of wheat history, farmers were behind the conservation and
development of wheat genetic diversity (Zeven, 2000). The landraces and
old cultivars they developed can be considered as evolutionary links
between wild emmer wheat, the wild progenitor of all domesticated wheat,
and advanced wheat cultivars. Often landraces have remained undisturbed
over decades as they are well adapted to the selection pressure coming
from specific eco-geographical structures (Nevo, 1998). Given their
longstanding adaptation to specific environments, landraces may have
developed a broad spectrum of resistance to various biotic and abiotic
13
threats, which can make them a useful resource to breed new cultivars in
which high yield is combined with stress resistance. Nowadays, many
local landraces have been disappearing due to retreating of traditional
farming systems, genetic erosion, or even the aging or exodus of rural
population, and environmental degradation (Mercer and Peralis, 2010),
that have led to the extinction of many local landraces. As a consequence,
the disappearance of most of unique cereal biodiversity and the information
about landraces and traditional cultivars are now very rare. Several reports
estimated that about 75% of the genetic diversity of crop plants had been
lost in the last century (Hammer et al., 1996; Witcombe et al., 1996). This
dangerous disappearance of these valuable genetic resources results in a
severe threat to the world's long-term food security. In this case, there is an
urgent need to identify, preserve and utilize landrace genetic resources as a
safeguard against an unpredictable future is evident.
2.3.4 Conservation and utilization of wheat landrace
Through the period 1970 -1990 much of landraces across the world has
been collected and is being conserved in long-term national and
international gene banks (Frizon et al., 2011).
In other side, a small portion of this diversity is being conserved and used
on-farm where it continues to evolve (Brush and Meng, 1998). Both of
these conservation methods have its advantages and limitations. On-farm
conservation is considered as a sustainable management of genetic
diversity of landraces and local varieties, it provides a natural approach for
continuous development and helps accumulation of agronomic traits for
14
adaptation of variety to specific eco-geographical and matching the
requirements of farmers. On-farm conservation of landraces, as many
reports indicated, is one of the most important recent issues in plant genetic
resources management (Le Boulch et al., 1994; Kebebew et al., 2001).
Farmers continue to grow and conserve and develop a wheat landrace if it
meets their production and consumption needs. That means their on-farm
conservation and continued utilization of landraces is determined by the
cost and benefits these landraces to farmer. They maintain crop landraces if
these are of high economic, cultural, social value, or even ecological
reasons (Brush and Meng, 1998).
2.3.5 Landraces and the Future of Wheat Diversity
Nowadays, due to modern revolution in agriculture, wheat landraces have
been largely replaced, in their centers of diversity by monocultures of pure
genotypes represents high yielding modern cultivars. This replacement
resulted in significant loss of genetic diversity for quality traits and
resistance or tolerance to biotic and abiotic stresses; whereas, the pure
wheat genotypes lack the wide adaptation found in landraces. The
heterogeneity provided by diversity of populations of wheat landraces will
decrease abiotic and biotic stresses within cropping systems (Bonman et
al., 2007).
One practical strategy to improve yield and yield stability is to develop new
varieties from wheat landrace populations, especially under stress and
climate change conditions. Or just enhancement of productivity and
stability of deteriorated landraces which could be achieved through

15
continuous selection within original landraces population under the harsh
conditions, to exploit the constantly released useful adaptive variation
(Ehdaie and Waines, 1989).
2.3.6 Characterization and evaluation of wheat landraces studies
Several studies were conducted to evaluate the performance of landrace of
wheat or to determine the genetic diversity. Bechere et al. (1996) studied
the variation among 27 Ethiopian populations of durum wheat using
phenotypic characters and concluded the presence of wide variability in
most studied traits. Similar results were discovered in twelve land races
populations in Jordan conducted by Rawashdeh et al. (2007) using
phenotypic characters. In Morocco agro- morphological variability in a set
of durum wheat germplasm collection indicated that thousands kernel
weight and plant height presented the highest coefficient of variation
(Zarkti, 2012).
Elings and Nachit (1991) also studied 185 populations of durum wheat
landraces collected from four different climatic zones in Syria by
agronomic and morphological characterization and reported that these
populations were categorized into clusters according to geographic
distribution. Also, variation of phenotypic description in spikes of
tetraploid durum wheat landraces in Oman using 14 qualitative and 17
quantitative traits revealed a high variability for quantitative traits more
than qualitative traits (Alkhanajari et al., 2005).
16
2.3.7 Studying wheat landraces in Palestine
Similar studies in Palestine are limited especially for morphological
characterization of durum wheat landraces, although some publications
dealt with evaluation of few agronomic traits for some local landraces.
Atawnah (2013) evaluated growth performance, yield components and
genetic variation in six landraces genotypes and showed a significant
variation in most of studied traits, thus the dindogram cleared the relations
among genotypes. Some other studies used molecular tools for this purpose
(Sawalha, et al., 2008) by studying genetic diversity in wheat landraces in
Palestine using RAPD markers in comparison to phenotypic classification
indicated a level of genetic diversity and similarities expressed in clusters
of the landraces analyzed. In another study RAPD method was used to
estimate genetic diversity in ten durum wheat genotypes cultivated in
Palestine both landraces and commercial, although landraces were
classified in one cluster there was a wide variation between them (Alfares
and Abu- Qaoud, 2012).
2.4 Growth stages of wheat
Growth is a complex process in which different organs developing,
growing and dying in overlapping sequences and it is easier to think of it as
a series of growth stages.
There are several scales or developmental codes that describe visible
growth stages of wheat. Hauns’s scale can be used particularly for defining
and description of vegetative growth stages (Haun, 1973). Feeke’s scale
provides a good description for both vegetative and reproductive stages

17
(Large, 1954). However, Zadoks’ scale is the most comprehensive and
easiest to use in practice (Zadoks, 1974). It describes all stages of the cereal
growth cycle, including characteristics not considered in other scales. This
scale has 10 main growth stages, labeled 0 to 9, which describe the crop;
and each main growth stage can be further subdivided and described using
a second digit, labeled 0 to 9 too (Table 5.16).
2.5 Characterization and variety identification of wheat
Variety identification is a very important process used for purity
assessment crop varieties which is a primary demand in seed
multiplication, certification and it is a necessary tool for protection of new
breeder lines and new varieties through the multiple stages. It is also of
special importance when we deal with old deteriorated varieties and local
land races that exposed to danger of extinction and genetic loss. In general,
there are deferent methods for making characterization and variety
identification, including morphological, chemical and molecular methods
(Mansing, 2010).
2.5.1Morphological Characterization
A wide range of morphological distinctness between various genotypes was
used in varietal identification which was observed in seed, seedling and
plant (Mansing, 2010).
2.5.1.1 Seed characteristics
Many morphological traits of seeds as seed shape, size, color, seed weight,
seed germ width, seed crease and brush hair length are useful characters for
varietal identification of wheat (Mansing, 2010).
18
Paukens (1975) reported that the seed color (white, light yellow, bright
yellow, dark yellow and red), length (short, medium and long), width
(narrow, medium and wide) and thickness (thin, medium and thick) were
used for determining the cultivar trueness and purity in maize, while
Sivasubramanian and Ramakrishnan (1978) studied the distinctness in rice
cultivars based on seed, seedlings and chemical tests and expressed the
color of coleoptile, color and shape of the seed were found to be of
considerable diagnostic value.
2.5.1.2 Seedling characteristics
Sivasubramanian and Ramakrishnan (1978) reported that seedling
characters like coleoptile color (purple to colorless) and ratio of primary
leaf to coleoptile length were used for identification of rice varieties. Hoson
(1984) differentiated between dwarf and tall cultivars of rice and maize
based on coleoptile length growth.
Mansing (2010) reported Wide variations in mesocotyl length and
pigmentation of coleoptile among hill rice cultivars. Miyagawa (1984)
classified 86 Japanese and 14 scented rice cultivars based on mesocotyl and
coleoptile length.
Lirinde (1986) and Terao (1986) classified the rice genotypes based on
seedling characters as seedling length, coleoptile, sheath color and
mesocotyl length.
2.5.1.3 Morphological characters of plant
Mustafa et al. (1998) examined the seedling characteristics of nine different
bread wheat (Triticum aestivum L.) varieties, several variables regarding
seedling size and germination characteristics were analyzed using
19
canonical correlation analysis. Significantly correlated first canonical
variate pairs indicated that the variables within each set such as coleoptile
length, shoot length and fresh weight within size set, and emergence rate
index and germination percentage can be regarded as main factors for
vigorous wheat seedlings.
Elzevir and Aluizio (1999) studied seven characters of six bread varieties
as plant height, days to emerge of first spikelet, number of grain per spike,
spike length, spike shape, spike waxiness and spike density for varietal
characterization.
Karagoz et al. (2006) characterized 112 wild wheat (Triticum aegilops L.)
and 12 population of cultivated wheat (Triticum aestivum L.) in order to
study their agromorphological characteristics (plant height, days to
heading, growth habit, plant foliage color, number of tillers, flag leaf
waxiness of blade, flag leaf length, flag leaf width, awns attitude and spike
length) and variation among the populations.
Rehman et al. (2006) evaluated some plant morphological characters (plant
height, flag leaf length, flag leaf width, flag leaf attitude, flag leaf hairs on
auricle, flag leaf waxiness of blade, spikelet number, spike length, spike
density, peduncle waxiness, peduncle length and awns presence) of four
bread wheat varieties. Based on the results it was possible to identified
varieties from each other.
Haljak et al. (2008) studied ten morphological characters (anthocyanin
colouration of auricles of flag leaf, hairiness of auricles of flag leaf, flag
leaf width, plants with recurved flag leaves, glaucosity of sheath of flag

20
leaf, flag leaf waxiness of sheath, glaucosity of spike, peduncle waxiness,
spike waxiness, spike density and peduncle length) of nine winter wheat
(Triticum aestivum L.) and suggested that these morphological characters
are best for distinctness of the varieties.
Naghavi et al. (2009) evaluated genetic variation of 96 durum wheat
landraces and cultivars using morphological and protein markers. They
studied plant morphological characters as days to heading, flag leaf
waxiness of blade, flag leaf length, flag leaf width, spikelet per spike, test
weight, plant height, peduncle waxiness, peduncle attitude, peduncle length
and spike length.
2.5.2 Chemical characterization
The components of the seed react with the alkali to produce color which
intensity could be used in characterization of wheat cultivars. Many
chemicals tests were used in seed variety identification; NaOH test is useful
in identification of yellow and red color seeds.
Studies on characterization of cultivars based on response of seed and
seedling to various chemicals as phenol test, peroxidase enzyme activity,
potassium hydroxide, sodium hydroxide test and GA3 etc., offer wide
variability and can be used in characterization of genotypes(Mansing,
2010)
2.5.2.1 Phenol test
A rapid chemical technique for identification of different seeds, it employs
phenol to cause different color reaction in seeds, according to these test
21
varieties can be classified. The test depends on the enzyme present in seed
coat. Phenol color reaction was first reported for varietal classification in
wheat by Chemelar and Mostovoj (1938) and has been accepted as a
standard method for testing of wheat by International Seed testing
Association ISTA (Mansing, 2010).
2.5.2.2 Peroxidase enzyme activity test
The presence of peroxidase enzyme in the seed coat of wheat genotypes
was used as criteria for distinguishing the genotypes. The test is easy, but
time consuming and tedious.
Mckee (1973) suggested that barley varieties can be separated into as high
or low in peroxidase activity by soaking into 0.1 % solution of hydrogen
peroxidase for ten minutes saturated with benzidine dihydrochloride as a
technique to distinguish different seed varieties.
2.5.2.3 Potassium hydroxide test
Wheat genotypes can be differentiated based on the color pattern obtained
by the reaction of chemical to seeds with the secondary metabolites. Test is
simple, easy and reproducible.
Mckee (1973) suggested that 5 or 10 % potassium hydroxide solution could
be useful for separating white grain wheat varieties from red grain wheat
varieties.
2.5.2.4 Sodium hydroxide test
Simple, quick, and cheap test, based on the secondary metabolites present
in the seed coat react and produce distinct colors (Vanderburg and
Vanzwol, 1991).

22
2.5.2.5 Seedling growth response to GA3
Plant growth regulators influence plant growth by affecting the
mobilization of food reserves to different plant parts. The effect of the
growth regulators may vary in different cultivars which may be classified
based on their response in terms of increase or decrease in growth of root,
shoot and coleoptile length etc. The effect of growth regulators on seedling
growth behavior has been used for characterization of cereals like wheat
and rice (Laloriya and Naqvi, 1961; Gupta, 1985).
2.5.3 Molecular marker
Molecular methods were used for the assessment of genetic diversity
within and between plant populations using various laboratory-based
techniques such as allozyme or DNA analysis, which measure levels of
variation directly. Molecular markers may or may not correlate with
phenotypic expression of a genomic trait but, they offer a lot of advantages
over conventional, phenotype-based methods as they are stable and
detectable in all tissues regardless of growth, differentiation, development
or defense status of the cell. Additionally, they are not affected by
environmental conditions (Linda et al., 2009).
23
Chapter Three
Materials and Methods
3.1 Plant Material
Fifteen genotypes of durum wheat were used in the trials (eleven local
landraces and four introduced varieties). Local wheat landraces were
obtained from Genetic Recourses Unit at National Agricultural Research
Cintre (NARC) (Table 3.1).
Table 3.1 Wheat genotypes used in experiment
No. Gen
oty
pe
Categ
ory
So
urce
Lo
ng
itud
e
La
titud
e
Altitu
de (m
)
1 Kahatat Landrace Tayasir- Tubas 35.395 32.334 352
2 Hetia safra Landrace Turmusa'ya-
Ramalla
35.303 32.256 758
3 Heitia beda 1 Landrace Tayasir- Tubas 35.395 32.334 352
4 Heitia beda 2 Landrace Tamun-Tubas 35.400 32.233 311
5 Heitia soda Landrace Qabalan 35.285 32.094 573
6 Heitia Landrace Abu falah- Ramalla 35.294 32.007 770
7 Debbiya Landrace Kufrmalik- Ramalla 35.305 31.987 812
8 Soori Landrace Rantis- Ramalla 35.340 32.028 744
9 Noorsi Landrace Mazra'a- Ramalla 35.263 32.000 769
10 Kahla Landrace Sawia- Nablus 35.261 32.097 511
11 Nabeljamal Landrace Silwad- Ramalla 35.234 31.994 676
12 Horani 27 Introduced Syria
13 Numra 8 Introduced Tubas 35.386 32.323 450
14 Cham 5 Introduced ICARDA-Syria
15 Anbar Introduced Local market
3.2 Experimental Locations and Seasons
The experiment was conducted at five locations (Fig.3.1) in five different
governorates in Palestine (Table 3.1) in two growing seasons (2012-2013

24
and 2013-2014). The locations were: Beit Qad Agricultural station, Tubas,
Tulkarm agricultural station, Za'tara village, and Al-aruob Agricultural
station. In each site, 1.5 dunum was allocated for the experiment. All
morphological characteristics were measured at two locations (Beit- Qad
and Tubas) for one growing season (2012- 2013). Evaluation of
agronomical traits was conducted in the two growing seasons.
Figure 3.1 Selected Locations for Experiment trials in Palestine.

25
Table.3.2: Locations of Experiment.
Loca
tion
Govern
ora
te
Elev
atio
n (m
)
Rain
fall (m
m)
2012-2
013
Rain
fall (m
m)
2013-2
014
An
nu
al m
ean
Rain
fall (m
m)
An
nu
al m
ean
temp
eratu
re (C°)
Lon
gitu
de
Latitu
de
Loca
tion
top
ogra
ph
y
Beit
Qad Jenin 144 436 233.5 414.4 20.3 35.345 32.474 Inner plain
Tubas Tubas 493 388 238.5 431.2 20.4 35.386 32.323 Hilly
Tulkarm Tulkarm 61 720 460 602.4 18.9 35.019 32.316 Coastal
plain
Za'tara Bethlehem 617 320 310 340 22 35.273 31.675 Eastern
foothill
Arrub Hebron 812 550 485.2 632.3 15.5 35.131 31.621 Mountain
3.3 Field preparation
Fields in different locations were prepared according to the recommended
applications, Essential fertilizations were applied. Phosphate was added to
the soil as Super phosphate 25% (20 kg/dunum). Nitrogen was added in the
form of Ammonium sulphate 21% (12.5kg/dunum).
3.4 Sowing.
Seeds were sown manually. Each plot consisted of 6 rows 2 meters long
with 30cm spacing between rows, 10 grams of seeds were sown in each
row, seeding rate was 15kg/dunum.
3.5 Cultural Practices
3.5.1 Weed control
Weeds were controlled by Alber Super (2,4-D) application. The dosage
was (150ml/ dunum). Spray was done during15 th -30th , January, followed
by hand weeding at the second half of March.
26
3.5.2 Additive fertilization
10 kg/ dunum of Ammonium Sulphate fertilizer (21% nitrogen) were
spread manually during growing season (February) before expected rain at
tillering stage.
Fields were supplementary irrigated three times (during February and
March) at 2013-2014 growing season by 30 mm each time (90 mm in
total).
3.5.3 Harvesting and threshing
One square meter from the middle of each experimental plot was harvested
manually after full maturity, tied and labeled, dried for two days under
shade then weighed for biological yield and threshed using experimental
threshing machine.
3.6 Measured Parameters
3.6.1 Morphological Characterization
Morphological traits characterization was done according to the guidelines
described in the instructions of the International Union for the Protection of
new Varieties of Plants (UPOV) (Test Guidelines) which elaborates the
principles contained in the General Introduction (document TG/1/3) for the
examination of distinctness, uniformity and stability (DUS) and, in
particular, to identify appropriate characteristics for the examination of
DUS and production of harmonized variety descriptions (UPOV, 2012).
The morphological characterization parameters are described as follows:

27
3.6.1.1 Plant vegetative characteristics
3.6.1.1.1 Coleoptile Anthocyanin Coloration (CAC)
100 seeds were placed on moistened filter paper in a Petri dish until
germination, after the coleoptiles have reached a length of about 1 cm in
darkness they were placed in artificial light for sixteen hours a day
(daylight equivalent), 12,000 to 15,000 lux continuously for 3 - 4 days,
with incubation temperature at 20oC, data were recorded when coleoptiles
were fully developed (about 1 week from the start) at stage 09-11 (Zadoks,
1974). The presence of anthocyanin coloration on coleoptiles was assessed
and reported as absent or very weak, weak, medium, strong and very
strong.
3.6.1.1.2 Flag leaf Anthocyanin Coloration of Auricles (FACA)
Anthocyanin coloration of auricles was assessed visually (stage 55-59 on
Zadoks scale) according to their frequency and intensity within whole plot
and categorized as absent or very weak, weak, medium, strong and very
strong.
3.6.1.1.3 Frequency of plants with recurved flag leaves (FPRF)
Recurved flag leaves plants were assessed visually at (stage 50-51)
according to their frequency (percentage) within whole plot and
categorized as absent or very low (0-20%), low (21-40%), medium (41-
60%), high (61-80%) and very high (81-100%).

28
3.6.1.1.4 Glaucosity of lower side of flag leaf blade (GF )
The thickness of the waxy layer on lower side of the flag leaf blade was
assessed by touching flag leaves of ten plants selected randomly between
fingers (stage 55-65), average assessment was scored as absent or very
weak, weak, medium, strong and very strong .
3.6.1.1.5 Glaucosity of spike's neck (GN )
The density of the waxy layer on spikes neck was assessed (stage 60-69)
by touching spikes neck of ten plants selected randomly between fingers.
Average assessment was scored as absent or very weak, weak, medium,
strong and very strong.
3.6.1.1.6 Peduncle attitude (PA)
Ten spikes were picked randomly at maturity (stage 90-92) with its
peduncle from each plot. Peduncles were observed visually for attitude and
grouped as straight, medium and crooked.
3.6.1.1.7 Straw pith in cross (SPC)
Ten plants from whole plot were selected randomly at maturity (stage 90-
92). The pith in cross section was observed half way between base of spike
and stem node below. Assessment was reported for mean of stems as thin,
medium and thick (Figure 3.2).

29
1 3 5
Thin Medium Thick
Fig.3.2: Categorization of straw pith in cross
3.6.1.1.8 Plant growth habit (GH)
Ten plants from each plot were observed randomly, growth habit was
assessed visually from the attitude of the leaves and tillers at tillering stage.
The angle formed by the outer leaves and the tillers with an imaginary
middle axis was observed and the average score were registered as erect,
semi erect, intermediate, semi prostrate and prostrate (Fig. 3.3).
Fig.3.3: Categorization of Plant growth habit
3.6.1.2 Spike Characteristics
10 main spikes from each plot were selected randomly; the following
characteristics were measured as described below.

30
3.6.1.2.1 Spike glaucosity (EG)
The density of waxy layer was assessed by touching spike between fingers
(after spike fully appeared), average assessment was scored as absent or
very weak, weak, medium, and strong.
3.6.1.2.2 Spike shape (SS)
Spike shape was observed visually and grouped as tapering, parallel sided,
semi clavate, clavate and fusiform.
3.6.1.2.3 Spike density (SD)
Spike density was determined by counting the number of spikelets and then
dividing the number by the spike length. The higher ratio indicated the
higher density. They were categorized as lax, medium and dense (Fig. 3.4).
3 5 7
Lax Medium Dense
Fig.3.4: Categorization of Spike density
3.6.1.2.4 Spike color (SC)
Color of spike was assessed (at maturity) and registered as white, slightly
colored and strongly colored.
31
3.6.1.2.5 Awns color (AC)
Color of spike awns was assessed (at maturity) and scored as white, light
brown, medium purple and dark purple.
3.6.1.2.6 Awns attitude (AA)
Awns attitude (rate of awns spreading against spikes main axis) was
observed visually (at maturity) and grouped as oppressed, medium and
spreading.
3.6.1.2.7 Awns roughness (AR)
Awns roughness was checked by touching by hand (at maturity) and
grouped as smooth, medium and rough.
3.6.1.2.8 Awns or scurs presence (ASP)
Awns or scurs presence was observed visually (at maturity) and scored as
awns and scurs absent, awns present and scurs present.
3.6.1.2.9 Lower glume shape (GS)
Lower glume shape was observed on mid third of spikes (at maturity)and
classified as ovoid, medium oblong and narrow oblong (Fig. 3.5).

32
1 2 3
Ovoid Medium oblong Narrow oblong
Fig.3.5: Categorization of lower glume shape
3.6.1.2.10 Lower glume external hairiness (GEH)
Hairs on external surface of lower glume were observed on mid third of
spikes (at maturity) and classified as absent, short, medium and long.
Note: Observations were made with a hand lens (x10 magnification).
3.6.1.2.11 Lower glume shoulder width (GSW)
Lower glume shoulder width was observed on mid third of spikes (at
maturity) and classified as narrow, medium and broad (Fig 3.6).
3 5 7
Narrow Medium Broad
Fig.3.6: Categorization of lower glume shoulder width

33
3.6.1.2.12 Lower glume shoulder shape (GSS)
Lower glume shoulder shape was observed on mid third of spikes (at
maturity) and classified as sloping, rounded, straight, elevated and elevated
with 2nd peak (Fig. 3.7).
1 2 3 4 5
Sloping Rounded Straight Elevated Elevated with a
2nd beak
Fig.3.7: Categorization of lower glume shoulder shape
3.6.1.2.13 Lower glume peak length (GPL)
Lower glume beak length was observed on mid third of spikes (at maturity)
and classified as very short, short, medium and long (Figure 3.8).
3.6.1.2.14 Lower glume peak curvate (GPC)
Lower glume beak shape was observed on mid third of spikes (at maturity)
and classified as absent, weak, moderate and strong (Fig. 3.8).

34
1 3 5 7
Absent Weak Moderate Strong
Fig.3.8: Categorization of lower glume peak curvate.
3.6.1.3 Grain characteristics
100 grains were selected randomly, the following characteristics were
observed as bellow.
3.6.1.3.1 Grain color (GC)
Grain color was observed and scored as whitish, reddish and dark.
3.6.1.3.2 Grain shape (GS)
Grain shape was observed in dorsal view and scored as slightly elongated,
moderately elongated, strongly elongated and extremely elongated (Fig.
3.9).
1 2 3 slightly elongated moderately
elongated
Strongly
elongated
Fig.3.9: Categorization of grain shape.
35
3.6.2. Agronomic Traits Evaluation
3.6.2.1 Field growth performance
3.6.2.1.1 Number of fertile tillers per plant (NT)
Ten plants from each plot were selected randomly before maturity, fertile
tillers (tillers that contain grains) were counted and mean was recorded as
low (1-2 fertile tillers), medium (3-4 fertile tillers) and high (more than 4
fertile tillers).
3.6.2.1.2 Plant height (PTHT)
Plant length was measured at maturity including stem, spike and awns. The
length was taken from the base of the plant to the tip of the highest awn.
The genotypes were grouped as very short (< 60 cm), short (60-75 cm),
medium (75.1-90 cm), long (90.1-115 cm) and very long (> 115 cm).
3.6.2.1.3 Spike length (EL)
Ten spikes were picked randomly from each plot at maturity, spike length
was measured (excluding awns) and the average was recorded. Genotypes
were grouped on spike length base as very short (<50 mm), medium (short
(50-60 mm), medium (60.1-80 mm), long (80.1-110 mm) and very long (>
110 mm).
3.6.2.1.4 Awns length (AL)
Ten spikes were picked randomly from each plot at maturity, awns length
was measured and the average was recorded. Genotypes were grouped on
36
awns length base as very short (<50 mm), short (50-80 mm), medium
(80.1-100 mm), long (100.1-120 mm) and very long (> 120 mm).
3.6.2.1.5 Days to spike emergence (DSE)
Date of spike emergence was scored when the first spikelet visible on
spikes of 50% of the plants, it was converted to days by counting the days
from planting date up to date of 50% spikes emergence, then genotypes
were categorized as early (<110 days), medium (110- 120 days) and late (>
120 days).
3.6.2.1.6 Days to maturity (DMAT)
Date of 50% of plants within plot mature (ready to harvest by suitable
moisture content estimated manually in field), Days from sawing to
maturity of 50% of spikes was recorded, genotypes were grouped into
three categories as early (< 164 days), medium (164-174 days) and late (>
174 days).
3.6.2.1.7 Filling period (FP)
Filling period is the period (in days) between spike emergence and
maturity. Genotypes were grouped into three categories as short (< 50
days), medium (50-55 days) and late (> 55 days).
3.6.2.2 Reaction to rust and lodging
3.6.2.2.1 Leaf rust reaction (LRR)
Twenty plants were taken randomly at the stage of filling, natural
infestation with leaf rust disease was assessed visually, infestation ratio was

37
recorded in a scale 1-5 (1= no symptoms, 2= symptoms covers less than
30% of plant, 3= symptoms covers 30-50% of plant, 4= symptoms covers
51-75% of plant, 5= symptoms covers more than 75% of plant (Figure
3.10), genotypes were grouped on average score as:
Resistant: 1.00-1.99
Semi resistant: 2.00-2.99
Semi susceptible: 3.00-3.99
Susceptible: 4.00-5.00
Fig.1.10: estimating scale for rust infestation rate on vegetative parts of plant (Peterson
et al 1948).
4.6.2.2.2 Lodging reaction (LOD)
Percentage of lodged (bending or breaking of lower culm internodes) plants
in whole plot was assessed visually in a scale (1-5), (1= lodged plants less
than 10%, 2= lodged plants 11-30%, 3= lodged plants 31-50%, 4= lodged
plants 51-75%, 5= lodged plants more than 75%, genotypes were grouped
on average score as :
38
Resistant: 1.00-1.99
Semi resistant: 2.00-2.99
Semi susceptible: 3.00-3.99
Susceptible: 4.00-5.00
3.6.2.3 Yield performance
3.6.2.3.1 Number of spiklets per spike (NSPS)
Ten spikes were harvested randomly from each plot, spiklets on each spike
were counted, mean was recorded, genotypes were grouped into three
categories as low (< 20 spiklets), medium (20-22 spiklets) and high (> 22
spiklets).
3.6.2.3.2 Number of grains per spike (NGS)
Ten spikes were harvested randomly from each plot, threshed separately,
grains within each spike were counted and means were recorded, genotypes
were grouped into three categories as low (< 46 grains), medium (46-55
grains) and high (> 55 grains).
3.6.2.3.3 Thousand Grain weight by grams (TGW)
Randomly 1000 grains were collected from the bulk for each plot yield and
weighed. Three replicates were scored and mean was recorded, different
genotypes were grouped into three categories as low (< 40 grams), medium
(40-50 grams), and high (> 50 grams).
3.6.2.3.4 Hectoliter grain weight (HGW)
Three samples of grains from each plot yield were taken randomly,
Hectoliter grain weight (weight of 100 liters volume of grain by kilograms)
was estimated for each sample using a special machine (EASI- WAY

39
Hectoliter test weight machine, Manufactured by FARM- TEC), genotypes
were grouped into three categories as low (< 75), medium (75-78) and high
(> 78).
3.6.2.3.5 Biological Yield (BYLD)
One square meter was allocated in the middle of plot, all plants within this
area were harvested manually ten centimeters above ground level, plants
were tied into bundles and weighed, weight was modified to one dunum.
Genotypes were grouped into three categories as following:
Low : < 550 Kg/dunum
Medium: 550-1000 Kg/dunum
High : > 1000 Kg/dunum
3.6.2.3.6 Grain Yield (GYLD)
The harvested plants of one square meter from middle of plot were threshed
using experimental machine and grains weighed, weight was modified to
one dunum. Genotypes were grouped into three categories as following:
Low : < 250 Kg/dunum
Medium: 250-350 Kg/dunum
High : > 350 Kg/dunum
3.6.2.3.7 Straw Yield (SYLD)
Straw weight was calculated by subtracting grain weight above (GYLD)
from biological yield (BYLD), weight was modified to one dunum. Three
replicates /plot was measured, genotypes were grouped into three categories
as following:
Low : < 300 Kg/dunum
Medium: 300-650Kg/dunum
40
High : > 650 Kg/dunum.
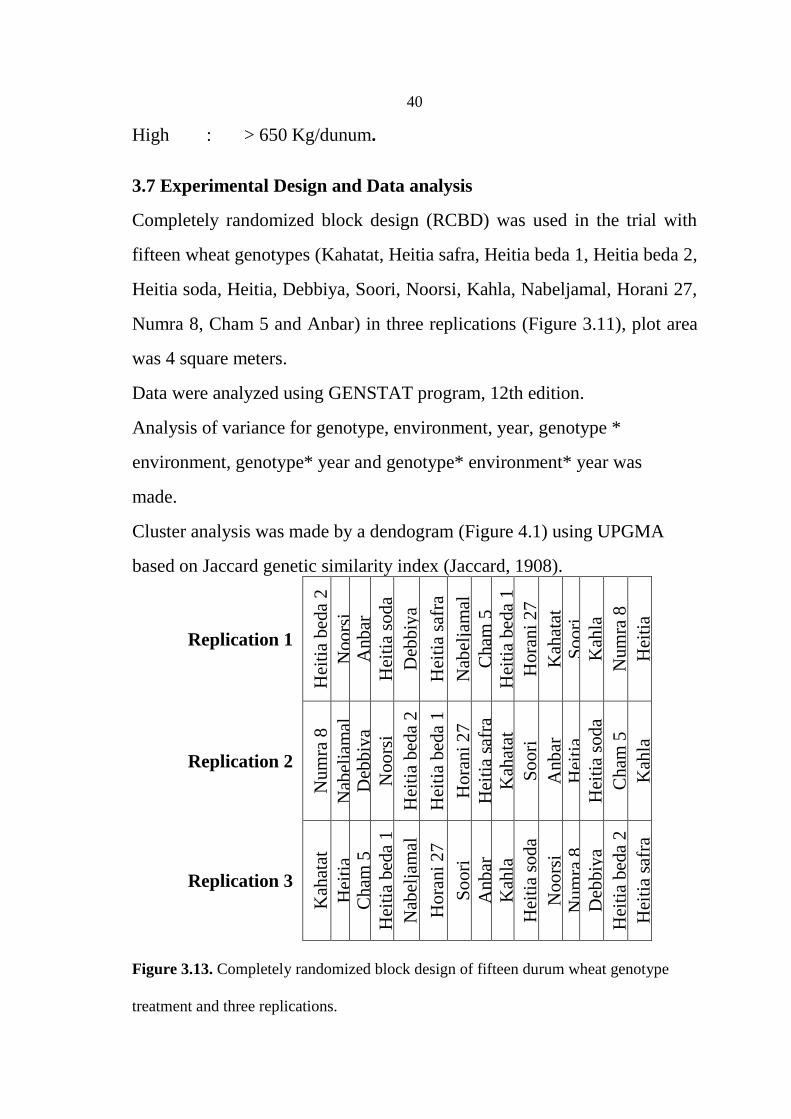
3.7 Experimental Design and Data analysis
Completely randomized block design (RCBD) was used in the trial with
fifteen wheat genotypes (Kahatat, Heitia safra, Heitia beda 1, Heitia beda 2,
Heitia soda, Heitia, Debbiya, Soori, Noorsi, Kahla, Nabeljamal, Horani 27,
Numra 8, Cham 5 and Anbar) in three replications (Figure 3.11), plot area
was 4 square meters.
Data were analyzed using GENSTAT program, 12th edition.
Analysis of variance for genotype, environment, year, genotype *
environment, genotype* year and genotype* environment* year was
made.
Cluster analysis was made by a dendogram (Figure 4.1) using UPGMA
based on Jaccard genetic similarity index (Jaccard, 1908).
Replication 1
Hei
tia
bed
a 2
Noo
rsi
Anb
ar
Hei
tia
sod
a
Deb
biy
a
Hei
tia
safr
a
Nab
elja
mal
Ch
am 5
Hei
tia
bed
a 1
Hora
ni
27
Kah
atat
S
oori
K
ahla
Num
ra 8
Hei
tia
Replication 2
Num
ra 8
Nab
elja
mal
D
ebbiy
a
Noo
rsi
Hei
tia
bed
a 2
Hei
tia
bed
a 1
Hora
ni
27
Hei
tia
safr
a
Kah
atat
So
ori
Anb
ar
Hei
tia
Hei
tia
sod
a
Ch
am 5
Kah
la
Replication 3
Kah
atat
Hei
tia
Ch
am 5
Hei
tia
bed
a 1
Nab
elja
mal
Hora
ni
27
So
ori
Anb
ar
Kah
la
Hei
tia
sod
a
Noo
rsi
Num
ra 8
D
ebbiy
a
Hei
tia
bed
a 2
Hei
tia
safr
a
Figure 3.13. Completely randomized block design of fifteen durum wheat genotype
treatment and three replications.

41
Chapter Four
Results and Discussion
4.1 Morphological Characterization
Twenty four characters were studied covering morphological traits of
wheat plant at different growth stages and plant parts including intact plant,
spikes and grains, this evaluation were conducted at two locations (Beit-
Qad and Tubas) for one growing season (2012-2013).
4.1.1 Plant vegetative characteristics
4.1.1.1 Coleoptile Anthocyanin Coloration (CAC)
Coleoptile Anthocyanin coloration varied among the 15 genotypes (Table
4.1). Two genotypes showed absent or very weak coloration (Kahatat and
Debbiya), other nine showed weak coloration (Heitia safra, Heitia beda 1,
Heitia beda 2, Heitia soda, Heitia, Noorsi, Kahla, Horani 27 and Cham 5),
and two genotypes (Soori and Nabeljamal) were Medium colored and the
rest two (Numra 8 and Anbar) had strong color.
The intensity of pigment in plant organs is genetically controlled and is
also affected by abiotic stress mainly drought and salinity under which
genes responded for anthocyanin production are activated (Tereshchenko,
et al. 2012). This study showed a clear variation among genotypes under
investigation in terms of the presence of the anthocyanin pigmentation in
coleoptiles at the beginning of growth. It was weak in most of local
varieties, medium in two of them and strong in two improved varieties. The
42
results were obtained under laboratory conditions without stress which
indicates that the pigmentation appeared clearly due to weak stimulation
for the pigmentation genes. Khoufi et al. (2012) characterized the variation
in some wheat varieties using coleoptiles anthocyanin coloration as an
effective trait to distinguish between genetically apparent genotypes.
4.1.1.2 Flag leaf Anthocyanin Coloration of Auricles (FACA)
There was a low variation among the studied wheat genotypes based on
flag leaf anthocyanin coloration of auricles (Table 4.1). Twelve of them
were weak colored (Kahatat, Heitia safra, Heitia beda 2, Heitia, Debbiya,
Soori, Noorsi, Kahla, Nabeljamal, Horani 27, Numra8 and Anbar) and
three genotypes were medium colored (Heitia beda 1, Heitia soda and
Cham 5). This result may indicate that the two local genotypes (Heitia beda
1 and Heitia soda) have stress tolerance genes, while Cham 5 is a drought
resistant variety and recommended to be cultivated in semi dry zones
(ICARDA, 1995). Similar results were observed by Haljak et al. (2008) in
which winter wheat cultivars were grouped into weak, medium and strong
colored.
4.1.1.3 Frequency of plants with recurved flag leaves (FPRF)
Table 4.1 shows a moderate variation among the studied genotypes
according to the frequency of plants with recurved flag leaves. Among the
15 genotypes, two showed low frequency (Kahatat, Debbiya), nine showed
medium (Heitia beda 1, Heitia beda 2, Heitia safra, Heitia, Heitia soda,
Cham 5, Noorsi, Horani 27, Numra 8) and four genotypes (Soori, Kahla,

43
Nabeljamal, and Anbar) showed high frequency of plants with recurved
flag leaves. This variation could be attributed to the effect of the variety
itself and less affected by environment (Haljak et al. 2008).This
characteristic with some other morphological traits was used by El- Kalla,
et al. (2010) for the determination of genetic purity in three common wheat
varieties.
4.1.1.4 Glaucosity of lower side of flag leaf blade (GF)
The 15 studied genotypes didn't vary in glaucosity of lower side of flag leaf
blade. All of them had a medium layer of glaucosity (Table 4.1).
This result indicates that the genes responsible for this trait are closely
associated in the studied varieties. The locus controlling this trait,
corresponding to a single dominant gene, was mapped on the telomeric
region of short arm of chromosome 2B (Banio, 2012) and this trait was
utilized as a high heritability and easy to measure character in cereals for
selection to drought resistance (Ribot et al. 2012).
4.1.1.5 Glaucosity of spike's neck (GN)
The wheat genotypes in this study showed different patterns on basis of
glaucosity on the neck of spike. Two of them had weak glaucosity (Heitia,
Heitia soda), One genotype had a strong glaucosity (Cham 5), while the
other 12 were medium (Table 4.1).
The majority of studied genotypes (12 of 15) showed medium glaucosity
on spikes neck, this may be due to the genetic association among these
genotypes in terms of this trait. El- Kalla, et al., (2010) used this character

44
to distinguish between three cultivars of bread wheat showing variations in
this trait. Similar results were obtained by Haljak et al., (2008) in assessing
the variation in winter wheat varieties showing variations from medium to
strong glaucosity.
4.1.1.6 Peduncle attitude (PA)
Peduncle attitude varied among the 15 studied genotypes (Table 4.1). Only
Horani 27 was straight, ten were medium (Heitia beda 1, Heitia beda 2,
Heitia soda, Heitia, Noorsi, Kahla, Nabeljamal, Numra 8, Cham 5 and
Anbar), and four were crooked (Kahatat, Heitia safra, Debbiya and Soori).
The results revealed that, the studied genotypes varied in three groups
(straight, medium and crooked) peduncle. Mansing (2010) reported the
presence of similar variation between 22 different varieties of wheat.
4.1.1.7 Straw pith in cross (SPC)
Based on straw pith in cross trait, the genotypes were separated into two
categories (Table 4.1); six of them showed thick pith (Heitia soda, Noorsi,
Kahla, Nabeljamal, Horani 27, Numra 8) while the remaining nine
genotypes had medium pith (Kahatat, Heitia safra, Heitia beda 1, Heitia
beda 2. Heitia, Debbiya, Soori, Cham 5, Anbar).
This trait is a genetic and highly heritable trait in wheat that is frequently
used in breeding programs (Van Den Berg, 2008). It was reported that,
there is a significant positive correlation between straw thickness of wheat
and lodging resistance in bread wheat varieties (Karim and Jahan, 2013).

45
4.1.1.8 Plant growth habit (GH)
Genotypes in this study were separated into two categories; nine of them
were erect (Kahatat, Heitia safra, Heitia beda 1, Heitia beda 2, Debbiya,
Noorsi, Kahla and Anbar) and six genotypes were semi erect (Heitia soda,
Debbiya, Soori, Numra 8 and Cham 5) (Table 4.1).
All studied genotypes appeared as erect or semi erect but none of them
were near to prostrate habit. This is a favorable trait for the selection of
high production and low grain and straw loss. Ruiz and Martin (2000)
studied growth habit among Spanish landraces of durum wheat and showed
that 93 % of studied genotypes appeared as erect or intermediate.

46
Table 4.1. Identification wheat genotypes based on Coleoptile Anthocyanin Coloration (CAC), Flag leaf Anthocyanin
Coloration of Auricles (FACA), and Frequency of plants with recurved flag leaves (FPRF), Glaucosity of lower side
of flag leaf blade (GF), Glaucosity of spike's neck (GN) Peduncle attitude (PA), Straw pith in cross (SPC) and Plant
growth habit (GH).
Trait
Genotype CAC FACA FPRF GF GN PA SPC GH
Kahatat Absent or very week Weak Low Medium Medium Crooked Medium Erect
Heitia safra Week Weak Medium Medium Medium Crooked Medium Erect
Heitia beda 1 Week Medium Medium Medium Medium Bent Medium Erect
Heitia beda 2 Week Weak Medium Medium Medium Bent Medium Erect
Heitia soda Week Medium Medium Medium Weak Bent Thick Semi erect
Heitia Week Weak Medium Medium Weak Bent Medium Semi erect
Debbiya Absent or very week Weak Low Medium Medium Crooked Medium Erect
Soori Medium Weak High Medium Medium Crooked Medium Semi erect
Noorsi Week Weak Medium Medium Medium Bent Thick Erect
Kahla Week Weak High Medium Medium Bent Thick Erect
Nabeljamal Medium Weak High Medium Medium Bent Thick Semi erect
Horani 27 Week Weak Medium Medium Medium Straight Thick Erect
Numra 8 Strong Weak Medium Medium Medium Bent Thick Semi erect
Cham 5 Week Medium High Medium Strong Bent Medium Semi erect
Anbar Strong Weak High Medium Medium Bent Medium Erect

47
4.1.2 Spike Characteristics:
4.1.2.1 Spike glaucosity (SG)
According to spike glaucosity, the results of this study showed that one
genotype (Cham 5) had strong spike glaucosity characteristic while the
remaining fourteen genotypes were found medium (Table 4.2).
All genotypes under investigation showed medium spike glaucosity except
cham 5 which had strong glaucosity. The appearance of this trait is
attributed to genetic structure with single gene (Banio, 2012) and is
associated with drought resistance (Ribot et al., 2012), accordingly it is
documented that, Cham 5 is recommended to be cultivated in semi dry
zones (ICARDA, 1995).
4.1.2.2 Spike shape (SS)
Spike shape varied among the studied 15 genotypes (Table 4.2). Ten of
them had the tapering shape (Kahatat, Heitia safra, Heitia beda 2, Heitia
soda, Noorsi, Nabeljamal, Horani 27, Numra 8, Cham 5 and Anbar) and
five were parallel sided in shape (Heitia beda 1, Heitia, Debbiya, Soori and
Kahla).
This trait was used by Al- khanjari et al (2008) in characterizing the Omani
wheat landraces reporting that this trait was very polymorphic
characteristic. In another investigation on Bulgarian wheat landraces all
genotypes were grouped into pyramidical or cylindrical shapes (Deshava,
2014).
48
4.1.2.3 Spike density (SD)
Table 4.2 shows that the 15 genotypes were segregated in terms of spike
density. Four of them have very dense spike (Kahatat, Heitia safra,
Debbiya and Noorsi), eight genotypes have dense spike (Heitia Beda 1,
Heitia, Soori, Kahla, Horani 27, Numra 8, Cham 5 and Anbar) and three
genotypes (Heitia Beda 2, Heitia soda and Nabeljamal) have medium spike
density.
The large variation between the studied genotypes in terms of spike density
reflects the genetic variation. In particular, landraces varied from very
dense spike, dense to medium. This trait in tetraploid wheat is controlled by
two genes in recessive state (Goncharov et al, 2002). It was documented
that, the wild relatives of wheat beard the variation in spike density as
Einkorn (T. monococum. L.) and Emmer (T. dicocum SCHUEBL) had
short and dense spikes, while Spelta (T. spelta L.) had long and lax spikes
(Konvalina et al. 2010). Similar results were recorded by Ruiz and Martin
(2000) showed a wider variation between Spanish wheat landraces ranged
high dense to lax spikes.
4.1.2.4 Spike color (SC)
Spike color varied among the studied genotypes (Table 4.2). Four showed
white color (Heitia beda1, Heitia beda2, Numra 8 and Cham 5), eight had
slight color (Kahatat, Heitia safra, Heitia, Debbiya, Soori, Noorsi, Kahla
and Horani 27), two were strongly colored (Nabeljamal and Anbar) and
one genotype showed black color (Heitia soda).
49
The spike color in studies genotypes ranged widely from white through
slightly and strongly colored to black spikes. The traditional naming of
some of the local varieties depended primarily on spike color (Heitia beda
means white heitia, Heitia safra means yellow heitia, and finally Heitia
soda means black heitia). This wide range of spike color reflects the wide
variability of wheat landraces in Palestine as a part the origin of wheat.
Similar results were reported concerning Spanish wheat land races that
varied widely in spike color from white to purple- grey to black (Ruiz and
Martin, 2000).
4.1.2.5 Awns color (AC)
Awns color varied widely among the studied 15 genotypes (Table 4.2).
Four genotypes were white (Heitia beda 1, Heitia beda 2, Numra 8 and
Cham 5), six were light brown (Kahatat, Heitia safra, Heitia, Debbiya,
Soori and Horani 27), two were medium purple (Nabeljamal and Anbar)
and three genotypes were deep purple (Heitia soda, Noorsi and Kahla).
The wide variation of awns color among studied genotypes reflects the
variation in genetic structure among these genotypes. Data regarding
Spanish wheat landraces reported the variation of awns color from white to
red brown (Ruiz and Martin, 2000), while Omani landraces represent
dominant black awns color (Al- khanjari et al., 2008).
4.1.2.6 Awns attitude (AA)
Table 4.2 displays the variation of awns attitude among the studied
genotypes. Oppressed type of awns was observed in four genotypes (Soori,
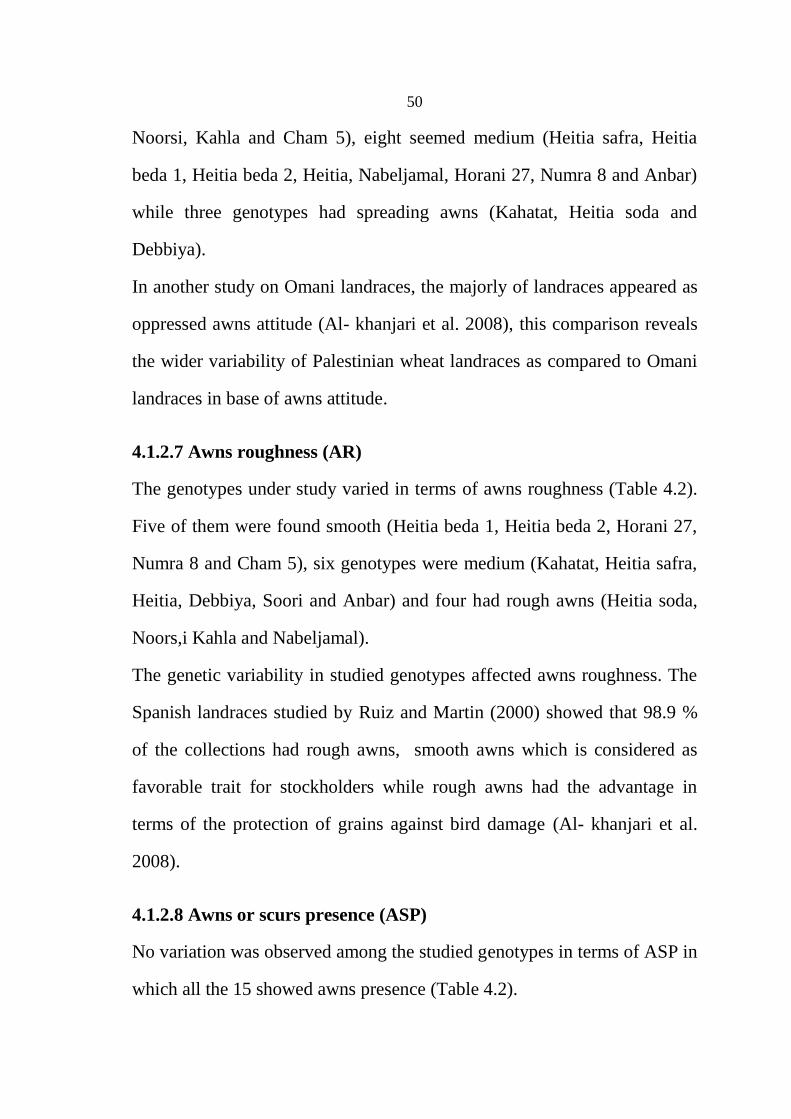
50
Noorsi, Kahla and Cham 5), eight seemed medium (Heitia safra, Heitia
beda 1, Heitia beda 2, Heitia, Nabeljamal, Horani 27, Numra 8 and Anbar)
while three genotypes had spreading awns (Kahatat, Heitia soda and
Debbiya).
In another study on Omani landraces, the majorly of landraces appeared as
oppressed awns attitude (Al- khanjari et al. 2008), this comparison reveals
the wider variability of Palestinian wheat landraces as compared to Omani
landraces in base of awns attitude.
4.1.2.7 Awns roughness (AR)
The genotypes under study varied in terms of awns roughness (Table 4.2).
Five of them were found smooth (Heitia beda 1, Heitia beda 2, Horani 27,
Numra 8 and Cham 5), six genotypes were medium (Kahatat, Heitia safra,
Heitia, Debbiya, Soori and Anbar) and four had rough awns (Heitia soda,
Noors,i Kahla and Nabeljamal).
The genetic variability in studied genotypes affected awns roughness. The
Spanish landraces studied by Ruiz and Martin (2000) showed that 98.9 %
of the collections had rough awns, smooth awns which is considered as
favorable trait for stockholders while rough awns had the advantage in
terms of the protection of grains against bird damage (Al- khanjari et al.
2008).
4.1.2.8 Awns or scurs presence (ASP)
No variation was observed among the studied genotypes in terms of ASP in
which all the 15 showed awns presence (Table 4.2).

51
This trait is well noticed mainly in tetraploid durum wheat more than in
hexaploid bread wheat genotypes (Watkins and Elerton, 1940). Moreover,
the presence of awns can double the photosynthesis rates especially under
drier conditions then enhance drought resistance (Sourdille, 2002), which is
considered as an important agronomic advantage in durum wheat varieties.
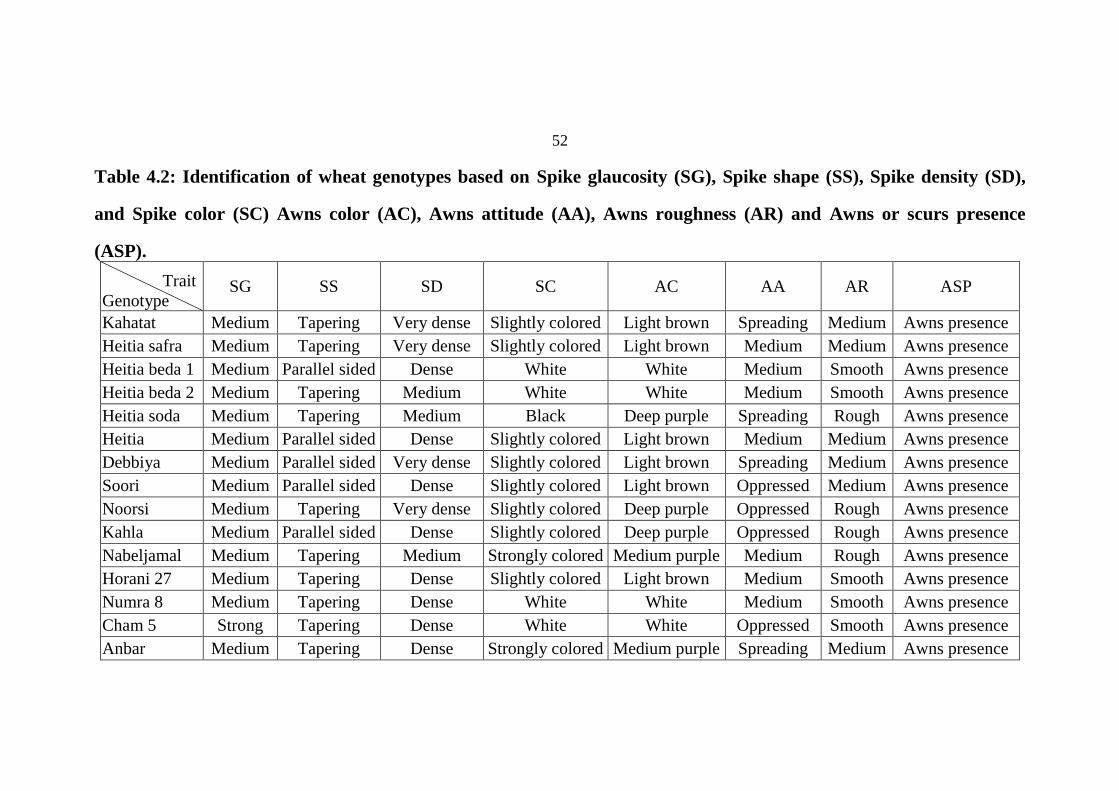
52
Table 4.2: Identification of wheat genotypes based on Spike glaucosity (SG), Spike shape (SS), Spike density (SD),
and Spike color (SC) Awns color (AC), Awns attitude (AA), Awns roughness (AR) and Awns or scurs presence
(ASP).
Trait
Genotype SG SS SD SC AC AA AR ASP
Kahatat Medium Tapering Very dense Slightly colored Light brown Spreading Medium Awns presence
Heitia safra Medium Tapering Very dense Slightly colored Light brown Medium Medium Awns presence
Heitia beda 1 Medium Parallel sided Dense White White Medium Smooth Awns presence
Heitia beda 2 Medium Tapering Medium White White Medium Smooth Awns presence
Heitia soda Medium Tapering Medium Black Deep purple Spreading Rough Awns presence
Heitia Medium Parallel sided Dense Slightly colored Light brown Medium Medium Awns presence
Debbiya Medium Parallel sided Very dense Slightly colored Light brown Spreading Medium Awns presence
Soori Medium Parallel sided Dense Slightly colored Light brown Oppressed Medium Awns presence
Noorsi Medium Tapering Very dense Slightly colored Deep purple Oppressed Rough Awns presence
Kahla Medium Parallel sided Dense Slightly colored Deep purple Oppressed Rough Awns presence
Nabeljamal Medium Tapering Medium Strongly colored Medium purple Medium Rough Awns presence
Horani 27 Medium Tapering Dense Slightly colored Light brown Medium Smooth Awns presence
Numra 8 Medium Tapering Dense White White Medium Smooth Awns presence
Cham 5 Strong Tapering Dense White White Oppressed Smooth Awns presence
Anbar Medium Tapering Dense Strongly colored Medium purple Spreading Medium Awns presence

53
4.1.2.9 Lower glume shape (GS)
The 15 studied genotypes varied according to lower glume shape (Table 4.
3). The majority of genotypes were medium oblong (Heitia beda 1, Heitia
beda 2, Heitia soda, Heitia, Soori, Noorsi, Kahla, Horani 27, Cham 5 and
Anbar). Three were ovoid (Kahatat, Heitia safra and Debbiya). Only
Nabeljamal and Numra 8 were narrow oblong in lower glume shape.
As glume of studied genotypes had three shapes, most were medium
oblonged. In a previous study concerning Omani landraces, most genotypes
had oblong glume shape (Al- khanjari et al., 2008). Similar results were
reported concerning Spanish collections (Ruiz and Aguiriano, 2004).
4.1.2.10 Lower glume external hairiness (GEH)
A high level of variation among the studied genotypes according to lower
glume external hairiness was observed (Table 4.3). Nine genotypes were
absent hairiness (Kahatat, Heitia safra, Heitia beda 1, Heitia beda 2, Heitia,
Debbiya, Noorsi, Horani 27 and Numra 8), weakness observed with four
genotypes (Heitia soda, Soori, Kahla and Cham 5), medium in Anbar, and
strong in Nabeljamal genotypes.
This wide variation reflects the broad genetic base of this trait, although
most of genotypes had smooth and weak glume hairs Nabeljamal was
distinctive in presence of long and extensive hairs. The results agreed with
Al- Khanjari et al. (2008) which indicated polymorphism in glume
hairiness in Omani wheat landraces. Similar results were reported by Ruis
and Martin (2000) concerning Spanish landraces collection in which there
was a variation in glume hairs in spite of 70 % had absent glume hairs.
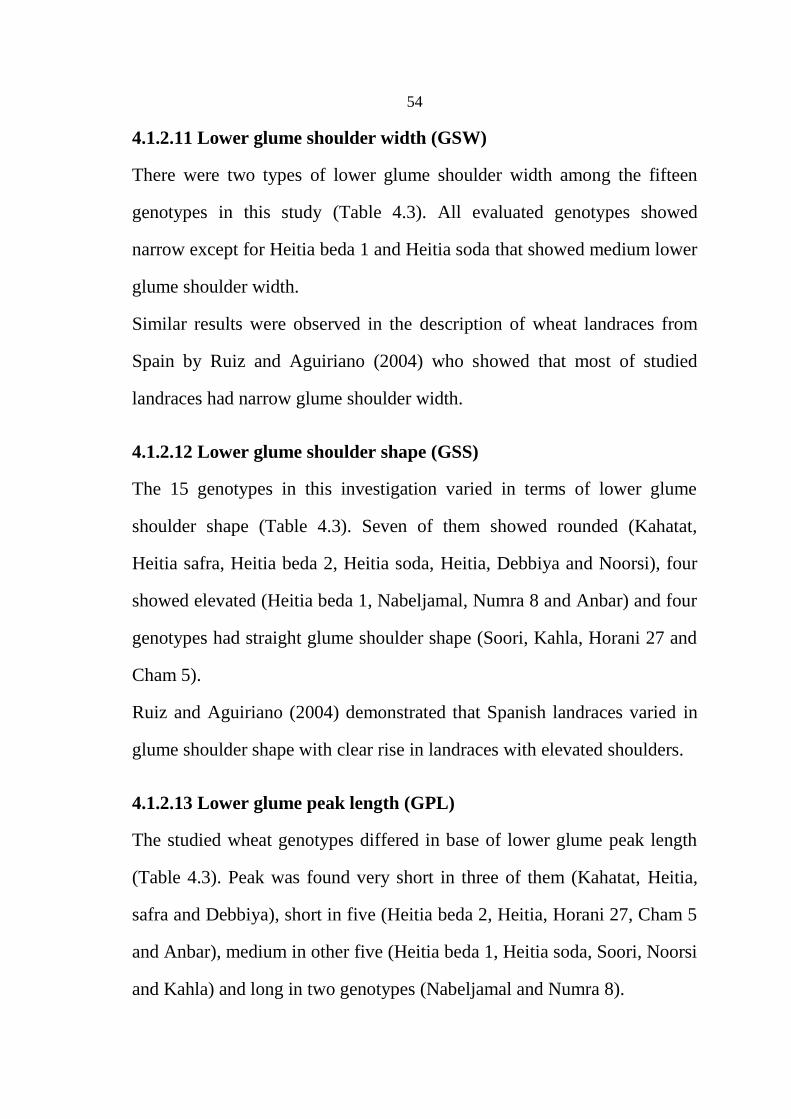
54
4.1.2.11 Lower glume shoulder width (GSW)
There were two types of lower glume shoulder width among the fifteen
genotypes in this study (Table 4.3). All evaluated genotypes showed
narrow except for Heitia beda 1 and Heitia soda that showed medium lower
glume shoulder width.
Similar results were observed in the description of wheat landraces from
Spain by Ruiz and Aguiriano (2004) who showed that most of studied
landraces had narrow glume shoulder width.
4.1.2.12 Lower glume shoulder shape (GSS)
The 15 genotypes in this investigation varied in terms of lower glume
shoulder shape (Table 4.3). Seven of them showed rounded (Kahatat,
Heitia safra, Heitia beda 2, Heitia soda, Heitia, Debbiya and Noorsi), four
showed elevated (Heitia beda 1, Nabeljamal, Numra 8 and Anbar) and four
genotypes had straight glume shoulder shape (Soori, Kahla, Horani 27 and
Cham 5).
Ruiz and Aguiriano (2004) demonstrated that Spanish landraces varied in
glume shoulder shape with clear rise in landraces with elevated shoulders.
4.1.2.13 Lower glume peak length (GPL)
The studied wheat genotypes differed in base of lower glume peak length
(Table 4.3). Peak was found very short in three of them (Kahatat, Heitia,
safra and Debbiya), short in five (Heitia beda 2, Heitia, Horani 27, Cham 5
and Anbar), medium in other five (Heitia beda 1, Heitia soda, Soori, Noorsi
and Kahla) and long in two genotypes (Nabeljamal and Numra 8).
55
Similar variation was observed in a study demonstrating morphological
traits of some wheat varieties in Bangladesh (Tasnuva et al., 2010) in
which a significant variation (range 1.2- 10 mm) in peak length was
recorded.
Table 4.3. Identification of wheat genotypes based on Lower glume
shape (GS), Lower glume external hairiness(GEH), Lower glume
shoulder width (GSW), Lower glume shoulder shape (GSS) and Lower
glume peak length (GPL).
Trait
Genotype
GS GEH GSW GSS GPL
Kahatat Ovoid Absent Narrow Rounded Very short
Heitia safra Ovoid Absent Narrow Rounded Very short
Heitia beda 1 Medium oblong Absent Medium Elevated Medium
Heitia beda 2 Medium oblong Absent Narrow Rounded Short
Heitia soda Medium oblong Weak Medium Rounded Medium
Heitia Medium oblong Absent Narrow Rounded Short
Debbiya Ovoid Absent Narrow Rounded Very short
Soori Medium oblong Weak Narrow Straight Medium
Noorsi Medium oblong Absent Narrow Rounded Medium
Kahla Medium oblong Weak Narrow Straight Medium
Nabeljamal Narrow oblong Strong Narrow Elevated Long
Horani 27 Medium oblong Absent Narrow Straight Short
Numra 8 Narrow oblong Absent Narrow Elevated Long
Cham 5 Medium oblong Weak Narrow Straight Short
Anbar Medium oblong Medium Narrow Elevated Short
4.1.2.14 Lower glume peak curvate (GPC)
Table 4.4 shows that 14 out of the 15 studied genotypes had weak lower
glume peak curvate, while only Nabeljamal had moderate curvate.
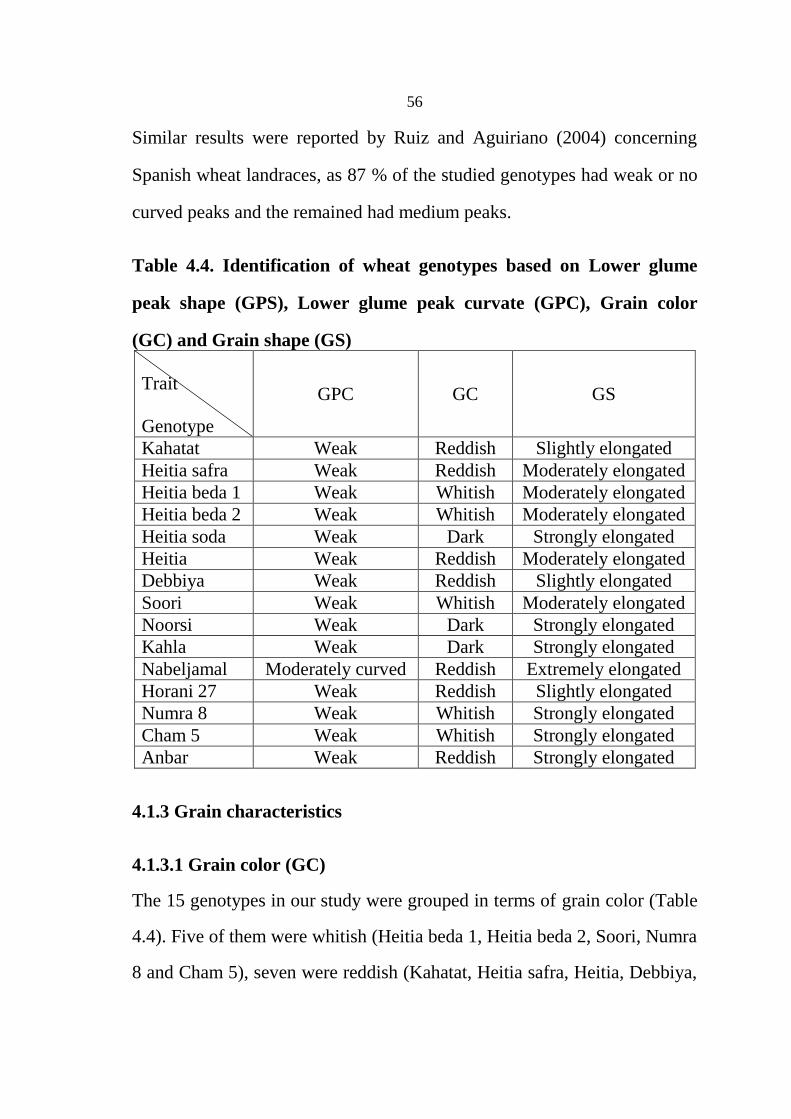
56
Similar results were reported by Ruiz and Aguiriano (2004) concerning
Spanish wheat landraces, as 87 % of the studied genotypes had weak or no
curved peaks and the remained had medium peaks.
Table 4.4. Identification of wheat genotypes based on Lower glume
peak shape (GPS), Lower glume peak curvate (GPC), Grain color
(GC) and Grain shape (GS)
Trait
Genotype
GPC GC GS
Kahatat Weak Reddish Slightly elongated
Heitia safra Weak Reddish Moderately elongated
Heitia beda 1 Weak Whitish Moderately elongated
Heitia beda 2 Weak Whitish Moderately elongated
Heitia soda Weak Dark Strongly elongated
Heitia Weak Reddish Moderately elongated
Debbiya Weak Reddish Slightly elongated
Soori Weak Whitish Moderately elongated
Noorsi Weak Dark Strongly elongated
Kahla Weak Dark Strongly elongated
Nabeljamal Moderately curved Reddish Extremely elongated
Horani 27 Weak Reddish Slightly elongated
Numra 8 Weak Whitish Strongly elongated
Cham 5 Weak Whitish Strongly elongated
Anbar Weak Reddish Strongly elongated
4.1.3 Grain characteristics
4.1.3.1 Grain color (GC)
The 15 genotypes in our study were grouped in terms of grain color (Table
4.4). Five of them were whitish (Heitia beda 1, Heitia beda 2, Soori, Numra
8 and Cham 5), seven were reddish (Kahatat, Heitia safra, Heitia, Debbiya,

57
Nabeljamal, Horani 27 and Anbar) and three had dark color (Heitia soda,
Noorsi and Kahla).
This wide variation in our study agreed with a study conducted using
Omani landraces in which red grain color was dominant (Al- khanjari et al.
2008). In contract to a study conducted on wheat landraces in Spain, the
dominant grain color was white over red.
4.1.3.2 Grain shape (GS)
Grain shape varied strongly among the studied genotypes as shown in
Table 4.4 Three were slightly elongated (Kahatat, Debbiya and Horani 27),
five were moderately elongated (Heitia safra, Heitia beda 1, Heitia beda 2,
Heitia and Soori), six were strongly elongated (Heitia soda, Noorsi, Kahla,
Numra 8, Cham 5 and Anbar) and one genotype (Nabeljamal) was
extremely elongated.
Grain shape is one of the most important parameters used in classification,
identification and study of variation in wheat varieties (Mebatsion et al.
2012).The was a wide variation according to grain shape among studied
genotypes reflects broad genetic variability among the Palestinian wheat
landraces which could be easily distinguished by grain shape. Similar
results were obtained in a study on phenotypic classification of some
Palestinian wheat landraces in which genotypes were classified into
rounded, oval and elongated (Sawalha, et al. 2008).
4.2. Agronomic Traits Evaluation (Field growth performance)
The goal of this part of study is to evaluate agronomic and yield
performance for different landraces of durum wheat in Palestine. The
58
studied traits covered the vegetative field growth performance, time needed
for heading and maturity, reaction to rust and lodging, yield components
and capacity for grain and straw production, etc. these traits were studied at
five locations representing different environmental conditions in Palestine,
study was conducted through two growth seasons. In total sixteen traits
were evaluated.
4.2.1 Number of fertile tillers per plant (NT)
Number of fertile tillers per plant varied significantly among the studied
genotypes (Table 4.7) with an average of 3.79 tillers. The genotype Heitia
soda had the highest mean fertile tillers (4.44 tillers) while Soori had the
lowest mean number (3.46 tillers). This variation could be attributed to
genetic factors that genotypes did or not have the tillering inhibitor gene
(tin), in addition to environmental and agronomic factors as sowing
density, nitrogen fertilization and drought stress (Ribot et al., 2012).
Location affected number of fertile tillers per plant which varied from
4.242 tillers (in mean at Tubas site) to 2.868 tillers at Za'tara site (Table
4.6). The decrease in fertile tillers per plant at Za'tara site may be due to
drought stress that decrease tillering (Ribot et al., 2012), as this site receive
low rainfall. Similar results were shown by Salimia and Atawnah (2014) in
a study of wheat genotypes in three sites in south Palestine namely the site
of Janata with low annual rainfall had the fewest fertile tillers comparative
with Arrub and Dora sites that have higher rainfall.
59
4.2.2 Plant height (PTHT)
Plant height varied significantly among the 15 genotypes (Table 4.7). The
average was 98.53 cm. The genotype Nabeljamal showed the highest mean
height (121.31cm) while Soori had the lowest (82.80 cm) height. This high
variation could be attributed to genetic differences between genotypes as
this plant height is a quantitative trait controlled by many genes (Yao, et
al., 2011). Landraces showed higher mean plant height (102.27) cm
compared with (84.49) cm in mean for the introduced varieties (Anbar,
Cham 5 and Numra 8) with an increase of 21% (Table 4.22). Similar results
were reported in studying phenotypic variability of durum wheat from
Jordan in which most landraces had plant average height higher than the
improved varieties (Rawashdeh, et al., 2007).
Plant height was affected by experimental location as highest mean was
recorded in Tulkarm (108.37 cm) while Za'tara site with mean of (82.87
cm) was the lowest (Table 4.6). As being a quantitative trait,
Environmental conditions especially water availability and soil fertility
affects plant height, this fact can clarify our results demonstrating the
tallest plants of the same genotype were in Tulkarm site (Highest rainfall)
while shortest were in Za'tara (lowest rainfall). Similar results were cleared
by Salimia and Atawnah (2014) revealing that plant height was positively
correlated with the site average rainfall.
4.2.3 Spike length (SL)
The 15 genotypes of wheat showed significant variation based on spike
length (Table 4.8). The average was (70.37 mm). Nabeljamal genotype had
60
the most spike length (100.10 mm) while Kahatat had the fewest spike
length (49.07 mm).This result reflects the broad genetic structure of these
varieties. Similar results on a study of phenotypic classification of local and
improved wheat varieties in Palestine indicated a wide variation from 40
mm in Kahatat to 70 mm in Nabeljamal for spike length (Sawalha, et al.
2008). Landraces showed shorter spikes (70) mm in compared with (76.7)
mm in mean for the introduced varieties (Anbar, Cham 5 and Numra 8)
(Table 4.22) with a decrease of 9%%, while three landraces (Noorsi, Kahla
and Nabeljamal) were longer spikes with (87.37) mm in mean and (14%)
over introduced varieties.
Spike length was affected by the experimental location which varied from
74.99 mm) at Tubas to 59.46 mm in Za'tara (Table 4.6). Spike length was
the lowest at Za'tara, this may be due to drought stress as annual rainfall is
the lowest. This result was supported by the results of Salimia and Atawnah
(2014) in which spike length was the lowest at Janata (lowest rainfall) than
Arrub and Dura (higher rainfall) for most of studied varieties.
4.2.4 Awns length (AL)
Awns length varied significantly among the 15 genotypes (Table 4.8) with
(107.10) mm as average. Nabeljamal genotype had the tallest awns (135.00
mm) while Kahatat had the shortest (81.67 mm). This variation was closely
related to spike length. In a study done by Nawaz et al (2013) using wheat
landraces Pakistan, there was a high significant variation among twenty
five genotypes based on awns length.
61
Landraces had shorter awns with a mean of (105.33) mm in compared with
(113.78) mm in mean for the introduced varieties (Anbar, Cham 5 and
Numra 8) with a decrease of 7.5%%, while three landraces (Noorsi, Kahla
and Nabeljamal) had longer spikes with (125.78) mm in mean and (10.5%)
increase over introduced varieties(Table 4.22). It is clear that there was a
strong association between awns length and spike length for all studied
genotypes.
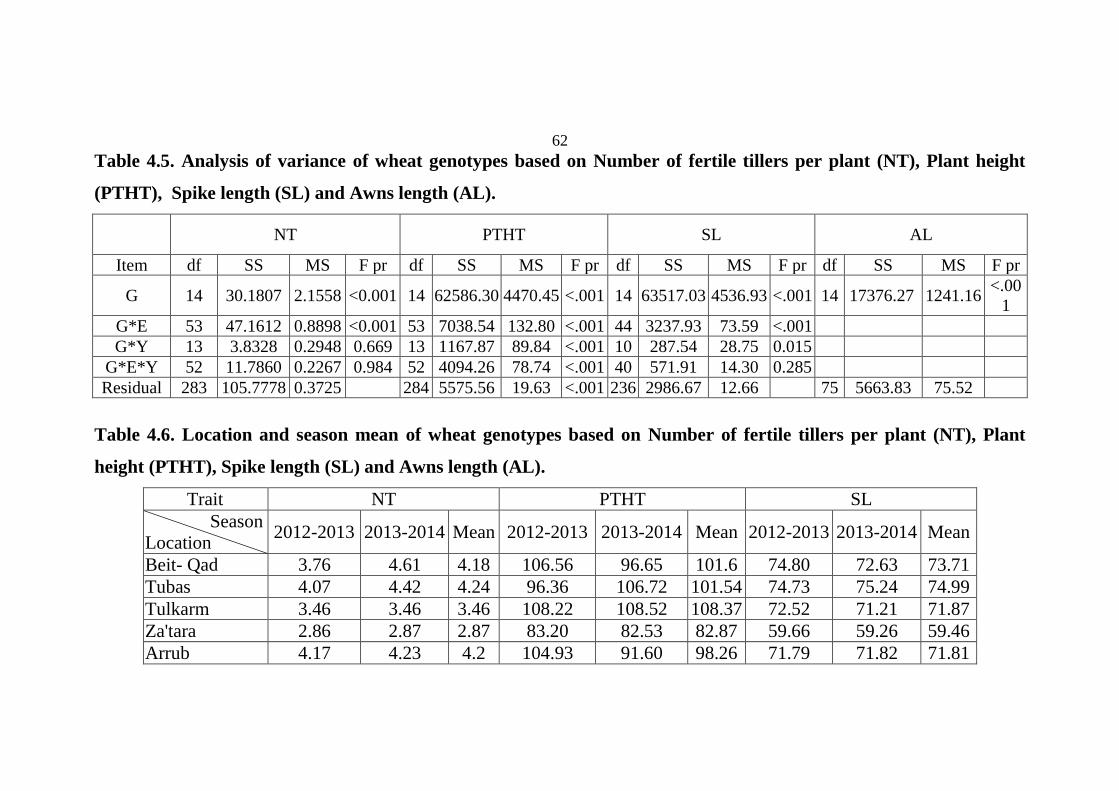
62
Table 4.5. Analysis of variance of wheat genotypes based on Number of fertile tillers per plant (NT), Plant height
(PTHT), Spike length (SL) and Awns length (AL).
NT PTHT SL AL
Item df SS MS F pr df SS MS F pr df SS MS F pr df SS MS F pr
G 14 30.1807 2.1558 <0.001 14 62586.30 4470.45 <.001 14 63517.03 4536.93 <.001 14 17376.27 1241.16 <.00
1
G*E 53 47.1612 0.8898 <0.001 53 7038.54 132.80 <.001 44 3237.93 73.59 <.001
G*Y 13 3.8328 0.2948 0.669 13 1167.87 89.84 <.001 10 287.54 28.75 0.015
G*E*Y 52 11.7860 0.2267 0.984 52 4094.26 78.74 <.001 40 571.91 14.30 0.285
Residual 283 105.7778 0.3725 284 5575.56 19.63 <.001 236 2986.67 12.66 75 5663.83 75.52
Table 4.6. Location and season mean of wheat genotypes based on Number of fertile tillers per plant (NT), Plant
height (PTHT), Spike length (SL) and Awns length (AL).
Trait NT PTHT SL
Season
Location 2012-2013 2013-2014 Mean 2012-2013 2013-2014 Mean 2012-2013 2013-2014 Mean
Beit- Qad 3.76 4.61 4.18 106.56 96.65 101.6 74.80 72.63 73.71
Tubas 4.07 4.42 4.24 96.36 106.72 101.54 74.73 75.24 74.99
Tulkarm 3.46 3.46 3.46 108.22 108.52 108.37 72.52 71.21 71.87
Za'tara 2.86 2.87 2.87 83.20 82.53 82.87 59.66 59.26 59.46
Arrub 4.17 4.23 4.2 104.93 91.60 98.26 71.79 71.82 71.81
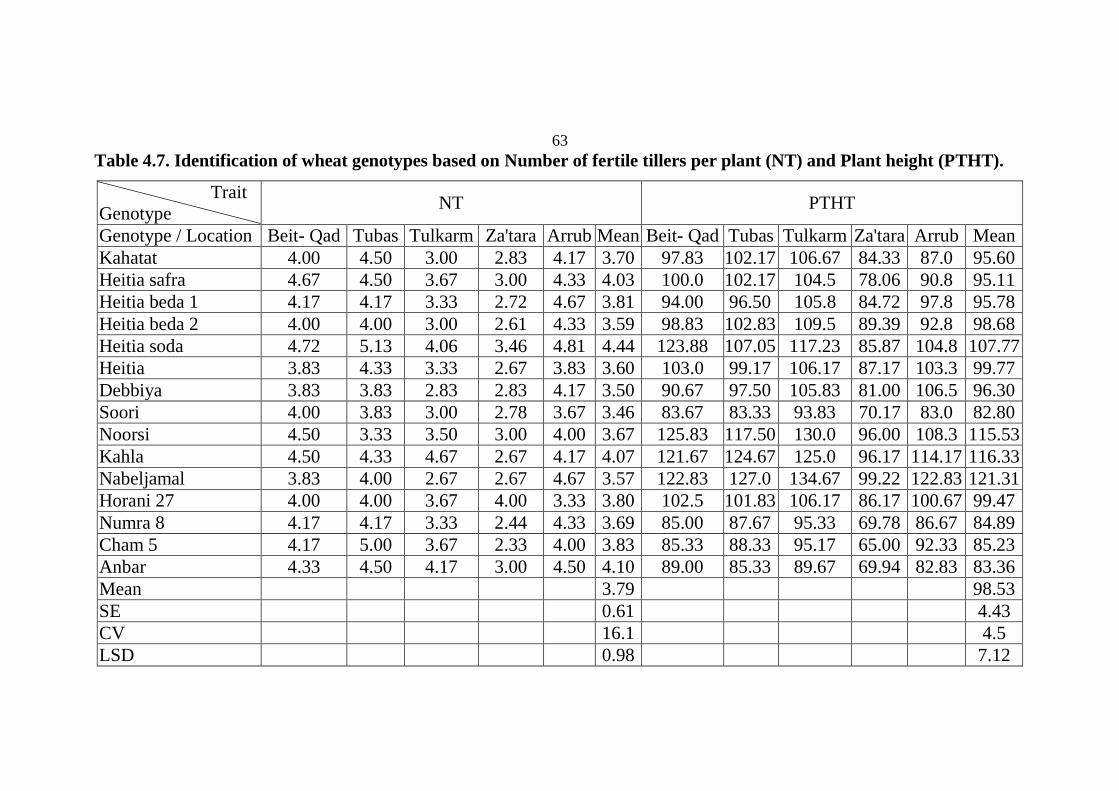
63
Table 4.7. Identification of wheat genotypes based on Number of fertile tillers per plant (NT) and Plant height (PTHT).
Trait
Genotype NT PTHT
Genotype / Location Beit- Qad Tubas Tulkarm Za'tara Arrub Mean Beit- Qad Tubas Tulkarm Za'tara Arrub Mean
Kahatat 4.00 4.50 3.00 2.83 4.17 3.70 97.83 102.17 106.67 84.33 87.0 95.60
Heitia safra 4.67 4.50 3.67 3.00 4.33 4.03 100.0 102.17 104.5 78.06 90.8 95.11
Heitia beda 1 4.17 4.17 3.33 2.72 4.67 3.81 94.00 96.50 105.8 84.72 97.8 95.78
Heitia beda 2 4.00 4.00 3.00 2.61 4.33 3.59 98.83 102.83 109.5 89.39 92.8 98.68
Heitia soda 4.72 5.13 4.06 3.46 4.81 4.44 123.88 107.05 117.23 85.87 104.8 107.77
Heitia 3.83 4.33 3.33 2.67 3.83 3.60 103.0 99.17 106.17 87.17 103.3 99.77
Debbiya 3.83 3.83 2.83 2.83 4.17 3.50 90.67 97.50 105.83 81.00 106.5 96.30
Soori 4.00 3.83 3.00 2.78 3.67 3.46 83.67 83.33 93.83 70.17 83.0 82.80
Noorsi 4.50 3.33 3.50 3.00 4.00 3.67 125.83 117.50 130.0 96.00 108.3 115.53
Kahla 4.50 4.33 4.67 2.67 4.17 4.07 121.67 124.67 125.0 96.17 114.17 116.33
Nabeljamal 3.83 4.00 2.67 2.67 4.67 3.57 122.83 127.0 134.67 99.22 122.83 121.31
Horani 27 4.00 4.00 3.67 4.00 3.33 3.80 102.5 101.83 106.17 86.17 100.67 99.47
Numra 8 4.17 4.17 3.33 2.44 4.33 3.69 85.00 87.67 95.33 69.78 86.67 84.89
Cham 5 4.17 5.00 3.67 2.33 4.00 3.83 85.33 88.33 95.17 65.00 92.33 85.23
Anbar 4.33 4.50 4.17 3.00 4.50 4.10 89.00 85.33 89.67 69.94 82.83 83.36
Mean 3.79 98.53
SE 0.61 4.43
CV 16.1 4.5
LSD 0.98 7.12
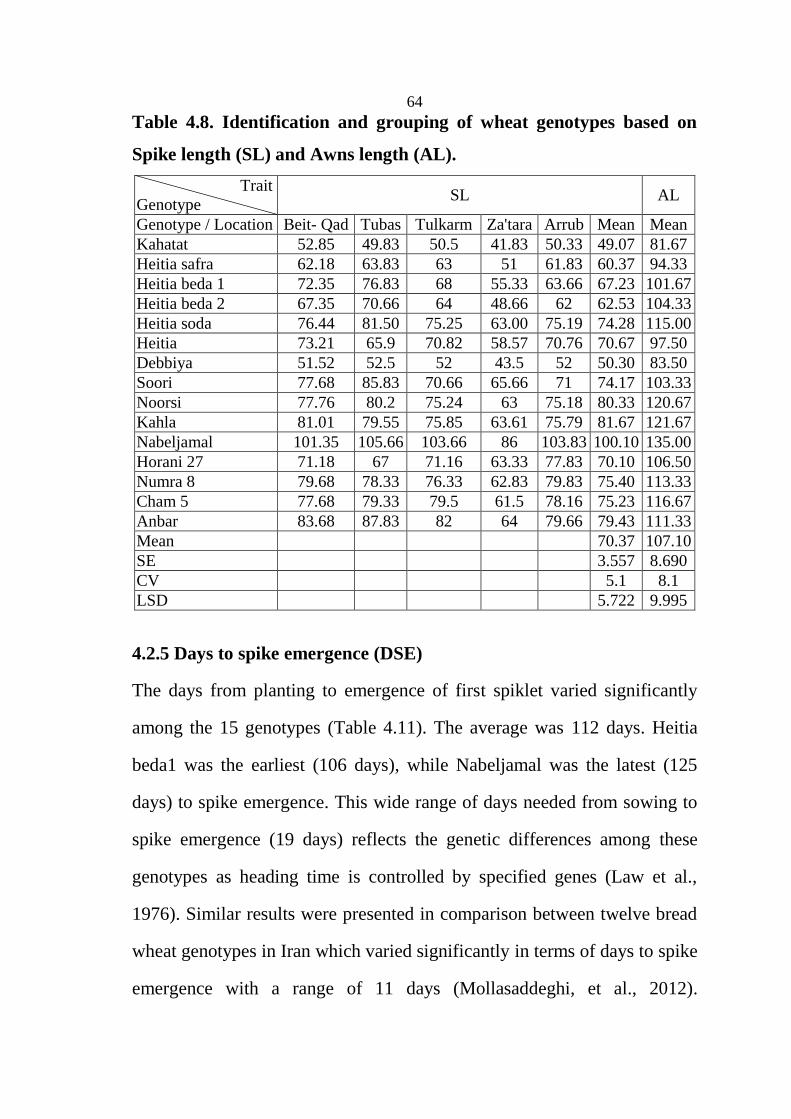
64
Table 4.8. Identification and grouping of wheat genotypes based on
Spike length (SL) and Awns length (AL).
Trait
Genotype SL AL
Genotype / Location Beit- Qad Tubas Tulkarm Za'tara Arrub Mean Mean
Kahatat 52.85 49.83 50.5 41.83 50.33 49.07 81.67
Heitia safra 62.18 63.83 63 51 61.83 60.37 94.33
Heitia beda 1 72.35 76.83 68 55.33 63.66 67.23 101.67
Heitia beda 2 67.35 70.66 64 48.66 62 62.53 104.33
Heitia soda 76.44 81.50 75.25 63.00 75.19 74.28 115.00
Heitia 73.21 65.9 70.82 58.57 70.76 70.67 97.50
Debbiya 51.52 52.5 52 43.5 52 50.30 83.50
Soori 77.68 85.83 70.66 65.66 71 74.17 103.33
Noorsi 77.76 80.2 75.24 63 75.18 80.33 120.67
Kahla 81.01 79.55 75.85 63.61 75.79 81.67 121.67
Nabeljamal 101.35 105.66 103.66 86 103.83 100.10 135.00
Horani 27 71.18 67 71.16 63.33 77.83 70.10 106.50
Numra 8 79.68 78.33 76.33 62.83 79.83 75.40 113.33
Cham 5 77.68 79.33 79.5 61.5 78.16 75.23 116.67
Anbar 83.68 87.83 82 64 79.66 79.43 111.33
Mean 70.37 107.10
SE 3.557 8.690
CV 5.1 8.1
LSD 5.722 9.995
4.2.5 Days to spike emergence (DSE)
The days from planting to emergence of first spiklet varied significantly
among the 15 genotypes (Table 4.11). The average was 112 days. Heitia
beda1 was the earliest (106 days), while Nabeljamal was the latest (125
days) to spike emergence. This wide range of days needed from sowing to
spike emergence (19 days) reflects the genetic differences among these
genotypes as heading time is controlled by specified genes (Law et al.,
1976). Similar results were presented in comparison between twelve bread
wheat genotypes in Iran which varied significantly in terms of days to spike
emergence with a range of 11 days (Mollasaddeghi, et al., 2012).

65
Landraced were generally late in days to spike emergence with mean of
(113) days compared with of (108.2) days for the introduced varieties
(Anbar, Cham 5 and Numra 8) (Table 4.22). This result may be explained
by the higher vegetative production (plant height, biological and straw
yield) which alter reproductive development of plant (spike emergence and
maturity). One landrace (Heitia beda 1) was earlier with (106.3) days than
introduced varieties.
Days of spike emergence in the studied genotypes were affected
significantly by locations, as Tubas showed the fewest mean days
(104.982) while Arrub location showed the largest (119.557) mean days
(Table 4.10). Environmental conditions especially temperature significantly
affects the days from sowing to spike emergence reversibly (Tsenov,
2009). This was clearly observed in this study as in Arrub location with
higher elevation and least temperatures, had the longest time to spike
emergence among genotypes. Similar results showed that spike emergence
of local wheat accessions from Karak region (high temperature) was earlier
than those from Ajloun region by 8 days (Rawashdeh, et al., 2007).
4.2.6 Days to maturity (DMAT)
The days from planting to full maturity varied significantly among the 15
genotypes under study (Table 4.11). The average of days taken by
genotypes to mature was (165 days). Heitia soda took the fewest mean days
(158) while Nabeljamal took the highest mean (177 days). This result
agrees with Woldesemayat and Tanto (2012) findings comparing wheat
varieties from Ethiopia in which genotypes varied significantly with range
66
of 12 days to maturity. In comparison with introduced variety (Anbar,
Cham 5 and Numra 8) that took 162.25 days in mean to mature, four
landraces were later (Heitia safra, Noorsi, Kahla and Nabeljamal) with
172.82 days mean, while the other landraces were earlier with 161.2 days
mean(Table 4.22). Later maturity landraces had the higher vegetative mass
parameters (plant height, biological and straw yields) that may alter
reproductive development (spike emergence and maturity).
Days to maturity in the studied genotypes were affected significantly by
experimental location (Table 4.10), as Za'tara showed the fewest mean days
(160days) while Arrub location showed the highest mean (168 days).
The significant difference may be attributed to environmental conditions,
as in hot and dry conditions, plant grow and mature faster than it under
colder and moister conditions (Inamullah and Khalil, 2011). The result of
this study agreed with the findings of Salimia and Atawnah (2014) in
which varieties at higher temperature location (Janata) matured earlier than
them at colder locations (Arrub and Dura).
4.2.7 Filling period (FP)
The days from spike emergence to fully maturity (Filling Period of spikes)
varied significantly among the studied genotypes (Table 4.11). The average
of days required by genotypes for grain filling was (53 days). Kahatat
required the fewest days (48) while Anbar took the most days (56).
Grain filling period is the time between heading and physiological
maturity, it is affected by environmental conditions as temperature and
light, as well as the genotype. It is an important trait affected by heat stress
67
conditions in which varieties with short filling period are highly producible
(Uliah et al., 2014), While in optimal conditions, longer grain filling period
with earlier heading and maturity is a desirable combination for breeders (
Rawashdeh, et al., 2007). In this study, there was a difference in grain
filling period among genotypes (3 days) due to genotype effect. Sourour, et
al (2010) explores a range of 23 days in terms of filling period among
wheat land races collected from Tunisia.
Grain filling period of spikes with mature grains was affected significantly
by location of experiment (Table 4.10). At Arroub, the genotypes needed
the fewest mean days (48.39), in contrary; they needed the most days at
Tubas (58.69). Environmental conditions of the experimental location
affected grain filing period of wheat genotypes as reported by Rawashdeh,
et al., (2007) showed that accessions from Karak region (highly
temperature area) had shorter filling period than others from Ajloun (lower
temperature area) by about 5.6 days. In our study, the genotypes grown in
Arroub site showed shorter days, this may be due to interaction between
genotypes and environment.
4.2.8 Leaf rust reaction (LRR)
There was a significant variation among the 15 genotypes based on leaf
rust reaction (Table 4.14). The mean score was 3.142, Genotype Numra 8
showed the highest resistance reaction (2.73) while Heitia soda showed the
least (4.00).
Similar results were reported by Nawaz, et al. (2013) in a study of
agromorphological traits of local durum wheat varieties in Pakistan in
which varieties varied significantly based on rust reaction. Landraces
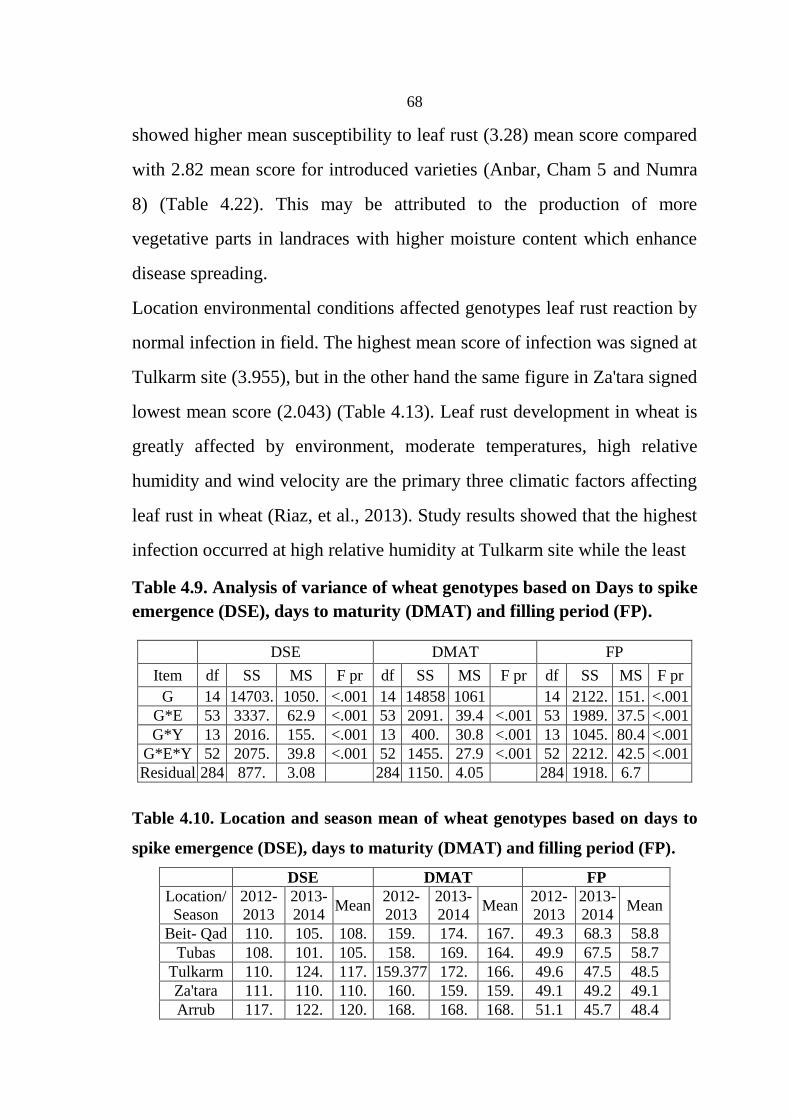
68
showed higher mean susceptibility to leaf rust (3.28) mean score compared
with 2.82 mean score for introduced varieties (Anbar, Cham 5 and Numra
8) (Table 4.22). This may be attributed to the production of more
vegetative parts in landraces with higher moisture content which enhance
disease spreading.
Location environmental conditions affected genotypes leaf rust reaction by
normal infection in field. The highest mean score of infection was signed at
Tulkarm site (3.955), but in the other hand the same figure in Za'tara signed
lowest mean score (2.043) (Table 4.13). Leaf rust development in wheat is
greatly affected by environment, moderate temperatures, high relative
humidity and wind velocity are the primary three climatic factors affecting
leaf rust in wheat (Riaz, et al., 2013). Study results showed that the highest
infection occurred at high relative humidity at Tulkarm site while the least
Table 4.9. Analysis of variance of wheat genotypes based on Days to spike
emergence (DSE), days to maturity (DMAT) and filling period (FP).
DSE DMAT FP
Item df SS MS F pr df SS MS F pr df SS MS F pr
G 14 14703. 1050. <.001 14 14858 1061 14 2122. 151. <.001
G*E 53 3337. 62.9 <.001 53 2091. 39.4 <.001 53 1989. 37.5 <.001
G*Y 13 2016. 155. <.001 13 400. 30.8 <.001 13 1045. 80.4 <.001
G*E*Y 52 2075. 39.8 <.001 52 1455. 27.9 <.001 52 2212. 42.5 <.001
Residual 284 877. 3.08 284 1150. 4.05 284 1918. 6.7
Table 4.10. Location and season mean of wheat genotypes based on days to
spike emergence (DSE), days to maturity (DMAT) and filling period (FP).
DSE DMAT FP
Location/
Season
2012-
2013
2013-
2014 Mean
2012-
2013
2013-
2014 Mean
2012-
2013
2013-
2014 Mean
Beit- Qad 110. 105. 108. 159. 174. 167. 49.3 68.3 58.8
Tubas 108. 101. 105. 158. 169. 164. 49.9 67.5 58.7
Tulkarm 110. 124. 117. 159.377 172. 166. 49.6 47.5 48.5
Za'tara 111. 110. 110. 160. 159. 159. 49.1 49.2 49.1
Arrub 117. 122. 120. 168. 168. 168. 51.1 45.7 48.4

69
Table 4.11. Identification of wheat genotypes based on Days to spike emergence (DSE) and days to maturity (DMAT)
and Filling period (FP).
Trait Genotype
DSE DMAT FP
Gen
oty
pe /
Locatio
n
Beit- Q
ad
Tubas
Tulk
arm
Za'tara
Arru
b
Mean
Beit- Q
ad
Tubas
Tulk
arm
Za'tara
Arru
b
Mean
Beit- Q
ad
Tubas
Tulk
arm
Za'tara
Arru
b
Mean
Kahatat 107.33 107.67 121.33 110.17 123.00 113.90 164.95 164.01 165.00 152.68 161.34 161.60 57.62 56.34 43.68 42.51 38.34 47.70 Heitia safra 107.00 107.67 118.83 106.50 116.17 111.23 165.95 163.68 164.84 158.68 168.01 164.23 58.96 56.01 46.01 52.18 51.84 53.00
Heitia beda 1 106.17 99.167 111.00 100.33 114.83 106.30 165.12 161.68 161.84 153.34 164.01 161.20 58.96 62.51 50.84 53.01 49.18 54.90 Heitia beda 2 105.83 105.50 109.00 108.33 116.83 109.10 164.95 160.51 155.84 155.18 164.51 160.20 59.12 55.01 46.84 46.84 47.68 51.10
Heitia soda 103.04 101.06 115.52 107.20 118.53 109.07 156.02 153.73 161.9 154.43 164.81 158.19 52.99 52.67 46.45 47.20 46.29 49.12 Heitia 104.33 103.00 117.83 108.67 120.17 110.80 164.12 164.68 164.34 159.01 168.68 164.17 59.79 61.68 46.51 50.34 48.51 53.37 Debbiya 105.00 103.67 118.17 103.00 114.00 108.77 164.9 161.68 164.51 153.01 162.18 161.23 59.79 58.01 46.34 50.01 48.51 52.47
Soori 106.67 100.83 115.33 106.17 116.67 109.13 165.45 160.68 162.51 156.34 163.68 161.73 58.79 59.84 47.18 50.18 47.01 52.60 Noorsi 114.50 110.33 129.33 124.00 126.50 120.93 175.95 173.68 180.84 172.01 175.68 175.63 61.46 63.34 51.51 48.01 49.18 54.70
Kahla 117.50 111.00 129.50 124.17 129.83 122.30 175.29 172.34 176.68 170.84 176.84 174.40 57.79 61.34 47.18 46.68 47.51 52.10 Nabeljamal 119.00 112.00 134.00 130.67 129.83 125.10 177.95 172.84 180.51 173.51 180.18 177.00 58.96 60.84 46.51 42.84 50.34 51.90
Horani 27 105.00 105.00 107.83 108.83 114.17 108.17 166.95 164.01 157.18 162.01 168.18 163.67 61.96 59.01 49.34 53.18 54.01 55.50 Numra 8 106.83 104.33 109.17 104.33 119.33 108.80 165.12 162.34 162.68 158.51 168.34 163.40 58.29 58.01 53.51 54.18 49.01 54.60 Cham 5 104.00 102.17 108.67 109.17 117.50 108.30 160.12 157.34 162.01 156.84 165.34 160.33 56.12 55.18 53.34 47.68 47.84 52.03
Anbar 104.50 101.33 111.17 104.00 116.50 107.50 165.62 162.01 163.84 156.18 167.51 163.03 61.12 60.68 52.68 52.18 51.01 55.53 Mean 111.96 164.67 52.71
SE 1.76 2.013 2.60 CV 1.6 1.2 4.9 LSD 2.82 3.235 4.18

70
Infection score was found at Za'tara site with lower relative humidity.
Similar results were obtained in a study evaluating yellow rust reaction in
38 wheat varieties under six different locations in Pakistan in which higher
severity of the disease was scored at higher relative humidity and low
temperature locations (Ali, et al., 2009).
4.2.9 Lodging reaction (LOD)
There was a significant variation among the 15 genotypes based on lodging
reaction (Table 4.14) with mean score of 3.38, Cham 5 genotype showed
the best resistance (2.07) while Nabeljamal showed the worst score (4.60).
Many factors affect lodging in cereals besides the genetic structure, plant
height, stem solidness (Karim and Jahan, 2013) and environmental
conditions in field as wind and rain. In this study the shorter the genotypes
showed the higher lodging resistance. Similar conclusion was reported by
Karim and Jahan, (2013) as they screened wheat genotypes for lodging
resistance. Landraces were more susceptible to lodging with (3.7) mean
score compared with 2.18 mean score for improved varieties (Anbar, Cham
5 and Numra 8) (Table 4.22). Lodging susceptibility is strongly related to
plant height as most landraces are taller with (102.27) cm in mean than
introduced varieties with (84.49) cm.
Location conditions affected genotypes lodging in field, higher score of
lodging was signed at Tulkarm (4.34) while Za'tara location signed lower
mean score (1.97) (Table 4.13).
Lodging tendency among studied genotypes was strongly affected by the
environmental conditions as the highest score was signed at Tulkarm
71
location having the highest relative humidity and precipitation, while the
lowest score of lodging was recorded at Za'tara, with lowest relative
humidity and rainfall. Khakwani et al (2010) exploit a decrease in grain
production of six wheat varieties by 38% under lodging conditions (High
rain and wind velocity) than of them under optimal conditions.
Yield performance
4.2.10 Number of spikelets per spike (NSPS)
Table 4.17 shows a significant variation among the 15 genotypes in terms
of number of spikelets per spike with an average of 21.87 spikelets per
spike. Nabeljamal had the most spikelets number (24.10) per spike, while
Heitia beda 1 genotype had the least number (20.77). This variation may
due to genetic variability among genotypes which is an important factor of
grain components, and is affected by environmental interaction (Zecevic et
al., 2009). Similar results were obtained by Nawaz et al (2013) in which
there were a significant variation among Pakistani wheat varieties in terms
of number of spicklets per spike ranged from22.1 to 16.44. Although there
was no significant difference between landraces and introduced varieties
(Anbar, Cham 5 and Numra 8) in mean Number of spikelets per spike
(Table 4.22), three landraces (Noorsi, Kahla and Nabeljamal) showed an
increase by 7.4% higher than introduced varieties mean.
There was a significant influence of the location on genotype affecting the
number of spikelets per spike (Table 4.16). Highest mean was observed at
Arrub (22.6 spikelets) and lowest mean was observed at Za'tara (20.41
spikelets per spike). This result may be attributed mainly to the effect of

72
Table 4.12. Analysis of variance of wheat genotypes based on Leaf rust
reaction (LRR) and Lodging reaction (LOD).
LRR LOD
Item df SS MS F pr df SS MS F pr
G 14 69.51 4.97 <.001 14 303.89 21.71 <.001
G*E 53 73.31 1.38 0.169 53 76.89 1.45 0.011
G*Y 13 24.75 1.90 0.069 13 20.99 1.615 0.051
G*E*Y 52 38.52 0.74 0.971 52 48.97 0.942 0.442
Residual 284 325.3 1.146 284 262.0 0.923
Table 4.13. Location and season mean of wheat genotypes based on
Leaf rust reaction (LRR) and Lodging reaction (LOD).
LRR LOD
Location/ Season 2012-
2013
2013-
2014 Mean
2012-
2013
2013-
2014 Mean
Beit- Qad 2.82 3.14 2.98 3.58 3.44 3.51
Tubas 3.09 2.66 2.87 3.67 3.15 3.41
Tulkarm 3.87 4.04 3.96 4.34 4.35 4.34
Za'tara 2.13 1.95 2.04 2.02 1.93 1.97
Arrub 3.82 3.89 3.86 3.61 3.77 3.69

73
Table 4.14. Identification of wheat genotypes based on Leaf rust reaction (LRR) and Lodging reaction (LOD).
Trait
Genotype
LRR LOD
Genotype / Location Beit- Qad Tubas Tulkarm Za'tara Arrub Mean Beit- Qad Tubas Tulkarm Za'tara Arrub Mean
Kahatat 2.67 2.67 4.00 2.00 3.34 2.93 4.00 3.99 4.33 1.67 2.99 3.40
Heitia safra 3.33 3.33 3.67 2.00 4.00 3.27 4.34 3.67 4.99 1.67 3.33 3.60
Heitia beda 1 3.33 3.33 5.00 3.00 3.67 3.67 3.34 3.99 4.99 2.67 4.33 3.87
Heitia beda 2 3.00 3.33 4.34 2.00 3.67 3.27 4.34 3.99 5.67 2.33 3.67 3.99
Heitia soda 5.00 3.44 4.70 2.31 4.54 4.00 2.96 3.42 4.49 1.57 3.68 3.22
Heitia 2.67 3.00 4.00 1.34 4.34 3.07 4.34 3.67 4.67 2.33 3.99 3.80
Debbiya 2.33 3.00 3.67 2.34 4.34 3.13 3.34 4.99 3.67 1.67 3.67 3.47
Soori 2.67 2.00 4.67 2.00 4.34 3.13 2.00 1.33 2.99 1.00 3.33 2.13
Noorsi 3.67 3.34 3.67 2.34 3.00 3.20 4.34 4.33 4.99 3.67 4.67 4.40
Kahla 2.33 2.33 3.67 2.00 3.67 2.80 4.00 4.33 4.67 2.99 5.33 4.27
Nabeljamal 3.33 4.00 4.00 2.33 4.33 3.60 4.67 4.33 5.00 3.33 3.33 4.60
Horani 27 3.00 3.33 3.67 2.00 3.67 3.13 3.67 3.33 4.99 1.67 3.67 3.47
Numra 8 2.33 2.00 3.67 1.67 4.00 2.73 2.34 1.99 3.33 1.00 2.99 2.33
Cham 5 3.00 2.00 4.00 1.33 4.00 2.87 2.34 1.99 2.99 1.00 1.99 2.07
Anbar 2.00 2.00 2.67 2.00 3.00 2.87 2.67 1.67 2.99 1.00 2.33 2.13
Mean 3.14 3.38
SE 1.07 0.96
CV 34.1 28.4
LSD 1.72 1.54

74
mean temperature at the experimental location. There was a positive
correlation between the length of the vegetative phase and the number of
spikelets per spike. Therefore, shortening the duration of the vegetative
stage of the apex of plant induces fewer spikelets per spike (Barnabas et al.,
2008).
4.2.11 Number of grains per spike (NGS)
Number of grains per spike varied significantly among the 15 genotypes as
shown in Table 4.17. The mean number was 49.00 grain per spike. The
genotype Anbar had the highest grains per spike (56.07) while Heitia beda
1 had the fewest value (43.77). This effect of genotype on this trait was
indicated in a study of Omani wheat landraces that showed a significant
variation among landraces in terms of number of grains per spike
(Khakwani et al., 2010). NGS in mean was lower in landraces (47.82)
seeds than it in introduced varieties; Anbar, Cham5 and Numra 8 (53.62)
seeds (Table 4.22).
There was a variation among genotypes in terms of number of grains per
spike according to experimental location (Table 4.16). Tubas site showed
the highest number (49.98) while Za'tara location produced the fewest
(44.67). This result may be due to variation of environmental conditions
especially temperature. The main effect of heat stress after/during floral
initiation is observed on grain number. Floral abnormalities induced by
heat cause spikelet sterility, and subsequently, a decrease in number of
grains per spike (Barnabas et al., 2008). Results from a study on wheat
landraces from Jordan showed that accessions from Ajloun with relatively
75
low temperatures had higher number of grains per spike than those from
Karak with relatively high temperatures (Rawashdeh, et al., 2007).
4.2.12 Thousand Grain weight by grams (TGW)
Thousand grain weight (TGW) varied significantly among the 15
genotypes (Table 4.17). An average of 50.56g was reported. Nabeljamal
genotype had the highest weight (67.82g) while Debbiya had the least
weight (45.13g).Similar result was reported by Sawalha, et al. (2008) in
which a significant variation among studied genotypes was found, as
Nabeljamal had highest TGW.
In comparison between landraces and introduced varieties (Anbar, Cham 5
and Numra 8), there was no significant difference in mean TGW, although
Kahatat and Debbiya landraces showed lower mean (45.28) g while
Nabeljamal was higher with (67.82) g (Table 4.22).
The experimental location had a significant influence on TSW of the
studied genotypes (Table 4.16). Beit- Qad location had the highest mean of
TSW (53.57g), while Za'tara had the lowest mean weight (44.75g). This
could be explained by the effect of climatic conditions especially
temperature. High temperatures around 34 C during filling period
decreases synthesis and function of enzymes responsible of starch
accumulation in grain (Barnabas et al., 2008). Similar results were reported
by Salimia and Atawnah (2014) in which grain weight vary according to
the experimental site, where hey found the highest TGW at Arroub and the
lowest value at Janata site.
76
4.2.13 Hectoliter grain weight (HGW)
Hectoliter grain weight varied among the 15 genotypes under study (Table
4.18). Average value was (76.87) kg. The highest weight (78.93) kg was
scored in Kahatat genotype while the lowest weight (74.67) kg was found
in Nabeljamal. The observed variation in the HSW among genotypes was
highly significant, that may be attributed to genetic variability among
genotypes in addition to other factors as growing environment, crop
management, plant diseases such (Fusarium Head Blight , pests such as
Russian Wheat Aphid) (Fox et al., 2007).
Landraces showed higher mean HGW (77.2) kg compared with (75.87) kg
for introduced varieties (Anbar, Cham 5 and Numra 8) (Table 4.22).
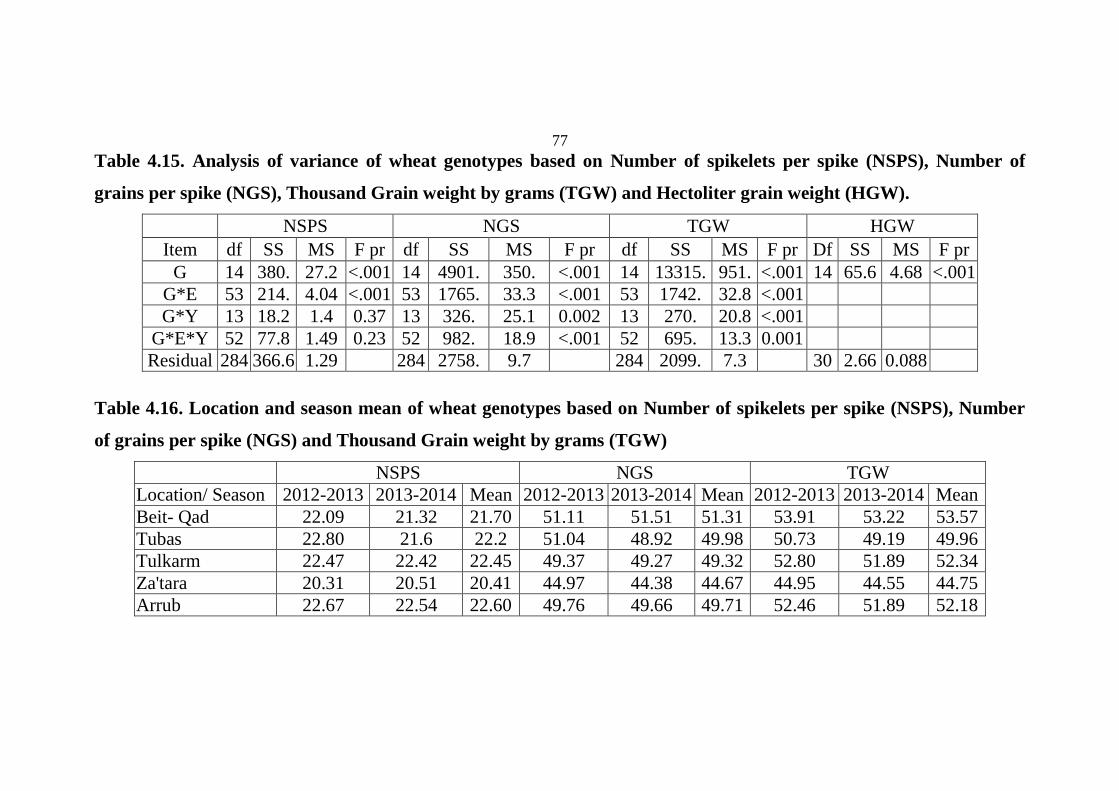
77
Table 4.15. Analysis of variance of wheat genotypes based on Number of spikelets per spike (NSPS), Number of
grains per spike (NGS), Thousand Grain weight by grams (TGW) and Hectoliter grain weight (HGW).
NSPS NGS TGW HGW
Item df SS MS F pr df SS MS F pr df SS MS F pr Df SS MS F pr
G 14 380. 27.2 <.001 14 4901. 350. <.001 14 13315. 951. <.001 14 65.6 4.68 <.001
G*E 53 214. 4.04 <.001 53 1765. 33.3 <.001 53 1742. 32.8 <.001
G*Y 13 18.2 1.4 0.37 13 326. 25.1 0.002 13 270. 20.8 <.001
G*E*Y 52 77.8 1.49 0.23 52 982. 18.9 <.001 52 695. 13.3 0.001
Residual 284 366.6 1.29 284 2758. 9.7 284 2099. 7.3 30 2.66 0.088
Table 4.16. Location and season mean of wheat genotypes based on Number of spikelets per spike (NSPS), Number
of grains per spike (NGS) and Thousand Grain weight by grams (TGW)
NSPS NGS TGW
Location/ Season 2012-2013 2013-2014 Mean 2012-2013 2013-2014 Mean 2012-2013 2013-2014 Mean
Beit- Qad 22.09 21.32 21.70 51.11 51.51 51.31 53.91 53.22 53.57
Tubas 22.80 21.6 22.2 51.04 48.92 49.98 50.73 49.19 49.96
Tulkarm 22.47 22.42 22.45 49.37 49.27 49.32 52.80 51.89 52.34
Za'tara 20.31 20.51 20.41 44.97 44.38 44.67 44.95 44.55 44.75
Arrub 22.67 22.54 22.60 49.76 49.66 49.71 52.46 51.89 52.18
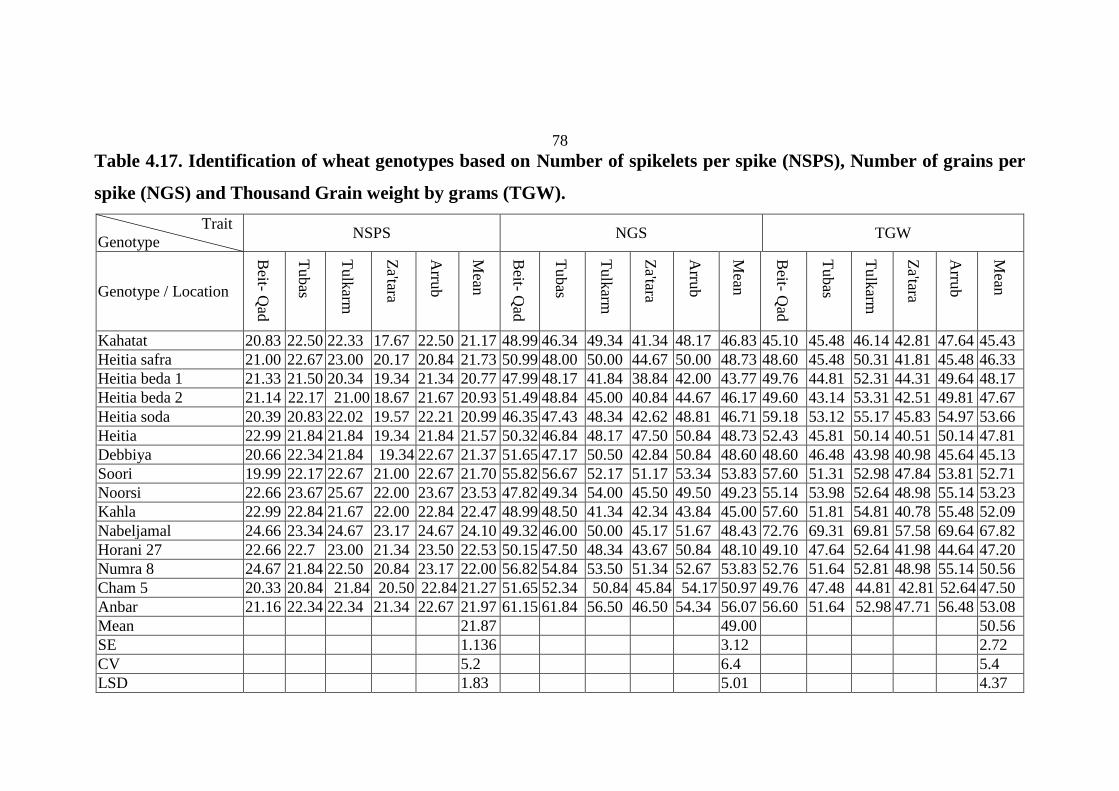
78
Table 4.17. Identification of wheat genotypes based on Number of spikelets per spike (NSPS), Number of grains per
spike (NGS) and Thousand Grain weight by grams (TGW).
Trait
Genotype NSPS NGS TGW
Genotype / Location
Beit- Q
ad
Tubas
Tulk
arm
Za'tara
Arru
b
Mean
Beit- Q
ad
Tubas
Tulk
arm
Za'tara
Arru
b
Mean
Beit- Q
ad
Tubas
Tulk
arm
Za'tara
Arru
b
Mean
Kahatat 20.83 22.50 22.33 17.67 22.50 21.17 48.99 46.34 49.34 41.34 48.17 46.83 45.10 45.48 46.14 42.81 47.64 45.43
Heitia safra 21.00 22.67 23.00 20.17 20.84 21.73 50.99 48.00 50.00 44.67 50.00 48.73 48.60 45.48 50.31 41.81 45.48 46.33
Heitia beda 1 21.33 21.50 20.34 19.34 21.34 20.77 47.99 48.17 41.84 38.84 42.00 43.77 49.76 44.81 52.31 44.31 49.64 48.17
Heitia beda 2 21.14 22.17 21.00 18.67 21.67 20.93 51.49 48.84 45.00 40.84 44.67 46.17 49.60 43.14 53.31 42.51 49.81 47.67
Heitia soda 20.39 20.83 22.02 19.57 22.21 20.99 46.35 47.43 48.34 42.62 48.81 46.71 59.18 53.12 55.17 45.83 54.97 53.66
Heitia 22.99 21.84 21.84 19.34 21.84 21.57 50.32 46.84 48.17 47.50 50.84 48.73 52.43 45.81 50.14 40.51 50.14 47.81
Debbiya 20.66 22.34 21.84 19.34 22.67 21.37 51.65 47.17 50.50 42.84 50.84 48.60 48.60 46.48 43.98 40.98 45.64 45.13
Soori 19.99 22.17 22.67 21.00 22.67 21.70 55.82 56.67 52.17 51.17 53.34 53.83 57.60 51.31 52.98 47.84 53.81 52.71
Noorsi 22.66 23.67 25.67 22.00 23.67 23.53 47.82 49.34 54.00 45.50 49.50 49.23 55.14 53.98 52.64 48.98 55.14 53.23
Kahla 22.99 22.84 21.67 22.00 22.84 22.47 48.99 48.50 41.34 42.34 43.84 45.00 57.60 51.81 54.81 40.78 55.48 52.09
Nabeljamal 24.66 23.34 24.67 23.17 24.67 24.10 49.32 46.00 50.00 45.17 51.67 48.43 72.76 69.31 69.81 57.58 69.64 67.82
Horani 27 22.66 22.7 23.00 21.34 23.50 22.53 50.15 47.50 48.34 43.67 50.84 48.10 49.10 47.64 52.64 41.98 44.64 47.20
Numra 8 24.67 21.84 22.50 20.84 23.17 22.00 56.82 54.84 53.50 51.34 52.67 53.83 52.76 51.64 52.81 48.98 55.14 50.56
Cham 5 20.33 20.84 21.84 20.50 22.84 21.27 51.65 52.34 50.84 45.84 54.17 50.97 49.76 47.48 44.81 42.81 52.64 47.50
Anbar 21.16 22.34 22.34 21.34 22.67 21.97 61.15 61.84 56.50 46.50 54.34 56.07 56.60 51.64 52.98 47.71 56.48 53.08
Mean 21.87 49.00 50.56
SE 1.136 3.12 2.72
CV 5.2 6.4 5.4
LSD 1.83 5.01 4.37

79
Table 4.18. Identification of wheat genotypes based on Hectoliter grain weight (HGW) and Biological yield (BYLD).
Trait
Genotype HGW BYLD
Genotype / Location Mean Beit- Qad Tubas Tulkarm Za'tara Arrub Mean
Kahatat 78.93 684.0 1125.4 1076.3 948.8 1108.3 988.57
Heitia safra 76.47 768.2 972.1 1231.3 972.1 988.9 986.53
Heitia beda 1 76.33 874.2 958.8 1381.4 785.9 870.9 974.27
Heitia beda 2 77.53 936.4 805.4 1000.4 997.9 1225.6 993.17
Heitia soda 77.23 772.0 929.7 1181.5 864.1 986.2 946.7
Heitia 77.80 896.5 1095.4 1107.8 990.4 1346.3 1087.30
Debbiya 78.33 821.7 1110.4 1188.8 1056.9 960.1 1027.60
Soori 76.33 843.9 1145.4 1239.8 1039.9 755.6 1004.93
Noorsi 78.53 1015.7 1278.8 1305.4 870.4 1046.6 1103.40
Kahla 77.00 773.5 1172.9 1324.6 1106.3 1175.8 1110.63
Nabeljamal 74.67 1049.9 1257.1 1423.9 835.9 1051.9 1123.77
Horani 27 76.33 1019.9 986.3 1210.4 1041.3 1064.3 1064.43
Numra 8 75.43 765.9 994.6 1138.1 818.8 984.9 940.47
Cham 5 77.10 953.5 923.4 1087.3 915.4 1096.3 995.20
Anbar 75.07 876.0 1037.9 1132.9 913.8 986.6 989.47
Mean 76.873 1022.4
SE 0.2978 162.34
CV 0.4 15.9
LSD 0.4965 260.91
80
4.2.14 Biological Yield (BYLD)
Biological yield (by grams per square meter) varied significantly among
the 15 genotypes (Table 4.18) with an average of 1022.4 g. The genotype
Nabeljamal had the highest yield (1123.8g) while Numra 8 genotype had
the least yield (940.5g).
Biological yield in landraces showed higher mean weight (1031.35) g/m2
compared with (975) g/m2 for the introduced variety (Anbar, Cham 5 and
Numra 8) (Table 4.22). This result could be attributed to the capacity of
these landraces to produce straw mass because of their more plant height
over the improved cultivars (Jaradat, 2011)
Table 4.20 shows a significance effect of the experimental location on
biological yield. The location at Tulkarm produced the highest biological
yield (1202.4g) while Beit- Qad location had the least (868.7g). This may
be attributed to environmental conditions mainly rainfall as the highest
weight was obtained at Tulkarm with highest annual rainfall while the
lowest total yield was recorded at Beit- Qad with lower precipitation. In the
same line with our results, Salimia and Atawneh (2014) reported a higher
total yield (grains and hay) of wheat genotypes at Arrub with higher annual
rainfall compared to that at Dura and Janata locations with lower rainfall.
4.2.15 Grain yield (GYLD)
Table 4.21 shows a significant variation among the 15 genotypes based on
grain yield (g/m2). The average grain yield was 268.3g/m2. Anbar genotype
produced the highest grain yield (355.11g/ m2) while Nabeljamal had the
least yield (201.27g/ m2).
81
Grain yield is considered as a complex trait being controlled by several
genes and their expression is affected by the environmental conditions and
nutrient availability (Rasheed et al 2012). The variation of grain yield
among wheat genotypes agreed with the results of previous investigators
(Fecauda, et al., 2014; Sawalha, et al., 2008; Inamullah et al., 2011; Talebi
et al., 2012; Rawashdeh et al., 2007).
All landraces showed lower grain yield with a mean of (245.6) g/m2
compared with (340) g/m2 in mean for the three introduced varieties
(Anbar, Cham 5 and Numra 8) (Table 4.22) with a decrease of 28.2%. This
result may be attributed to the higher production of vegetative parts (stem
and leaves) for landraces that affect the production of reproduction parts
(seeds).
Table 4.20 shows a significant effect of the experimental location on grain
yield. Higher grain yield was obtained at Tulkarm (330.6g/m2), while the
lowest grain yield was obtained at Za'tara (218.2g/m2). Environmental
conditions have a major influence on the genotype capacity for grain yield
production considering drought and high temperature as key stress factors
with negative impact on crop yield (Barnabas et al 2008). Similar results
confirmed by Salimia and Atawnah (2014) who stated that the highest grain
yield was obtained at Arroub site (high rainfall) followed by Dura and
Janata respectively (Low rainfall).
4.2.16 Straw Yield (SYLD)
Straw weight (g/m2) varied significantly among the 15 genotypes (Table
4.21). The average straw yield was 750.04 g/m2. Nabeljamal had the

82
highest yield (922.50 g/m2) while Numra 8 genotype had the least value
(625.93 g/m2). Landraces showed higher mean straw yield (786.6) g/m2 in
comparison with (635) g/m2 in mean for the three introduced varieties
(Anbar, Cham 5 and Numra 8) (Table 4.22), which represents 28.8% higher
in ratio).
It is clear that local varieties had higher straw mass yield, associated with
taller plants and high vegetative biomass (Jaradat, 2011). Similar results
obtained from an experiment conducted in Jordan using improved wheat
and landraces cleared that landraces had higher biological yield and lower
harvest index in comparison with improved varieties because of higher
straw yield in landraces, combined with taller plants (Rawashdeh et al
2007)
Experimental location had a significant effect on straw yield of studied
genotypes (Table 4.20); Tulkarm location scored highest mean straw
production (871.8g/m2), while Za'tara gave lowest mean straw yield (726 g/
m2). As mentioned previously in grain yield, straw yield is affected
strongly by the environmental conditions mainly water and temperatures.
Salimia and Atawnah (2014) reported similar results in which Arrub site
with higher annual rainfall produced higher hay yield than Dora and Janata
with more severe drought conditions.

83
Table 4.19. Analysis of variance of wheat genotypes based on Biological yield (BYLD), Grain yield (GYLD) and
Straw yield (SYLD) .
BYLD GYLD SYLD
Item Df SS MS F pr df SS MS F pr df SS MS F pr
G 14 1524037. 108860. <.001 14 920655. 65761. <.001 14 3498114. 249865. <.001
G*E 53 4582936. 86470. <.001 53 489090. 9228. <.001 53 3840941. 72471. <.001
G*Y 13 669381. 51491. 0.025 13 104356. 8027. 0.009 13 693555. 53350. 0.006
G*E*Y 52 2735929. 52614. <.001 52 490500. 9433. <.001 52 2103664. 40455. 0.002
Residual 284 7484749. 26355. 284 1025410. 3611. 284 6469774. 22781.
Table 4.20. Location and season mean of wheat genotypes based on Biological yield (BYLD), Grain yield (GYLD)
and Straw yield (SYLD) .
BYLD GYLD SYLD
Location/ Season 2012-2013 2013-2014 Mean 2012-2013 2013-2014 Mean 2012-2013 2013-2014 Mean
Beit- Qad 946.3 791.1 868.7 248.8 271.3 260 697.5 519.7 608.6
Tubas 1062.8 1043.7 1053.3 339.8 240.0 289.9 723.0 803.8 763.4
Tulkarm 1078.9 1325.9 1202.4 293.0 368.2 330.6 785.9 957.7 871.8
Za'tara 967.6 920.8 944.2 231.4 205.0 218.2 736.2 715.8 726
Arrub 1062.2 1025.0 1043.6 227.2 258.3 242.8 835.0 766.7 800.8

84
Table 4.21. Identification of wheat genotypes based on Grain yield (GYLD) and Straw yield (SYLD) .
Trait
Genotype GYLD SYLD
Genotype / Location Beit- Qad Tubas Tulkarm Za'tara Arrub Mean Beit- Qad Tubas Tulkarm Za'tara Arrub Mean
Kahatat 220.5 303.4 321.2 210.7 235.5 258.3 463.2 822.2 755.2 738.2 872.8 730.30
Heitia safra 210.5 277.5 291.7 232.2 196.9 241.8 557.4 694.7 939.7 740.0 792.2 744.77
Heitia beda 1 276.0 260.9 364.9 220.9 212.4 267.0 597.9 698.0 1016.7 565.2 658.7 707.27
Heitia beda 2 309.7 176.7 228.7 229.9 242.9 237.6 626.3 628.8 771.8 768.2 982.8 755.58
Heitia soda 203.4 227.0 327.7 189.6 219.7 233.5 568.6 702.7 853.8 674.5 766.5 713.2
Heitia 248.1 313.4 270.2 201.4 226.7 251.9 648.1 782.2 837.7 789.2 1119.7 835.35
Debbiya 219.4 250.9 342.5 212.2 227.0 250.4 602.0 859.7 846.3 844.8 733.2 777.18
Soori 282.2 357.5 343.2 248.5 258.2 297.9 561.3 788.0 896.7 791.5 497.5 706.98
Noorsi 231.7 261.7 223.7 158.2 207.9 216.6 783.7 1017.2 1081.8 712.3 838.8 886.77
Kahla 221.4 260.9 307.7 204.0 194.9 237. 8 551.8 912.2 1017.0 902.3 981.0 872.85
Nabeljamal 187.5 260.9 195.9 150.0 212.0 201.3 862.0 996.3 1228.2 686.0 840.0 922.50
Horani 27 361.9 290.9 405.0 275.0 219.7 310.5 657.6 695.5 805.5 766.3 844.7 753.92
Numra 8 266.8 378.4 445.2 210.0 272.2 314.5 498.7 616.3 693.0 608.8 712.8 625.93
Cham 5 333.4 366.7 421.9 268.3 360.8 350.2 619.9 556.8 665.5 647.3 735.5 644.99
Anbar 325.8 362.1 469.6 263.0 355.0 355.1 549.9 675.9 663.5 650.8 631.7 634.36
Mean 268.3 750.04
SE 60.09 150.93
CV 22.4 20.0
LSD 96.57 242.57

85
Table 4.22. Means of wheat landraces and introduced varieties based on all 16 agronomic traits in study.
Trait
Landrace NT PTHT SL AL DSE DMAT FP LRR LOD NSPS NGS TGW HGW BYLD GYLD SYLD
Kahatat 3.70 95.60 49.07 81.67 113.90 161.60 47.70 2.93 3.40 21.17 46.83 45.43 78.93 988.57 258.30 730.30
Heitia safra 4.03 95.11 60.37 94.33 111.23 164.23 53.00 3.27 3.60 21.73 48.73 46.33 76.47 986.53 241.80 744.77
Heitia beda 1 3.81 95.78 67.23 101.67 106.30 161.20 54.90 3.67 3.87 20.77 43.77 48.17 76.33 974.27 267.00 707.27
Heitia beda 2 3.59 98.68 62.53 104.33 109.10 160.20 51.10 3.27 3.99 20.93 46.17 47.67 77.53 993.17 237.60 755.58
Heitia soda 4.44 107.77 74.28 115.00 109.07 158.19 49.12 4.00 3.22 20.99 46.71 53.66 77.23 946.70 233.50 713.20
Heitia 3.60 99.77 70.67 97.50 110.80 164.17 53.37 3.07 3.80 21.57 48.73 47.81 77.80 1087.30 251.90 835.35
Debbiya 3.50 96.30 50.30 83.50 108.77 161.23 52.47 3.13 3.47 21.37 48.60 45.13 78.33 1027.60 250.40 777.18
Soori 3.46 82.80 74.17 103.33 109.13 161.73 52.60 3.13 2.13 21.70 53.83 52.71 76.33 1004.93 297.90 706.98
Noorsi 3.67 115.53 80.33 120.67 120.93 175.63 54.70 3.20 4.40 23.53 49.23 53.23 78.53 1103.40 216.60 886.77
Kahla 4.07 116.33 81.67 121.67 122.30 174.40 52.10 2.80 4.27 22.47 45.00 52.09 77.00 1110.63 237. 8 872.85
Nabeljamal 3.57 121.31 100.1 135.00 125.10 177.00 51.90 3.60 4.60 24.10 48.43 67.82 74.67 1123.77 201.30 922.50
LR mean
Introduced
3.77 102.27 70.07 105.33 113.33 165.42 52.09 3.28 3.70 21.85 47.82 50.91 77.20 1031.53 245.63 786.61
Horani 27 3.80 99.47 70.10 106.50 108.17 163.67 55.50 3.13 3.47 22.53 48.10 47.20 76.33 1064.43 310.50 753.92
Numra 8 3.69 84.89 75.40 113.33 108.80 163.40 54.60 2.73 2.33 22.00 53.83 50.56 75.43 940.47 314.50 625.93
Cham 5 3.83 85.23 75.23 116.67 108.30 160.33 52.03 2.87 2.07 21.27 50.97 47.50 77.10 995.20 350.20 644.99
Anbar 4.10 83.36 79.43 111.33 107.50 163.03 55.53 2.87 2.13 21.97 56.07 53.08 75.07 989.47 355.10 634.36
Introduced mean 3.87 84.49 76.69 113.78 108.20 162.25 54.05 2.82 2.18 21.75 53.62 50.38 75.87 975.05 339.93 635.09
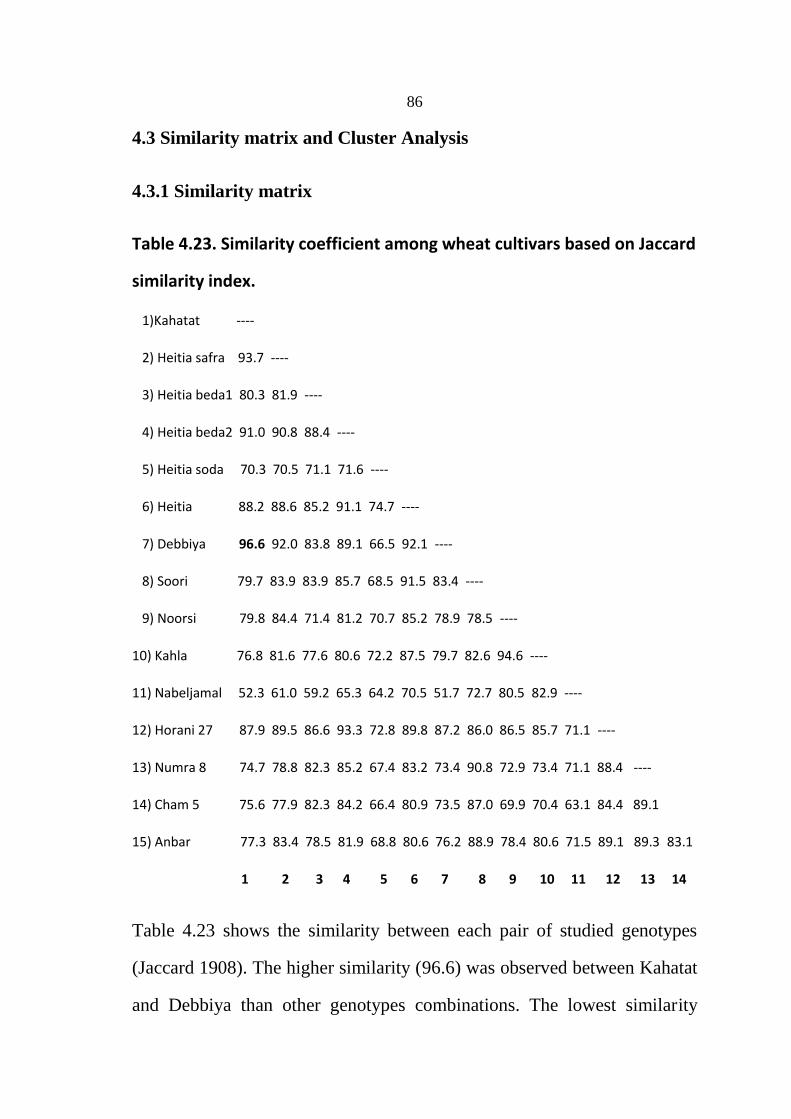
86
4.3 Similarity matrix and Cluster Analysis
4.3.1 Similarity matrix
Table 4.23. Similarity coefficient among wheat cultivars based on Jaccard
similarity index.
1)Kahatat ----
2) Heitia safra 93.7 ----
3) Heitia beda1 80.3 81.9 ----
4) Heitia beda2 91.0 90.8 88.4 ----
5) Heitia soda 70.3 70.5 71.1 71.6 ----
6) Heitia 88.2 88.6 85.2 91.1 74.7 ----
7) Debbiya 96.6 92.0 83.8 89.1 66.5 92.1 ----
8) Soori 79.7 83.9 83.9 85.7 68.5 91.5 83.4 ----
9) Noorsi 79.8 84.4 71.4 81.2 70.7 85.2 78.9 78.5 ----
10) Kahla 76.8 81.6 77.6 80.6 72.2 87.5 79.7 82.6 94.6 ----
11) Nabeljamal 52.3 61.0 59.2 65.3 64.2 70.5 51.7 72.7 80.5 82.9 ----
12) Horani 27 87.9 89.5 86.6 93.3 72.8 89.8 87.2 86.0 86.5 85.7 71.1 ----
13) Numra 8 74.7 78.8 82.3 85.2 67.4 83.2 73.4 90.8 72.9 73.4 71.1 88.4 ----
14) Cham 5 75.6 77.9 82.3 84.2 66.4 80.9 73.5 87.0 69.9 70.4 63.1 84.4 89.1
15) Anbar 77.3 83.4 78.5 81.9 68.8 80.6 76.2 88.9 78.4 80.6 71.5 89.1 89.3 83.1
1 2 3 4 5 6 7 8 9 10 11 12 13 14
Table 4.23 shows the similarity between each pair of studied genotypes
(Jaccard 1908). The higher similarity (96.6) was observed between Kahatat
and Debbiya than other genotypes combinations. The lowest similarity
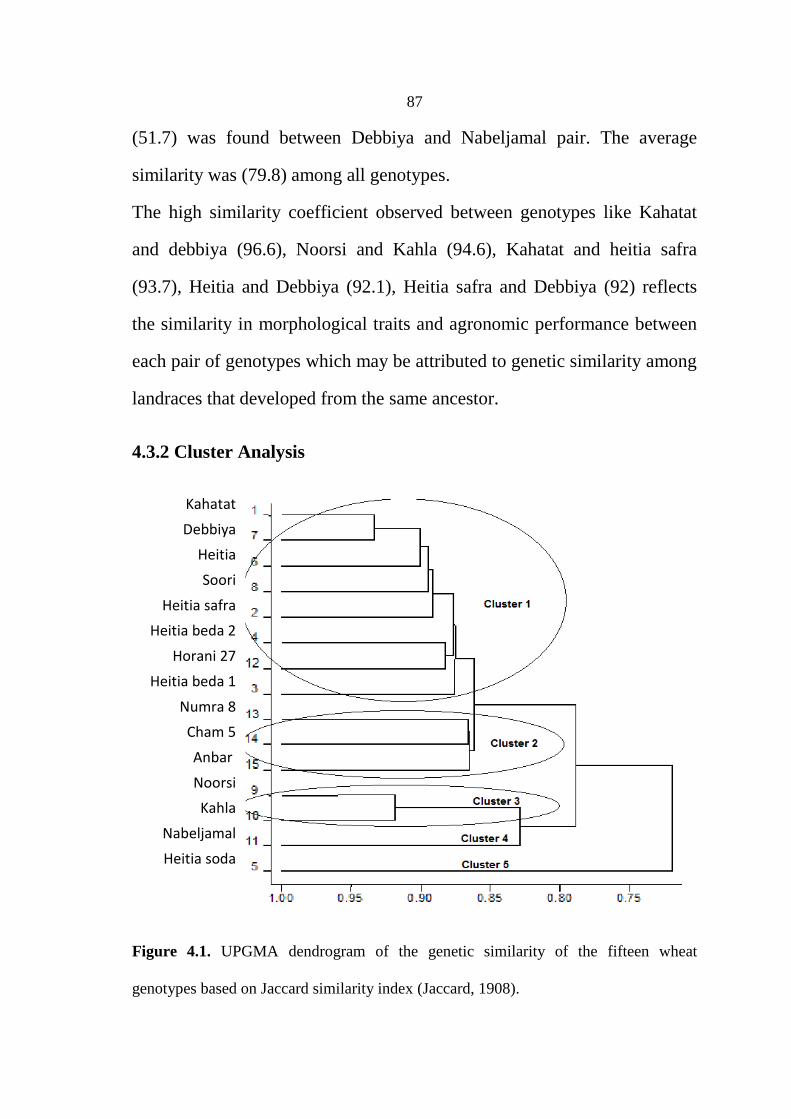
87
(51.7) was found between Debbiya and Nabeljamal pair. The average
similarity was (79.8) among all genotypes.
The high similarity coefficient observed between genotypes like Kahatat
and debbiya (96.6), Noorsi and Kahla (94.6), Kahatat and heitia safra
(93.7), Heitia and Debbiya (92.1), Heitia safra and Debbiya (92) reflects
the similarity in morphological traits and agronomic performance between
each pair of genotypes which may be attributed to genetic similarity among
landraces that developed from the same ancestor.
4.3.2 Cluster Analysis
Figure 4.1. UPGMA dendrogram of the genetic similarity of the fifteen wheat
genotypes based on Jaccard similarity index (Jaccard, 1908).
Kahatat
Debbiya
Heitia
Soori
Heitia safra
Heitia beda 2
Horani 27
Heitia beda 1
Numra 8
Cham 5
Anbar
Noorsi
Kahla
Nabeljamal
Heitia soda

88
A dendogram in Figure 4.1using UPGMA based on Jaccard genetic
similarity index (1908) showed a segregation of the 15 genotypes into five
main clusters, in which eight genotypes (Kahatat, Debbiya, Heitia, Soori,
Heitia safra, Heitia beda 2, Horani 27 and Heitia beda 1) constitute cluster
1, three genotypes (Numra 8, Cham 5 and Anbar) grouped in cluster 2,
cluster 3 consisted of two genotypes (Noorsi and Kahla) while Nabeljamal
and Heitia soda genotypes each of them was solitary located in cluster 4
and 5 respectively. Cluster 1 was also observed to divide into three sub-
clusters. Kahatat, Debbiya, Heitia in sub‐cluster-I with high genetic
similarity ranged from 96.6 % between Kahatat and Debbiya to 88.2 %
Kahatat and Heitia. Soori and Heitia safra were grouped in sub- cluster 2
with similarity of (83.9), while Heitia beda 2, Horani 27 and Heitia beda 1
were grouped in sub- cluster 3 with (93.3) similarity between Heitia beda 2,
Horani 27 and (86.6) similarity between Heitia beda 1, Horani 27. 88.4
Heitia beda 1 Heitia beda 2
Cluster 2 had high similarity ranged from 89.1 between Numra 8 and Cham
5 to 89.3 between Numra 8 and Anbar.
Cluster 3 which consists of two genotypes (Noorsi and Kahla) with
similarity of (94.6) between them.
Nabeljamal and was solely located in cluster 4 and Heitia soda in cluster 5.
The distribution of genotypes into five distinct clusters as shown in Figure
4.1 is attributed to genetic and phenotypic similarity and variation among
the fifteen genotypes under study.

89
Chapter Five
Conclusions and Recommendations
5.1 Conclusions
The results obtained from this study led to a group of conclusions:
Identification of studied fifteen genotypes of durum wheat grown in
Palestine was achieved through studying forty morphological and
agronomic traits. The synonyms and antinomy problem were removed.
The results of the agronomic performance of varieties and landraces
under different environmental conditions in Palestine showed that the
performance of landraces was not stable under different conditions.
Landraces shared some agronomic traits:
1. High yield of straw with low grain yield compared with introduced
varieties. Straw yield trait was strongly correlated to plant height in
which landraces were taller than introduced varieties in mean.
2. Varied in days to spike emergence and maturity, Heitia beda 1 and
Heitia soda were early compared with introduced varieties while
Noorsi, Kahla and Nabeljamal were late.
Genetic variation among landraces was evaluated at phenotypic and
agronomic levels. There was a clear genetic variation among landraces
on both levels.
Relatedness among these genotypes was obtained through a dendogram
in which genotypes were grouped into five main clusters.
90
5.2 Recommendations
The following recommendation was drawn from this work:
The identification manual which was developed in this study
(Appendix 1) could be used by farmers and extension staff to help
them recognize and distinguish deferent varieties and to chose proper
of them for their conditions and needs. It may also help grain
producers and technicians to produce quality grains with high purity.
Researchers may also benefit from this manual in clarifying different
genotypes and the promising traits they may utilize in improvement
activities.
Results obtained from genetic variation may be considered as
primary steps to launch a national breeding program for the
development of new wheat cultivars that have a high productivity
and adaptability with Palestinian conditions.
Landraces of wheat that were characterized in this study need to be
formally registered at national and international levels to save and
label them as Palestinian landraces.
On level of establishing a grain system in Palestine, this
identification could be used also as a technical document for
registering and releasing selected genotypes as new cultivars, as data
were obtained following an international guidelines (UPOV) that are
a prior step for registering and releasing varieties.
Further studies are still needed on chemical characterization of local
wheat landraces to evaluate their nutrient value and chemical
components, studying of water and nutrition use efficiency and
drought tolerance physiology, etc.
91
References
MoA, 2009. Agricultural Sector Strategy, Ministry of Agriculture,
Ramalla, Palestine.
Al-Fares, H. and Abu-Qaoud, H. 2012. Molecular characterization of
genetic diversity in some durum wheat (Triticum durum Desf.) in
Palestine. African Journal of Biotechnology. 11(66):12958-12963.
Ali, S., Rahman, H., Jawad, S., Shah, A., Ali Shah, S.M. and
Farhatullah. 2009. Assessment of field resistance using host- pathogen
interaction phenotype for wheat yellow rust. African Crop Science
Journal, 17(4): 213 – 221.
Al Khanjari S, Hammer K, Buerkert A, Khan I, Al-Maskri A. 2005. A
survey of wheat landraces in Oman. Plant Genet Resour Newsl. FAO-
IPGRI, Rome Italy. 141:7–10.
Al- Khanjari, S., Filatenko, A.A., Hammer, K. and Buerkert, A. 2008.
Morphological spike diversity of Omani wheat. Genetic Resour. Crop
E vol. 55: 1185-1195.
Atawnah, S. A. A. and Salimia, R. B. 2013. Growth Performance and
Yield Components of Different Wheat Genotype under Rain- fed
Conditions. Master Thesis, University of Hebron.
Banio, G. 2012. Study of genetic bases of traits involved in resistance
to biotic and abiotic stresses in durum wheat (T. turgidum L. subsp.
durum (Desf.) Husn.). Ph.D Thesis, Tuscia Univ. Viterbo, Italy.
92
Ayed, S., C. Karmous, Y. Trifa, and O. Salma-Ayed. 2010. Phenotypic
diversity of Tunisian durum wheat landraces. Afr. Crop Sci. J. 18:35-
42.
Baranabas, B., Jager, K. and Feher, A. 2008.The effect of drought and
heat stress on reproductive processes in cereals. Plant, Cell and
Environment, 31: 11–38.
Bechere, E. Belay, G. Mitiku D. and Merker, A. 1996. Phenotypic
diversity of tetraploid wheat landraces from northern and north-
central regions of Ethiopia. Hereditas 124: 165-1 72
Bellon, M.R. & Brush, S.B. 1994. Keepers of maize in Chiapas,
Mexico. Econ. Bot. 48: 196–209.
Bonman, J. M., H. E. Bockelman, Y. Jin, R. J. Hijmans and A. Gironella.
2007. Geographic distribution of stem rust resistance in wheat
landraces. Crop Sci. 47:1955-1963.
Brandolini, A. 1969. European races of maize. Procs. 24th Corn &
Sorghum Research Conf.: 36–48.
Breiman, A. and Graur, B. 1995. Wheat evolution. Israel J. Plant Sci.
43:85-98.
Brown, A. H. D. 2000. The genetic structure of crop landraces and
the challenge to conserve them in situ on farms. In: S. B. Brush (Ed.).
pp. 29-48, Genes in the Field: On-Farm Conservation of Crop Diversity.
Lewis Publishers, Boca Raton, FL, USA.
Brush, S. B. and Meng, M.1998. Farmers’ valuation and conservation
of crop genetic resources. Gen. Res. Crop Evol. 45:139-150.

93
Camussi, A., 1979. Numerical taxonomy of Italian populations of Maize
based on quantitative trait. Maydica 24: 161–174.
Chapman, S. R. and Carter, S. P. 1976. Crop Production Principles
and Practices. Unin. California, Berkeley, CA, USA.
Chemelar, F. and Mostovj, K. 1938. Applicability of some older and
introduction of new methods for testing genuineness of variety in the
laboratory. Proc. Int. Grain Test. Assoc., 10: 68-74.
Cleveland, D.A., D. Soleri & Smith, S.E. 1994. Folk crop varieties: do
they have a role in sustainable agriculture? Bio Science, 44: 740–751.
Desheva, G. 2014. Morphological and agronomical characterization of
common wheat landraces (Triticum aestivum L.) from the national
wheat collection of Bulgaria, Emir. J. Food Agric. 26(2): 164-169.
Distefeld, A., I. Cakmak, Z. Peleg, L. Ozturk, A.M. Yazici, H. Budak, Y.
Saranga and T. Fahima. 2007. Multiple QTL-effects of wheat Gpc-B1
locus on grain protein and micronutrient concentrations. Physiol.
Plant, 129:635-64.
Dvorak, J. 1998. Genome analysis in the Triticum- Aegilops
alliance. In A.E. Slinkard (Eds.). Proc. 9th Int. Wheat Genetics
Symp. Vol. 1, p. 8-11. University of Saskatchewan, Canada,
University Extension Press.
Ehdaie, B. and J. G. Waines. 1989b. Adaptation of landrace and
improved spring wheat genotypes to stress environments. J. Gen.
Breed, 43:151-156.

94
Elings, A. and Nachit, M.M. 1991. Durum wheat landraces from
Syria, Agro-ecological and morphological characterization. Kluwer
Academic Publishers, 53: 21 1-224.
El-Kalla, S.E., Lillah, A.A., El-Emery, M.I. and Kishk, A.M.S. 2010.
Determination of genetic purity in three common wheat (Triticum
aestivum L.) varieties. Research Journal of Grain Science, 3 (4): 227-
233.
Elzevir, C.J. and Aluizio, B. 1999. Morphological characteristics gain
by selection of wheat population. Sci. Agric., 56(4): 875-884.
FAO (Food and Agriculture Organization of the United Nations). 2008.
FAOSTAT on-line statistical service. Rome: FAO. Available on-line at
http://apps.fao.org.
FAO (Food and Agriculture Organization of the United Nations). 2013.
FAOSTAT on-line statistical service. Rome: FAO. Available on-line at
http://apps.fao.org.
Fecadu, W., Lakew, B. and Wondatir, Z. 2014. Advance in improving
morpho- agronomic and grain quality traits of barley (Hordeum
vulgare L.) in central highland in Ethiopia. Advanced Science Journal
of Agricultural Science. 1:011-026.
Fox, G.P., Stuart, J. & Kelly, A. 2007. Value of the test weight method
in assessing barley quality. Proceedings of the 13th Australian Barley
Technical Symposium, Fremantle, Australia.
95
Frison, E.A., J. Cherfas and T. Hodgkin. 2011. Agricultural
biodiversity is essential for a sustainable improvement in food and
nutrition security. Sustainability, 3:238-253.
Geneç, Y., J. M. Humphries, G. H. Lyons and R. D. Graham. 2005.
Exploring gentypic variation in plant nutrient accumulation to
alleviate micronutrient deficiency in populations. J. Trace Elements
Med. Biol. 18:319-324.
Gepts, P. 2006. Plant Genetic Resources Conservation and
Utilization: The Accomplishments and Future of a Societal
Insurance Policy. Crop Sci. 46:2278–2292, CSSA Golden Anniversary
Symposium.
Goncharov, N.P. 2002. Comparative genetics of wheats and their
related species. Siberian University Press, Novosibirsk, 252 pp. (in
Russian with English Summary).
Gupta, S. 1985. Identification of paddy varieties on the basis of
laboratory tests. M.Sc. (Agri.) Thesis, G.B.P.U.A. & T., Pantanagar.
Haljak, M., Koppel, R., Ingver, A. and Ruzgas, V. 2008. Variation in
the morphological characteristics of winter wheat (Triticum
aestivum L.). Latvian Journal of Agronomy, 11:54-60.
Hammer, K., H. Knupffer, L. Xhuveli and P. Perrino. 1996. Estimating
genetic erosion in landraces-two case studies. Gen. Res. Crop Evol.
43:329-336.
Harlan, J.R., 1975. Our vanishing genetic resources. Science, 188:
618–621.

96
Harlan, J. R. 1981. The Early History of Wheat: Earliest Trace to the
Sack of Rome. In: L. T. Evans and W. G. Peacock, eds.: Wheat Science-
Today and Tomorrow? Cambridge University Press, Cambridge, UK. Pp
1-19.
Haun, J.R. 1973. Visual quantification of wheat development. Agron.
J., 65: 116-117.
Heun, M., Schaefer-Pregl, R., Klawan, D., Castagna, R., Accerbi,
M., Borghi, B. and Salamini, F. 1997. Site of einkorn wheat
domestication identified by DNA fingerprinting. Science, 278:
1312-1314.
Hoson, T. 1984. Characteristics of coleoptile growth in some varieties
of rice and maize. Mem. Osaka Kyoiku Univ., III Nat. Sci. Appl. Sci.,
32(2/3):115-124.
ICARDA 1995. ICARDA annual report 1994. International Centre for
Agricultural Research in Dry Areas, Aleppo, Syria, 128 pp.
Inamullah, Khan, F. and Khalil, I.H. 2011. Environmental effect on
wheat phenology and yields. Sarhad J. Agric. 27 (3):395-402.
Jaccard, P. 1908. Nouvelles recherches sur la distribution florale.
Bull. Soc. Vaudoise Sci. Nat. 44:223-270.
Jaradat, A.A. 2011. Wheat Landraces: Genetic Resources for
Sustenance and Sustainability. USDA-ARS, 803 Iowa Ave., Morris,
MN 56267, USA.
Jaradat, A.A. 2013. Wheat Landraces: A mini review. Emir. J. Food
Agric. 25 (1): 20-29.

97
Johnson, P. L. and Walnes, J. G. 1977. Use of Wild Wheat Resources.
California Agriculture, CA, USA.
Karagoz, A., Pilanali, N. and Polat, T. 2006. Agro-morphological
characterization of some wild heat (Agilops L. and Triticum) species.
Turk.J.Agric, 30: 387-398.
Karim, M.H. and Jahan, M.A. 2013. Study of lodging resistance and its
associated traits in bread wheat. ARPN Journal of Agricultural and
Biological Science, 8 (10):683-687.
Kebebew, F., Y. Tsehaye and T. McNeilly. 2001. Diversity of durum
wheat (Triticum durum Desf.) at in situ conservation sites in North
Shewa and Bale. Ethiopia. J. Agric. Sci. Cambridge, 136:383-392.
Khakwani, A., Balouch, M.S., Nadim, M.A., Zubair, M., Shah, I. and
Khan, A. 2010. Lodging: a determining factor in reducing yield and
yield structure of wheat. Sarhad J. Agric. 26(2): 235-239.
Khoufi, S., Khamassi, K., Teixeira da Silva, J.A., Chaabane, R. and Ben
Naceur, M.B. 2012. Morphological and molecular characterization of
six of the most frequently cultivated hard wheat varieties in Tunisia.
Journal of Plant Breeding and Crop Science, 4(7):106-114.
Kolmer, J.A. 1996. Genetics of resistance to wheat leaf rust. Annu.
Rev. Phytopathol. 34:435-455.
Konvalina, P., Capouchová, I., Stehno, Z. and Moudrý, J. 2010.
Agronomic characteristics of the spring forms of the wheat
landraces (einkorn, emmer, spelt, intermediate bread wheat) grown
in organic farming. J Agrobiol, 27(1): 9–17.
98
Koshgoftarmanesh, A.H., R. Schulin, R.L. Chaney, B. Daneshbakhsh,
and M. Afyuni. 2010. Micronutrient-efficient genotypes for crop yield
and nutritional quality in sustainable agriculture: A review. Agron.
Sust. Dev. 30:83-107.
Kumar, P., Yadava, R.K., Gollen, B., Kumar, S., Verma R.K. and
Yadav, S.2011. Nutritional contents and medicinal properties of
wheat: A review. Life Sci. Med. Res., LSMR-22.
Law, C.N., Worland, A.J. and Giorgi, B. 1976. The genetic control of
spike emergence time by chromosomes 5A and 5D of wheat.
Heredity, 36 (1):49-58.
Laloriya, M.M. and Naqvi, S.A. 1961. Auxin- gibberllic acid
interaction in controlling the hypocotyl growth in grainlings.
Science, 133:1357.
Large, E.C. 1954. Growth stages in cereals. Illustration of the
"Feekes" Scale. Plant Pathol. 3: 128-129.
Le Boulch, V., David, J. L., Brabant P., and De Vallavielle-Pope C.1994.
Dynamic conservation of variability: responses of wheat populations
to different selective forces including powdery mildew. Gen. Sel.
Evol., 26:221s-240s.
Leng, E.R., Tavcar, A. & Trifunovic, V.1962. Maize of Southeastern
Europa and its potential value in breeding programs elsewhere.
Euphytica, 11: 263–272.
Linda, M., Noorani, A. and Pagnotta, M.A. 2009. Assessing plant
genetic diversity by molecular tools. Diversity, 1: 19-35.
99
Lirinde, M.A. 1986. Laboratory methodology for cultivar purity
testing in US rices. Dissertation Abstracts International B (Sciences and
Engg.), 47 (4): 1336B-1337B.
Mansing, J.S. 2010. Characterization of wheat (Triticum spp.)
genotypes through morphological, chemical and molecular markers.
Master Thesis, University Library, UAS, Dharwad.
Mckee. 1973. Chemicals and biochemical techniques for varietal
identification. Grain Sci. Technol., 1: 181-199.
Mercer, K. L. and Peralis, H. R. 2010. Evolutionary response of
landraces to climate change in centers of crop diversity. Evol. Appl.
3(5- 6): 480-493.
Mebatsion, H.K., Paliwal, J. and Jayas, D.S. 2012. Evaluation of
variations in the shape of grain types using principal components
analysis of the elliptic Fourier descriptors. Computers and Electronics
in Agriculture, 80: 63–70.
Miyagawa, S. 1984. Elongation of mesocotyl and coleoptile in scented
rices. Res. Bull. Fac. Agric. Gifu Univ., 49: 27-35.
Mustafa, E., Bekele, G.A. and Baenzier, S. 1998. Evaluation of
grainlings characters of wheat (Triticum aestivum L.) through
canonical correlation analysis. Agron. J., 90: 582-586.
Mollasaddeghi, V., Elyasi, S. and Mirzamasoumzadeh, B. 2012. Genetic
Variation of 12 bread wheat genotypes based on number of
phonological and morphological traits. Scholar Research Labaratory/
Analas of Biological Research, 10: 4734-4740.
100
Morris, M. L. and Heisey, P. 1998. Achieving desirable levels of crop
diversity in farmers’ fields: Factors affecting the production and use
of commercial grain. In: Smale, M. (Ed), Farmers, gene banks and crop
breeding: Economics analyses of diversity in wheat, maize, and rice.
Norwell, MA: Kluwer Academic Publishers, Inc., and CIMMYT.
Naghavi, M.R., Monafared, S.R., Ahkami, A.H. and Ombidbakhsh,
M.A. 2009. Genetic variation of durum wheat landraces and
cultivars using morphological and protein markers. World Acad. Sci.,
Engg. Technol., 49:73-75.
Nawaz, R., Inamullah, Ahmad, H., Sirajuddin and Iqbal, M.S. 2013.
Agromorphological studies of local wheat varieties for variability
and their association with yield related traits. Pak. J. Bot., 45(5):
1701-1706.
Nevo, E. 1998. Genetic diversity in wild cereals: regional and local
studies and their bspikeing on conservation ex-situ and in-situ. Gen.
Res. Crop Evol. 45, 355-370.
Nimbal, S., Behl, R. K. and Chhabra, A. K. 2009. RAPD analysis for
genetic polymorphism in bread wheat (Triticum aestivum L.em Thell)
genotypes varying for grain protein content. The South Pacific
Journal of Natural Science, 27: 49-56
Oldfield, M.L. & Alcorn, J.B. 1987. Conservation of traditional
agroecosystems.

101
Panio, G. 2012. Study of genetic bases of traits involved in resistance
to biotic and abiotic stresses in durum wheat (T. turgidum L. subsp.
durum (Desf. Husn.), ph thesis, Tuscia Univ. Viterbo, Italy.
Palestinian Central Bureau of Statistics. 2008. Agricultural Statistics,
2006/2007. Ramallah - Palestine.
Paukens, J. 1975. Methods for determining cultivar trueness and
purity in maize (Zea mays L.). Grain Sci. Technol., 3: 176-181.
Perrino, P., Laghetti, G., D’Antuono, L.F., Ajlouni, M., Camberty,
M., Szabo, A.T. and Hammer, K. 1996. Ecogeographical
distribution of hulled wheat species. In Hulled wheats. Proceedings
of the First International Workshop.
Rashid, M.A., Khan, A. and Iftikhar, R. 2012. Genetic Studies for Yield
and Yield Related Parameters in Bread Wheat. American-Eurasian J.
Agric. & Environ. Sci., 12 (12): 1579-1583.
Rawashdeh, N. K., Haddad, N., Al-Ajlouni, M. and Turk, M. A. 2007.
Phenotypic diversity of durum wheat (Triticum durum Desf.) from
Jordan. Genetic Resources and Crop Evolution. 54:129–138
Rehman, M., Jennifer, L., Brown, J. and Zemetra, S. 2006. Evaluation
of the morphological characters of some wheat varieties. Amer. J.
Cere. Sci., 98: 342-351.
Riaz, A., Riaz, A., Rattu, A., Tahir, M.I. and Azeem, M. 2013. Impact of
Epidemiological Factors on Development of Puccinia Triticina Sp.
Tritici on Wheat in Pakistan. Journal of Biology, Agriculture and
Healthcare, 3(19):50-61.
102
Ribot, G.G., Silva, P. and Acevedo, E. 2012. Morphological and
Physiological traits of assistance in the selection of high yielding
varieties of durum wheat (Triticum turgadum L. spp. Durum) for the
rainfed Mediterranean environments of central Chile. American
Journal of Plant Science, 3:1809-1819.
Ruiz, M., and Martin, I. 2000. Spanish landraces collection of durum
wheat maintained at the CRF-INIA. Options Mediterraneennes.
CIHEAM, 40:601-606.
Ruiz, M. and Aguiriano, E. 2004. Analysis of duplication in the
Spanish durum wheat collection maintained in the CRF-INIA on the
basis of agro-morphological traits and gliadin proteins. Genetic
Resources and Crop Evaluation, 51: 231-235.
Salimia, R.B. and Atawnah, S. 2014. Morphological Features, Yield
Components and Genetic Relatedness of Some Wheat Genotypes
Grown in Palestine. World Journal of Agricultural Research, vol. 2,
(1): 12-21.
Sawalha, K. Eideh, H., Laham, S., Hasasneh, H., Mezeid, B., 2008.
Genetic Diversity Studies on Wheat Landraces in Palestine Using
RAPD Markers in Comparison to Phenotypic Classification. Journal
of Applied Biological Sciences 2 (1): 29-34
Sivasubramanian, S. and Ramakrishnan, V. 1978. Identification of rice
varieties by laboratory Techniques. Grain Res., 6(1): 71-76.

103
Sourdille, P. Cadalen, T. Gay, G. Gill, B. and Bernard, M. 2002.
Molecular and physical mapping of genes affecting awning in wheat.
Plant Breeding, 121:320-324.
Sourour, A., Chahine, K., Youssef, T., Olfa, S. and Hajer, S.A. 2010.
Phenotypic diversity of Tunisian durum wheat landraces. African
Crop Science Journal, 18 (1): 35-42.
Talebi, R., Fayaz, F. and Karami, E. 2012. Morphometric and
ampliphied fragment length polymorphism marker analysis in some
landrace wheat (Triticum aestivum) genotypes collected from north
–west Iran. Environmental and Experimental Biology, 10: 49-56.
Tasnuva, S., Hasanuzzaman, M., Faruq, G., Sharmeen, F. and
Arifuzzaman, M. 2010. Study on differentiation of wheat varieties
through morphological and molecular approaches. Int. J. Sustain.
Crop Prod., 5(3):29-34.
Terao, H. 1986. Studies on the mesocotyl elongation of grainling in
Japanese paddy rice cultivars (Oryza sativa L.). Bulletin Institutional
Tropic. Agri., 9: 77-87.
Tereshchenko, O.Yu., Khlestkina, E.K., Gordeeva, E.I., Arbuzova, V.S.,
Salina, E.A. 2012. Relationship between anthocyanin biosynthesis
and abiotic stress in wheat. European Cereals Genetics Co-operative
Newsletter, Novi Sad, Serbia, pp.72-75.
Teshome, A., Baum, B.R. Fahrig, L., Torrance, J.K., Arnason, T.J. &
Lambert, J.D. 1997. Sorghum (Sorghum bicolor L.) landrace
104
variation and classification in North Shewa and South Welo,
Ethiopia. Euphytica, 97: 255–263.
Tsenov, N.2009. Relation between time to heading and date of maturity
of winter common wheat varieties (Triticum aestivum L.). Agricultural
Science and Technology, 1 (4):126-132.
Ullah, K., Khan, N., Khan, S., Khan, I., Khan, M.I., Khan, R. and Gul, S.
2014. Genetic analysis for grain filling duration in wheat using joint
segregation analysis. Turkish Journal of Agriculture and Forestry,
38: 2-13.
UNDP (United Nations Development Program), 1998. "Conservation
and Sustainable Use of Dryland Agro-biodiversity of the Palestinian
Authority" Project of the Palestinian Authority, Ministry of
Agriculture, Ramalla, Palestine.
UPOV. 2012. Guidelines for the conduct of test of Distinctness,
Uniformity and Stability. Geneva, Swiss.
Van Den Berg, E. 2008. The expression and inheritance of stem
strength in irrigation wheat. University of Free State, Bloemfontein,
South Africa.
Vanderburg, N.J. and Vanzwol, R.A. 1991. Rapid identification
techniques used in laboratories of the International Grain Testing
Association: a survey. Grain Sci.Technol. 19: 687-700.
Watkins, A. E. and Ellerton, S. 1940. Variation and genetics of the awn
in Triticum. Jour. Genet., 40: 243-270.

105
Wax, L.M., Beranard, R.L. and Hayers, R.M. 1974. Response of
soybean cultivars to bentazon, bromoxynil, chloroxuron and 2, 4-D.
Weed Sci., 22(1): 35-41.
Willcox, G. 1998. Archaeobotanical evidence for the beginning of
agriculture in Southwest Asia. In: Damania, A. B. Valkoun, J. Wlcox,
G.and Qualset, C. O. (Eds.), pp 25-36.The origins of agriculture and
crop domestication.Proc. Harlan Symp. 10-14 May, 1997. Aleppo,
Syria. Published jointly by ICARDA, IPGRI, FAO, and UC/GRCP.
Witcombe, J. R., Joshi, A. Joshi, K. D. and Sthapti, B. R. 1996. Farmer
participatory crop improvement: Varietal selection and breeding
methods and their impact on biodiversity. Exp. Agric. 32:445-460.
Woldesemayat, A.A., and Tanto1, T. 2013. Comparative analysis of
farmers' and improved varieties of durum wheat (Triticum durum)
managed on farm in Ethiopia. Basic Research Journal of
Agricultural Science and Review, 2(3): 57-63.
Yao, J.B. Ma, H.X. Ren, L.J. Zhang, P.P. Yang, X.M. Yao, G.C. Zhang,
P. and Zhou, M.P. 2011. Genetic analysis of plant height and its
components in diallel crosses of bread wheat (Triticum aestivum L.)
AJCS 5(11):1408-1418 (2011)
Zadoks, J.C., Chang, T.T. & Konzak, C.F. 1974. A decimal code for the
growth stages of cereals. Weed Res., 14: 415-421.
Zarkti, H. Ouabbou H. Udupa S. M., Gaboun, F., Hilali, A. 2012. Agro-
morphological variability in durum wheat landraces of Morocco.
AJCS 6(7):1172-1178.

106
Zecevic, V., Knezevic, D., Boskovic, J., Micanovic, D. and Dimitrijevic,
B. 2009. Genetic and phenotypic variability of number of spikelets
per spike in winter wheat. Kragujevac J. Sci. 31:85-90.
Zeven, A.C., 1986. Landrace groups of bread wheat (Triticum
aestivum L. em. Thell.). Acta. Hortic. 182: 365–375.
Zeven, A.C.1998. Landraces: A review of definitions and
classifications. Euphytica, 104: 127-139.
Zeven, A. C. 2000. Traditional maintenance breeding of landraces: 1.
Data by crop. Euphytica, 116:65-85.
Zohary, D. and Hopf, M. 1993. Domestication of plants in the Old
World, The origin and spread of cultivated plants in West Asia,
Europe and the Nile Valley. Second edition, Clarendon Press,
Oxford, UK.
107
Appendices

108
Appendix (1)
Varietal Descriptive Identity Sheet
Table 5.1. Kahatat genotype descriptors and means. Characteristic Description Mean
Coleoptile Anthocyanin Coloration Absent or very week
Flag leaf Anthocyanin Coloration of Auricles Weak
Frequency of plants with recurved flag leaves Low
Glaucosity of lower side of flag leaf blade Medium
Glaucosity of spike's neck Medium
Peduncle attitude Crooked
Straw pith in cross Medium
Plant growth habit Erect
Plant height (mean in cm) Long 95.6
Spike glaucosity Medium
Spike shape Tapering
Spike density Very dense
Spike color Slightly colored
Spike length (mean in mm) Very short 49.07
Awns color Light brown
Awns attitude Spreading
Awns roughness Medium
Awns or scurs presence Awns presence
Awns length (mean in mm) Medium 81.67
Lower glume shape Ovoid
Lower glume external hairiness Absent
Lower glume shoulder width Narrow
Lower glume shoulder shape Rounded
Lower glume peak length Very short
Lower glume peak curvate Weak
Grain color Reddish
Grain shape Slightly elongated
Number of fertile tillers per plant Medium 3.7
Days to spike emergence Medium 114
Days to maturity Early 162
Filling period Short 48
Leaf rust reaction Semi resistant 2.9
Lodging reaction Semi susceptible 3.40
Number of spikelets per spike Medium 21.17
Number of grains per spike Medium 46.83
Thousand Grain weight by grams Medium 45.43
Hectoliter grain weight High 78.93
Biological yield Medium 988.57
Grain yield Medium 258.27
Straw yield High 730.30
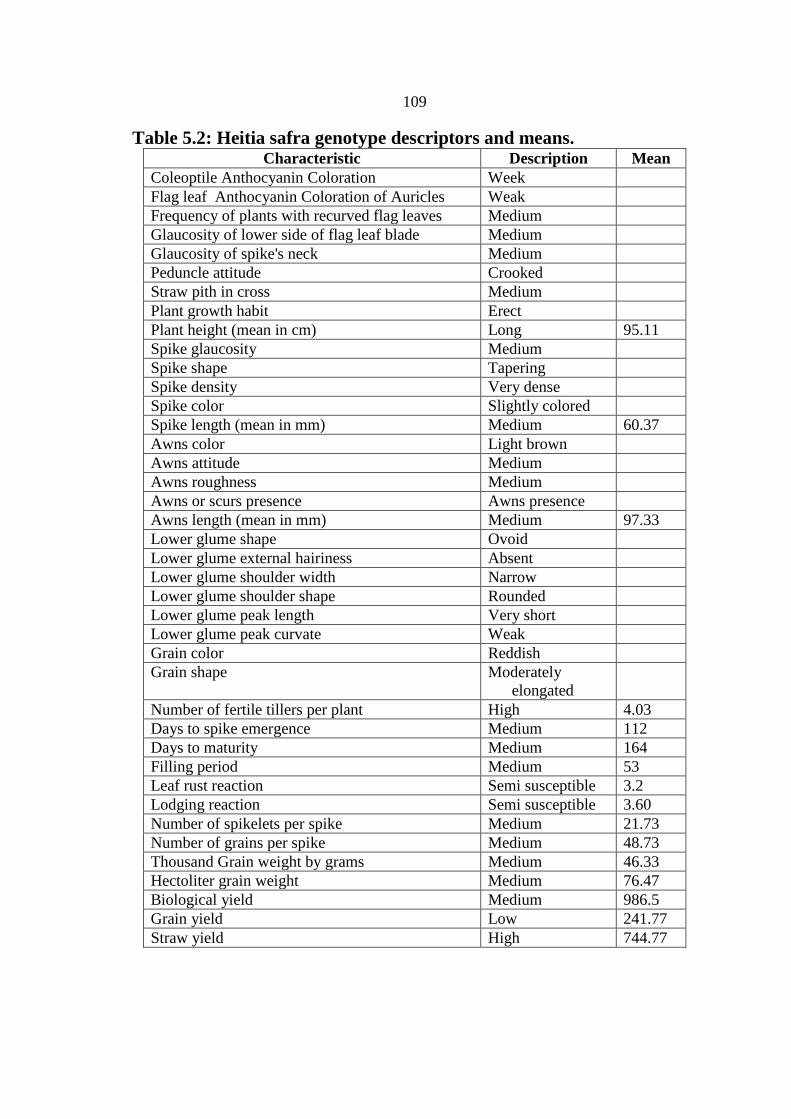
109
Table 5.2: Heitia safra genotype descriptors and means. Characteristic Description Mean
Coleoptile Anthocyanin Coloration Week
Flag leaf Anthocyanin Coloration of Auricles Weak
Frequency of plants with recurved flag leaves Medium
Glaucosity of lower side of flag leaf blade Medium
Glaucosity of spike's neck Medium
Peduncle attitude Crooked
Straw pith in cross Medium
Plant growth habit Erect
Plant height (mean in cm) Long 95.11
Spike glaucosity Medium
Spike shape Tapering
Spike density Very dense
Spike color Slightly colored
Spike length (mean in mm) Medium 60.37
Awns color Light brown
Awns attitude Medium
Awns roughness Medium
Awns or scurs presence Awns presence
Awns length (mean in mm) Medium 97.33
Lower glume shape Ovoid
Lower glume external hairiness Absent
Lower glume shoulder width Narrow
Lower glume shoulder shape Rounded
Lower glume peak length Very short
Lower glume peak curvate Weak
Grain color Reddish
Grain shape Moderately
elongated
Number of fertile tillers per plant High 4.03
Days to spike emergence Medium 112
Days to maturity Medium 164
Filling period Medium 53
Leaf rust reaction Semi susceptible 3.2
Lodging reaction Semi susceptible 3.60
Number of spikelets per spike Medium 21.73
Number of grains per spike Medium 48.73
Thousand Grain weight by grams Medium 46.33
Hectoliter grain weight Medium 76.47
Biological yield Medium 986.5
Grain yield Low 241.77
Straw yield High 744.77
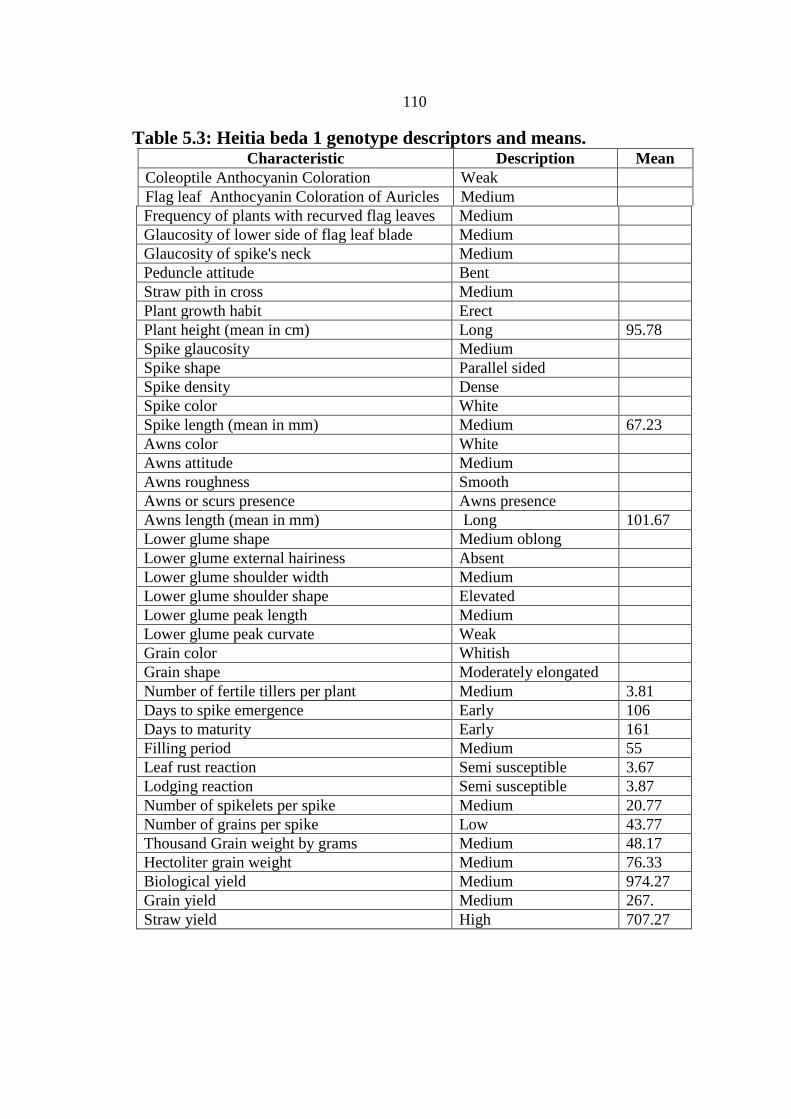
110
Table 5.3: Heitia beda 1 genotype descriptors and means. Characteristic Description Mean
Coleoptile Anthocyanin Coloration Weak
Flag leaf Anthocyanin Coloration of Auricles Medium
Frequency of plants with recurved flag leaves Medium
Glaucosity of lower side of flag leaf blade Medium
Glaucosity of spike's neck Medium
Peduncle attitude Bent
Straw pith in cross Medium
Plant growth habit Erect
Plant height (mean in cm) Long 95.78
Spike glaucosity Medium
Spike shape Parallel sided
Spike density Dense
Spike color White
Spike length (mean in mm) Medium 67.23
Awns color White
Awns attitude Medium
Awns roughness Smooth
Awns or scurs presence Awns presence
Awns length (mean in mm) Long 101.67
Lower glume shape Medium oblong
Lower glume external hairiness Absent
Lower glume shoulder width Medium
Lower glume shoulder shape Elevated
Lower glume peak length Medium
Lower glume peak curvate Weak
Grain color Whitish
Grain shape Moderately elongated
Number of fertile tillers per plant Medium 3.81
Days to spike emergence Early 106
Days to maturity Early 161
Filling period Medium 55
Leaf rust reaction Semi susceptible 3.67
Lodging reaction Semi susceptible 3.87
Number of spikelets per spike Medium 20.77
Number of grains per spike Low 43.77
Thousand Grain weight by grams Medium 48.17
Hectoliter grain weight Medium 76.33
Biological yield Medium 974.27
Grain yield Medium 267.
Straw yield High 707.27

111
Table 5.4: Heitia beda 2 genotype descriptors and means. Characteristic Description Mean
Coleoptile Anthocyanin Coloration Weak
Flag leaf Anthocyanin Coloration of Auricles Weak
Frequency of plants with recurved flag leaves Medium
Glaucosity of lower side of flag leaf blade Medium
Glaucosity of spike's neck Medium
Peduncle attitude Bent
Straw pith in cross Medium
Plant growth habit Erect
Plant height (mean in cm) Long 98.68
Spike glaucosity Medium
Spike shape Tapering
Spike density Medium
Spike color White
Spike length (mean in mm) Medium 62.53
Awns color White
Awns attitude Medium
Awns roughness Smooth
Awns or scurs presence Awns presence
Awns length (mean in mm) Long 104.33
Lower glume shape Medium oblong
Lower glume external hairiness Absent
Lower glume shoulder width Narrow
Lower glume shoulder shape Rounded
Lower glume peak length Short
Lower glume peak curvate Weak
Grain color Whitish
Grain shape Moderately
elongated
Number of fertile tillers per plant Medium 3.59
Days to spike emergence Early 109
Days to maturity Early 160
Filling period Medium 51
Leaf rust reaction Semi susceptible 3.27
Lodging reaction Semi susceptible 3.99
Number of spikelets per spike Medium 20.93
Number of grains per spike Medium 46.17
Thousand Grain weight by grams Medium 47.67
Hectoliter grain weight Medium 77.53
Biological yield Medium 993
Grain yield Low 237.58
Straw yield High 755.58

112
Table 5.5: Heitia soda genotype descriptors and means. Characteristic Description Mean
Coleoptile Anthocyanin Coloration Weak
Flag leaf Anthocyanin Coloration of Auricles Medium
Frequency of plants with recurved flag leaves Medium
Glaucosity of lower side of flag leaf blade Medium
Glaucosity of spike's neck Weak
Peduncle attitude Bent
Straw pith in cross Thick
Plant growth habit Semi erect
Plant height (mean in cm) Long 107.77
Spike glaucosity Medium
Spike shape Tapering
Spike density Medium
Spike color Black
Spike length (mean in mm) Medium 63.00
Awns color Deep purple
Awns attitude Spreading
Awns roughness Rough
Awns or scurs presence Awns
presence
Awns length (mean in mm) Long 115.00
Lower glume shape Medium
oblong
Lower glume external hairiness Weak
Lower glume shoulder width Medium
Lower glume shoulder shape Rounded
Lower glume peak length Medium
Lower glume peak curvate Weak
Grain color Dark
Grain shape Strongly
elongated
Number of fertile tillers per plant High 4.44
Days to spike emergence Early 109
Days to maturity Early 158
Filling period Short 49
Leaf rust reaction Susceptible 4
Lodging reaction Semi
susceptible
3.22
Number of spikelets per spike Medium 20.99
Number of grains per spike Medium 46.71
Thousand Grain weight by grams High 53.66
Hectoliter grain weight Medium 77.23
Biological yield Medium 946.7
Grain yield Low 233.5
Straw yield High 713.2

113
Table 5.6: Heitia genotype descriptors and means. Characteristic Description Mean
Coleoptile Anthocyanin Coloration Week
Flag leaf Anthocyanin Coloration of Auricles Weak
Frequency of plants with recurved flag leaves Medium
Glaucosity of lower side of flag leaf blade Medium
Glaucosity of spike's neck Weak
Peduncle attitude Bent
Straw pith in cross Medium
Plant growth habit Semi erect
Plant height (mean in cm) Long 96.30
Spike glaucosity Medium
Spike shape Parallel sided
Spike density Dense
Spike color Slightly colored
Spike length (mean in mm) Short 50.30
Awns color Light brown
Awns attitude Medium
Awns roughness Medium
Awns or scurs presence Awns presence
Awns length (mean in mm) Medium 83.30
Lower glume shape Medium oblong
Lower glume external hairiness Absent
Lower glume shoulder width Narrow
Lower glume shoulder shape Rounded
Lower glume peak length Very short
Lower glume peak curvate Weak
Grain color Reddish
Grain shape Moderately
elongated
Number of fertile tillers per plant Medium 3.6
Days to spike emergence Medium 118
Days to maturity Medium 164
Filling period Medium 53
Leaf rust reaction Semi susceptible 3.07
Lodging reaction Semi susceptible 3.80
Number of spikelets per spike Medium 21.57
Number of grains per spike Medium 48.73
Thousand Grain weight by grams Medium 47.81
Hectoliter grain weight Medium 77.80
Biological yield High 1087.30
Grain yield Medium 251.95
Straw yield High 835.35

114
Table 5.7: Debbiya genotype descriptors and means. Characteristic Description Mean
Coleoptile Anthocyanin Coloration Absent or very week
Flag leaf Anthocyanin Coloration of Auricles Weak
Frequency of plants with recurved flag leaves Low
Glaucosity of lower side of flag leaf blade Medium
Glaucosity of spike's neck Medium
Peduncle attitude Crooked
Straw pith in cross Medium
Plant growth habit Erect
Plant height (mean in cm) Long 95.6
Spike glaucosity Medium
Spike shape Parallel sided
Spike density Very dense
Spike color Slightly colored
Spike length (mean in mm) Very short 49.07
Awns color Light brown
Awns attitude Spreading
Awns roughness Medium
Awns or scurs presence Awns presence
Awns length (mean in mm) Medium 81.67
Lower glume shape Ovoid
Lower glume external hairiness Absent
Lower glume shoulder width Narrow
Lower glume shoulder shape Rounded
Lower glume peak length Very short
Lower glume peak curvate Weak
Grain color Reddish
Grain shape Slightly elongated
Number of fertile tillers per plant Medium 3.5
Days to spike emergence Early 109
Days to maturity Early 161
Filling period Medium 52
Leaf rust reaction Semi susceptible 3.13
Lodging reaction Semi susceptible 3.47
Number of spikelets per spike Medium 21.37
Number of grains per spike Medium 48.60
Thousand Grain weight by grams Medium 45.13
Hectoliter grain weight High 78.33
Biological yield High 1027.60
Grain yield Medium 250.42
Straw yield High 777.18

115
Table 5.8: Soori genotype descriptors and means. Characteristic Description Mean
Coleoptile Anthocyanin Coloration Medium
Flag leaf Anthocyanin Coloration of Auricles Weak
Frequency of plants with recurved flag leaves High
Glaucosity of lower side of flag leaf blade Medium
Glaucosity of spike's neck Medium
Peduncle attitude Crooked
Straw pith in cross Medium
Plant growth habit Semi erect
Plant height (mean in cm) Medium 82.80
Spike glaucosity Medium
Spike shape Parallel sided
Spike density Dense
Spike color Slightly colored
Spike length (mean in mm) Medium 74.17
Awns color Light brown
Awns attitude Oppressed
Awns roughness Medium
Awns or scurs presence Awns presence
Awns length (mean in mm) Long 103.33
Lower glume shape Medium oblong
Lower glume external hairiness Weak
Lower glume shoulder width Narrow
Lower glume shoulder shape Straight
Lower glume peak length Medium
Lower glume peak curvate Weak
Grain color Whitish
Grain shape Moderately elongated
Number of fertile tillers per plant Medium 3.46
Days to spike emergence Early 109
Days to maturity Early 162
Filling period Medium 53
Leaf rust reaction Semi susceptible 3.13
Lodging reaction Semi resistant 2.13
Number of spikelets per spike Medium 21.70
Number of grains per spike Medium 53.83
Thousand Grain weight by grams High 52.71
Hectoliter grain weight Medium 76.33
Biological yield High 1004.93
Grain yield Medium 297.95
Straw yield High 706.98

116
Table 5.9: Noorsi genotype descriptors and means. Characteristic Description Mean
Coleoptile Anthocyanin Coloration Weak
Flag leaf Anthocyanin Coloration of Auricles Weak
Frequency of plants with recurved flag leaves Medium
Glaucosity of lower side of flag leaf blade Medium
Glaucosity of spike's neck Medium
Peduncle attitude Bent
Straw pith in cross Thick
Plant growth habit Erect
Plant height (mean in cm) Very long 115.53
Spike glaucosity Medium
Spike shape Tapering
Spike density Very dense
Spike color Slightly colored
Spike length (mean in mm) Long 80.33
Awns color Deep purple
Awns attitude Oppressed
Awns roughness Rough
Awns or scurs presence Awns presence
Awns length (mean in mm) Very long 120.67
Lower glume shape Medium oblong
Lower glume external hairiness Absent
Lower glume shoulder width Narrow
Lower glume shoulder shape Rounded
Lower glume peak length Medium
Lower glume peak curvate Weak
Grain color Dark
Grain shape Strongly
elongated
Number of fertile tillers per plant Medium 3.67
Days to spike emergence Late 121
Days to maturity Late 176
Filling period Medium 55
Leaf rust reaction Semi susceptible 3.20
Lodging reaction Susceptible 4.40
Number of spikelets per spike High 23.53
Number of grains per spike Medium 49.23
Thousand Grain weight by grams High 53.23
Hectoliter grain weight High 78.53
Biological yield High 1103.40
Grain yield Low 216.63
Straw yield High 886.77
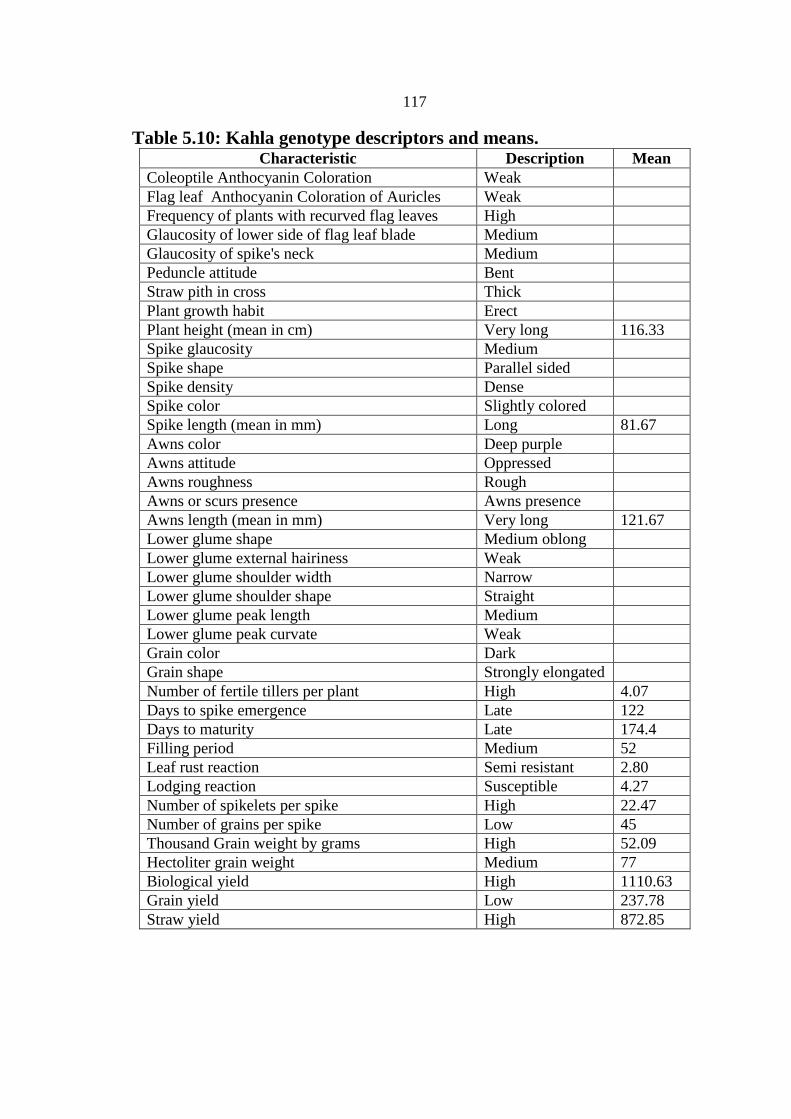
117
Table 5.10: Kahla genotype descriptors and means. Characteristic Description Mean
Coleoptile Anthocyanin Coloration Weak
Flag leaf Anthocyanin Coloration of Auricles Weak
Frequency of plants with recurved flag leaves High
Glaucosity of lower side of flag leaf blade Medium
Glaucosity of spike's neck Medium
Peduncle attitude Bent
Straw pith in cross Thick
Plant growth habit Erect
Plant height (mean in cm) Very long 116.33
Spike glaucosity Medium
Spike shape Parallel sided
Spike density Dense
Spike color Slightly colored
Spike length (mean in mm) Long 81.67
Awns color Deep purple
Awns attitude Oppressed
Awns roughness Rough
Awns or scurs presence Awns presence
Awns length (mean in mm) Very long 121.67
Lower glume shape Medium oblong
Lower glume external hairiness Weak
Lower glume shoulder width Narrow
Lower glume shoulder shape Straight
Lower glume peak length Medium
Lower glume peak curvate Weak
Grain color Dark
Grain shape Strongly elongated
Number of fertile tillers per plant High 4.07
Days to spike emergence Late 122
Days to maturity Late 174.4
Filling period Medium 52
Leaf rust reaction Semi resistant 2.80
Lodging reaction Susceptible 4.27
Number of spikelets per spike High 22.47
Number of grains per spike Low 45
Thousand Grain weight by grams High 52.09
Hectoliter grain weight Medium 77
Biological yield High 1110.63
Grain yield Low 237.78
Straw yield High 872.85
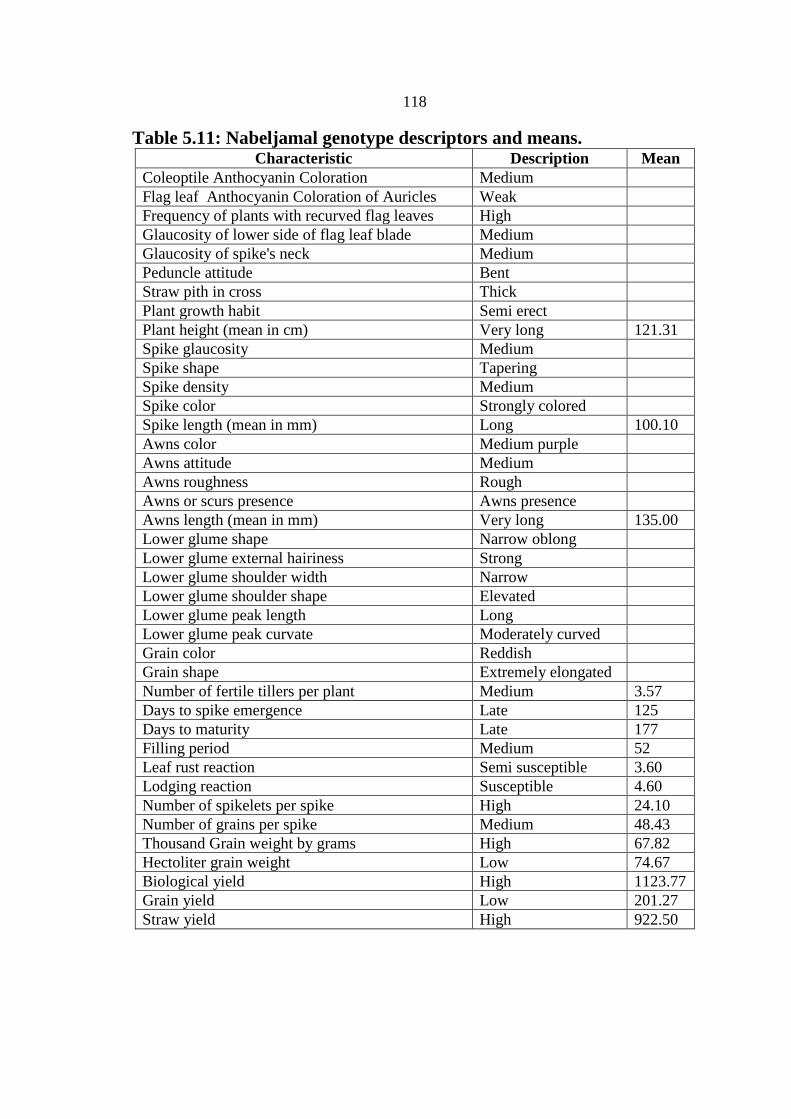
118
Table 5.11: Nabeljamal genotype descriptors and means. Characteristic Description Mean
Coleoptile Anthocyanin Coloration Medium
Flag leaf Anthocyanin Coloration of Auricles Weak
Frequency of plants with recurved flag leaves High
Glaucosity of lower side of flag leaf blade Medium
Glaucosity of spike's neck Medium
Peduncle attitude Bent
Straw pith in cross Thick
Plant growth habit Semi erect
Plant height (mean in cm) Very long 121.31
Spike glaucosity Medium
Spike shape Tapering
Spike density Medium
Spike color Strongly colored
Spike length (mean in mm) Long 100.10
Awns color Medium purple
Awns attitude Medium
Awns roughness Rough
Awns or scurs presence Awns presence
Awns length (mean in mm) Very long 135.00
Lower glume shape Narrow oblong
Lower glume external hairiness Strong
Lower glume shoulder width Narrow
Lower glume shoulder shape Elevated
Lower glume peak length Long
Lower glume peak curvate Moderately curved
Grain color Reddish
Grain shape Extremely elongated
Number of fertile tillers per plant Medium 3.57
Days to spike emergence Late 125
Days to maturity Late 177
Filling period Medium 52
Leaf rust reaction Semi susceptible 3.60
Lodging reaction Susceptible 4.60
Number of spikelets per spike High 24.10
Number of grains per spike Medium 48.43
Thousand Grain weight by grams High 67.82
Hectoliter grain weight Low 74.67
Biological yield High 1123.77
Grain yield Low 201.27
Straw yield High 922.50
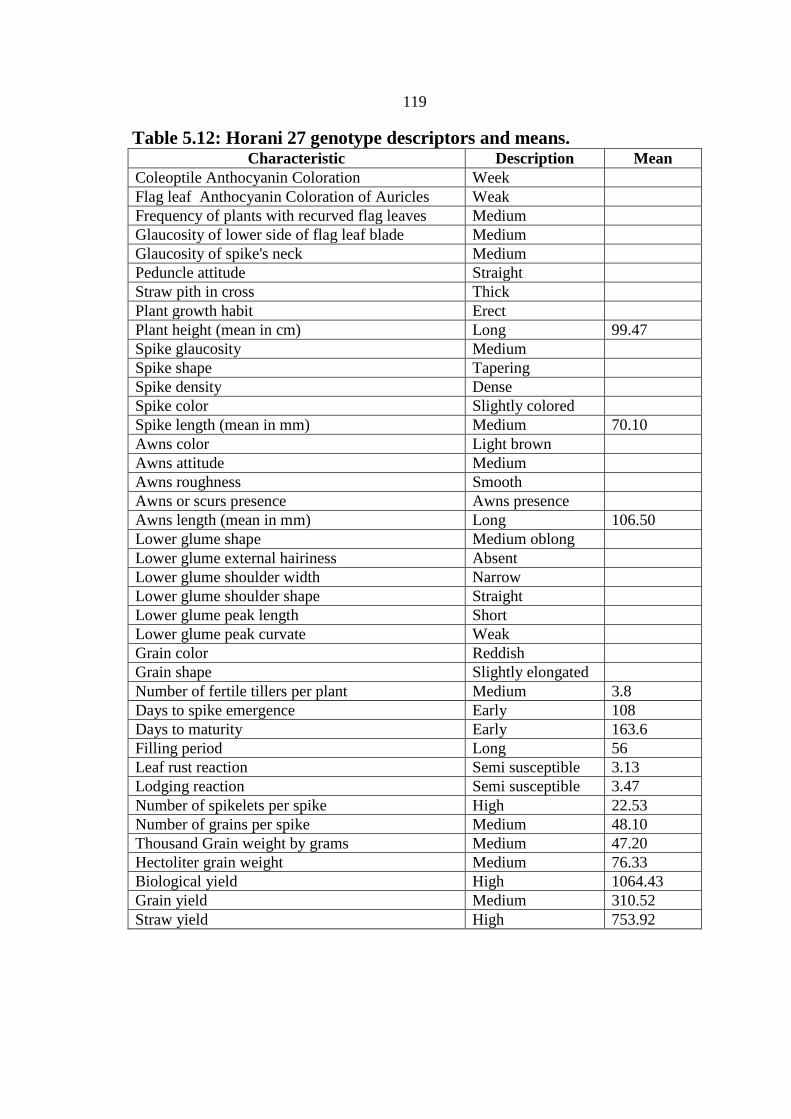
119
Table 5.12: Horani 27 genotype descriptors and means. Characteristic Description Mean
Coleoptile Anthocyanin Coloration Week
Flag leaf Anthocyanin Coloration of Auricles Weak
Frequency of plants with recurved flag leaves Medium
Glaucosity of lower side of flag leaf blade Medium
Glaucosity of spike's neck Medium
Peduncle attitude Straight
Straw pith in cross Thick
Plant growth habit Erect
Plant height (mean in cm) Long 99.47
Spike glaucosity Medium
Spike shape Tapering
Spike density Dense
Spike color Slightly colored
Spike length (mean in mm) Medium 70.10
Awns color Light brown
Awns attitude Medium
Awns roughness Smooth
Awns or scurs presence Awns presence
Awns length (mean in mm) Long 106.50
Lower glume shape Medium oblong
Lower glume external hairiness Absent
Lower glume shoulder width Narrow
Lower glume shoulder shape Straight
Lower glume peak length Short
Lower glume peak curvate Weak
Grain color Reddish
Grain shape Slightly elongated
Number of fertile tillers per plant Medium 3.8
Days to spike emergence Early 108
Days to maturity Early 163.6
Filling period Long 56
Leaf rust reaction Semi susceptible 3.13
Lodging reaction Semi susceptible 3.47
Number of spikelets per spike High 22.53
Number of grains per spike Medium 48.10
Thousand Grain weight by grams Medium 47.20
Hectoliter grain weight Medium 76.33
Biological yield High 1064.43
Grain yield Medium 310.52
Straw yield High 753.92

120
Table 5.13: Numra 8 genotype descriptors and means. Characteristic Description Mean
Coleoptile Anthocyanin Coloration Strong
Flag leaf Anthocyanin Coloration of Auricles Weak
Frequency of plants with recurved flag leaves Medium
Glaucosity of lower side of flag leaf blade Medium
Glaucosity of spike's neck Medium
Peduncle attitude Bent
Straw pith in cross Thick
Plant growth habit Semi erect
Plant height (mean in cm) Medium 84.89
Spike glaucosity Medium
Spike shape Tapering
Spike density Dense
Spike color White
Spike length (mean in mm) Medium 75.40
Awns color White
Awns attitude Medium
Awns roughness Smooth
Awns or scurs presence Awns presence
Awns length (mean in mm) Long 113.33
Lower glume shape Narrow oblong
Lower glume external hairiness Absent
Lower glume shoulder width Narrow
Lower glume shoulder shape Elevated
Lower glume peak length Longt
Lower glume peak curvate Weak
Grain color Whitish
Grain shape Strongly elongated
Number of fertile tillers per plant Medium 3.7
Days to spike emergence Early 109
Days to maturity Early 163
Filling period Medium 55
Leaf rust reaction Semi resistant 2.73
Lodging reaction Semi resistant 2.33
Number of spikelets per spike Medium 22
Number of grains per spike Medium 53.83
Thousand Grain weight by grams High 50.56
Hectoliter grain weight Medium 76.33
Biological yield Medium 940.47
Grain yield Medium 314.53
Straw yield Medium 625.93

121
Table 5.14: Cham 5 genotype descriptors and means. Characteristic Description Mean
Coleoptile Anthocyanin Coloration Weak
Flag leaf Anthocyanin Coloration of Auricles Medium
Frequency of plants with recurved flag leaves High
Glaucosity of lower side of flag leaf blade Medium
Glaucosity of spike's neck Strong
Peduncle attitude Bent
Straw pith in cross Medium
Plant growth habit Semi erect
Plant height (mean in cm) Medium 85.23
Spike glaucosity Strong
Spike shape Tapering
Spike density Dense
Spike color White
Spike length (mean in mm) Medium 75.23
Awns color White
Awns attitude Oppressed
Awns roughness Smooth
Awns or scurs presence Awns presence
Awns length (mean in mm) Long 116.67
Lower glume shape Medium oblong
Lower glume external hairiness Absent
Lower glume shoulder width Narrow
Lower glume shoulder shape Elevated
Lower glume peak length Long
Lower glume peak curvate Weak
Grain color Whitish
Grain shape Strongly elongated
Number of fertile tillers per plant Medium 3.83
Days to spike emergence Early 108
Days to maturity Early 160
Filling period Medium 52
Leaf rust reaction Semi resistant 2.87
Lodging reaction Semi resistant 2.07
Number of spikelets per spike Medium 21.27
Number of grains per spike Medium 50.97
Thousand Grain weight by grams Medium 47.50
Hectoliter grain weight Medium 76.33
Biological yield Medium 995.20
Grain yield High 350.21
Straw yield Medium 644.99

122
Table 5.15: Anbar genotype descriptors and means. Characteristic Description Mean
Coleoptile Anthocyanin Coloration Strong
Flag leaf Anthocyanin Coloration of Auricles Weak
Frequency of plants with recurved flag leaves High
Glaucosity of lower side of flag leaf blade Medium
Glaucosity of spike's neck Medium
Peduncle attitude Bent
Straw pith in cross Medium
Plant growth habit Semi erect
Plant height (mean in cm) Medium 83.36
Spike glaucosity Medium
Spike shape Tapering
Spike density Dense
Spike color Strongly colored
Spike length (mean in mm) Medium 79.43
Awns color Medium purple
Awns attitude Spreading
Awns roughness Medium
Awns or scurs presence Awns presence
Awns length (mean in mm) Long 111.33
Lower glume shape Medium oblong
Lower glume external hairiness Medium
Lower glume shoulder width Narrow
Lower glume shoulder shape Elevated
Lower glume peak length Short
Lower glume peak curvate Weak
Grain color Reddish
Grain shape Strongly elongated
Number of fertile tillers per plant High 4.1
Days to spike emergence Early 108
Days to maturity Early 163
Filling period Long 56
Leaf rust reaction Semi resistant 2.87
Lodging reaction Semi resistant 2.13
Number of spikelets per spike Medium 21.97
Number of grains per spike High 56.07
Thousand Grain weight by grams High 53.08
Hectoliter grain weight Medium 76.33
Biological yield Medium 989.47
Grain yield High 355.11
Straw yield Medium 634.36
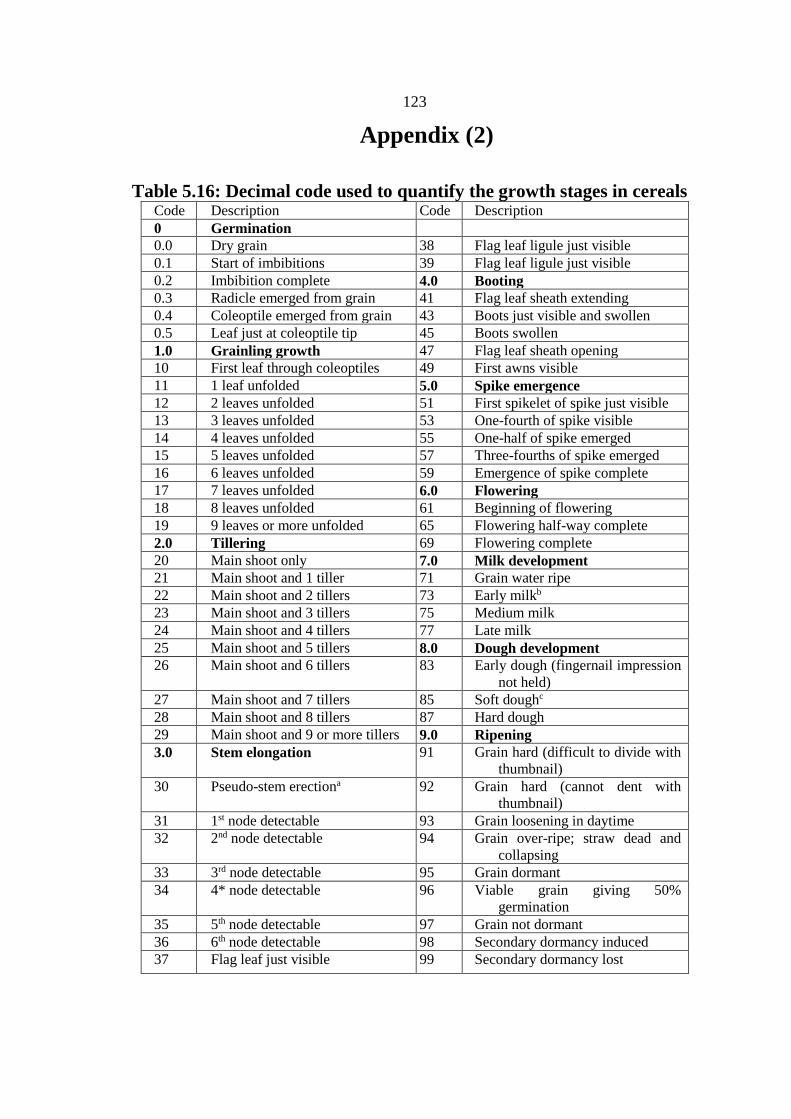
123
Appendix (2)
Table 5.16: Decimal code used to quantify the growth stages in cereals Code Description Code Description
0 Germination
0.0 Dry grain 38 Flag leaf ligule just visible
0.1 Start of imbibitions 39 Flag leaf ligule just visible
0.2 Imbibition complete 4.0 Booting
0.3 Radicle emerged from grain 41 Flag leaf sheath extending
0.4 Coleoptile emerged from grain 43 Boots just visible and swollen
0.5 Leaf just at coleoptile tip 45 Boots swollen
1.0 Grainling growth 47 Flag leaf sheath opening
10 First leaf through coleoptiles 49 First awns visible
11 1 leaf unfolded 5.0 Spike emergence
12 2 leaves unfolded 51 First spikelet of spike just visible
13 3 leaves unfolded 53 One-fourth of spike visible
14 4 leaves unfolded 55 One-half of spike emerged
15 5 leaves unfolded 57 Three-fourths of spike emerged
16 6 leaves unfolded 59 Emergence of spike complete
17 7 leaves unfolded 6.0 Flowering
18 8 leaves unfolded 61 Beginning of flowering
19 9 leaves or more unfolded 65 Flowering half-way complete
2.0 Tillering 69 Flowering complete
20 Main shoot only 7.0 Milk development
21 Main shoot and 1 tiller 71 Grain water ripe
22 Main shoot and 2 tillers 73 Early milkb
23 Main shoot and 3 tillers 75 Medium milk
24 Main shoot and 4 tillers 77 Late milk
25 Main shoot and 5 tillers 8.0 Dough development
26 Main shoot and 6 tillers 83 Early dough (fingernail impression
not held)
27 Main shoot and 7 tillers 85 Soft doughc
28 Main shoot and 8 tillers 87 Hard dough
29 Main shoot and 9 or more tillers 9.0 Ripening
3.0 Stem elongation 91 Grain hard (difficult to divide with
thumbnail)
30 Pseudo-stem erectiona 92 Grain hard (cannot dent with
thumbnail)
31 1st node detectable 93 Grain loosening in daytime
32 2nd node detectable 94 Grain over-ripe; straw dead and
collapsing
33 3rd node detectable 95 Grain dormant
34 4* node detectable 96 Viable grain giving 50%
germination
35 5th node detectable 97 Grain not dormant
36 6th node detectable 98 Secondary dormancy induced
37 Flag leaf just visible 99 Secondary dormancy lost
2015
ب
002222
63145
60
0285

ت
0260026302630264
60658
622


![Arbitration & Conciliation Act, 1996 - Indian Institute of ... · THE ARBITRATION AND CONCILIATION ACT, 1996 No.26 of 1996 [16th August, 1996] [As Amended by the Arbitration & Conciliation](https://static.fdocuments.us/doc/165x107/5b51d60a7f8b9a7b648c87e5/arbitration-conciliation-act-1996-indian-institute-of-the-arbitration.jpg)