![Classification of Merged AVHRR and SMMR Arctic Data with ... · Classification of Merged AVHRR and SMMR Arctic Data with Neural Networks J. Key, ]. A. Maslanik, and A. ]. Schweiger](https://static.fdocuments.us/doc/165x107/5ec493230b627b05912917e5/classification-of-merged-avhrr-and-smmr-arctic-data-with-classification-of-merged.jpg)
Variations in snowpack m.elt on the Greenland ice sheet ......1400 km for SSM/I vs 700 km for SMMR),...
10
J ournal oJ Glaciology, Vol . 41 , No . 137, 1995 Variations in snowpack m.elt on the Greenland ice sheet based on passive - m.icrowave m.easurelDents THOMAS L. MOTE DejJart ment of Ge og ra ph y, Uni ve rsilJ' oJ Ge orgia , Athens, GA 30602-250 2, U.s.A. MARK R. AND ER SON Prog ra m in Ni ete oro logy /Climatology , D ejJartment of Ge ograph y , Unive rsity of .'Vebra ska Lincoln , L incoln, NE 68588-01 35, U.S .A. ABSTRACT. A simple microwa ve -emlSS lOn model is used to simulate 37 GH z brightn ess te mp eratur es associated with snow p ac k-melt co nditions for loca ti ons ac ross th e Gr eenland ice sheet. Th e simulat ed va lu es a re utili ze d as thr es hold va lues and co mpared to da il y, gridd ed SMMR and SSM /I passi ve -microwave data, in o rd er to reveal region .. experiencing melt. Th e spa ti al exte nt of th e ar ea cl ass ifi ed as me ltin g is examined on a dail y, monthly and seasonal (M ay- August) basis for 1979 9 1. Th e typi cal seasonal cy cl e of melt coverage shows melt beg inning in late April, a rapid increase in th e melting area from mid-May to mid-July, a rapid d ec rease in melt ex tent from late Jul y throu gh mid-Au gust, a nd cessa ti on of melt in late Se pt e mb e r. Seasonal averages of the da il y melt exte nt s de mon strat e an a pp are nt increase in melt cove rage over the 13 ye ar pe ri od of appr oximately 3 .8 % a nnu ally (signilica nt at the 95% confidence interval). Thi s in crease is dominated by sta ti sti ca ll y sig nifi ca nt pos iti ve tr e nd s in melt co ver age durin g Jul y a nd Au gust in the west and so uthw e t of the ice shee t. 'V e lind that a linea r correla ti on between mi crowa \'e -d e ri ved melt extent a nd a s urf ace meas ur e of a bl a ti on rate is signili ca nt inJun e a nd Jul y but not Au gust, so caution mu. t be exercise d in using the mic row ave-derived melt extents in Au gus t. Nevertheless, kno wl edge of the va ri ability of sn ow p ac k melt on th e Gr ee nl and ice sheet a deri ve d from microwave data should prove usc ful in dctecting climate change in the Arc ti c and exa minin g the imp act of climate change on th e ice shee t. INTRODUCTI ON Scientilic int er es t in the m ag nitud e of melting on the Gr ee nland and Antar c ti c ice sheets has grown along with concern ab o ut the potential effects of climate change. In partic ul ar, increased melting in a warmer climate may lead to ri. ing sea levels (Bind schadler, 1985; Peltier and Tu shingham, 1989). However, Zw a ll y ( 198 9) fo und that th e a bl ation and accumula ti on zon es of the Gr eenland ice sheet thickened between 1978 and 198 5, as determined fr om ra dar- altimetry d ata , a nd suggested th e change might be a produ ct of increased accumula ti on associated with a wa rm er climate. Thi s r eas oning al so suggests that increased melting should be associated with, but more than omet by, the inCl'eased acc umulation. In co ntr as t, Braithwaite a nd others (1992) u se d stake obser va tions at thr ee locations near the margin of the ice sheet to argue that thicke nin g in the a bl a ti on zo ne was du e to decreased ablation, prim a ril y fr om decreased melting. is acco mpli. hed onl y at a few iso la ted sta ti ons or by int e rpr eta ti on of sha ll ow-i ce-core records that are widely sca tt ered. Satellite remote se nsin g offers a me an s of ac quirin g a spatially and temp ora ll y deta il ed rec ord of sno wp ack-melt occ urr ences . Passive-microwave re mot e sensing is es pec ially suited to meas urin g melt occ urr ences du e to the rapid change in microwave emi ss ion of a Th e qu es ti on of how th e ice sheet responds to va ri a ti ons in climate, and poten tial climate change, can be a ddr essed at least pa rti a ll y by exa minin g the va ri a ti ons in snowpack mel t. U nf ortunately, identilic- a ti on of snowp ac k-melt even ts on the Gree nl and ice sheet n ow pack in res ponse to th e intr odu ction of even a sma ll amo unt ofliquid water. Microwave emi ss ion, as desc rib ed by a blackbody-e quiv alcnt radiometric temperatur e ca ll ed a brig htn ess t e mp era tur e (TB), exhibi ts a di stinct increase at fr eq uencies grea ter th an 10 GH z durin g sn ow pack melt in th e ' Ves t Gr eenla nd perco lation zo ne (Thom as and other s, 1985). This in crease in TB sta nd s in sha rp contr as t to th e lower TB observed during non-m elt co nditi ons (Gl oersen and others, 1974) due to int e rn al sca tt ering within th e snowpack ( Zwa ll y, 1977 ) . Th e emi ss ivit y of snow changes ra pidl y with melt du e to a n in crease in the liq uid-water co nt e nt of the snow. Beca u se of th e high di electric constan t of liq uid water compar ed to that of air and ice, melt strongly aflects the dielectric consta nt of th e ice- a ir- wat er mix tur e (Ulaby and o th ers, 1986). Th e in cr ease in th e di electric constant raises the ab so rpti vity a nd , acco rding to Kir cho fT' s law, th e 51 Downloaded from https://www.cambridge.org/core. 10 Aug 2020 at 06:07:38, subject to the Cambridge Core terms of use.
Transcript of Variations in snowpack m.elt on the Greenland ice sheet ......1400 km for SSM/I vs 700 km for SMMR),...
J ournal oJ Glaciology, Vol. 41, No . 137, 1995
Variations in snowpack m.elt on the Greenland ice sheet based on passive-m.icrowave m.easurelDents
THOMAS L. MOTE
DejJartment of Geography , UniversilJ' oJ Georgia, Athens, GA 30602-2502, U.s.A .
MARK R. A ND ER SON
Program in Ni eteorology/Climatology, DejJartment of Geography , University of .'Vebraska Lincoln, L incoln, N E 68588-0135, U.S.A.
ABSTRACT. A simple microwave-emlSSlOn model is used to simula te 37 GHz brightness tempera tures associa ted with snow pack-melt conditions for locations ac ross the Greenla nd ice sheet. The simulated va lu es a re utilized as threshold values a nd compared to d a il y, gridd ed SMMR and SSM/I passive-microwa ve da ta, in order to reveal reg ion .. experiencing melt. The spa ti a l ex tent of the a rea cl ass ifi ed as melting is examined o n a daily, monthl y and seasonal (M ay- August) basis for 1979 9 1. Th e typical seasona l cycle of melt coverage shows melt beginning in la te April , a ra pid increase in the melting a rea from mid-May to mid-July, a ra pid dec rease in melt ex tent from la te July through mid-August, a nd cessation of melt in late September. Seasonal ave rages of the da il y melt extents demonstrate an a ppa rent increase in melt coverage ove r the 13 year period of approxim a tely 3.8 % annu ally (signili cant a t the 95% confid ence interval) . This increase is d omina ted by sta tisti call y signifi ca nt positive trends in melt coverage during Jul y a nd August in th e west and southwe t of the ice shee t. 'Ve lind th a t a linea r co rrela ti on be tween microwa\'e-deri ved melt ex tent a nd a surface measure of a bla tion ra te is signili cant inJune a nd Jul y but not Aug ust, so caution mu. t be exercised in using the microwave-derived melt extents in Aug ust. Nevertheless, kn owledge of th e va ri ability of snow pack melt on the Greenland ice shee t a deri ved from microwave d a ta should prove uscful in dctecting clima te change in the Arctic and examining the impac t of clima te cha nge on th e ice shee t.
INTRODUCTION
Scientili c interest in the magnitude of melting on the Greenland a nd Antarcti c ice shee ts has grown a long with concern about the potenti a l effec ts of clima te cha nge. In pa rticul a r, increased melting in a warmer clim a te may lead to ri. ing sea levels (Bindschadl er, 1985; Peltier and Tushingham, 1989). H owever, Zwall y (1989) found tha t th e abla tion a nd acc umula tion zo nes of the Greenland ice shee t thickened between 1978 a nd 1985, as determined from radar-a ltimetry data , a nd sugges ted the change might be a product of increased acc umula tion associated with a wa rmer clima te. This reasoning a lso sugges ts tha t increased m elting should be associa ted with , but more th an om et by, the inCl'eased accumulation. In contras t, Braithwaite a nd others (1992) used stake observa tions a t three locations near the ma rgin of the ice shee t to a rgue th a t thickening in the abl a ti on zone was du e to decreased ablation, prima ril y from dec reased melting.
is accompli. hed onl y a t a few iso la ted sta ti ons or by interpreta tion of sha llow-ice-core records tha t a re wid ely sca ttered. Sa tellite remote sensing offers a means of acquiring a spa tia lly a nd temporall y detail ed record of snowpack-melt occurrences. Passive-microwave remote se nsing is es pecially suited to meas uring melt occurrences du e to the rapid cha nge in microwave emiss ion o f a
Th e ques ti on of how th e ice shee t res ponds to
vari a tions in clima te, and po ten tia l climate cha nge, can be addressed a t leas t p a rti a ll y by examinin g th e vari a ti ons in snowpack mel t. U nfortuna tely, id entili ca tion of snowpack-melt even ts on the Greenl a nd ice shee t
nowpack in response to the introduction of even a sm all a mo unt ofliquid wa ter. Microwave emission, as described by a blackbod y-equivalcnt radi o m etri c temperature ca lled a brightness tempera ture (TB) , exhibi ts a distinct in crease a t freq uencies grea ter th a n 10 GHz during snowpack melt in the 'Vest Greenl a nd percola tion zone (Thomas and o thers, 1985). This increase in TB sta nds in sha rp contras t to the lower TB observed during non-melt conditions (Gloe rsen and others, 1974) due to intern al sca ttering within the snowpack (Zwall y, 1977) . The emissivity of snow ch anges rapidly with melt due to a n increase in the liq uid-wa ter content o f the snow. Because of the high dielectri c constan t of liq uid wa ter compared to
th a t of air and ice, melt strong ly aflec ts the di elec tri c consta nt of th e ice- a ir- water mix ture (Ulaby and o thers, 1986) . The increase in the di electri c constant ra ises th e abso rpti vity a nd , acco rding to KirchofT' s la w, th e
51 Downloaded from https://www.cambridge.org/core. 10 Aug 2020 at 06:07:38, subject to the Cambridge Core terms of use.
J ournal of Glaciolog)l
emissivity. The result is an increase in absorption rela ti ve to volume sca ttering, which reduces the sca ttering albedo and enhances emission (Cha ng a nd others, 1976, 1985; Fos ter and others, 1984).
This cha nge in TB with melt is frequency-dependent. Below approxima tely 10 GHz, a spec tral region where volume scattering is small compa red to surface sca ttering, the TB decreases with increasing liquid-wa ter content; near 10 GH z, the TB is nea rly insensitive to liquid-water content (U laby and others, 1986). The TB becomes increasingly sensitive to wa ter content at higher frequencies. The frequency dependence of the TB on liq uid -water content has been used to identify the onset of melt in the seasonal snowpack. Kunzi a nd others (1982 ) fo und the 37 GHz TB to be lower than the 18 GHz TB of dry snow, but the two values are nearly equ al for wet snow. Other in ves tiga tors h ave relied on the increase in brightness temperatures a t high frequ encies (37 GHz) to identify melt a nd qua ntify the liq uid-wate r content of the snowpack (e.g. Sti les and U la by, 1980).
Although snow density, tempera ture, crys ta l structure a nd crysta l size a ll co n lri b u le to the snowp ack's emissivity, cha nges in the liq uid-wa ter content produce the mos t prominent changes in TB. For example, snow with 2% liquid-water content m ay produce a 37 GHz TB more than 100 deg higher tha n dry snow (Hofer and M a tzler, 1980). The increase in TB with melt was used to map regions of the Greenland ice sheet experiencing melt during a peri od of intense warming in 1989 (M ote and others, 1993 ). As a continua tion of that research , we use the increase in TB at 37 GHz to quantify the ex ten t and frequency of melt on the Greenla nd ice shee t during the period 1979- 9 1.
SATELLITE MICROWAVE DATA
Measurements of snowpack melt were made using data obtained from two satellite microwave radiometers, the Nimbus-7 Scanning Multichannel Microwave R adiometer (SMYlR ) and the Defense Meteoro logical Satellite Program (DMSP) Special Sensor Microwave/Imager (SSM/I ). The SMMR recorded radiation every other day in ten channels (Gloersen and H ardis, 1978), including both polarizations for 6.6, 10.7, 18.0, 21.0 and 37.0 GHz, from October 1978 to August 198 7. The SSM/I, which began operation in July 1987, records radia tion daily in seven channels, the vertical polariza tion for 22.2 GHz and both polarizations for 19.35, 37.0 and 85.5 GHz (Hollinger and others, 1987). The 37 GHz, horizontally polari zed (37H) channel was used for this research due to the great sensi tivi ty of tha t cha nnel to changes in snowpack liquid-wa ter content. Additionally, the 37H channel had the smallest rela tive calibra tion difference between the two sensors, which facilitates merging the two da ta se ts 0 ezek and others, 199 1).
T he two sensors differ in view a ngle (50. 3° for SMMR vs 53. I ° for SSM/I), radiometric resolution a nd calibra tion. Due to a change in swa th wid th (approximately 1400 km for SSM/I vs 700 km for SMMR), the number of da il y overpasses of a given loca tion is greater for the SSM/ I than for the SMMR. A sys tem a tic difference in SMMR and SSM/I brightness tempera tures is primarily due to the difIerence in cali bra tion of the two sensors U ezek and
52
others, 199 1). A linea r regresslOn of the brigh tness temp era tures was used to remove this sys tem a tic difference. The regression was performed using daily, gridded SSM/I and SMMR brightness temperatures for locations north of 70° N and a t eleva tions greater tha n 2700 m a.s .l. This region, which a pproximates the drysnow zone of the ice sheet, was selected to avoid the influence of melt on the regression. D a ta for 20 d between I I Ju ly and 20 Aug ust 198 7, the period when both sensors we re operating concurrentl y, were included in th e regression. The res ul ting equation for the 37H cha nnel (r2 = 0. 97) is:
TB,SSl\ll = 1.084TB.SMMR - 10.81 (1)
where TB.Sl\IMR is the SMMR brightness temperature (K ) a nd TB,SSMI is the SSM /I brightness temperature (K ). All SMNIR brightness tempera tures were converted to equivalent SSM/I brightness tempera tures using this regression equation.
The SMMR and SSM/I data were obtained from the Na tional Snow and I ce Data Center (NSIDC) archive of brightness-tempera ture grids. The orbital da ta were interpola ted onto a 25 km x 25 km grid on a pola r stereographic proj ection. Any da ta sample loca ted within a given grid cell on a given d ay, beginning a t 0 Coordinated Universal Time (UTC), was averaged into the d aily value for tha t grid cell (NSIDC, 1992). Grid cells with missing d a ta were fill ed b y spatially averaging the g rid cells immediately adjacent. Seven days tha t are included in the NSIDC archi ve were elimina ted from the a nalysis because of missing swaths of d a ta.
A la nd mas k was digitized from the Quaternary ma p of Greenland published by The G eological Survey of G reenland. This m ask was used in conjunction with both the SMMR and SSM/I water and coastline masks to elimina te any grid cells not covered b y a t least 50 % ice or with a ny permanently standing wa ter. The unmasked grid cells availa ble for analysis covered a total a rea of I 648 125 km2, including parts of ice caps separa te from thc ice shee t. The ice shee t covers approxima tely I 701 000 km2 and ice caps cover a nother 65000 km2
(W eidick, 1985 ). Between 7% and 12% of the ice sheet a nd ice caps is removed from the a nalysis by the masking process.
MICROWAVE EMISSION OF MELTING SNOW
A simpl e microwave-emission mod el was employed to d e termine the 37H TB associa ted with snow cover containing a given volumetric water content (mv) for each grid cell on the Greenland ice sheet. Because TB increases with increasing my, a simula ted TB can be used as a threshold valu e to id enti fy the occurren ce of snowpack melt with microwave da ta . Given the lack of d a ta on snow g ra in-size and d ensity necessary for calcula tion of sca ttering coeffi cients, a semi-empirical a pproach was taken in which the emission model was first in verted under non-melt conditions to derive sca ttering coeffi cients. U la by a nd Stiles (1980 ) give the brightness tempera ture (Tsi) produced by the i th snow layer of thickness di as:
Downloaded from https://www.cambridge.org/core. 10 Aug 2020 at 06:07:38, subject to the Cambridge Core terms of use.

TSi = Ti fo dipi<i see e'i
exp [-( I\;~i + I\;~J pi( di - h) see e'd dh (2)
where T j is the thermometric tempera ture of layer i (K ), I\;~i is the m ass a bsorption coefficient (kg- 1m3 ) , I\;~i is the m ass sca ttering coefficient (kg- 1m 3 ) , e'i is the propaga tion angle, h is the depth in the i th laye r (m ), and Pi is t he density (kg m - 3 ) . The integra l can b e solved a n alyticall y a nd expanded for multiple snow layers, ig noring diffuse scatter a nd multi ple refl ec tio n s at bounda ry layers, to determine th e brightness temperature at the sur face of the snowp ack (T'B ) (Abdelrazik a nd o thers, 198 1). Th e TB detected by the a tellite senso r is th e sum of T'B, up welling sky radi a ti on , r efl ec ted d ownwelling sky radia tion, a nd the refl ec ted eml SSlOn from free space, a nd is found by:
T B = T'Be- Tsec8 + T s).,y + (1 - €)Tskye -TSec8
+ (1 - E)T spe- 2Tsec 8 (3)
where Tsky is th e sky brightness tempera ture a t 37 GHz (25 K), T sp is th e averaged brigh tness tempera ture of free sp ace (3 K ), T is the a tmospheric loss fac tor a t 37 GHz (0.05 ), e is the sensor view a ngle, and E is the bulk emiss ivity of the sn owpack.
The increase in microwave emission of snow und ergoing melt is associa ted with a n in crease in the a bsorption coeffi cient. The refo re, the a bso rptio n coeffi cient must be calcula ted und e r spring pre-me lt a nd summe r-m elt condi tion. The a bso rpti on coeffi c ien t can be found b y:
where I\;a is the a bsorption coe ffi cient (m- I ), A is the wavelength (m ), k's is the real p a rt of the dielectri c cons tan t of snow , a nd k" s is the im agina ry pa rt of the dielec tric consta nt.
The complex di electric consta nt of snow was calcula ted using a dielec tric mixing m odel from Tinga a nd others (1973), which has been used to determine the dielectric pro perti es of snow undergoing melt (Tiuri a nd Schultz, 1980). The complex di electri c constant can be fo und by:
ks = 3 [a(7'w/ Ta)3(kw - 1)
- b(Ti/ra )3(2kw + 1)]
/ [a(2 + kw) - 2b(ri/rw)3(kw - 1)
- a(rw/Ta)3(kw - 1) + bh/ra)3
(2 kw + 1)] + 1 a = 2kw + ki
b = kw-ki
_. [ 0.92mv/ps ]~ Tw - r , 1 + ( / ) 1 - mv Ps
- [0.92] ~ [ mv/ps ]k Ta - ri -- 1 + - -"--'--';-Ps 1 - mv/ Ps
(5)
(6) (7)
(8)
(9)
where ks is the complex dielectric cons ta n t of snow , kw is
NIote and Anderson: Snowpack melt on the Greenland ice sheet
the complex dielectri c consta nt of wate r, ki is the complex dielec tric constan t o f ice, ri is the radi us of ice particles (m ) , ra i the radius o f a ir pockets (m ) , r w is the radius of water-covered ice p a rticl es (m), mv is th e volumetric wa ter content, and Ps is the density o f snow (kg m- 3
) .
Smoo th boundaries b e tween snow layers a nd a t the snowair bound ary were ass um ed, a nd th e transmissio n coeffi cients a t each bo und a ry were calcula ted by:
(10)
where Ts is the power tra nsmiSSIon coeffi cient, Eb is th e rela tive d ielectric of th e und erl ying layer, Et is the relative di electric of the overly ing layer, and et is the propaga tio n a ng le .
The model was first inverted und er spring condi ti o ns to calcula te sca ttering coeffi cients fo r each yea r. Sca tte ring coeffi cien ts we re es timated for indi vidual years to acco unt fo r diffe r e n ces in th e a m o un t of winter accumula tion, which m ay a ffect the sca ttcring properti es of th e snow. Observed brightness tem peratures we re averaged for a peri od before the onse t of summer m elt and used in the mod el to calculate sca ttering coeffi cients. The o bse rved brightness temperatures we re averaged fo r a period in each year when the tempera ture profile is ass umed to have been n earl y iso therma l, a nd just prio r to the o nset of melt. This a llows estima ted l a m tempe ra tures to be used to a pproxima te the tempera ture th ro ug ho ut the snow pack. Based o n these criteri a , th e first 15 d of April were selected as th e m os t app ropria te peri od fo r using the observed brigh tness tempera tures to es tim ate scattering coeffi c ients.
Th e 10 m snowpack tem perature fo r each grid ce ll was es tima ted from a third-o rder regressio n eq uation based o n la titud e, longitud e a nd eleva tion (Budd and others, 1982) . Eleva tion d a La were from th e radar altime ter a board ERS-I (person a l communica tio n from S. Ekholm, 1993) a nd from the Seasat radar a ltime ter (Bindschadler a nd o thers, 1989).
Absorpti on coeffi c ients were based o n a snow pack density of 480 kg m 3
, typ ica l condi ti o ns for the top m eter of m od era tely packed snow (Zwall y, 1977), and a m ean gra in-size of 0.5 mm, w hi ch is appropria te for fin e-gra ined snow (S tephenson, 1967 ) . Changing th e g rain-size d oes no t stro ngly affect the simula ted brightn ess tempera tures. The sp atial vari a tion in grain-size sh o uld be accounted for by the empiricall y d eri ved sca ttering coeffi cients.
Using the empirica ll y deri ved sca ttering coeffi cients, summe r-melt conditio n s were simula ted by the addition of I % liquid wa ter to the top Im of th e snowpack. Th e I % value was chosen becau e it is near the lower limit o f the radiometer 's sen siti vity to cha nges in wa ter con te n t (Stiles a nd U laby, 1980). The therm o m e tri c tempera tu re of the top J m was ass umed to be 273 K. The model d oes no t account for changes in the scatterin g coeffi cient du e to grain g rowth associa ted with th e freeze- th aw m e tamorphism of melt. E s tima ted ra tes of g ra in growth we re initia ll y incorporated into the mod el, and a lin ear increase in the sca tte ring coeffi cient w ith grain growth was ass umed, as sugges ted by R otma n a nd others (1982 ),
53 Downloaded from https://www.cambridge.org/core. 10 Aug 2020 at 06:07:38, subject to the Cambridge Core terms of use.
J ournal of Claciology
but these cha nges had little effec t on the simula ted-melt TB. Because of the limited knowledge of grain-size distributions on the ice hee t , the re ults presented here do not include a correc tion to the ca ttering coeffi cient [or grain growth .
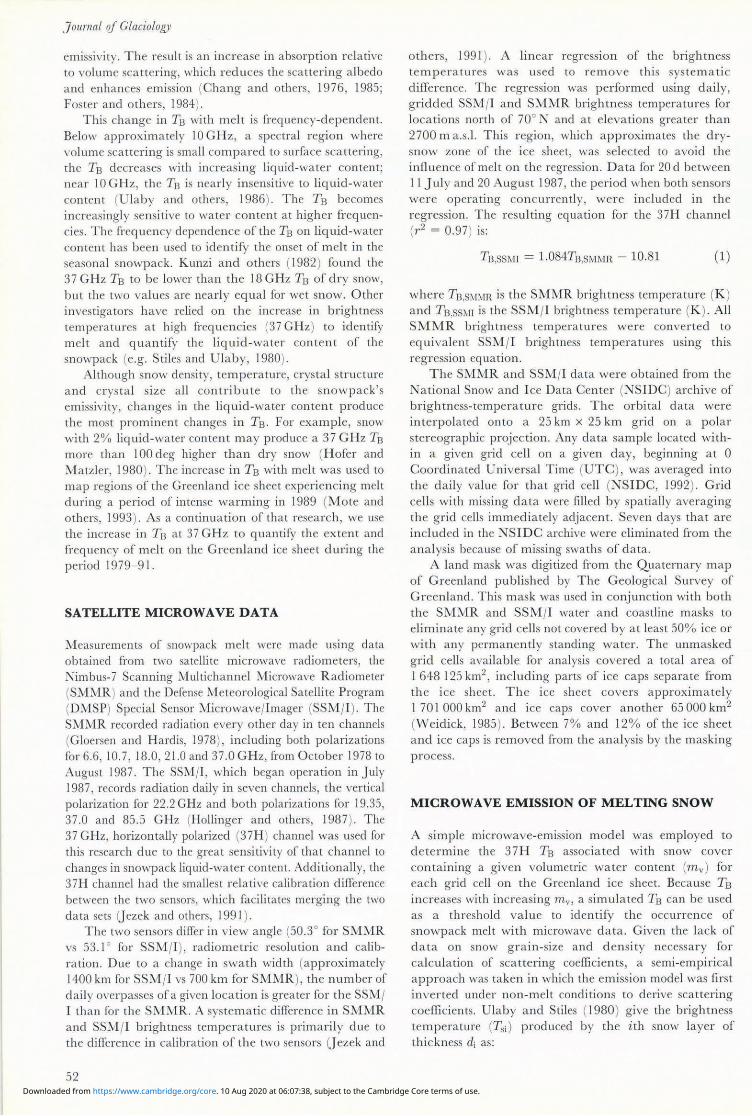
A map of the mean simul a ted-melt brightness tempera tures for the 13 yea rs (Fig . I ) generall y resembles that of th e mean-emissivity map fo r Apri l (Fig. 2) . The emissivity ma p was produced from obse rved April brightness tempera tures and 10 m snowpack temper a tures USll1g the R ay leig h-J eans approxima tion, which sta tes:
(11)
where E is the emissivity, a nd T is th e thermometric tempera ture. The rela tionships between the simulatedmelt TB and both the observed April T B and April emissivi ty a re not li near. The rela ti vely warm underlying snowpack in the southwes t results in simulated -melt TB higher tha n wou ld be exp ected from a simple linear rela ti onship with the April emissivity. Conve rsely, the
54
Fig. 1. M ean values of the simulated 37 CH;:: brightness temperatures associated with summer-melt conditions for each year 1979- 91. The brightness temperatures for each year are calculated fro m a simjJle microwave-emission model of the snowjJack with 1 % Liquid-water content.
40W
Fig. 2. AlIean April microwave emissivities at 37 CH;: determined from observed AjHil brightness temperatures and estimated 10 111 fi1'll temperatures .
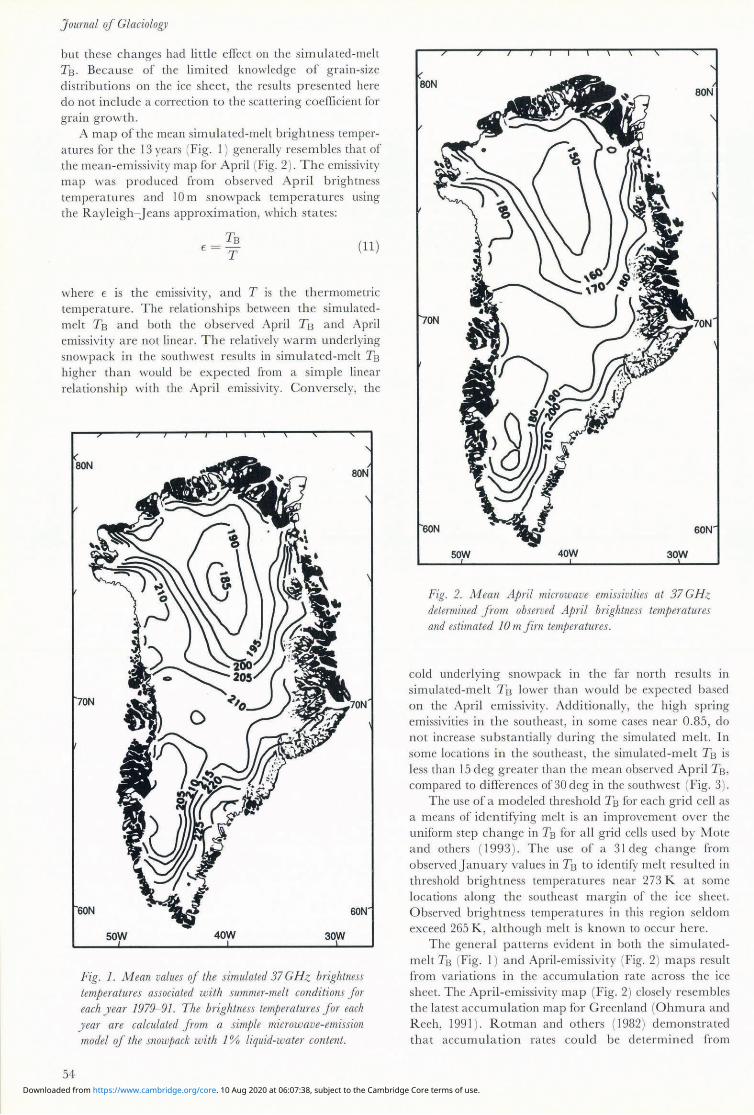
cold underlying snowpack in the fa r north results in simula ted-melt T B lower tha n wo uld be expected based on the April emissivity. Additiona lly, the high spring emissivities in th e southeas t, in some cases nea r 0 .85, do not increase substa nti a lly during the simula ted m elt. In some loca tions in the southeas t, the simula ted-melt TB is less than 15 deg grea ter than the m ean observed April TB, compared to differences 0[ 30deg in the southwes t (Fig. 3).
The use of a modeled threshold TB for each grid cell as a means of id entifying melt is a n improvement over the uniform step change in TB for a ll g rid cells used by M OLe a nd others (1993). The use of a 31 deg cha nge from o bserved January values in TB to identify melt resulted in threshold brightness tempera tures near 273 K a t some loca tions along the so utheas t m a rgin of the ice sheet. Observed brightness tempera tures in this region scld om exceed 265 K , although melt is known to occur h ere.
The genera l patterns evid ent in both the simula teclmelt TB (Fig . 1) a nd April-emissivity (Fig. 2) maps result from vari a tions in the accumula tion rate across th e ice sheet. The April-emiss ivity map (Fig. 2) closely resembles the latest accumula tion map for Greenland (Ohmura and R eeh, 1991 ) . R otman and others (1982) demonstra ted th a t accumula tion ra tes co uld be determined from
Downloaded from https://www.cambridge.org/core. 10 Aug 2020 at 06:07:38, subject to the Cambridge Core terms of use.
80N
60N
50W 40W 30W
Fig . 3. Simulaled summer-melt 37 CH :. brighlllw tem/malures minlls mean observed brightness lel71/Jeralures for A/Hil 1979 91.
ITI1 CrOWave emisslvlnes fo r the dry-snow zone of the Greenla nd ice sheet. The so utheas t o f' the ice shee t experi ences much highe r emi ss ions th a n the southwest (Fig. 2) . This difference is due to increased acc umul a tion in th e sou theas t from the o rographic lifting of moist air by th e Icela ndic 10\\' (Ohmura and R ee h , 199 1). The microwave emissil'ity of the south wes t i. much lower due to lower accumula tion ra tes . The regions of higher acc umul a tion near the ice m argin a t 77° N a nd at 1500-2400 m a .s.l. from 69° N to 72° N, as identifi ed by Ohmu ra and R eeh (199 1), a re a lso eviden t as regions of higher emissivi ty (Fig. 2).
AREAL MELT EXTENT
Values of th e 37 GHz, horizonta lly pola ri zed brightness tempera tures fo r each d ay of avail a b le d a ta were compared to the simula ted-melt brightn ess tempera tures fo r th e give n year. Th e simula ted values for each year were used as thres hold valu es to identify whether th e snowpac k in a give n grid cell was experi encing melt. Th e spa tial cove rage of grid cells identified as experi encing melt eac h d ay was summed to quantify the a rea l extent o f
M ole and Anderson: Snowpack melt 011 the Greenland ice sheet
melt. The d a il y melt ex tents were then ave raged on a monthl y a nd seasonal (M ay- August) basis to produce mean monthly a nd mean seasona l melt ex tents. The mean melt ex tents a re analogous to the average frequ ency of melt occurrence of all grid cells for a give n month or season. This m easurement d oes not indica te the intensity of the melt occurring in a g rid cell on any given day . H owever, the clima tic conditions averaged over months a nd seasons th a t produce intensive melt should usua ll y be associa ted with more ex tensive a nd more frequent melt.
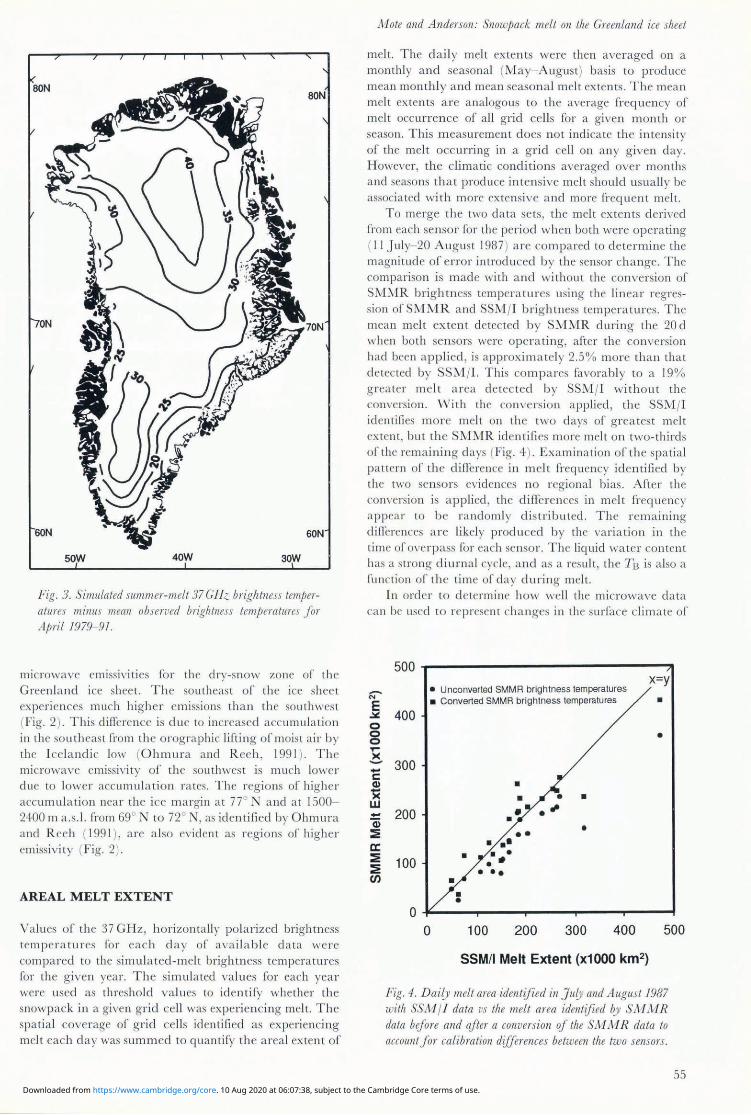
T o merge the two da ta se t.' , the melt ex tents d erived from each senso r for the period when bo th were opera ting ( 11 July- 20 Aug ust 198 7) a re com pared to determine the magnitud e of error introduced by the sensor change. The comparison is m ade with a nd without the conve rsion of SMMR bri ghtness tempera tures using the linear regression of SMMR and SSMjI brig htness tempera tures . The mean melt ex tent detec ted b y SMMR during the 20 d when both se nso rs were ope ra ting, after the conversion had been a pplied , is approxim ate ly 2.5% more than tha t de tected by SS l"l jl. This com pares favo rably to a 19% grea ter melt a rea detec ted b y SSM jl witho ut the conversion. vVith the conve rsion applied , th e SSM jI id entifies more melt on th e two d ays of g rea test melt ex tent, but the ' ~l~lR identifi e more melt on two-thirds of the remaining d ays (Fig. 4) . Exa min a tion of the spa ti al pa ttern of th e d ifference in m elt frequency id entified by the two se n. o rs ev idences no regiona l bi as . After the conversion is a pplied , the differences in melt fi'equency ap pea r to be ra ndomly di stributed. Th e remaining differences a rc likely prod uced by the va ria tion in the time of O\ 'erpass for each se nso r. Th e liquid wa ter content has a strong diurnal cycle, a nd a. a result , the TB is a lso a fun cti on of the time of day during mel t.
I n order to d etermine how wel l the microwave da ta can be used to rep resent cha nge in th e surface clima te of
-N
500
~ 400 o o o T" )(
:: 300 c: Cl)
>< W
200
100
0
• Unconverted SMMR brightness temperatures x=y
• Converted SMMR brightness temperatures •
•
• • • •
.'" •
• • • •
0 100 200 300 400 500
SS M/I Melt Extent (x1000 km2)
Fig. 4. D aily mell area idenlified in J uly and AUgllSl1987 with SSM j [ dala vs the melt area idenlified by SM MR data before and after a conversion of lhe S.M Ni R data to accollntfor calib ration differences between the two sensors.
55 Downloaded from https://www.cambridge.org/core. 10 Aug 2020 at 06:07:38, subject to the Cambridge Core terms of use.
Journal oJ Glaciology
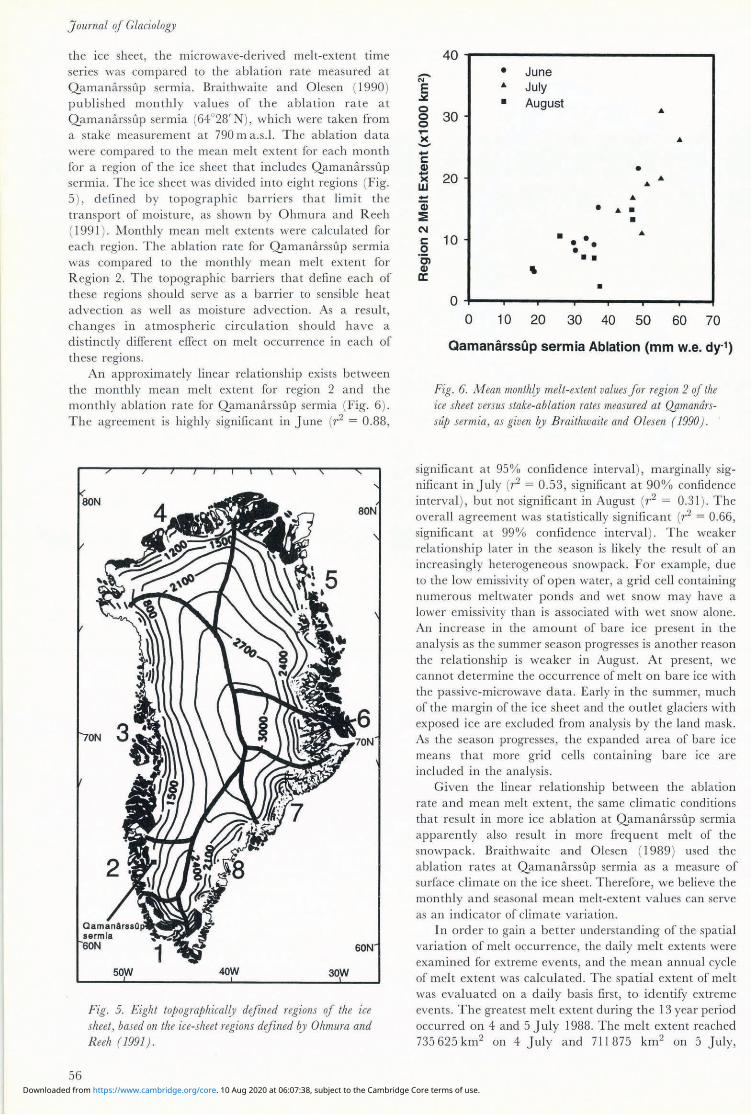
the ice sheet, the microwave-derived melt-extent time series was com pared to the ablation rate measured at Qamanarssup sermia. Braithwaite and Olesen (1990) published monthly values of the ablation rate at Qamanarss up sermia (64°28' N ), which were taken from a stake measurement at 790 m a.s .l. The ablation data were compared to the mean melt extent for each month for a region of the ice shee t that includes QamanarssLlp sermia. The ice sheet was divided into eight regions (Fig. 5 ) , defined by topographic barriers that limit the transport of moisture, as shown by Ohmura and R eeh (1991 ). Monthly mean me lt ex tents were calculated for each region. The ablation rate for Qamanarss up sermia was compared to the monthly m ean melt extent for R egion 2. The topographic barriers that define each of these regions shou ld serve as a barrier to sensible heat advection as well as moisture advection. As a result, changes in atmospheric circulation should have a distinctly different effect on melt occurrence in each of these regions .
An approximately linear relationship exists between the monthly mean melt extent for region 2 and the monthly ablation rate for Qamanarssilp sermia (Fig. 6) . Th e agreement is highly significant in June (r2 = 0.88,
56
40W
Fig. 5. Eight topographically defined regions oJ the ice sheet, based on the ice-sheet regions defined by Ohmura and R eeh (1991).
~ E ~
o o o ..... >< --c::
40 • .&
• 30
June July August
.&
...
• ~ >< 20 w
... .. -Qi :E ('11
• ..
.& •
• c:: 10 .S!
• ... ••• • • • Cl
Cl) a:: " •
O+--.--.....,..-..,..-..,---.----,.--f o 10 20 30 40 50 60 70
QamanarssOp sermia Ablation (mm w.e. dyo1)
Fig. 6. M ean monthly melt-extent values Jar region 2 DJ the ice sheet versus stake-ablation rates measured at Q,amandrssup sermia, as given by Braithwaite and Olesen (1990) .
significant at 95% confidence interval) , marginally significant inJuly (r2 = 0.53, significant at 90% confidence interval ), but not significant in August (r2 = 0.31 ) . The overall agreement was statistically significant (r2 = 0.66, significant at 99% confidence interval ) . The weaker relationship later in the season is likely the result of an increasingly heterogeneous snowpack . For example, due to the low emissivity of open water, a grid cell containing numerous meltwater ponds and wet snow may have a lower emissivity than is associated with we t snow alone. An increase in the amount of bare ice present in the analysis as the summer season progresses is another reason the relationship is weaker in August . At present, we cannot determine the occurrence of melt on bare ice with the passive-microwave data. Early in the summer, much of the margin of the ice sheet and the outlet glaciers with exposed ice are excluded from analysis by the land mask. As the season progresses, the expanded area of bare ice means that more grid cells containing bare ice are included in the analysis.
Given the linear relationship between the ablation rate and mean melt extent, the same climatic conditions that result in more ice ablation at Qamanarssup sermia apparently also result in more frequent melt of the snowpack. Braithwaitc and Olcscn (1989) uscd thc ablation rates at Qamanarssup sermia as a measure of surface climate on the ice sheet. Therefore, we believe the monthly and seasonal m ean melt-extent values can serve as an indicator of climate variation.
In order to gain a better understanding of the spatial variation of melt occurrence, the daily melt extents were examined for extreme events, and the mean annual cycle of melt extent was calculated . The spatial extent of melt was evaluated on a daily basis first, to identify extreme events. The greatest melt extent during the 13 year period occurred on 4 and 5 July 1988. The melt extent reached 735625 km2 on 4 July and 711875 km2 on 5 July,
Downloaded from https://www.cambridge.org/core. 10 Aug 2020 at 06:07:38, subject to the Cambridge Core terms of use.
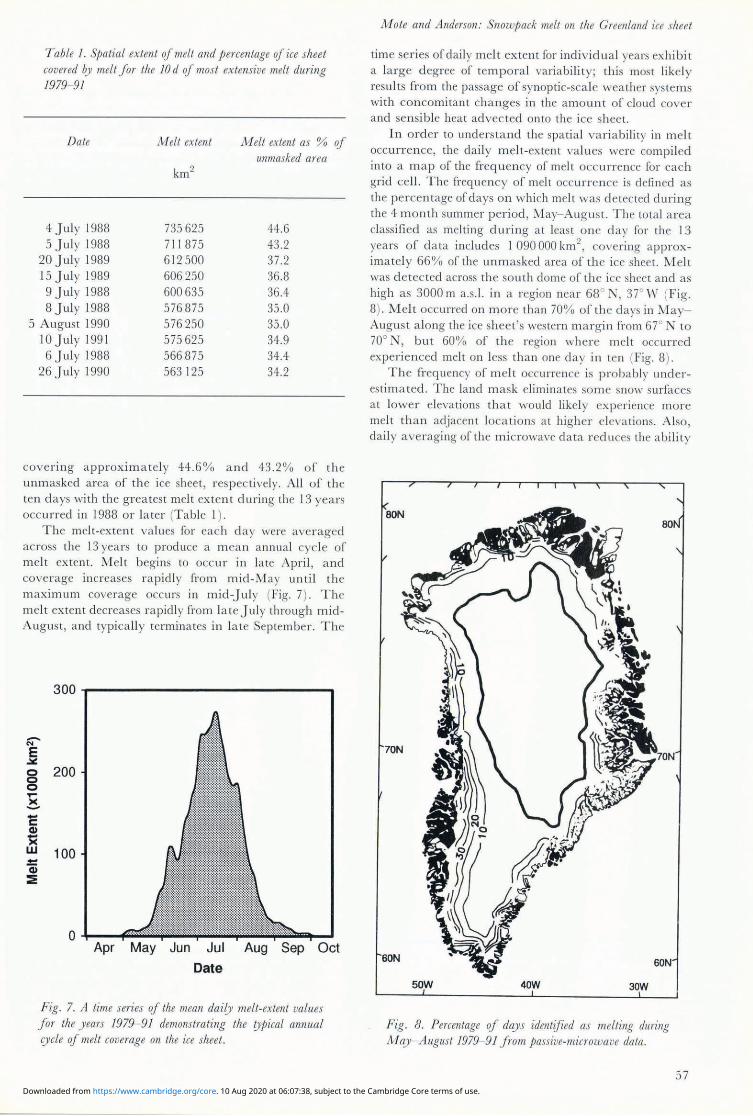
Table 1. Spatial extent of melt and percentage oj ice sheet covered by melt for the 10 d oj most extensive melt during 1979- 91
Date A1elt extent
4 J uly 1988 735625 5 J uly 1988 71 1875
M elt extent as % oj unmasked area
44.6 43.2
20 J uly 1989 612500 37.2 15 J uly 1989 606250 36.8 9July 1988 600635 36.4 8July 1988 576875 35.0
5 August 1990 576250 35.0 10 July 1991 575625 34.9 6July 1988 566875 34.4
26 J uly 1990 563125 34.2
covering approximate ly 44.6% a nd 43.2% of th e unmasked area of the ice shee t, respec tively. All of the ten days with the g reatest melt extent during the 13 years occurred in 1988 or la ter (Table I ) .
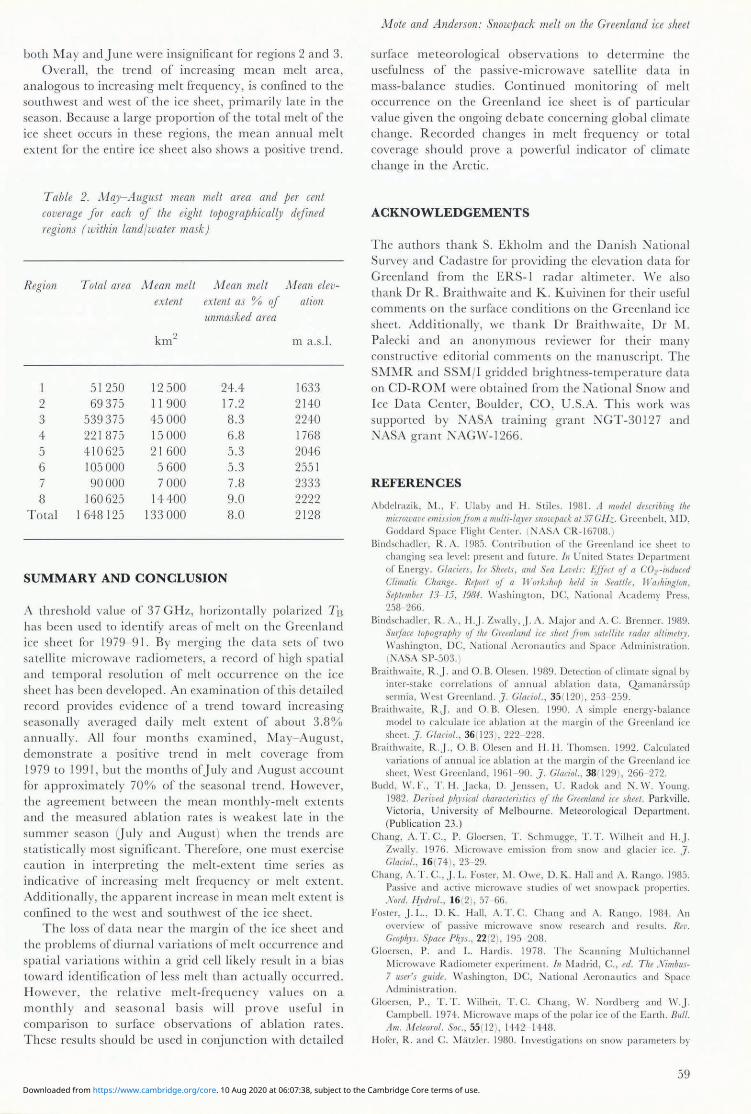
The melt-extent va lues (or each d ay were ave raged across the 13 years to produce a mean annual cycle of melt extent. M elt begins to occur in late Apri l, and coverage increases rapidly from mid-May unti l the maximum coverage occurs in mid-Ju ly (Fig. 7) . The melt extent decreases rapid ly from late Ju ly through midAugust, and typi cally terminates in late September. The
300?-----------------------~
-N
E .:.:. 0 0
200 0 ..... >< --c:: Cl)
>< w -Q) :!:
100
Apr May Jun Jul Aug Sep Oct
Date
Fig. 7. A time series oj the mean da ily melt-extent values for the years 1979- 91 demonstrating the typical annllal cycle oj melt coverage on the ice sheet.
Mote and Anderson: Snowpack melt on the Greenland ice sheet
time series of daily melt ex tent for individu a l years exhibit a large degree of temporal variability; this most likely res ults from the passage of synoptic-scale wea ther systems with concomitant changes in the amount of cloud cover and sensib le heat advected onto the ice shee t.
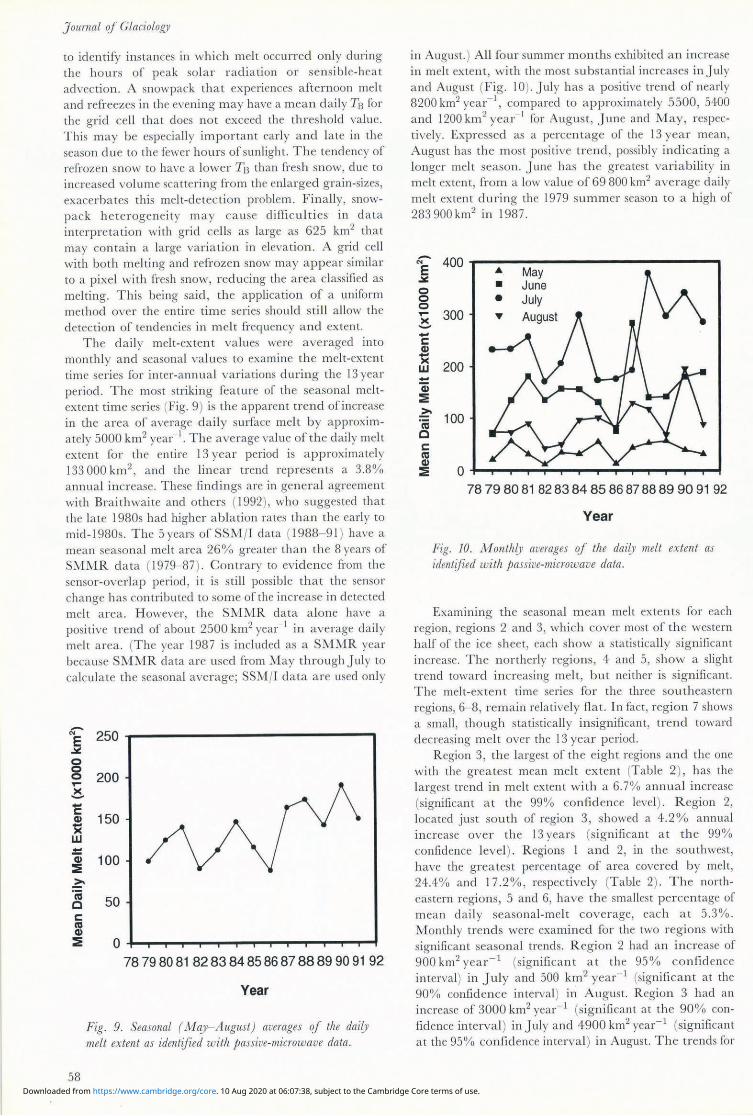
In order to understand the spatia l variability in melt occurrence, the dai ly m elt-ex tent values were compi led into a map of the freq uency of melt occurrence for each grid cell. The frequency of melt occurrcnce is defined as the percentage of days on which melt was detected during the 4 month summer period , May- Aug usl. The total area classified as melting during at least one d ay for the 13 years of data includes I 090000 km2
, covering approximately 66% of the unmasked area of th e ice shee t. M elt was d e tec ted across the so u th dome of th e ice sheet and as high as 3000 m a.s. l. in a region near 68° N, 37° W (Fig. 8). Melt occurred on more than 70% of the days in MayAugust along the ice shee t's wes tern margin from 67° N to 70° N, but 60% of th e region where melt occurred experi enced melt on less tha n one day in len (Fig. 8) .
The frequency of m elt occurrence is probably underestima ted. The land mask eliminates some snow' surfaces a t lower elevation that would likely experience more melt than adjacent loca tions a t higher elevations. Also, daily averaging of the mi crowave da ta red uces the ability
40W 30W
Fig. 8. Percentage of days identified as melting during May-August 1979- 91 from passive-microwave data .
57 Downloaded from https://www.cambridge.org/core. 10 Aug 2020 at 06:07:38, subject to the Cambridge Core terms of use.
J oumal oJ Glaciology
to identify instances in which melt occurred only during the hours of peak so lar radia tion or sensible-h ea t advecti on. A snowpack th a t experiences afternoon melt and refreezcs in the evening may have a mean dail y TB for the grid cel l tha t clocs not exceed the threshold valuc. This may be especiall y important early a nd la te in thc season clu c to the fewer hours of sunlight. The tendency of refrozen snow to have a lower TB than fres h snow, due to incrcased volume scattering from the enlarged grain-sizes, exacerba tes this melt-detec tion problem. Fina ll y, snowpac k h e terogeneity may ca use d irfi culties in da ta interpreta tion with grid cells as large as 625 km2 tha t may contain a large varia tion in eleva tion. A grid ce ll with both melting and refrozen snow may a ppear similar to a pixel with fresh snow, reducing the a rea classifi ed as melting. This being said , the applica tion of a uniform method over the entire time seri es should sti ll allow the detection of tend encies in m elt frequency a nd extent.
Th e d aily melt-extent values were averaged into month ly a nd seasonal valucs to examine the melt-ex tent time seri es for inter-annual varia tions during the 13 yea r peri od. The most striking fea ture of the seasonal meltextent timc series (Fig. 9) is the apparent trend of increase in the a rea of ave rage daily surface melt by approximately 5000 km2 year I. The average value of the daily melt extent for the entire 13 ycar period is a pproximately 133 000km2, and the linear trend represents a 3.8% annual increase. These findings are in genera l agreement with Braithwaite and others (1992 ), who sugges ted that the late 19805 had higher a bla tion rates th a n the earl y to
mid-1 980s. The 5 years o[ SSM /I data (1988-9 1) have a mean seasonal melt a rea 26% greatcr tha n the 8 years of SMMR d a ta (1979- 87 ). Contrary to evidence from the senso r-overlap period, it is still possible tha t the sensor change has con tribu ted to some of the increase in detected melt a rea. H owever, th e SlVLMR data a lone have a positi vc trend of about 2500 km2 year 1 in average dail y melt a rea. (The year 198 7 is included as a SMMR year becausc SMMR data are uscd from May through July to
calcul a te the seasonal average; SSM/I da ta are used onl y
-'" E ~
o g ,.... ~ 1: Cl)
>< W
58
78798081 8283848586878889 90 91 92
Year
Fig. 9. Seasonal ( Ma)I-August) averages oJ the daily
melt extent as identified with passive-microwave data .
in August .) All [o ur ummer months exhibited a n increase in melt ex tent, with the mos t substa ntial increases in July a nd August (Fig . 10). July h as a positive trend of nearly 8200 km2 yea r- I, compared to a pproximately 5500, 5400 a nd 1200 km 2 ycar 1 for August , June and M ay, respectively. Exprcssed as a percentagc of the 13 year mean, August has the most positive trend , possibly indica ting a longe r melt season . June has th e grea test vari a bility in mclt ex tent, from a low value of 69800 km2 averagc daily melt ex tent during the 1979 summ er season to a high of 283900 km2 in 1987.
-"'E ~
o o o
400?-------------------------~ .&
• • May June July
)( 300 'Y --C Cl)
>< w 200
78798081 82838485868788899091 92
Year
Fig. 10. M onthly averages of the daily melt extent as identified with p assive-microwave data.
Examining the seasonal m ean melt extents for each region, regions 2 and 3, which cover most of thc western h alf of the ice shee t, each show a statistically signifi cant increase. The northerl y regions, 4 and 5, sh ow a slight trend toward increasing melt, bu t neither is sig nifi cant. The melt-ex tent time series fo r the three so u theastern regions, 6- 8, r emain relatively fl a t. In fact, region 7 shows a small , though sta tistically insignificant, trend toward d ecreasing melt over the 13 year period.
R egion 3, the larges t of the eight regions a nd the one with the grea test mean melt ex tent (T able 2) , has the la rgest trend in melt ex tent with a 6.7% annua l increase (significant a t the 99% confid ence level) . R egion 2, located just south of region 3, showed a 4 .2 % annual increase over the 13 yea rs (signifi cant a t th e 99% confidence level ) . R egions I a nd 2, in th e southwes t, have the grea tes t percentage of a rea covered by melt, 24.4% and 17 .2%, respecti vely (T able 2). The northeastern regions, 5 and 6, have the small es t pcrcen tage of mean daily seasonal-melt coverage, each a t 5.3%. lVl onthly trends were examined for the two regions with significant seasonal trends. R egion 2 had an in crease of 900 km2 year - 1 (signifi ca nt a t th e 95% co nfid ence interval) in July a nd 500 km2 yea r- 1 (significant a t the 90% confidence interval) in August. Region 3 had an increase of 3000 km2 yea r- 1 (signifi cant at the 90% confid ence interval) in July and 4900 km2 year- 1 (significant a t the 95% confidence interval) in August. The trends for
Downloaded from https://www.cambridge.org/core. 10 Aug 2020 at 06:07:38, subject to the Cambridge Core terms of use.
both May andJun e were insignifican t [or regions 2 and 3. Overall, the trend o[ increasing mean melt area,
analogous to increasing melt [req uency, is confined to the . outhwest and west o[ the ice shee t, primarily la te in the season. Because a large proportion of th e total melt of the ice shee t occurs in these regions, the m ean annual melt ex tent [or the entire ice sheet also shows a positive trend.
T able 2. May-August mean melt area and per cent coverage Jor each of the eight topographical01 difined regions (within land/water mask)
Region T otal area 1'v! ean melt i\;[ean melt ivleall elev-extenl extent as % oJ ation
unmasked area
km2 m a.s. l.
I 51 250 12500 24.4 1633 2 69375 11 900 17.2 2140 3 539375 45000 8.3 2240 4 22 1875 15000 6.8 1768 5 410625 2 1 600 5.3 2046 6 105000 5600 5.3 255 1 7 90000 7000 7.8 2333 8 160625 14400 9.0 2222
Tota l 1 648 125 133000 8.0 2128
SUMMARY AND CONCLUSION
A threshold value o[ 37 G H z, horizon ta ll y polari zed TB has been used to id entify areas of melt on the Greenland ice sheet for 1979- 9 1. By merging the data se ts of two sa tellite microwave radiometers, a reco rd of high spa ti a l and tempora l reso lution of melt occurrence on the ice shee t has been deve loped. An examination of this deta il ed reco rd provides evid ence of' a trend toward increasing seasonall y ave raged d a il y melt ex tent of abou t 3.8% ann ua ll y. All [our month s exa mined , May-Augu st, demonstra te a positi ve trend in melt co\'erage from 1979 to 199 1, but the months o[ Jul y a nd August account for approximately 70 % of the seasonal trend. However, the agreement between the mean month ly-melt extents and the measured ab lation rates is weakes t late in the summer season (J ul y and August) when the trends a re statisti call y most significant. Therefore, one must exercise caution in interpreting the melt-ex tent timc seri es as indica tive of increasing m elt frequency or melt extent. Additionall y, the apparent increase in mean melt ex tent is confined to the west a nd southwest o[ the ice shee t.
The loss of data nea r the margin of the ice shee t and the problems of diurnal varia tions of melt occurrence and spatial variations within a grid cell likely res ult in a bi as toward identifica tion of less melt than actually occurred. H owever, th e relative melt-frequ en cy va lues on a month ly a nd seaso nal bas is will prove use fu l in comparison to surface observations of a bla tion ra tes. These results should be used in conjunc tion with deta iled
M ole and Anderson: Snowpack melt 01/ the Greenland ice sheet
surface meteorological observations to d etermine the usefu lness of th e passi\ 'e-microwave sa tellite da ta in mass-balance studi es . Continued monitoring of melt occurrence on the Greenla nd ice shee t is of parti cular value given the ongoing debate concerning global climate change. R ecorded changes in mel t freq uency or total coverage should prove a powerful indicator of climate change in the Arctic.
ACKNOWLEDGEMENTS
The authors thank S. Ekholm and the Danish ~ational
Survey and Cadastre for providing the elevation data for Greenland from the ERS-l radar al timeter. W e a lso thank Dr R. Braithwaite a nd K . Kuivinen [or their usefu l comments on the surface conditions on the Greenland ice sheet. Additionall y, we tha nk Dr Braithwaite, Dr NI. Pa lec ki and an anon ymous reviewer [or their man y constructive editori al comments on the ma nuscript. The SMMR and SSM/I gridded brightness-tempera ture data on CD-ROM were obtain ed from the National Snow and Ice Data Center, Bould er, CO, U.S.A. This work was supported by NASA training grant NGT-30127 and NASA grant NAGW-1266.
REFERENCES
Abdelrazik, M ., F. Ulab y and H . Stiles. 1981. ..J model describing the microwGl'e emissionJrom a lIlulti-la),er sllowpack at 37GH::.. Greenbelt. :\ID , Goddard Space Flight Cente r. (NASA CR-1 6708, )
Bindschad ler. R . i\. 1985. Cont ri bu tion of the Green land ice sheet to changing sea le"e1 : present a nd fUlUre. III U nited States D epartment of Energy. Glacier;, la Sheets, alld ,)'ea Le1ds: LJJf(t of a CGrindllced Climatic Challge . RI'/)art of a II 'orksho/) held ill Seal/le. Washingtoll, Septelllber 13 15, 198-1. Was hington , DC, :"iational Academ y Press, 258 266.
Bindschadle r, R . A. , H.J Z\\'ally, J . /\. :'Ilajor and 1\. C. Brenner. 1989 . SIIUaa 10POgTCl/)I,y of the Grl'elllalld ice sheet Jrom satl'lIite radar altilllet1)" I\ 'ashington , D C , :"iational Aeronautics a nd Space Administra ti on. (NASA S P-503. )
Braithwaite, R.J. and O. B. Olesen. 1989. Detec tion of cl ima te signa l by inter-sta ke co rrelations of annual ablation da ta, Qamanarss llp sermia, W es t Green land . J. Glaciol., 35 (120), 253 259.
Bra ith\\'ai te, R..J. and 0, B. Olesen. 1990. A simp le cnergy-balancc model to calculate ice ab la tion a t the ma rgin of the Greenland ice sheet. J. Glacial., 36 (123 ). 222 228.
Brait h\\'a it e, R.J ., O . B. Olesen and H. H . Thomsen. 1992. Calculated "ariations o f annual ice ab lat ion at the margin of the Greenland ice sheet, West Greenla nd , 1961 90.]. Glacial., 38 ( 129 ),266 272.
Eudd, W . F. , T. H . jacka , D. j enssen, U. Radok a nd :-I. I\" . Young. 1982. Derived ph)sical chartlcteriJtics of the Greelllalld ice sheet. Parkvill e, Victoria , University of Melbourne. Meteoro logica l Department. (P ublicatio n 23.)
Cha ng, A. T . C. , P. Cloersen, T. Schmugge, 1'. T. Wilheit and H.j. Zwally. 1976. 1\licrow""e em ission (i'om snow and glacier ice. J. Glariol., 16(74), 23 29.
C hang, A. T. c., j . L. Foste r, 1\1. Owc , D . K. Ha ll a nd A. R a ngo. 1985. Passi" e a nd active microwa'T studi es 0 (' wct sno\\"pac k prope rti es. .\ ord. ~ydrol ., 16(2),57 66.
r oster. j. L. , D . K . Ha ll , A. T . C. C ha ng and A. R a ngo. 1984. An oyerview of passive microwave snow research a nd results. Rn'.
Geo/)/~ys. Space P/~vs., 22 (2). 195 208. Cloe rsen , P. a nd L. Hard is. 1978. The Scanning '\lul tichannel
1I 1icrowa"e R ad iometer experiment. III 1\l adrid , c., ed. The '\"illlbus-7 user's guide. Washington, D C. National Aeronautics a nd Space Admini stration.
Cloersen, 1'., 1". T. Wilhcit, T. C. C hang, \I ' . l\o rdberg and \\ '.j. Campbell. 1974. 1I1icrowa\,e maps of the polar ice of the Earth. Bul!.
Am. J1f eteorol. Sac., 55 (12 ).1 442 1448. Hofe r. R . and C. lII;itzler. 1980. In ves ti gations on snow parameters by
59 Downloaded from https://www.cambridge.org/core. 10 Aug 2020 at 06:07:38, subject to the Cambridge Core terms of use.
Journal of Glaciology
rad iometry in the 3- to 60-mm wavelength region. ]. Geophys. Res., 85 (CI ), 453--460.
Hollinger, ]. , R. Lo, G. Poe, R. Sa\·age and] . Pierce. 1987. Special sensor microwave/imager user's guide. VVashington , DC, Na val Resea rch Labora tory.
] ezek, K.C. and 6 others. 1991. Comparison between SMMR and SSM/I pass ive microwave data collected over the Antarcti c ice sheet. Byrd Polar Reseanh Center. Technical Report 91-03.
Kunzi, K. F. , S. Patil and H . Ran. 1982. Snow-cover parameters re trieved rrom Nimbus-7 Scanning Multi channel Microwave Radiometer (SMMR) data. IEEE Trans. Ceosei. Remote Sensing , GE-20 (4), 452- 467.
Mote, T L. , M. R . And erson, K. C. Kuivinen and C . M. Rowe. 1993. Passive microwave-derived spatial and tempora l variations of summer melt on the Greenland ice sheet. Ann. Clacial. , 17, 233 238.
National Snow and Ice Data Center. 1992. DMSP SSM /I brightness temperature gridsJor the polar regions all CD-RONi. Users' guide. Boulder, CO, :"Iational Snow and Ice Data Center.
Ohmura, A. and N. Reeh. 1991. New precipitation and accumulation maps for Greenland.]. Claciol. , 37(125), 140- 148.
Peltier, W. R. and A. M . Tushingham . 1989. Global sea level rise and the greenhouse effect: might they be connected? Science, 244 (4906 ), 806 810.
Rotman, S. R. , A. D. Fisher and D. H. Staelin. 1982. Inversion for physical characteristics of snow using passive radiometric observa tions. ]. Glacial., 28 (98 ), 179- 185.
Stephenson, P.J. 1967. Some considerations of snow metamorphism in the Antarctic ice sheet in the light of ice crys tal studies . III Oura, H. , ed. Physics aJ SIlOW and ice. lutematiollal ConJerence on Low Temperature Science ... 1966, Sa/Jpora, Japan. Proceedillgs. Volume I, Part 2. Sapporo,
Hokkaido University. Institute of Low Temperature Science, 725-740.
Stiles, W. H. and F. T. Ulaby. 1980. The acti ve and passive microwave response to snow parameters. 1. Wetness. ]. Ceophys. Res., 85 (C2 ), 1037- 1044.
Thomas, R. H. and 8 others. 1985. Satellite remote sensing for ice sheet research. Washington, DC, National Aeronauti cs and Space Administration. (NASA T ech. Memo. 86233. )
Tinga, W. R. , W. A. G. Voss and D. F. Blossey. 1973. Generalized approach to multi phase dielectric mixture theory. ]. Appl. Phys., 44(9), 3897- 3902.
Tiuri , M . and H . Schultz. 1980. Theoretical and experimental studies of microwave radiation from a natural snowfield. In Rango, A. , ed. M icrowave remote sensing oJ snowpack properties. Proceedings of a warkshop ... Fort Collins, Colorado, lv/ay 20- 22, 1980. Washington, DC, National Aeronauti cs and Space Center, 225- 234. (Conference Publication 2153. )
U1aby, F . T and W. H. Stiles. 1980. The aClive and passive microwa ve response to snow parameters. 2. Water equi valent of dry snow. ]. Ceophys. Res ., 85 (C2), 1045- 1049.
Ulaby, F. T , R. K. Moore and A. K. Fung. 1986. Microwave remole sensing: active and passive. Vol. 3. Reading, MA , Addison-Wesley Publishing Co.
Weidick , A . 1985. The ice cover oJ Creenland. K0benhavn , Gr0nlands Geologiske Undersogelse. (Gletscher-Hydrologiske IVleddelelse r 85 /4. )
ZwaJly, H.J . 1977. Microwave emissivity and accumulation rate or polar firn. J. Claciol., 18(79), 195-2 15.
Zwally, H.]. 1989. Growth of Greenland ice sheet: interpretation. Science, 246 (4937), 1589- 1591.
MS received 26 July 1993 and in revised form 16 March 1994
60 Downloaded from https://www.cambridge.org/core. 10 Aug 2020 at 06:07:38, subject to the Cambridge Core terms of use.