Variation reduction strategies for IP patient flow through ...
47
Variation reduction strategies for IP patient flow through operating rooms Brian Meitzner, B.S. Management Engineer, William Beaumont Hospital, MI Jayant Trewn, Ph. D Adjunct Faculty, William Beaumont Hospital, MI
Transcript of Variation reduction strategies for IP patient flow through ...

Variation reduction strategies for IP patient flow through
operating rooms
Brian Meitzner, B.S.
Management Engineer, William Beaumont Hospital, MI
Jayant Trewn, Ph. D
Adjunct Faculty, William Beaumont Hospital, MI

Objective
ØConceptualize a systems approach to identifying variation sources that affect patient flow
ØDefine Artificial vs. Natural Variation
Ø Identify schedule variation causes
ØDiscuss some approaches to reduce schedule variation
ØDiscuss application in a large hospital in Michigan

Factors Affecting Item Flow
ØResource capacity
Ø Input/arrival patterns
ØDeparture patterns
Ø Input storage
ØOutput storage
ØProcessing variations/Cycle time
ØC/O time
Ø Job/work scheduling practices

Modeling Item Flow Through A Service Unit
Servicing Unit•Capacity•Cycle Time•Change Over time•Item service time
Input storage
Preceding unit outputpattern
Succeeding unit inputpattern
Outputstorage
Buffer Buffer

Sources Of Variation Affecting Flow
Waiting time/capacity of storageAbandon queue pattern
Nature of input of preceding unitDeparture patternOutput source
Storage capacity
Unit change/over time
Servicing time
Unit capacity
Storage capacity
Abandon queue pattern
Arrival pattern
Characteristic
Storage capacity availabilityOutput storage
Change over practices
Process/methods variances
Server to unit variances
Unit to unit variance
Resource/s capacity availabilityServicing unit
Storage capacity availabilityInput storage
Waiting time/capacity of storage
Nature of output of preceding unitInput source
Source of variationFactor

Drivers To Improving Hospital Service Unit Flows
Health Care Advisory Board (HCAB) 2002
Strategy for the future health system
Ø Maximizing Hospital Capacity and Throughput
Ø Managing Hospitals at full capacity

Modeling A Hospital Service Unit
Unit performing Service
Preceding Units
Succeding Units
Patient Flow
Provider Practices Patient
Characteristics System Variances
Input Variations
Output Variations
Patient Backward Acuity Move

Identifying sources of variation in a typical hospital service
unit
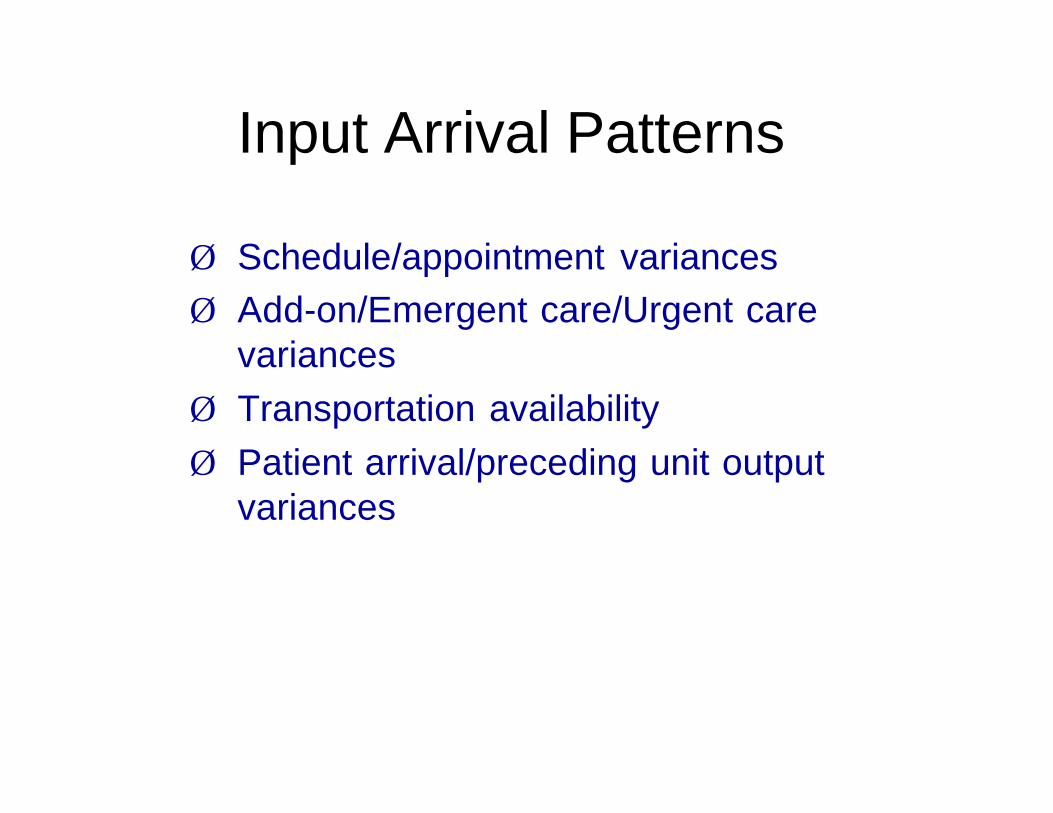
Input Arrival Patterns
Ø Schedule/appointment variances
Ø Add-on/Emergent care/Urgent care variances
Ø Transportation availability
Ø Patient arrival/preceding unit output variances

Arrival Pattern Variances
Ø Artificial Variability
Ø Non-random
Ø Non-predictable – driven by unknown priorities
Ø Flow variability
Ø Elective/Scheduled flow
Ø Random arrivals
Ø Add-on/Emergent care/Urgent care cases
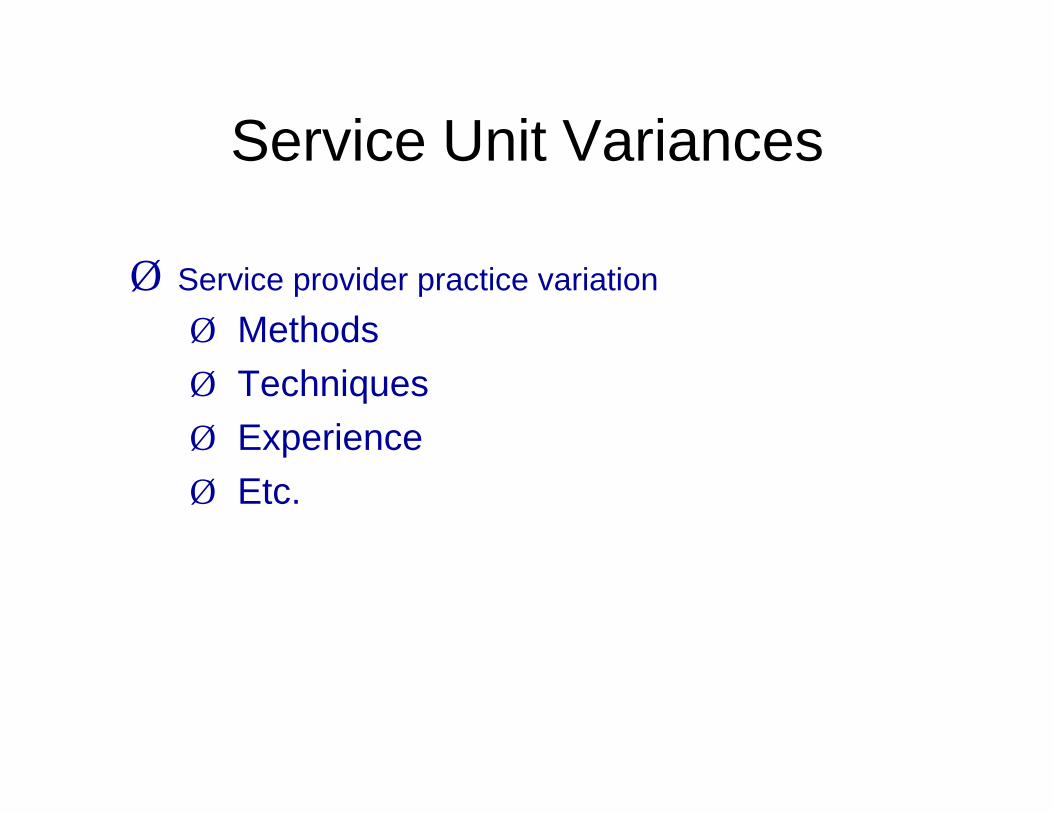
Service Unit Variances
Ø Service provider practice variation
Ø Methods
Ø Techniques
Ø Experience
Ø Etc.

Service Unit Variances Cont.
Ø Patient characteristic variation
Ø Patient demographics
Ø Patient diagnosis/symptoms
Ø Patients’ reception to treatment
Ø Patients’ transient state/instability
Ø Patient recovery
Ø Etc.

Service Unit Variances Cont.
Ø System/Servicing Unit variances
Ø Process/service delivery variations
Ø Equipment variances
Ø Availability, capacity, throughput, changeover times, etc
Ø Resource availability
Ø Procedure rooms, beds, physicians, nurses, etc.
Ø Etc.

Output Unit Variations
Ø Transit to admitting/discharging unit
Ø Availability/capacity
Ø Resources
Ø Admitting/discharging Unit
Ø Unit capacity/bed availability
Ø Discharging procedures
Ø Physician availability
Ø Discharge orders availability
Ø Transportation availability – Internal/external

Patient Flow Dampers
Ø Backward acuity moves
Ø Digressing patient condition
Ø Correction of errors in service unit

Sources Of Flow VariationØ Surgical scheduling
Ø Within day variability
Ø Between day variability
Ø Demand
Ø Numbers of patients presenting
Ø Clinical condition of patients
Ø Capacity
Ø Staff
Ø Space
Ø Time
Ø Equipment

Possible Solutions to Smoothen Flow
Ø Reduce scheduling variation
Ø Training
Ø Dedicated set of rooms
Ø Functionally separate facilities
Ø Separate scheduled and unscheduled patients

Solution investigated
Ø OR flow (throughput) smoothening utilizing schedule management

Case Study Reducing OR Patient Output
Variability
Ø Objectives
Ø Reduce between day variation in number of OR IP’s creating a demand for hospital beds
Ø Reduce within day variation in number of OR IP’s creating a demand for hospital beds
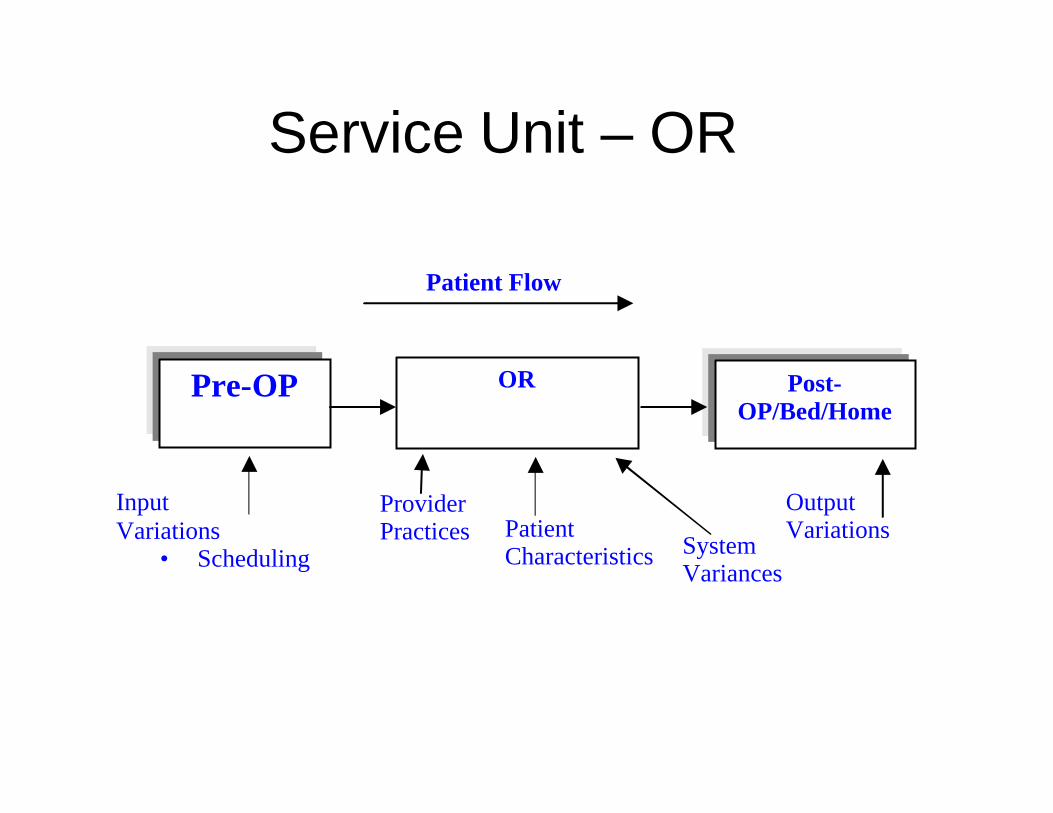
Service Unit – OR
OR Pre-OP Post-OP/Bed/Home
Patient Flow
Provider Practices Patient
Characteristics System Variances
Input Variations
· Scheduling
Output Variations

Scope Of Case Study
ØPilot smoothening project
ØOB/GYN surgery department

Mean+3Sigma Demand (Peaks) Average Demand
Gyn Surgery Bed Demand- 1 Gyn Surgery Bed Demand- 2
Day Total Day Total
1Sun 6 1Sun 0
2Mon 30 2Mon 9
3Tue 26 3Tue 7
4Wed 29 4Wed 8
5Thur 24 5Thur 6
6Fri 28 6Fri 7
7Sat 7 7Sat 1
Grand Total 151 Max weekly demand Grand Total 39 Average weekly demand
Demand based on Mean + 3 Sigma Demand based on Mean
Max Demand fluctuation 20% 6 Beds Max Demand fluctuation 33% 3 Beds
WBH - Royal Oak
Gyn Surgery IP Bed Demand
1/1/2004 to 8/30/2004
0.0
0.5
1.0
1.5
2.0
2.5
3.0
3.5
4.0
4.5
5.0
Sun 1
2 a
m
Sun 0
4 a
m
Sun 0
8 a
m
Sun 1
2 p
m
Sun 0
4 p
m
Sun 0
8 p
m
Mon 1
2 a
m
Mon 0
4 a
m
Mon 0
8 a
m
Mon 1
2 p
m
Mon 0
4 p
m
Mon 0
8 p
m
Tue
12 a
m
Tue
04 a
m
Tue
08 a
m
Tue
12 p
m
Tue
04 p
m
Tue
08 p
m
Wed
12 a
m
Wed
04 a
m
Wed
08 a
m
Wed
12 p
m
Wed
04 p
m
Wed
08 p
m
Thu 1
2 a
m
Thu 0
4 a
m
Thu 0
8 a
m
Thu 1
2 p
m
Thu 0
4 p
m
Thu 0
8 p
m
Fri
12 a
m
Fri
04 a
m
Fri
08 a
m
Fri
12 p
m
Fri
04 p
m
Fri
08 p
m
Sat
12 a
m
Sat
04 a
m
Sat
08 a
m
Sat
12 p
m
Sat
04 p
m
Sat
08 p
m
Time of Week
Gy
n B
ed D
ema
nd Mean
95th %ile
Ideal Demand
Within Day VariabilityBetween Day Variability
Gyn OR In Patient Bed Demand
Problem

Smoothening Opportunity
ØPast
ØGynecology Division of the Department of Obstetrics and Gynecology once had a block boarding system.
ØDismantled due to generalized perceptions of inequity
ØCurrently
ØOpen surgical boarding, with few exceptions
ØGYN physicians favor block boarding

Smoothening Benefits Of Block Boarding
ØConsistency in scheduling
ØGuaranteed block time
ØPredictable schedules

Other BenefitsØ Minimizing operating room delays and inefficiencies
Ø Resolve scheduling conflicts
Ø Maximizing surgical scheduling efficiency
Ø Flexibility within a given room and block time
Ø Improving patient care
Ø Blocks physicians can rely on
Ø Reducing conflict of responsibilities for practitioners

Challenges To Block Scheduling
Ø How to schedule 97 surgeons who have medium to small case lengths (time) into 10 daily half blocks?
Ø How to change the culture from flexible scheduling (schedule when-ever-room is available) TO constrained scheduling (Block Scheduling)
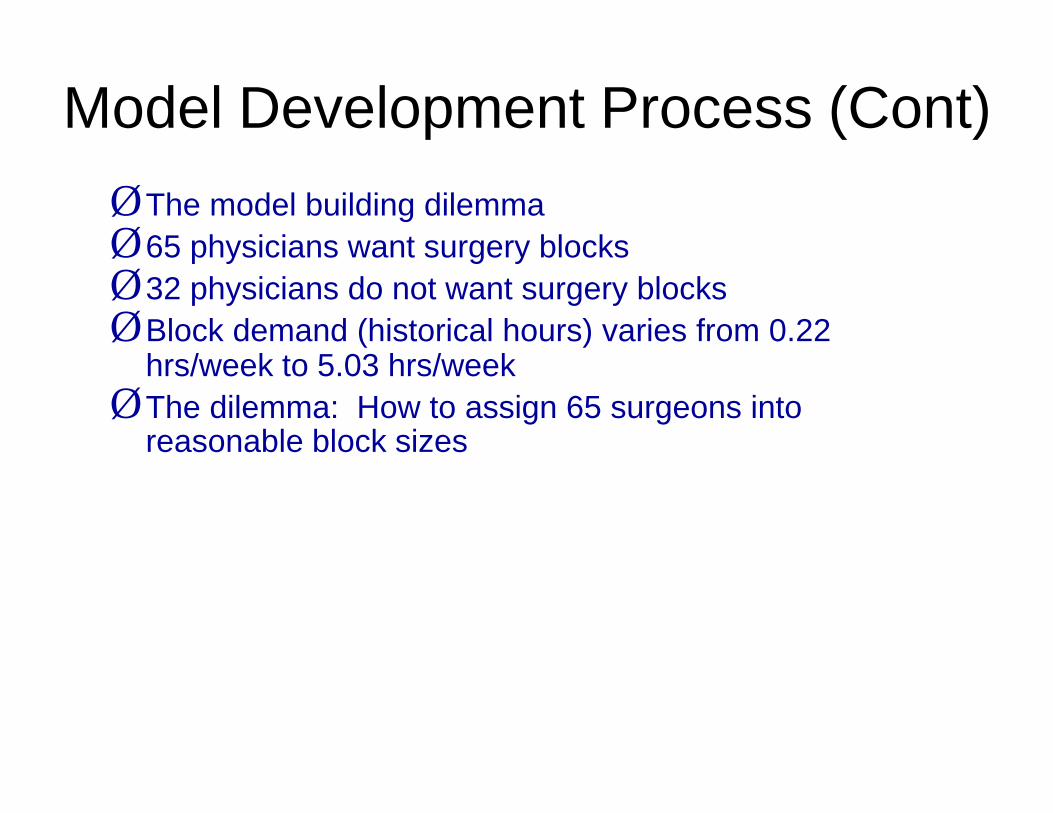
Model Development Process (Cont)
ØThe model building dilemma
Ø65 physicians want surgery blocks
Ø32 physicians do not want surgery blocks
ØBlock demand (historical hours) varies from 0.22 hrs/week to 5.03 hrs/week
ØThe dilemma: How to assign 65 surgeons into reasonable block sizes

Involve Physicians In Design
Ø Create a committee of supporters and dissenters of the block boarding scheduling model
Ø Make model flexible to physician preferences
Ø Block
Ø No-block
Ø Design model with equity for all in mind

Model Development Process
Block Boarding Survey
Survey surgeons to determine block preferences
Ø Initial mailing – June 2003
Ø Follow-up mailing – August 2003
Ø Phone calls – February 2004
Ø Survey response rate 66/80 = 83 %
Ø Follow-up (phone call) – 17 additional responses

Survey ResultsØ Item 1: Are you interested in having Block Boarding privileges?
Yes 65 67%
No 19 20%
No Response 13 13%
Ø Item 2: Block type – Group or individual?
Group 17 38%
Individual 28 62%
Ø Item 3: Block preference – Rank order block time preference
Ø Item 4: Anticipated time per week if block is not needed
Ø Item 5: Comments

Model Development Process (Cont)
Ø Source: SIS schedule
Ø OR Rooms 34, 35, 36 and 37
Ø Overall utilization – 67%
OR Time Utilization Report (Jan to Dec 2003)
SurveyResponse n Survey %
Average
Surgery
Hrs/week
Estimated
Blocks per
week 1
%
Demand
NoResp 13 13% 10.06 2.01 5%
Yes (Blocks) 65 67% 158.14 31.63 84%
No (Blocks) 19 20% 19.35 3.87 10%
Total 188.40 37.68
Notes1
Estimated blocks per week is based on 5 hour blocks2
All cases inclusive of CTC and cases done in other OR's
67% physicians wanted block boarding and they performed 84% of the case vol.

Model Development Process (Cont)
ØPhysicians will be assigned to blocks based on the model
ØBlock assignment based on historical room utilization reports
ØBlock assignment will be monitored
ØBlock Oversight Committee
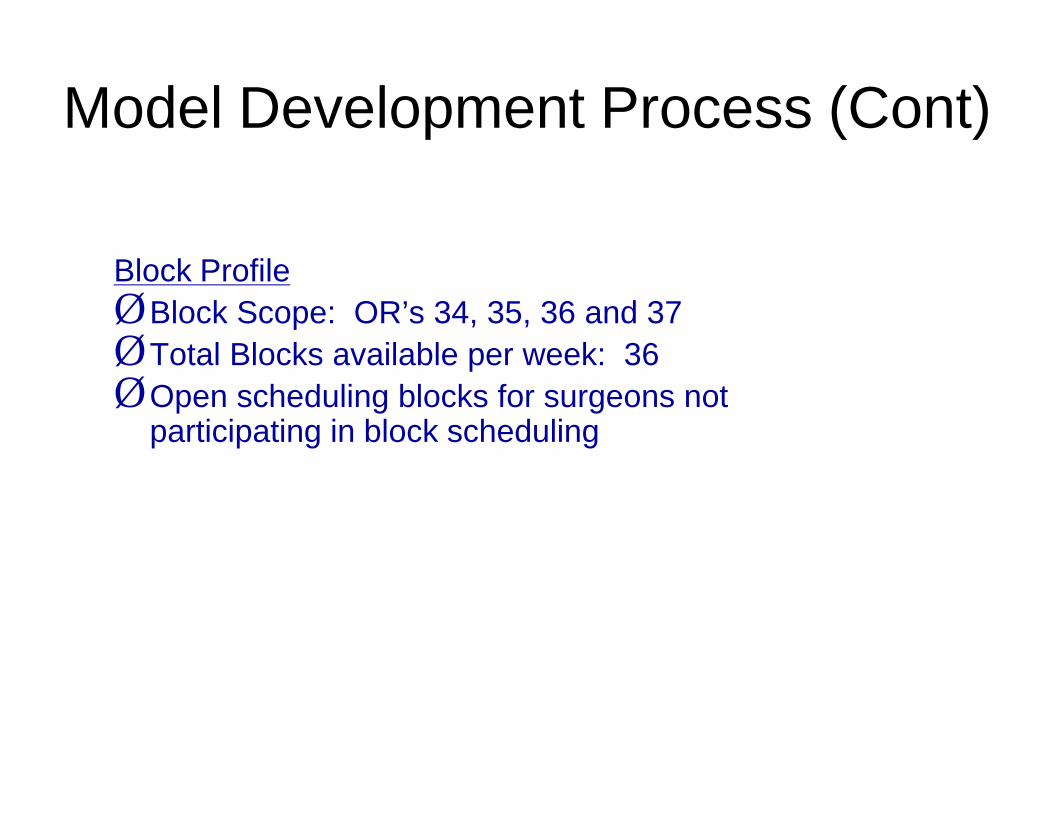
Model Development Process (Cont)
Block Profile
ØBlock Scope: OR’s 34, 35, 36 and 37
ØTotal Blocks available per week: 36
ØOpen scheduling blocks for surgeons not participating in block scheduling
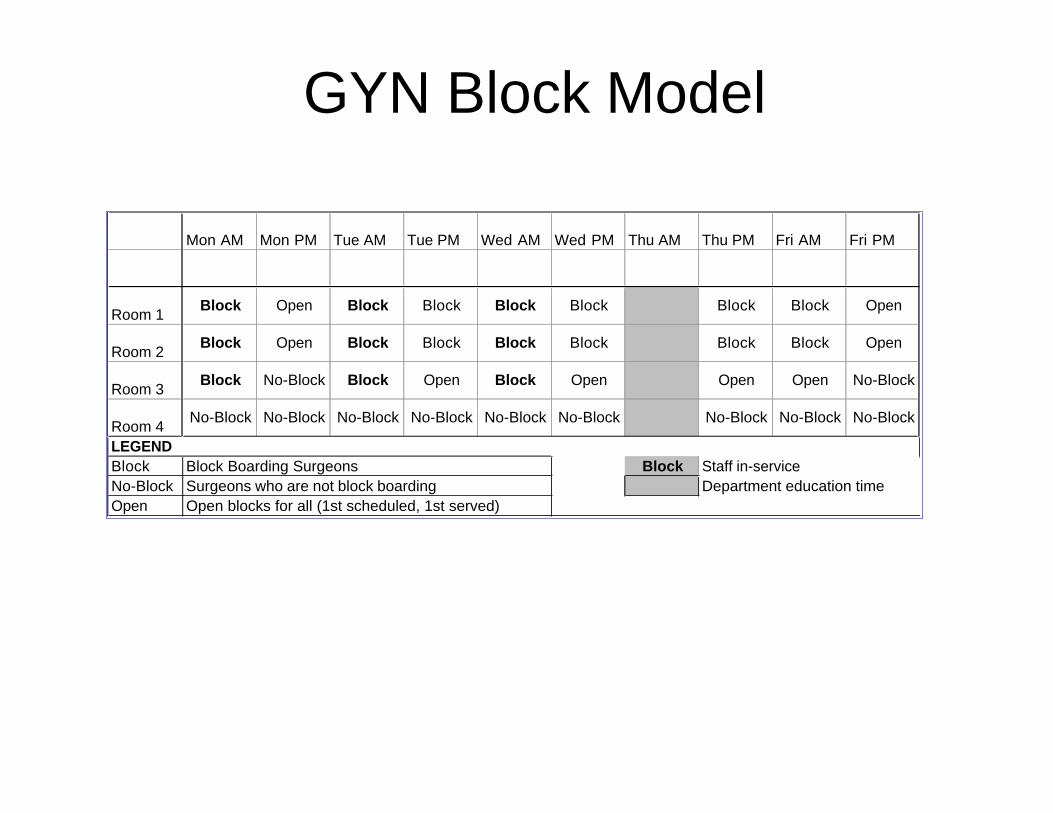
GYN Block Model
Mon AM Mon PM Tue AM Tue PM Wed AM Wed PM Thu AM Thu PM Fri AM Fri PM
Room 1Block Open Block Block Block Block Block Block Open
Room 2Block Open Block Block Block Block Block Block Open
Room 3Block No-Block Block Open Block Open Open Open No-Block
Room 4No-Block No-Block No-Block No-Block No-Block No-Block No-Block No-Block No-Block
LEGEND
Block Block Boarding Surgeons Block Staff in-service
No-Block Surgeons who are not block boarding Department education time
Open Open blocks for all (1st scheduled, 1st served)

Block Assignment Rules
ØBasis for assigning surgeons to blocksØ1st block preference in survey
ØAverage weekly surgery hours
ØOpen Blocks provided for block overflows

Model Implementation
Ø Transition phase – April 1st to May 31st 2005
Ø Block Boarding Transitional Phase –grandfather previously scheduled cases
Ø Model warm-up
Ø Steady State – June 1st to October 31st 2005
Ø No model adjustments made – revision of block assignments

Results Of Case Study
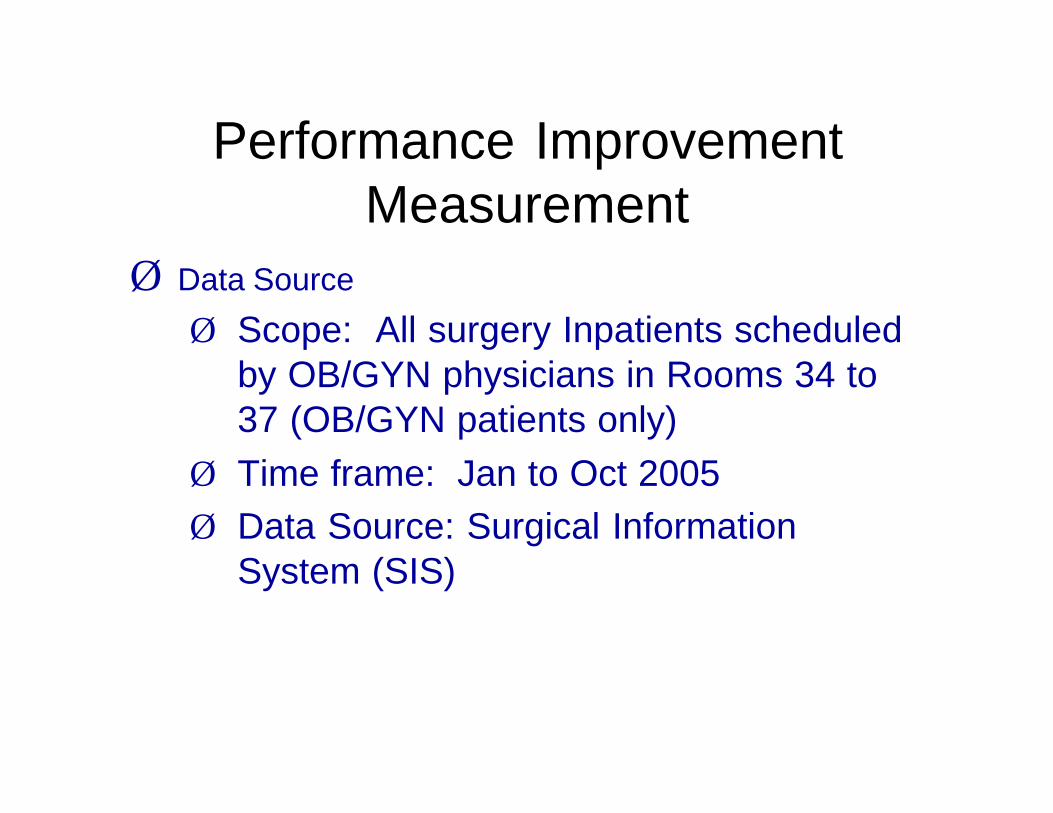
Performance Improvement Measurement
Ø Data Source
Ø Scope: All surgery Inpatients scheduled by OB/GYN physicians in Rooms 34 to 37 (OB/GYN patients only)
Ø Time frame: Jan to Oct 2005
Ø Data Source: Surgical Information System (SIS)

Data Analysis Elements
ØDependent Variable:
Ø Number of In-Patients leaving OR
Ø Independent Variables:
Ø Time of completion of surgery
Ø Type of Block (In-Block, Out-Block, No-Block)
Ø Phase (Pre-Blocks, Transition, Steady State)
Ø Weekday of surgery
ØCovariate
Ø Total surgeries per day
Ø Parse out variation due to surgical volume trend

Surgical Volume Trend
OB/GYN Inpatient Volume Trend
y = 2.5455x + 186.2
R2 = 0.1641
150
160
170
180
190
200
210
220
230
Jan Feb Mar Apr May Jun Jul Aug Sep Oct
Total Volume
Linear (Total Volume)
ØEffect of volume trends removed by placing trend as a covariate in ANOVA analysis

Data Analysis Model
ØAnova Analysis – Hierarchical Model
ØRemoval of effect of covariate – volume trend
ØModel
Ø Block Type * Phase * WeekdayØ Between Days Variation
Ø Block Type * Phase * Weekday * Time Ø Within Day Variation
Ø Block Type * Phase * TimeØ Within Time Bucket variation

Data Analysis Results
Tests of Between-Subjects Effects
Dependent Variable: Arrivals
1683.884a 351 4.797 17.299 .000
57.183 28 2.042 7.364 .000
148.987 245 .608 2.193 .000
435.682 70 6.224 22.443 .000
61.603 1 61.603 222.136 .000
1346.116 4854 .277
3030.000 5205
SourceModel
Beween DaysVariation
Within Days Variation
Within Time BucketVariation
Covariate - VolumeTrends
Error
Total
Type III Sumof Squares df Mean Square F Sig.
R Squared = .556 (Adjusted R Squared = .524)a.

Day to Day Schedule Variation
0.0
1.0
2.0
3.0
4.0
Mon 06 am Mon 06 pm Tue 06 am Tue 06 pm Wed 06 am Wed 06 pm Thu 06 am Thu 06 pm Fri 06 am Fri 06 pm
Time of Week
Arr
iva
ls 95th %ile
Mean
0.0
1.0
2.0
3.0
4.0
Mon 06 am Mon 06 pm Tue 06 am Tue 06 pm Wed 06 am Wed 06 pm Thu 06 am Thu 06 pm Fri 06 am Fri 06 pm
Time of Week
Arr
iva
ls
95th %ile
Mean
0.0
1.0
2.0
3.0
4.0
Mon 06 am Mon 06 pm Tue 06 am Tue 06 pm Wed 06 am Wed 06 pm Thu 06 am Thu 06 pm Fri 06 am Fri 06 pm
Time of Week
Arr
iva
ls
95th %ile
Mean
Pre-Model
1/1/05 to 3/31/05
Transition
4/1/05 to 5/31/05
Post
6/1/05 to 10/31/05

Block vs. Non-Block Schedule Variation
0.0
0.5
1.0
1.5
2.0
2.5
3.0
3.5
4.0
Mon 06
am
Mon 06
pm
Tue 06 am Tue 06 pm Wed 06
am
Wed 06
pm
Thu 06 am Thu 06
pm
Fri 06 am Fri 06 pm
Time of Week
Arr
ival
s
95th %ile
Mean
0.0
0.5
1.0
1.5
2.0
2.5
3.0
3.5
4.0
Mon 06
am
Mon 06
pm
Tue 06 am Tue 06 pm Wed 06
am
Wed 06
pm
Thu 06 am Thu 06
pm
Fri 06 am Fri 06 pm
Time of Week
Arr
ival
s
95th %ile
Mean
No Block
Current
6/1/05 to 10/31/05
Block
Current
6/1/05 to 10/31/05
Reduced Variation

Observation: Reduction in within day variation

Discussion Of ResultsØ Reduced Within day variation p=0.00
Ø Operational Impact
Ø OR backup is managed – PACU bed availability is stable
Ø Hospital bed demand is stable – PACU output is stable
Ø Patient discharges can be planned
ØBetween day variation p=0.00
Ø Operational Impact
Ø Hospital bed demand is stable
Ø Bed utilization is even across week
Future Model Improvements
ØAdjust block boarding model to reflect utilization
Ø Adjust block time for block surgeons boarding surgeries out of their block
ØSmoothen between day variation
Ø Move high demand block volumes (Mon, Tue, Wed) to low demand days (Thu and Fri) to smoothen IP volumes by day of week