Variation in owl limpet Lottia gigantea population structures, growth ...
14
MARINE ECOLOGY PROGRESS SERIES Mar Ecol Prog Ser Vol. 257: 111–124, 2003 Published August 7 INTRODUCTION Humans collect vulnerable intertidal species mainly for use as food or fishing bait or for their shells. Effects of over-collecting can cause reductions in population density and, because humans prefer to collect larger animals, decreases in the number of larger individuals. Such changes in the structures of exploited intertidal invertebrate populations have been reported in Aus- tralia (Catterall & Poiner 1987, Keough et al. 1993), Baja California, Mexico (Pombo & Escofet 1996), Cali- fornia, USA (Zedler 1978, Addessi 1994, Roy et al. 2003), Chile (Moreno et al. 1984, Castilla & Durán 1985, Oliva & Castilla 1986, Durán & Castilla 1989), Costa Rica (Ortega 1987), South Africa (Branch 1975, McLachlan & Lombard 1981, Hockey & Bosman 1986, Lasiak & Dye 1989) and Tanzania (Newton et al. 1993). Through reductions in density and shifts toward smaller individuals, human exploitation also can de- crease the reproductive output of intertidal inverte- brate populations in which there is an increase in indi- vidual fecundity with body size (Seapy 1966, Branch 1974, 1975, Creese 1980a, Levitan 1991, Tegner et al. 1996). This is especially true for broadcast spawners such as limpets, trochid snails, and urchins that de- pend on high gamete concentrations to increase the probability for successful fertilization (Hockey & Branch 1994). © Inter-Research 2003 · www.int-res.com *Corresponding author. Email: [email protected] Variation in owl limpet Lottia gigantea population structures, growth rates, and gonadal production on southern California rocky shores Janine S. Kido, Steven N. Murray* Department of Biological Science, California State University at Fullerton, Fullerton, California 92834-6850, USA ABSTRACT: The size structures of Lottia gigantea populations were studied at 8 southern California sites, 4 of which were longstanding Marine Protected Areas (MPAs). Greater mean sizes and higher frequencies of larger individuals occurred at sites with lowest human visitation. Mean L. gigantea shell lengths (SLs) were negatively correlated with the number of visitors and collectors per 10 m of shoreline. Limpets never achieved SLs greater than 79.0 mm at any of our 8 sites, a size well below the maximum for this species. Mean SLs were comparable to sizes at other sites where L. gigantea is intensely collected. The presence of collectors, small mean SLs, and the absence of large limpets sug- gest that L. gigantea populations are affected by humans at our sites. Lower densities and higher fre- quencies of larger limpets were found in a subpopulation living on open-rock surfaces compared with a subpopulation occupying smaller, patch habitats within mussel beds. Larger limpets were mostly female and gonadal mass increased exponentially with SL in both subpopulations. Limpets < 40 mm SL exhibited highly variable growth rates; however, limpets in patch habitats grew slower and produced less gonadal mass than limpets inhabiting open rocks, despite the availability of more microalgal food. Ages of the largest limpets in the open-rock subpopulation were estimated to be > 8 yr. Given the age of larger limpets and the potential for collectors to remove larger individuals and shift populations towards smaller size structures, effective MPAs may take decades to reverse the effects of human impacts on L. gigantea populations in southern California. KEY WORDS: Owl limpets · Reproduction · Growth · Population structure · Marine protected areas · Human impact · Rocky intertidal · Southern California Resale or republication not permitted without written consent of the publisher
Transcript of Variation in owl limpet Lottia gigantea population structures, growth ...
MARINE ECOLOGY PROGRESS SERIESMar Ecol Prog Ser
Vol. 257: 111–124, 2003 Published August 7
INTRODUCTION
Humans collect vulnerable intertidal species mainlyfor use as food or fishing bait or for their shells. Effectsof over-collecting can cause reductions in populationdensity and, because humans prefer to collect largeranimals, decreases in the number of larger individuals.Such changes in the structures of exploited intertidalinvertebrate populations have been reported in Aus-tralia (Catterall & Poiner 1987, Keough et al. 1993),Baja California, Mexico (Pombo & Escofet 1996), Cali-fornia, USA (Zedler 1978, Addessi 1994, Roy et al.2003), Chile (Moreno et al. 1984, Castilla & Durán1985, Oliva & Castilla 1986, Durán & Castilla 1989),
Costa Rica (Ortega 1987), South Africa (Branch 1975,McLachlan & Lombard 1981, Hockey & Bosman 1986,Lasiak & Dye 1989) and Tanzania (Newton et al. 1993).Through reductions in density and shifts towardsmaller individuals, human exploitation also can de-crease the reproductive output of intertidal inverte-brate populations in which there is an increase in indi-vidual fecundity with body size (Seapy 1966, Branch1974, 1975, Creese 1980a, Levitan 1991, Tegner et al.1996). This is especially true for broadcast spawnerssuch as limpets, trochid snails, and urchins that de-pend on high gamete concentrations to increase theprobability for successful fertilization (Hockey &Branch 1994).
© Inter-Research 2003 · www.int-res.com*Corresponding author. Email: [email protected]
Variation in owl limpet Lottia gigantea populationstructures, growth rates, and gonadal production
on southern California rocky shores
Janine S. Kido, Steven N. Murray*
Department of Biological Science, California State University at Fullerton, Fullerton, California 92834-6850, USA
ABSTRACT: The size structures of Lottia gigantea populations were studied at 8 southern Californiasites, 4 of which were longstanding Marine Protected Areas (MPAs). Greater mean sizes and higherfrequencies of larger individuals occurred at sites with lowest human visitation. Mean L. giganteashell lengths (SLs) were negatively correlated with the number of visitors and collectors per 10 m ofshoreline. Limpets never achieved SLs greater than 79.0 mm at any of our 8 sites, a size well belowthe maximum for this species. Mean SLs were comparable to sizes at other sites where L. gigantea isintensely collected. The presence of collectors, small mean SLs, and the absence of large limpets sug-gest that L. gigantea populations are affected by humans at our sites. Lower densities and higher fre-quencies of larger limpets were found in a subpopulation living on open-rock surfaces compared witha subpopulation occupying smaller, patch habitats within mussel beds. Larger limpets were mostlyfemale and gonadal mass increased exponentially with SL in both subpopulations. Limpets <40 mmSL exhibited highly variable growth rates; however, limpets in patch habitats grew slower andproduced less gonadal mass than limpets inhabiting open rocks, despite the availability of moremicroalgal food. Ages of the largest limpets in the open-rock subpopulation were estimated to be>8 yr. Given the age of larger limpets and the potential for collectors to remove larger individuals andshift populations towards smaller size structures, effective MPAs may take decades to reverse theeffects of human impacts on L. gigantea populations in southern California.
KEY WORDS: Owl limpets · Reproduction · Growth · Population structure · Marine protected areas ·Human impact · Rocky intertidal · Southern California
Resale or republication not permitted without written consent of the publisher
Mar Ecol Prog Ser 257: 111–124, 2003
The owl limpet Lottia gigantea is the largest limpetin North America, reaching sizes >100 mm in shelllength (Lindberg et al. 1998). L. gigantea is confinedto upper, mid-intertidal zone habitats from Washing-ton to Baja California (Abbott & Haderlie 1980),where it maintains grazing territories (Stimson 1970)and is an important ‘space occupier’ (Lindberg et al.1998). By repeatedly grazing the same area, L.gigantea limits the recruitment and incursion of otherspace-occupying organisms into its territories, andtherefore, its grazing activities can alter the structureof mid-intertidal communities (Stimson 1970, 1973,Lindberg et al. 1998). Owl limpets are often collectedby humans for use as food or fishing bait because oftheir large muscular foot (Pombo & Escofet 1996,Lindberg et al. 1998). Also, owl limpets can bestrongly preyed upon by the American black oyster-catcher Haematopus bachmani, a territorial shorebirdthat can exert sufficient predation pressure to influ-ence limpet abundances and L. gigantea’s utilizationof microhabitat (Lindberg et al. 1987, 1998). How-ever, American black oystercatchers are very sensi-tive to human presence (Sowls et al. 1980, Frank1982, Lindberg et al. 1987, 1998) and are essentiallyabsent from heavily populated, urban coastlines.
Humans strongly exploit larger limpets and, as aresult, Lottia gigantea populations become domi-nated by smaller animals in areas subjected tohuman predation (Pombo & Escofet 1996, Lindberget al. 1998, Roy et al. 2003). Such human-inducedshifts in the size structure of owl limpet populationsmay be of concern due to the reproductive strategyof this species. L. gigantea is a broadcast spawnerand is protandrous, i.e. animals change from male tofemale with age (Wright & Lindberg 1982). Hypo-thetically, larger, older individuals are mostly femaleand collecting or other sources of mortality thatselectively concentrate on larger animals can altermale-to-female ratios. Previous studies (Lindberg etal. 1987, 1998) have shown that both American blackoystercatcher predation and human exploitation of L.gigantea can have profound effects on owl limpetpopulations and the structure of rocky intertidal com-munities.
The purpose of this study was to examine variationsin the structure of Lottia gigantea populations overregional (among-site) and local (within-site) scales inurban southern California habitats, where humanpresence is high and the ecological influence ofAmerican black oystercatchers is absent or negligi-ble. Based on historical museum specimens and cur-rent field surveys, Roy et al. (2003) reported thathuman activities have resulted in a significant declinein owl limpet body sizes in the southern Californiaregion over the last century. Hence, an additional
goal of this study was to determine whether regional,urban Marine Protected Areas (MPAs) protect owllimpets and support L. gigantea population size struc-tures characteristic of those from unexploited habi-tats. Populations were studied at 8 southern Cali-fornia sites, 4 of which were longstanding MPAs thathypothetically protect intertidal animals from humancollection. Our sites were located along a heavilypopulated section of coastline where we have notseen American black oystercatchers for the last 10 yr.The population size structures of L. gigantea at theseurban sites were compared with those reported forowl limpet populations from other southern Californ-ian and Mexican locations, some of which are knownto receive intense human exploitation.
Lottia gigantea populations occupy a range ofintertidal habitat types that vary in the nature andsize of the substratum available for grazing. Forexample, in southern California, L. gigantea is foundin habitats ranging from large, smooth open-rockplatforms or boulders, where they can potentiallyestablish large grazing territories, to small, topo-graphically heterogeneous patches located withinmussel beds. Qualitative observations revealed thatlarger limpets were often found on large, open-rocksurfaces, where they are easily visible to humans andpredatory shorebirds but were rare or absent fromsmaller, patchy habitats that appeared to supporthigher densities of small-sized limpets. Because theremoval of larger, territorial owl limpets can reducethe exclusion of encroaching organisms, collectingpressure also can result in the modification of habitatavailable to support natural L. gigantea populationstructures (Lindberg et al. 1998). Hypothetically,exploited populations become packed into smallerhabitat patches where grazing territories are smallerand more limited due to encroachment of mussels orother organisms. This change in habitat availabilitymay also cause modified population structures. Hence,we examined within-site differences in the char-acteristics of L. gigantea subpopulations occupyingopen-rock surfaces and smaller patch habitats. Thiscomparison is unique because past studies on L.gigantea appear to have been concentrated on sub-populations occupying large, open-rock surfaces. Be-cause smaller habitats contain less grazing territory,we predicted that the density, size structure, growthrates, and gonadal production of owl limpet subpop-ulations occupying patch habitats would differ fromsubpopulations occupying open-rock surfaces. Wealso hypothesized that the majority of larger indi-viduals of this protandrous limpet would be femalesin both habitats if sex change occurs in L. giganteairrespective of the maximum achieved size of limpetsin a subpopulation.
112
Kido & Murray: Variation in Lottia gigantea populations
MATERIALS AND METHODS
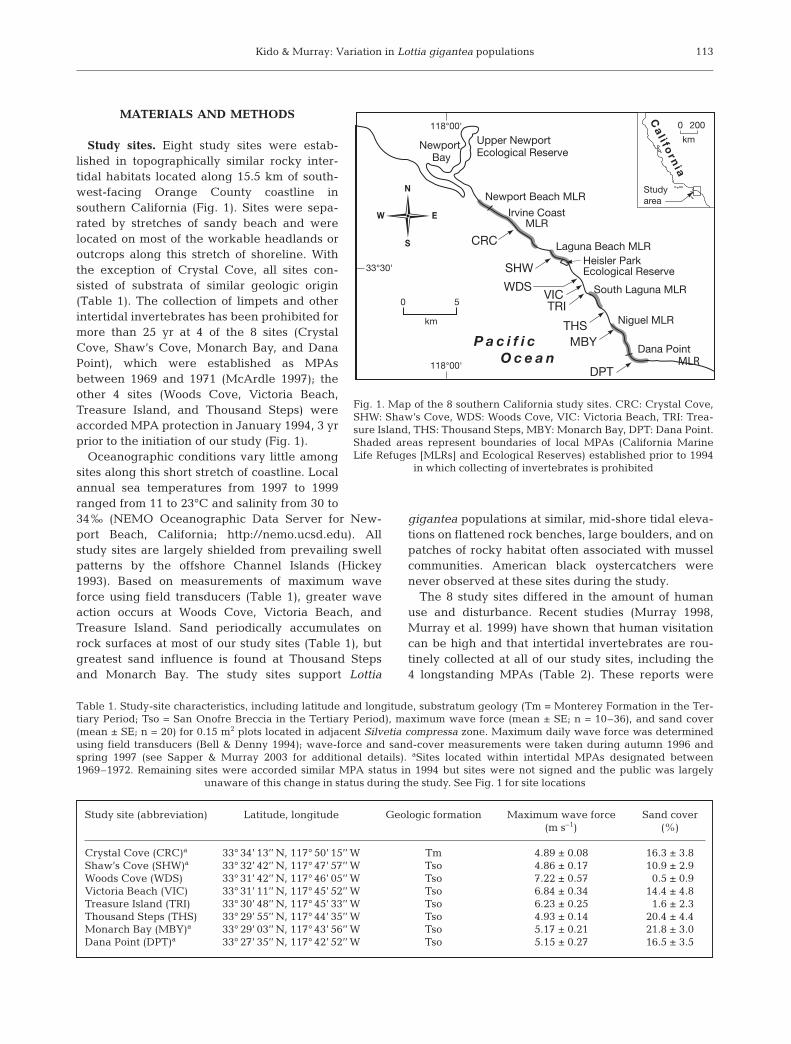
Study sites. Eight study sites were estab-lished in topographically similar rocky inter-tidal habitats located along 15.5 km of south-west-facing Orange County coastline insouthern California (Fig. 1). Sites were sepa-rated by stretches of sandy beach and werelocated on most of the workable headlands oroutcrops along this stretch of shoreline. Withthe exception of Crystal Cove, all sites con-sisted of substrata of similar geologic origin(Table 1). The collection of limpets and otherintertidal invertebrates has been prohibited formore than 25 yr at 4 of the 8 sites (CrystalCove, Shaw’s Cove, Monarch Bay, and DanaPoint), which were established as MPAsbetween 1969 and 1971 (McArdle 1997); theother 4 sites (Woods Cove, Victoria Beach,Treasure Island, and Thousand Steps) wereaccorded MPA protection in January 1994, 3 yrprior to the initiation of our study (Fig. 1).
Oceanographic conditions vary little amongsites along this short stretch of coastline. Localannual sea temperatures from 1997 to 1999ranged from 11 to 23°C and salinity from 30 to34‰ (NEMO Oceanographic Data Server for New-port Beach, California; http://nemo.ucsd.edu). Allstudy sites are largely shielded from prevailing swellpatterns by the offshore Channel Islands (Hickey1993). Based on measurements of maximum waveforce using field transducers (Table 1), greater waveaction occurs at Woods Cove, Victoria Beach, andTreasure Island. Sand periodically accumulates onrock surfaces at most of our study sites (Table 1), butgreatest sand influence is found at Thousand Stepsand Monarch Bay. The study sites support Lottia
gigantea populations at similar, mid-shore tidal eleva-tions on flattened rock benches, large boulders, and onpatches of rocky habitat often associated with musselcommunities. American black oystercatchers werenever observed at these sites during the study.
The 8 study sites differed in the amount of humanuse and disturbance. Recent studies (Murray 1998,Murray et al. 1999) have shown that human visitationcan be high and that intertidal invertebrates are rou-tinely collected at all of our study sites, including the4 longstanding MPAs (Table 2). These reports were
113
Study site (abbreviation) Latitude, longitude Geologic formation Maximum wave force Sand cover (m s–1) (%)
Crystal Cove (CRC)a 33° 34’ 13’’ N, 117° 50’ 15’’ W Tm 4.89 ± 0.08 16.3 ± 3.8Shaw’s Cove (SHW)a 33° 32’ 42’’ N, 117° 47’ 57’’ W Tso 4.86 ± 0.17 10.9 ± 2.9Woods Cove (WDS) 33° 31’ 42’’ N, 117° 46’ 05’’ W Tso 7.22 ± 0.57 0.5 ± 0.9Victoria Beach (VIC) 33° 31’ 11’’ N, 117° 45’ 52’’ W Tso 6.84 ± 0.34 14.4 ± 4.8Treasure Island (TRI) 33° 30’ 48’’ N, 117° 45’ 33’’ W Tso 6.23 ± 0.25 1.6 ± 2.3Thousand Steps (THS) 33° 29’ 55’’ N, 117° 44’ 35’’ W Tso 4.93 ± 0.14 20.4 ± 4.4Monarch Bay (MBY)a 33° 29’ 03’’ N, 117° 43’ 56’’ W Tso 5.17 ± 0.21 21.8 ± 3.0Dana Point (DPT)a 33° 27’ 35’’ N, 117° 42’ 52’’ W Tso 5.15 ± 0.27 16.5 ± 3.5
Table 1. Study-site characteristics, including latitude and longitude, substratum geology (Tm = Monterey Formation in the Ter-tiary Period; Tso = San Onofre Breccia in the Tertiary Period), maximum wave force (mean ± SE; n = 10–36), and sand cover(mean ± SE; n = 20) for 0.15 m2 plots located in adjacent Silvetia compressa zone. Maximum daily wave force was determinedusing field transducers (Bell & Denny 1994); wave-force and sand-cover measurements were taken during autumn 1996 andspring 1997 (see Sapper & Murray 2003 for additional details). aSites located within intertidal MPAs designated between1969–1972. Remaining sites were accorded similar MPA status in 1994 but sites were not signed and the public was largely
unaware of this change in status during the study. See Fig. 1 for site locations
SHW
TRI
MBYTHS
DPT
VICWDS
CRC
Newport Bay
Upper NewportEcological Reserve
Newport Beach MLR
Irvine CoastMLR
Laguna Beach MLR
South Laguna MLR
Niguel MLR
Dana Point P a c i f i c
O c e a n118°00'
118°00'
33°30'
0 5
km
N
S
W E
Heisler ParkEcological Reserve
0 200
kmC
al i fo
rnia
Studyarea
MLR
Fig. 1. Map of the 8 southern California study sites. CRC: Crystal Cove,SHW: Shaw’s Cove, WDS: Woods Cove, VIC: Victoria Beach, TRI: Trea-sure Island, THS: Thousand Steps, MBY: Monarch Bay, DPT: Dana Point.Shaded areas represent boundaries of local MPAs (California MarineLife Refuges [MLRs] and Ecological Reserves) established prior to 1994
in which collecting of invertebrates is prohibited
Mar Ecol Prog Ser 257: 111–124, 2003
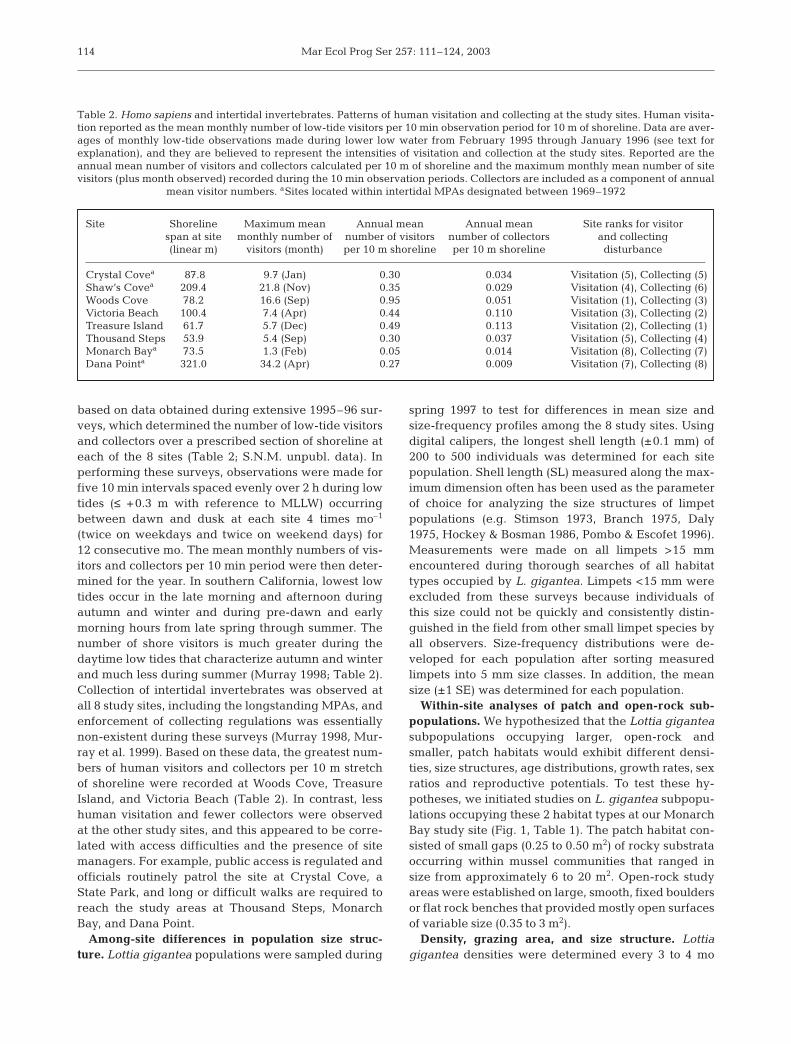
based on data obtained during extensive 1995–96 sur-veys, which determined the number of low-tide visitorsand collectors over a prescribed section of shoreline ateach of the 8 sites (Table 2; S.N.M. unpubl. data). Inperforming these surveys, observations were made forfive 10 min intervals spaced evenly over 2 h during lowtides (≤ +0.3 m with reference to MLLW) occurringbetween dawn and dusk at each site 4 times mo–1
(twice on weekdays and twice on weekend days) for12 consecutive mo. The mean monthly numbers of vis-itors and collectors per 10 min period were then deter-mined for the year. In southern California, lowest lowtides occur in the late morning and afternoon duringautumn and winter and during pre-dawn and earlymorning hours from late spring through summer. Thenumber of shore visitors is much greater during thedaytime low tides that characterize autumn and winterand much less during summer (Murray 1998; Table 2).Collection of intertidal invertebrates was observed atall 8 study sites, including the longstanding MPAs, andenforcement of collecting regulations was essentiallynon-existent during these surveys (Murray 1998, Mur-ray et al. 1999). Based on these data, the greatest num-bers of human visitors and collectors per 10 m stretchof shoreline were recorded at Woods Cove, TreasureIsland, and Victoria Beach (Table 2). In contrast, lesshuman visitation and fewer collectors were observedat the other study sites, and this appeared to be corre-lated with access difficulties and the presence of sitemanagers. For example, public access is regulated andofficials routinely patrol the site at Crystal Cove, aState Park, and long or difficult walks are required toreach the study areas at Thousand Steps, MonarchBay, and Dana Point.
Among-site differences in population size struc-ture. Lottia gigantea populations were sampled during
spring 1997 to test for differences in mean size andsize-frequency profiles among the 8 study sites. Usingdigital calipers, the longest shell length (±0.1 mm) of200 to 500 individuals was determined for each sitepopulation. Shell length (SL) measured along the max-imum dimension often has been used as the parameterof choice for analyzing the size structures of limpetpopulations (e.g. Stimson 1973, Branch 1975, Daly1975, Hockey & Bosman 1986, Pombo & Escofet 1996).Measurements were made on all limpets >15 mmencountered during thorough searches of all habitattypes occupied by L. gigantea. Limpets <15 mm wereexcluded from these surveys because individuals ofthis size could not be quickly and consistently distin-guished in the field from other small limpet species byall observers. Size-frequency distributions were de-veloped for each population after sorting measuredlimpets into 5 mm size classes. In addition, the meansize (±1 SE) was determined for each population.
Within-site analyses of patch and open-rock sub-populations. We hypothesized that the Lottia giganteasubpopulations occupying larger, open-rock andsmaller, patch habitats would exhibit different densi-ties, size structures, age distributions, growth rates, sexratios and reproductive potentials. To test these hy-potheses, we initiated studies on L. gigantea subpopu-lations occupying these 2 habitat types at our MonarchBay study site (Fig. 1, Table 1). The patch habitat con-sisted of small gaps (0.25 to 0.50 m2) of rocky substrataoccurring within mussel communities that ranged insize from approximately 6 to 20 m2. Open-rock studyareas were established on large, smooth, fixed bouldersor flat rock benches that provided mostly open surfacesof variable size (0.35 to 3 m2).
Density, grazing area, and size structure. Lottiagigantea densities were determined every 3 to 4 mo
114
Site Shoreline Maximum mean Annual mean Annual mean Site ranks for visitor span at site monthly number of number of visitors number of collectors and collecting (linear m) visitors (month) per 10 m shoreline per 10 m shoreline disturbance
Crystal Covea 87.8 9.7 (Jan) 0.30 0.034 Visitation (5), Collecting (5)Shaw’s Covea 209.4 21.8 (Nov) 0.35 0.029 Visitation (4), Collecting (6)Woods Cove 78.2 16.6 (Sep) 0.95 0.051 Visitation (1), Collecting (3)Victoria Beach 100.4 7.4 (Apr) 0.44 0.110 Visitation (3), Collecting (2)Treasure Island 61.7 5.7 (Dec) 0.49 0.113 Visitation (2), Collecting (1)Thousand Steps 53.9 5.4 (Sep) 0.30 0.037 Visitation (5), Collecting (4)Monarch Baya 73.5 1.3 (Feb) 0.05 0.014 Visitation (8), Collecting (7)Dana Pointa 321.0 34.2 (Apr) 0.27 0.009 Visitation (7), Collecting (8)
Table 2. Homo sapiens and intertidal invertebrates. Patterns of human visitation and collecting at the study sites. Human visita-tion reported as the mean monthly number of low-tide visitors per 10 min observation period for 10 m of shoreline. Data are aver-ages of monthly low-tide observations made during lower low water from February 1995 through January 1996 (see text forexplanation), and they are believed to represent the intensities of visitation and collection at the study sites. Reported are theannual mean number of visitors and collectors calculated per 10 m of shoreline and the maximum monthly mean number of sitevisitors (plus month observed) recorded during the 10 min observation periods. Collectors are included as a component of annual
mean visitor numbers. aSites located within intertidal MPAs designated between 1969–1972
Kido & Murray: Variation in Lottia gigantea populations
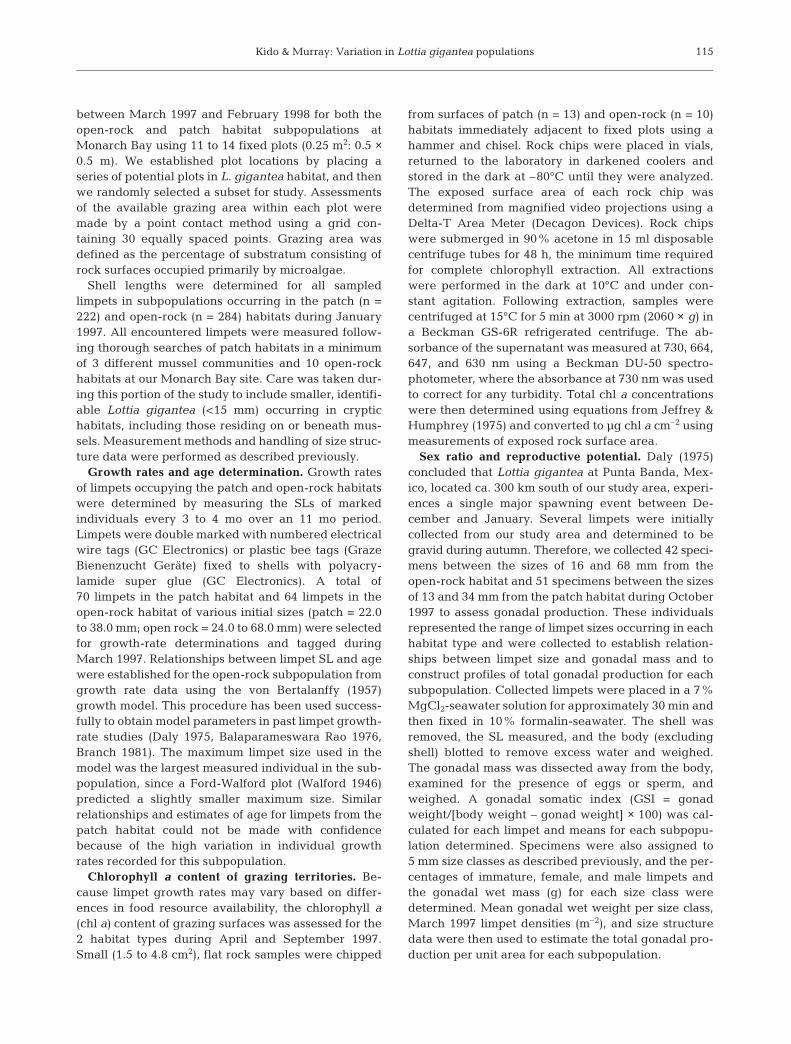
between March 1997 and February 1998 for both theopen-rock and patch habitat subpopulations atMonarch Bay using 11 to 14 fixed plots (0.25 m2: 0.5 ×0.5 m). We established plot locations by placing aseries of potential plots in L. gigantea habitat, and thenwe randomly selected a subset for study. Assessmentsof the available grazing area within each plot weremade by a point contact method using a grid con-taining 30 equally spaced points. Grazing area wasdefined as the percentage of substratum consisting ofrock surfaces occupied primarily by microalgae.
Shell lengths were determined for all sampledlimpets in subpopulations occurring in the patch (n =222) and open-rock (n = 284) habitats during January1997. All encountered limpets were measured follow-ing thorough searches of patch habitats in a minimumof 3 different mussel communities and 10 open-rockhabitats at our Monarch Bay site. Care was taken dur-ing this portion of the study to include smaller, identifi-able Lottia gigantea (<15 mm) occurring in cryptichabitats, including those residing on or beneath mus-sels. Measurement methods and handling of size struc-ture data were performed as described previously.
Growth rates and age determination. Growth ratesof limpets occupying the patch and open-rock habitatswere determined by measuring the SLs of markedindividuals every 3 to 4 mo over an 11 mo period.Limpets were double marked with numbered electricalwire tags (GC Electronics) or plastic bee tags (GrazeBienenzucht Geräte) fixed to shells with polyacry-lamide super glue (GC Electronics). A total of70 limpets in the patch habitat and 64 limpets in theopen-rock habitat of various initial sizes (patch = 22.0to 38.0 mm; open rock = 24.0 to 68.0 mm) were selectedfor growth-rate determinations and tagged duringMarch 1997. Relationships between limpet SL and agewere established for the open-rock subpopulation fromgrowth rate data using the von Bertalanffy (1957)growth model. This procedure has been used success-fully to obtain model parameters in past limpet growth-rate studies (Daly 1975, Balaparameswara Rao 1976,Branch 1981). The maximum limpet size used in themodel was the largest measured individual in the sub-population, since a Ford-Walford plot (Walford 1946)predicted a slightly smaller maximum size. Similarrelationships and estimates of age for limpets from thepatch habitat could not be made with confidencebecause of the high variation in individual growthrates recorded for this subpopulation.
Chlorophyll a content of grazing territories. Be-cause limpet growth rates may vary based on differ-ences in food resource availability, the chlorophyll a(chl a) content of grazing surfaces was assessed for the2 habitat types during April and September 1997.Small (1.5 to 4.8 cm2), flat rock samples were chipped
from surfaces of patch (n = 13) and open-rock (n = 10)habitats immediately adjacent to fixed plots using ahammer and chisel. Rock chips were placed in vials,returned to the laboratory in darkened coolers andstored in the dark at –80°C until they were analyzed.The exposed surface area of each rock chip wasdetermined from magnified video projections using aDelta-T Area Meter (Decagon Devices). Rock chipswere submerged in 90% acetone in 15 ml disposablecentrifuge tubes for 48 h, the minimum time requiredfor complete chlorophyll extraction. All extractionswere performed in the dark at 10°C and under con-stant agitation. Following extraction, samples werecentrifuged at 15°C for 5 min at 3000 rpm (2060 × g) ina Beckman GS-6R refrigerated centrifuge. The ab-sorbance of the supernatant was measured at 730, 664,647, and 630 nm using a Beckman DU-50 spectro-photometer, where the absorbance at 730 nm was usedto correct for any turbidity. Total chl a concentrationswere then determined using equations from Jeffrey &Humphrey (1975) and converted to µg chl a cm–2 usingmeasurements of exposed rock surface area.
Sex ratio and reproductive potential. Daly (1975)concluded that Lottia gigantea at Punta Banda, Mex-ico, located ca. 300 km south of our study area, experi-ences a single major spawning event between De-cember and January. Several limpets were initiallycollected from our study area and determined to begravid during autumn. Therefore, we collected 42 speci-mens between the sizes of 16 and 68 mm from theopen-rock habitat and 51 specimens between the sizesof 13 and 34 mm from the patch habitat during October1997 to assess gonadal production. These individualsrepresented the range of limpet sizes occurring in eachhabitat type and were collected to establish relation-ships between limpet size and gonadal mass and toconstruct profiles of total gonadal production for eachsubpopulation. Collected limpets were placed in a 7%MgCl2-seawater solution for approximately 30 min andthen fixed in 10% formalin-seawater. The shell wasremoved, the SL measured, and the body (excludingshell) blotted to remove excess water and weighed.The gonadal mass was dissected away from the body,examined for the presence of eggs or sperm, andweighed. A gonadal somatic index (GSI = gonadweight/[body weight – gonad weight] × 100) was cal-culated for each limpet and means for each subpopu-lation determined. Specimens were also assigned to5 mm size classes as described previously, and the per-centages of immature, female, and male limpets andthe gonadal wet mass (g) for each size class weredetermined. Mean gonadal wet weight per size class,March 1997 limpet densities (m–2), and size structuredata were then used to estimate the total gonadal pro-duction per unit area for each subpopulation.
115
Mar Ecol Prog Ser 257: 111–124, 2003
Statistical analyses. Size profiles for limpet popula-tions from the 8 sites and from the patch and open-rockhabitats at Monarch Bay were analyzed using a G-testprocedure described by Zar (1999, p. 505). To performthese analyses, limpets ≥60 mm SL were combined intoa single size class, and an arbitrary value (0.01) wasassigned to each frequency cell to eliminate zeros sothat logs could be calculated. Data for the remainingamong-site and within-site comparisons were analyzedusing either ANOVA or t-test statistical procedures.For analyses using ANOVA models, data sets werefirst examined for heterogeneity of variances usingCochran’s test, transformed if necessary, and then sub-jected to ANOVA procedures. ANOVA is robust to non-normality (Underwood 1997); therefore, departuresfrom normality were not considered a reason to rejectthe parametric procedure. When the homoscedasticitycriterion could not be met by transformation and vari-ance departures were judged to be large, randomiza-tion tests were used to test the null hypothesis of no dif-ference among groups. As suggested by Manly (1997),random reassignment of the data was repeated 1000
times for setting α at 0.05. Randomization tests wereused to test for significant differences in mean Lottiagigantea SLs among our 8 sites and the gonadal pro-duction among size classes in each habitat. Followingsignificant results, differences among means were ex-amined a posteriori using the Student-Newman-Keuls’multiple comparison test (ANOVA) or Dunn’s multiplerange test (randomization tests).
Because fixed plots were used to determine limpetdensities and available grazing area, data were ana-lyzed by a 2-way ANOVA with repeated measuresto test for differences between subpopulations andamong sampling periods. Three plots were randomlyeliminated from the patch samples to achieve equalsample sizes, a requirement for this analysis. In thismodel both subpopulations and sampling periodswere treated as fixed factors. Because separate rockpieces for each sampling period were used in deter-mining the chl a content of grazing territories, datawere analyzed using a 2-way ANOVA to test fordifferences between chl a in the 2 habitat typesand among sampling periods.
Calculated annual growth rates oflimpets from both subpopulations wereplotted as a function of initial SL andsubjected to regression analysis to de-termine growth-rate functions for sub-populations from the 2 habitat types.Analysis of covariance (ANCOVA) wasperformed to test whether growth ratesof limpets in the 2 habitats differed withthe initial SL of monitored individualsset as the covariate. Using only limpets<40 mm SL, growth-rate data for bothsubpopulations were subjected to sepa-rate 1-way ANOVAs to test for dif-ferences in growth rates among sam-pling periods for the 2 subpopulations.Preliminary analysis of these data byANCOVA, revealed no significant ef-fect of initial SL on the annual growth oflimpets <40 mm SL in either habitat.Separate 1-way ANOVAs were per-formed for each habitat type instead ofa crossed model because sample sizesvaried greatly between the 2 sub-populations.
To determine whether size struc-tures, gonadal mass, and the gonadalsomatic index differed between thesubpopulations occupying the 2 habitattypes, each data set was subjected to a2-tailed t-test. Because of differences ingroup variances, Welch’s approximatet-test, a more conservative and reliable
116
MSL (mm)MSL (mm)
75-80
15-2020-2525-30
30-35
35-40
40-4545-5050-5555-60
60-65
65-7070-75
70-7565-70
60-65
55-6050-5545-5040-45
35-40
30-35
25-3020-2515-20
10
20
30
40 Monarch Baya
n = 506
0
10
20
30
40Shaw’s Covea
n = 553
10
20
30
40 Treasure Islandn = 301
0
10
20
30
40Dana Pointa
n = 243
75-80
0
10
20
30
40 Crystal Covea
n = 313
Per
cent
age
of p
opul
atio
n
0
10
20
30
40Victoria Beachn = 360
0
10
20
30
40Woods Coven = 327
10
20
30
40 Thousand Stepsn = 354
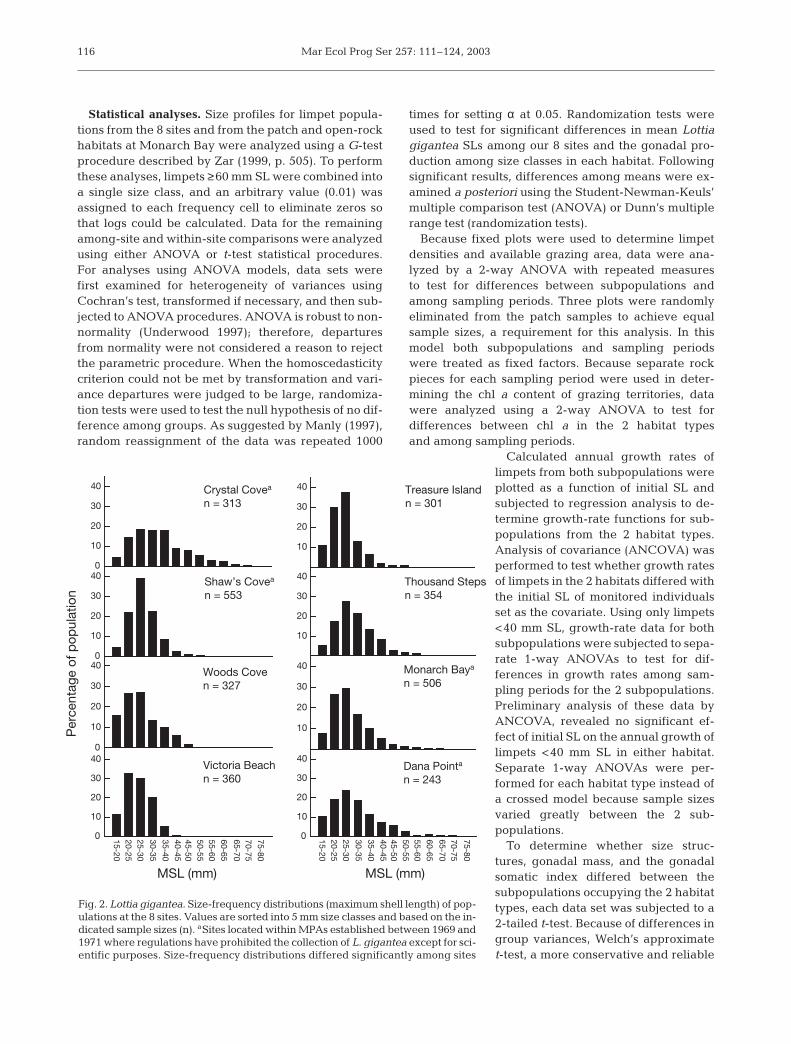
Fig. 2. Lottia gigantea. Size-frequency distributions (maximum shell length) of pop-ulations at the 8 sites. Values are sorted into 5 mm size classes and based on the in-dicated sample sizes (n). aSites located within MPAs established between 1969 and1971 where regulations have prohibited the collection of L. gigantea except for sci-entific purposes. Size-frequency distributions differed significantly among sites
Kido & Murray: Variation in Lottia gigantea populations
test than the traditional t-test under these circum-stances (Quinn & Keough 2002), was employed.Gonadal mass was also plotted against SL for limpetsin both subpopulations and regression analysis used todescribe the relationship between gonadal mass andlimpet size.
RESULTS
Among-site differences in population size structure
The mean SL (p << 0.001) and size-frequency distrib-utions (G = 121.29; df = 70; p < 0.001) of Lottia giganteapopulations differed significantly among the 8 studysites (Fig. 2, Table 3). The largest mean SL (35.2 mm)and highest frequency of larger-sized limpets wererecorded for the Crystal Cove MPA population. Thelargest limpet SLs found at the 8 sites ranged from41.9 to 79.0 mm; the largest measured individualwas obtained at Thousand Steps, a difficult to ac-cess, newly-established MPA. The smallest mean SLs,fewest numbers of larger-sized limpets, and the small-est SLs occurred at Victoria Beach, Treasure Island,and Woods Cove (newly-established MPAs).
Within-site analyses of patch and open-rock subpopulations
Density and size structure
The densities of Lottia gigantea subpopulations atMonarch Bay differed significantly (2-way ANOVA)
between habitat types (p < 0.001) and over time(p < 0.001); a significant interaction also was foundbetween habitat and time (p < 0.01) (Table 4). L. gigan-tea densities in the patch habitats were more thantwice those obtained for the subpopulation occupyingopen-rock surfaces during each of the 4 assessmentperiods. Densities of L. gigantea were lower in Marchand July 1997 than in October 1997 and February 1998in both habitats. However, as supported by the signifi-cant interaction, the patch subpopulation exhibited agreater increase in density over time compared withthe open-rock subpopulation, presumably due togreater recruitment or the migration of juveniles fromnearby crevices or other cryptic microhabitats.
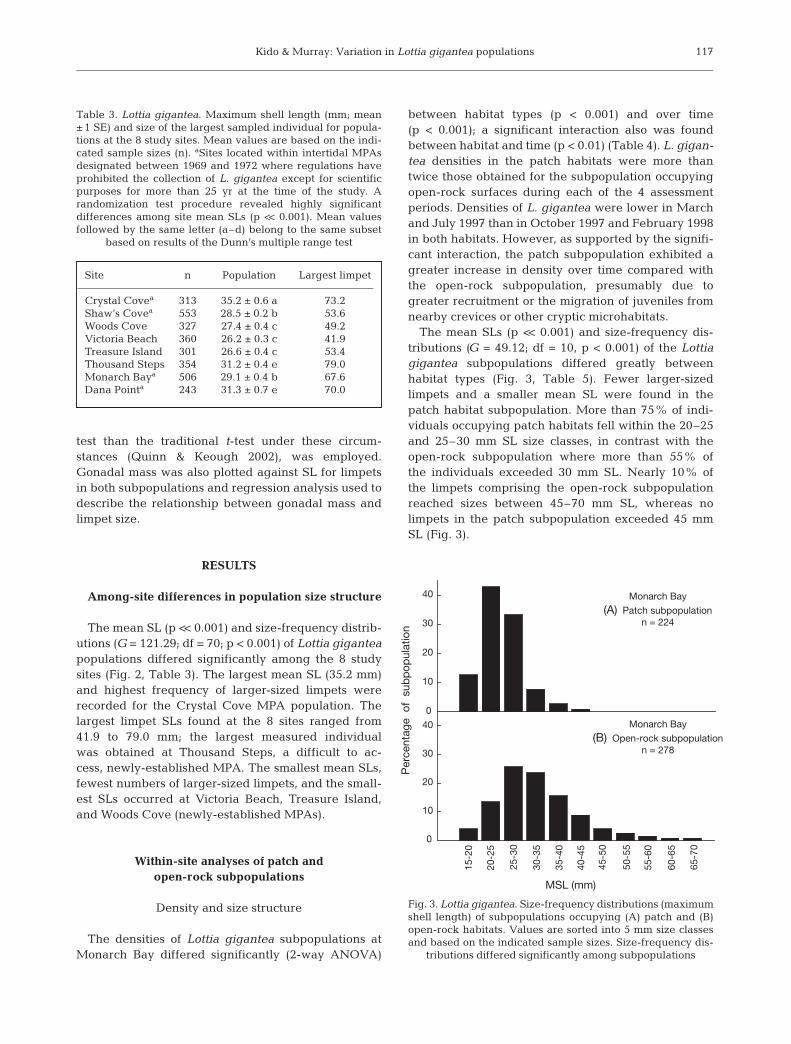
The mean SLs (p << 0.001) and size-frequency dis-tributions (G = 49.12; df = 10, p < 0.001) of the Lottiagigantea subpopulations differed greatly betweenhabitat types (Fig. 3, Table 5). Fewer larger-sizedlimpets and a smaller mean SL were found in thepatch habitat subpopulation. More than 75% of indi-viduals occupying patch habitats fell within the 20–25and 25–30 mm SL size classes, in contrast with theopen-rock subpopulation where more than 55% ofthe individuals exceeded 30 mm SL. Nearly 10% ofthe limpets comprising the open-rock subpopulationreached sizes between 45–70 mm SL, whereas nolimpets in the patch subpopulation exceeded 45 mmSL (Fig. 3).
117
Site n Population Largest limpet
Crystal Covea 313 35.2 ± 0.6 a 73.2Shaw’s Covea 553 28.5 ± 0.2 b 53.6Woods Cove 327 27.4 ± 0.4 c 49.2Victoria Beach 360 26.2 ± 0.3 c 41.9Treasure Island 301 26.6 ± 0.4 c 53.4Thousand Steps 354 31.2 ± 0.4 e 79.0Monarch Baya 506 29.1 ± 0.4 b 67.6Dana Pointa 243 31.3 ± 0.7 e 70.0
Table 3. Lottia gigantea. Maximum shell length (mm; mean± 1 SE) and size of the largest sampled individual for popula-tions at the 8 study sites. Mean values are based on the indi-cated sample sizes (n). aSites located within intertidal MPAsdesignated between 1969 and 1972 where regulations haveprohibited the collection of L. gigantea except for scientificpurposes for more than 25 yr at the time of the study. Arandomization test procedure revealed highly significantdifferences among site mean SLs (p << 0.001). Mean valuesfollowed by the same letter (a–d) belong to the same subset
based on results of the Dunn’s multiple range test
0
10
20
30
40 Monarch Bay
(A) Patch subpopulationn = 224
Monarch Bay
(B) Open-rock subpopulationn = 278
Per
cent
age
of
sub
pop
ulat
ion
MSL (mm)
0
10
20
30
40
15-2
0
20-2
5
40-4
5
30-3
5
45-5
0
35-4
0
25-3
0
55-6
0
60-6
5
65-7
0
50-5
5
Fig. 3. Lottia gigantea. Size-frequency distributions (maximumshell length) of subpopulations occupying (A) patch and (B)open-rock habitats. Values are sorted into 5 mm size classesand based on the indicated sample sizes. Size-frequency dis-
tributions differed significantly among subpopulations
Mar Ecol Prog Ser 257: 111–124, 2003
Shell growth rates and age determination
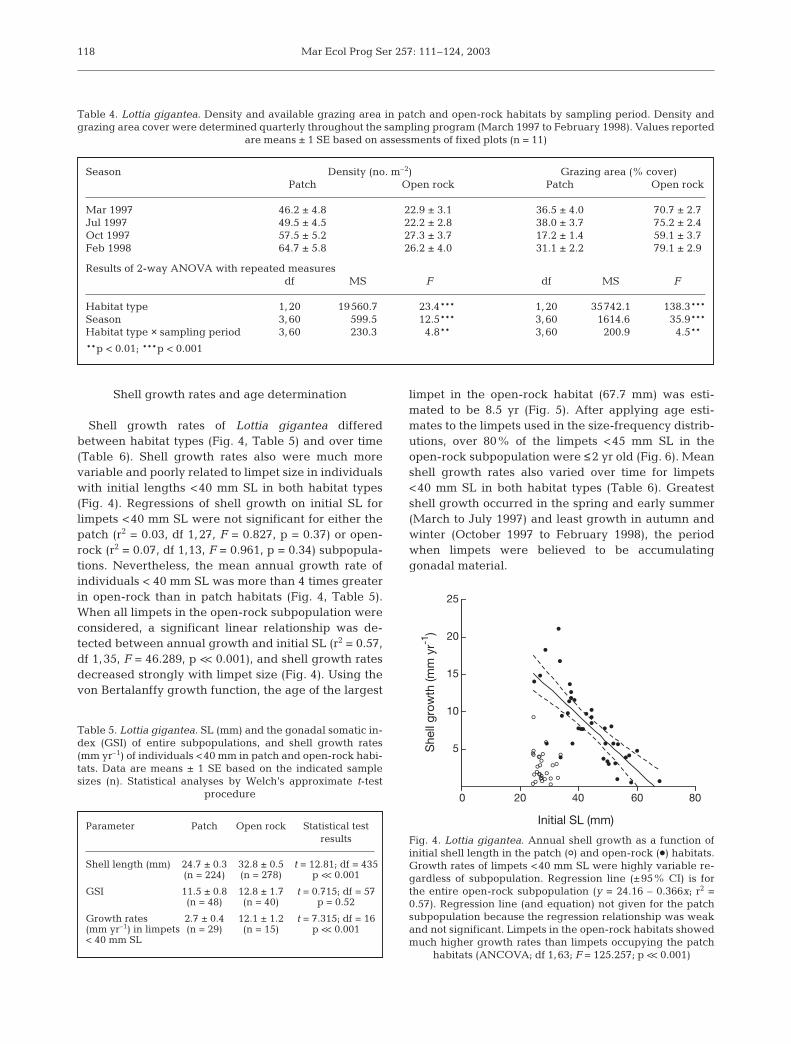
Shell growth rates of Lottia gigantea differedbetween habitat types (Fig. 4, Table 5) and over time(Table 6). Shell growth rates also were much morevariable and poorly related to limpet size in individualswith initial lengths <40 mm SL in both habitat types(Fig. 4). Regressions of shell growth on initial SL forlimpets <40 mm SL were not significant for either thepatch (r2 = 0.03, df 1,27, F = 0.827, p = 0.37) or open-rock (r2 = 0.07, df 1,13, F = 0.961, p = 0.34) subpopula-tions. Nevertheless, the mean annual growth rate ofindividuals < 40 mm SL was more than 4 times greaterin open-rock than in patch habitats (Fig. 4, Table 5).When all limpets in the open-rock subpopulation wereconsidered, a significant linear relationship was de-tected between annual growth and initial SL (r2 = 0.57,df 1,35, F = 46.289, p << 0.001), and shell growth ratesdecreased strongly with limpet size (Fig. 4). Using thevon Bertalanffy growth function, the age of the largest
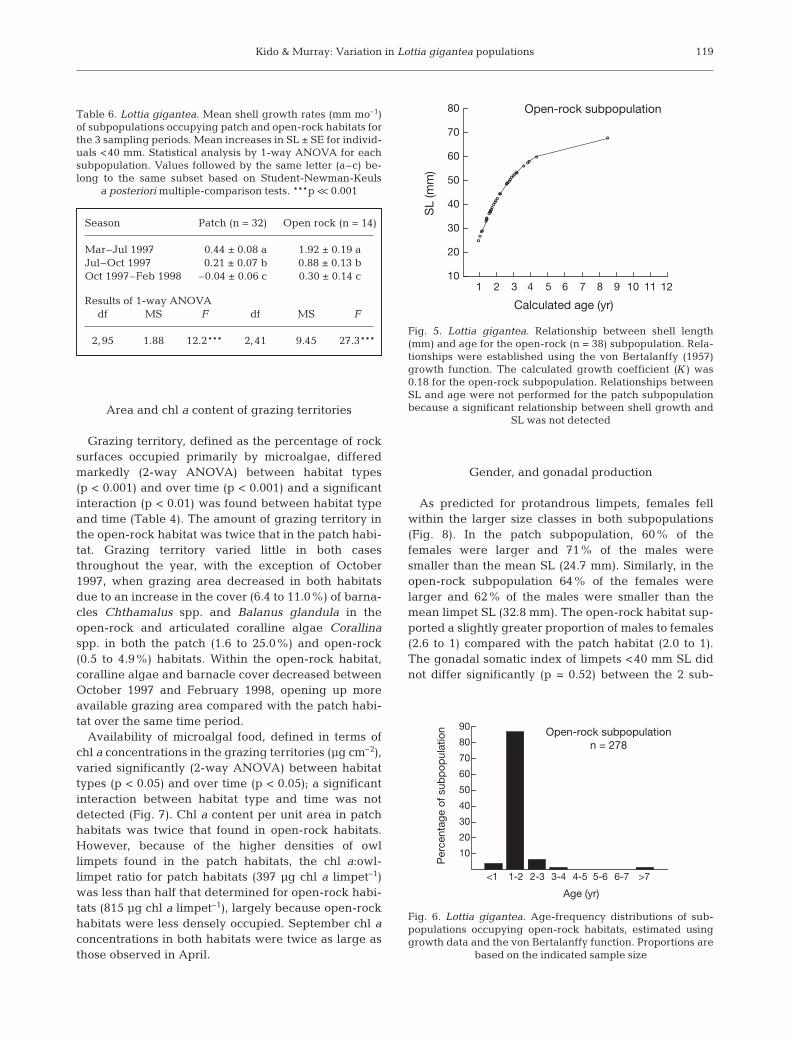
limpet in the open-rock habitat (67.7 mm) was esti-mated to be 8.5 yr (Fig. 5). After applying age esti-mates to the limpets used in the size-frequency distrib-utions, over 80% of the limpets <45 mm SL in theopen-rock subpopulation were ≤2 yr old (Fig. 6). Meanshell growth rates also varied over time for limpets<40 mm SL in both habitat types (Table 6). Greatestshell growth occurred in the spring and early summer(March to July 1997) and least growth in autumn andwinter (October 1997 to February 1998), the periodwhen limpets were believed to be accumulatinggonadal material.
118
Season Density (no. m–2) Grazing area (% cover)Patch Open rock Patch Open rock
Mar 1997 46.2 ± 4.8 22.9 ± 3.1 36.5 ± 4.0 70.7 ± 2.7Jul 1997 49.5 ± 4.5 22.2 ± 2.8 38.0 ± 3.7 75.2 ± 2.4Oct 1997 57.5 ± 5.2 27.3 ± 3.7 17.2 ± 1.4 59.1 ± 3.7Feb 1998 64.7 ± 5.8 26.2 ± 4.0 31.1 ± 2.2 79.1 ± 2.9
Results of 2-way ANOVA with repeated measuresdf MS F df MS F
Habitat type 1,20 19560.7 23.4*** 1,20 35742.1 138.3***Season 3,60 599.5 12.5*** 3,60 1614.6 35.9***Habitat type × sampling period 3,60 230.3 4.8** 3,60 200.9 4.5**
**p < 0.01; ***p < 0.001
Table 4. Lottia gigantea. Density and available grazing area in patch and open-rock habitats by sampling period. Density andgrazing area cover were determined quarterly throughout the sampling program (March 1997 to February 1998). Values reported
are means ± 1 SE based on assessments of fixed plots (n = 11)
Parameter Patch Open rock Statistical test results
Shell length (mm) 24.7 ± 0.3 32.8 ± 0.5 t = 12.81; df = 435(n = 224) (n = 278) p << 0.001
GSI 11.5 ± 0.8 12.8 ± 1.7 t = 0.715; df = 57(n = 48) (n = 40) p = 0.52
Growth rates 2.7 ± 0.4 12.1 ± 1.2 t = 7.315; df = 16(mm yr–1) in limpets (n = 29) (n = 15) p << 0.001< 40 mm SL
Table 5. Lottia gigantea. SL (mm) and the gonadal somatic in-dex (GSI) of entire subpopulations, and shell growth rates(mm yr–1) of individuals <40 mm in patch and open-rock habi-tats. Data are means ± 1 SE based on the indicated samplesizes (n). Statistical analyses by Welch’s approximate t-test
procedure
She
ll gr
owth
(mm
yr-1
)
Initial SL (mm)
25
20
15
10
5
0 20 40 60 80
Fig. 4. Lottia gigantea. Annual shell growth as a function ofinitial shell length in the patch (S) and open-rock (d) habitats.Growth rates of limpets <40 mm SL were highly variable re-gardless of subpopulation. Regression line (±95% CI) is forthe entire open-rock subpopulation (y = 24.16 – 0.366x; r2 =0.57). Regression line (and equation) not given for the patchsubpopulation because the regression relationship was weakand not significant. Limpets in the open-rock habitats showedmuch higher growth rates than limpets occupying the patch
habitats (ANCOVA; df 1,63; F = 125.257; p << 0.001)
Kido & Murray: Variation in Lottia gigantea populations
Area and chl a content of grazing territories
Grazing territory, defined as the percentage of rocksurfaces occupied primarily by microalgae, differedmarkedly (2-way ANOVA) between habitat types(p < 0.001) and over time (p < 0.001) and a significantinteraction (p < 0.01) was found between habitat typeand time (Table 4). The amount of grazing territory inthe open-rock habitat was twice that in the patch habi-tat. Grazing territory varied little in both casesthroughout the year, with the exception of October1997, when grazing area decreased in both habitatsdue to an increase in the cover (6.4 to 11.0%) of barna-cles Chthamalus spp. and Balanus glandula in theopen-rock and articulated coralline algae Corallinaspp. in both the patch (1.6 to 25.0%) and open-rock(0.5 to 4.9%) habitats. Within the open-rock habitat,coralline algae and barnacle cover decreased betweenOctober 1997 and February 1998, opening up moreavailable grazing area compared with the patch habi-tat over the same time period.
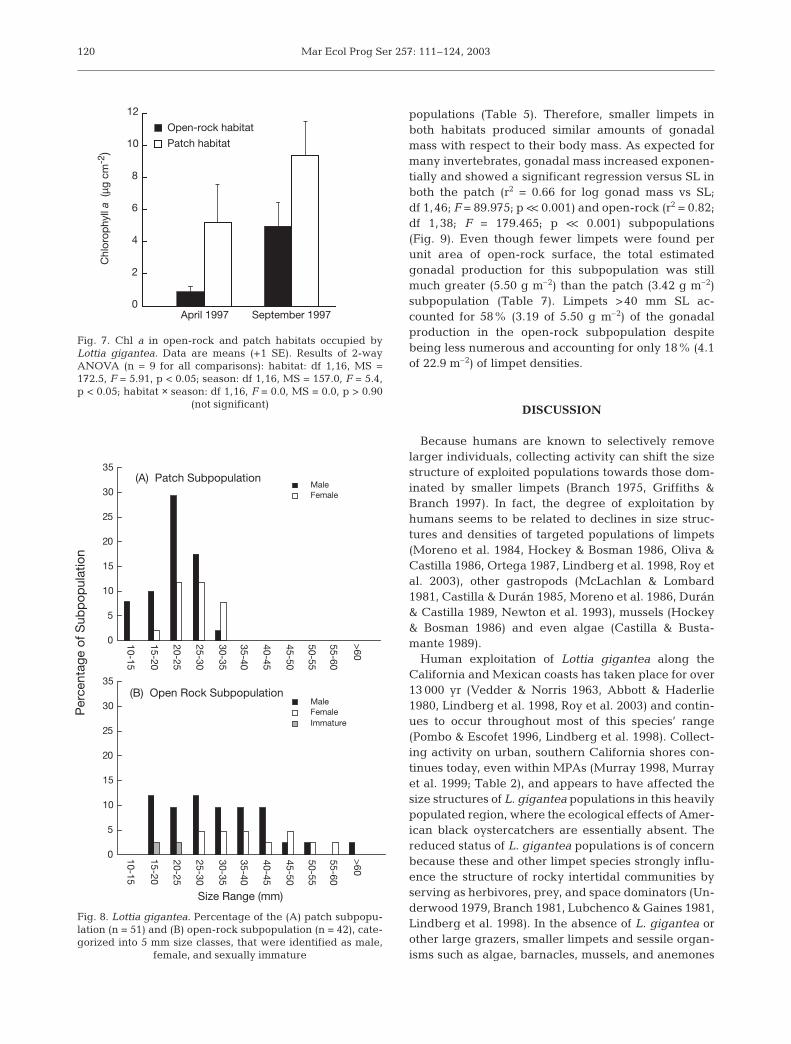
Availability of microalgal food, defined in terms ofchl a concentrations in the grazing territories (µg cm–2),varied significantly (2-way ANOVA) between habitattypes (p < 0.05) and over time (p < 0.05); a significantinteraction between habitat type and time was notdetected (Fig. 7). Chl a content per unit area in patchhabitats was twice that found in open-rock habitats.However, because of the higher densities of owllimpets found in the patch habitats, the chl a:owl-limpet ratio for patch habitats (397 µg chl a limpet–1)was less than half that determined for open-rock habi-tats (815 µg chl a limpet–1), largely because open-rockhabitats were less densely occupied. September chl aconcentrations in both habitats were twice as large asthose observed in April.
Gender, and gonadal production
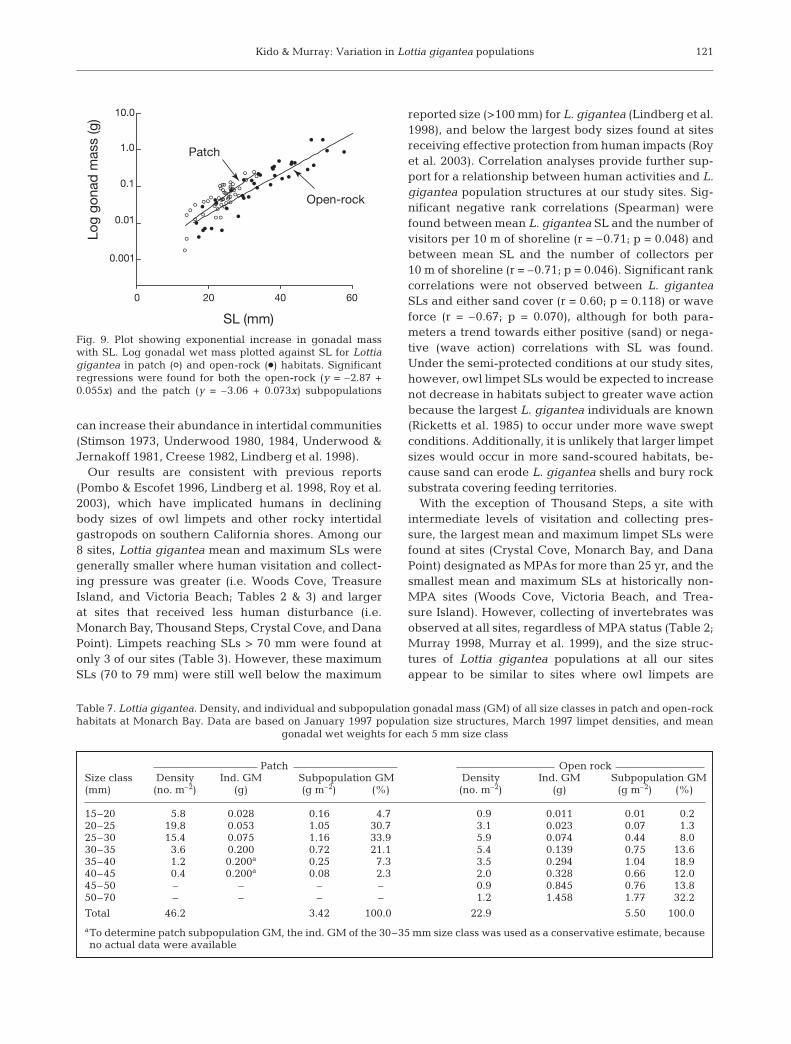
As predicted for protandrous limpets, females fellwithin the larger size classes in both subpopulations(Fig. 8). In the patch subpopulation, 60% of thefemales were larger and 71% of the males weresmaller than the mean SL (24.7 mm). Similarly, in theopen-rock subpopulation 64% of the females werelarger and 62% of the males were smaller than themean limpet SL (32.8 mm). The open-rock habitat sup-ported a slightly greater proportion of males to females(2.6 to 1) compared with the patch habitat (2.0 to 1).The gonadal somatic index of limpets <40 mm SL didnot differ significantly (p = 0.52) between the 2 sub-
119
Calculated age (yr)
10987654321 11 1210
20
30
40
50
60
70
80 Open-rock subpopulation
SL
(mm
)
Fig. 5. Lottia gigantea. Relationship between shell length(mm) and age for the open-rock (n = 38) subpopulation. Rela-tionships were established using the von Bertalanffy (1957)growth function. The calculated growth coefficient (K) was0.18 for the open-rock subpopulation. Relationships betweenSL and age were not performed for the patch subpopulationbecause a significant relationship between shell growth and
SL was not detected
Open-rock subpopulationn = 278
Per
cent
age
of s
ubp
opul
atio
n
10
20
30
40
50
60
70
80
90
Age (yr)
<1 1-2 2-3 3-4 4-5 5-6 6-7 >7
Fig. 6. Lottia gigantea. Age-frequency distributions of sub-populations occupying open-rock habitats, estimated usinggrowth data and the von Bertalanffy function. Proportions are
based on the indicated sample size
Season Patch (n = 32) Open rock (n = 14)
Mar–Jul 1997 0.44 ± 0.08 a 1.92 ± 0.19 aJul–Oct 1997 0.21 ± 0.07 b 0.88 ± 0.13 bOct 1997–Feb 1998 –0.04 ± 0.06 c 0.30 ± 0.14 c
Results of 1-way ANOVAdf MS F df MS F
2,95 1.88 12.2*** 2,41 9.45 27.3***
Table 6. Lottia gigantea. Mean shell growth rates (mm mo–1)of subpopulations occupying patch and open-rock habitats forthe 3 sampling periods. Mean increases in SL ± SE for individ-uals <40 mm. Statistical analysis by 1-way ANOVA for eachsubpopulation. Values followed by the same letter (a–c) be-long to the same subset based on Student-Newman-Keuls
a posteriori multiple-comparison tests. ***p << 0.001
Mar Ecol Prog Ser 257: 111–124, 2003
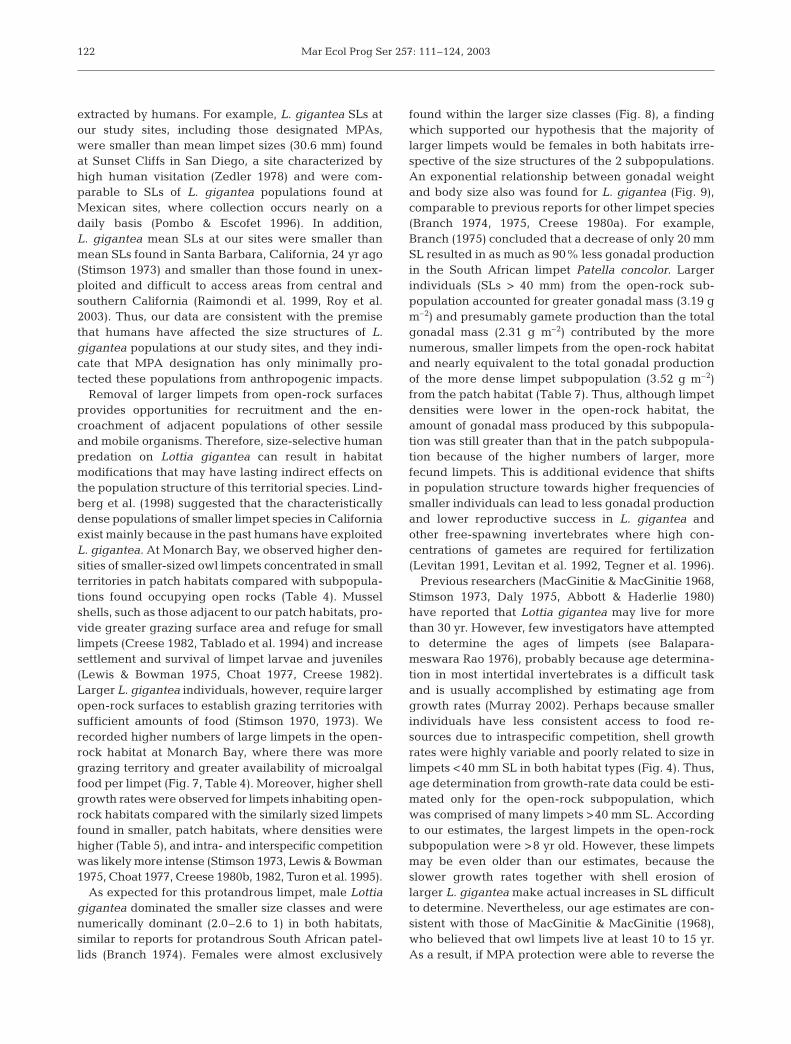
populations (Table 5). Therefore, smaller limpets inboth habitats produced similar amounts of gonadalmass with respect to their body mass. As expected formany invertebrates, gonadal mass increased exponen-tially and showed a significant regression versus SL inboth the patch (r2 = 0.66 for log gonad mass vs SL;df 1,46; F = 89.975; p << 0.001) and open-rock (r2 = 0.82;df 1,38; F = 179.465; p << 0.001) subpopulations(Fig. 9). Even though fewer limpets were found perunit area of open-rock surface, the total estimatedgonadal production for this subpopulation was stillmuch greater (5.50 g m–2) than the patch (3.42 g m–2)subpopulation (Table 7). Limpets >40 mm SL ac-counted for 58% (3.19 of 5.50 g m–2) of the gonadalproduction in the open-rock subpopulation despitebeing less numerous and accounting for only 18% (4.1of 22.9 m–2) of limpet densities.
DISCUSSION
Because humans are known to selectively removelarger individuals, collecting activity can shift the sizestructure of exploited populations towards those dom-inated by smaller limpets (Branch 1975, Griffiths &Branch 1997). In fact, the degree of exploitation byhumans seems to be related to declines in size struc-tures and densities of targeted populations of limpets(Moreno et al. 1984, Hockey & Bosman 1986, Oliva &Castilla 1986, Ortega 1987, Lindberg et al. 1998, Roy etal. 2003), other gastropods (McLachlan & Lombard1981, Castilla & Durán 1985, Moreno et al. 1986, Durán& Castilla 1989, Newton et al. 1993), mussels (Hockey& Bosman 1986) and even algae (Castilla & Busta-mante 1989).
Human exploitation of Lottia gigantea along theCalifornia and Mexican coasts has taken place for over13 000 yr (Vedder & Norris 1963, Abbott & Haderlie1980, Lindberg et al. 1998, Roy et al. 2003) and contin-ues to occur throughout most of this species’ range(Pombo & Escofet 1996, Lindberg et al. 1998). Collect-ing activity on urban, southern California shores con-tinues today, even within MPAs (Murray 1998, Murrayet al. 1999; Table 2), and appears to have affected thesize structures of L. gigantea populations in this heavilypopulated region, where the ecological effects of Amer-ican black oystercatchers are essentially absent. Thereduced status of L. gigantea populations is of concernbecause these and other limpet species strongly influ-ence the structure of rocky intertidal communities byserving as herbivores, prey, and space dominators (Un-derwood 1979, Branch 1981, Lubchenco & Gaines 1981,Lindberg et al. 1998). In the absence of L. gigantea orother large grazers, smaller limpets and sessile organ-isms such as algae, barnacles, mussels, and anemones
120
Open-rock habitat
Patch habitat
Chl
orop
hyll
a (µ
g cm
-2)
0
2
4
6
8
10
12
April 1997 September 1997
Fig. 7. Chl a in open-rock and patch habitats occupied by Lottia gigantea. Data are means (+1 SE). Results of 2-wayANOVA (n = 9 for all comparisons): habitat: df 1,16, MS =172.5, F = 5.91, p < 0.05; season: df 1,16, MS = 157.0, F = 5.4, p < 0.05; habitat × season: df 1,16, F = 0.0, MS = 0.0, p > 0.90
(not significant)
Per
cent
age
of S
ubp
opul
atio
n
(A) Patch Subpopulation
Size Range (mm)
0
5
10
15
20
25
30
35
ImmatureFemaleMale
(B) Open Rock Subpopulation
0
5
10
15
20
25
30
35
MaleFemale
10-15
15-20
20-25
40-45
30-35
45-50
35-40
25-30
55-60
50-55
>60
10-15
15-20
20-25
40-45
30-35
45-50
35-40
25-30
55-60
50-55
>60
Fig. 8. Lottia gigantea. Percentage of the (A) patch subpopu-lation (n = 51) and (B) open-rock subpopulation (n = 42), cate-gorized into 5 mm size classes, that were identified as male,
female, and sexually immature
Kido & Murray: Variation in Lottia gigantea populations
can increase their abundance in intertidal communities(Stimson 1973, Underwood 1980, 1984, Underwood &Jernakoff 1981, Creese 1982, Lindberg et al. 1998).
Our results are consistent with previous reports(Pombo & Escofet 1996, Lindberg et al. 1998, Roy et al.2003), which have implicated humans in decliningbody sizes of owl limpets and other rocky intertidalgastropods on southern California shores. Among our8 sites, Lottia gigantea mean and maximum SLs weregenerally smaller where human visitation and collect-ing pressure was greater (i.e. Woods Cove, TreasureIsland, and Victoria Beach; Tables 2 & 3) and largerat sites that received less human disturbance (i.e.Monarch Bay, Thousand Steps, Crystal Cove, and DanaPoint). Limpets reaching SLs > 70 mm were found atonly 3 of our sites (Table 3). However, these maximumSLs (70 to 79 mm) were still well below the maximum
reported size (>100 mm) for L. gigantea (Lindberg et al.1998), and below the largest body sizes found at sitesreceiving effective protection from human impacts (Royet al. 2003). Correlation analyses provide further sup-port for a relationship between human activities and L.gigantea population structures at our study sites. Sig-nificant negative rank correlations (Spearman) werefound between mean L. gigantea SL and the number ofvisitors per 10 m of shoreline (r = –0.71; p = 0.048) andbetween mean SL and the number of collectors per10 m of shoreline (r = –0.71; p = 0.046). Significant rankcorrelations were not observed between L. giganteaSLs and either sand cover (r = 0.60; p = 0.118) or waveforce (r = –0.67; p = 0.070), although for both para-meters a trend towards either positive (sand) or nega-tive (wave action) correlations with SL was found.Under the semi-protected conditions at our study sites,however, owl limpet SLs would be expected to increasenot decrease in habitats subject to greater wave actionbecause the largest L. gigantea individuals are known(Ricketts et al. 1985) to occur under more wave sweptconditions. Additionally, it is unlikely that larger limpetsizes would occur in more sand-scoured habitats, be-cause sand can erode L. gigantea shells and bury rocksubstrata covering feeding territories.
With the exception of Thousand Steps, a site withintermediate levels of visitation and collecting pres-sure, the largest mean and maximum limpet SLs werefound at sites (Crystal Cove, Monarch Bay, and DanaPoint) designated as MPAs for more than 25 yr, and thesmallest mean and maximum SLs at historically non-MPA sites (Woods Cove, Victoria Beach, and Trea-sure Island). However, collecting of invertebrates wasobserved at all sites, regardless of MPA status (Table 2;Murray 1998, Murray et al. 1999), and the size struc-tures of Lottia gigantea populations at all our sitesappear to be similar to sites where owl limpets are
121
Log
gona
d m
ass
(g)
SL (mm)
0 20 40 60
0.001
0.01
0.1
10.0
1.0
Open-rock
Patch
Fig. 9. Plot showing exponential increase in gonadal masswith SL. Log gonadal wet mass plotted against SL for Lottiagigantea in patch (S) and open-rock (D) habitats. Significantregressions were found for both the open-rock (y = –2.87 +0.055x) and the patch (y = –3.06 + 0.073x) subpopulations
Patch Open rockSize class Density Ind. GM Subpopulation GM Density Ind. GM Subpopulation GM(mm) (no. m–2) (g) (g m–2) (%) (no. m–2) (g) (g m–2) (%)
15–20 5.8 0.028 0.16 4.7 0.9 0.011 0.01 0.220–25 19.8 0.053 1.05 30.7 3.1 0.023 0.07 1.325–30 15.4 0.075 1.16 33.9 5.9 0.074 0.44 8.030–35 3.6 0.200 0.72 21.1 5.4 0.139 0.75 13.635–40 1.2 0.200a 0.25 7.3 3.5 0.294 1.04 18.940–45 0.4 0.200a 0.08 2.3 2.0 0.328 0.66 12.045–50 – – – – 0.9 0.845 0.76 13.850–70 – – – – 1.2 1.458 1.77 32.2
Total 46.2 3.42 100.00 22.9 5.50 100.00
aTo determine patch subpopulation GM, the ind. GM of the 30–35 mm size class was used as a conservative estimate, becauseno actual data were available
Table 7. Lottia gigantea. Density, and individual and subpopulation gonadal mass (GM) of all size classes in patch and open-rockhabitats at Monarch Bay. Data are based on January 1997 population size structures, March 1997 limpet densities, and mean
gonadal wet weights for each 5 mm size class
Mar Ecol Prog Ser 257: 111–124, 2003
extracted by humans. For example, L. gigantea SLs atour study sites, including those designated MPAs,were smaller than mean limpet sizes (30.6 mm) foundat Sunset Cliffs in San Diego, a site characterized byhigh human visitation (Zedler 1978) and were com-parable to SLs of L. gigantea populations found atMexican sites, where collection occurs nearly on adaily basis (Pombo & Escofet 1996). In addition, L. gigantea mean SLs at our sites were smaller thanmean SLs found in Santa Barbara, California, 24 yr ago(Stimson 1973) and smaller than those found in unex-ploited and difficult to access areas from central andsouthern California (Raimondi et al. 1999, Roy et al.2003). Thus, our data are consistent with the premisethat humans have affected the size structures of L.gigantea populations at our study sites, and they indi-cate that MPA designation has only minimally pro-tected these populations from anthropogenic impacts.
Removal of larger limpets from open-rock surfacesprovides opportunities for recruitment and the en-croachment of adjacent populations of other sessileand mobile organisms. Therefore, size-selective humanpredation on Lottia gigantea can result in habitatmodifications that may have lasting indirect effects onthe population structure of this territorial species. Lind-berg et al. (1998) suggested that the characteristicallydense populations of smaller limpet species in Californiaexist mainly because in the past humans have exploitedL. gigantea. At Monarch Bay, we observed higher den-sities of smaller-sized owl limpets concentrated in smallterritories in patch habitats compared with subpopula-tions found occupying open rocks (Table 4). Musselshells, such as those adjacent to our patch habitats, pro-vide greater grazing surface area and refuge for smalllimpets (Creese 1982, Tablado et al. 1994) and increasesettlement and survival of limpet larvae and juveniles(Lewis & Bowman 1975, Choat 1977, Creese 1982).Larger L. gigantea individuals, however, require largeropen-rock surfaces to establish grazing territories withsufficient amounts of food (Stimson 1970, 1973). Werecorded higher numbers of large limpets in the open-rock habitat at Monarch Bay, where there was moregrazing territory and greater availability of microalgalfood per limpet (Fig. 7, Table 4). Moreover, higher shellgrowth rates were observed for limpets inhabiting open-rock habitats compared with the similarly sized limpetsfound in smaller, patch habitats, where densities werehigher (Table 5), and intra- and interspecific competitionwas likely more intense (Stimson 1973, Lewis & Bowman1975, Choat 1977, Creese 1980b, 1982, Turon et al. 1995).
As expected for this protandrous limpet, male Lottiagigantea dominated the smaller size classes and werenumerically dominant (2.0–2.6 to 1) in both habitats,similar to reports for protandrous South African patel-lids (Branch 1974). Females were almost exclusively
found within the larger size classes (Fig. 8), a findingwhich supported our hypothesis that the majority oflarger limpets would be females in both habitats irre-spective of the size structures of the 2 subpopulations.An exponential relationship between gonadal weightand body size also was found for L. gigantea (Fig. 9),comparable to previous reports for other limpet species(Branch 1974, 1975, Creese 1980a). For example,Branch (1975) concluded that a decrease of only 20 mmSL resulted in as much as 90% less gonadal productionin the South African limpet Patella concolor. Largerindividuals (SLs > 40 mm) from the open-rock sub-population accounted for greater gonadal mass (3.19 gm–2) and presumably gamete production than the totalgonadal mass (2.31 g m–2) contributed by the morenumerous, smaller limpets from the open-rock habitatand nearly equivalent to the total gonadal productionof the more dense limpet subpopulation (3.52 g m–2)from the patch habitat (Table 7). Thus, although limpetdensities were lower in the open-rock habitat, theamount of gonadal mass produced by this subpopula-tion was still greater than that in the patch subpopula-tion because of the higher numbers of larger, morefecund limpets. This is additional evidence that shiftsin population structure towards higher frequencies ofsmaller individuals can lead to less gonadal productionand lower reproductive success in L. gigantea andother free-spawning invertebrates where high con-centrations of gametes are required for fertilization(Levitan 1991, Levitan et al. 1992, Tegner et al. 1996).
Previous researchers (MacGinitie & MacGinitie 1968,Stimson 1973, Daly 1975, Abbott & Haderlie 1980)have reported that Lottia gigantea may live for morethan 30 yr. However, few investigators have attemptedto determine the ages of limpets (see Balapara-meswara Rao 1976), probably because age determina-tion in most intertidal invertebrates is a difficult taskand is usually accomplished by estimating age fromgrowth rates (Murray 2002). Perhaps because smallerindividuals have less consistent access to food re-sources due to intraspecific competition, shell growthrates were highly variable and poorly related to size inlimpets <40 mm SL in both habitat types (Fig. 4). Thus,age determination from growth-rate data could be esti-mated only for the open-rock subpopulation, whichwas comprised of many limpets >40 mm SL. Accordingto our estimates, the largest limpets in the open-rocksubpopulation were >8 yr old. However, these limpetsmay be even older than our estimates, because theslower growth rates together with shell erosion oflarger L. gigantea make actual increases in SL difficultto determine. Nevertheless, our age estimates are con-sistent with those of MacGinitie & MacGinitie (1968),who believed that owl limpets live at least 10 to 15 yr.As a result, if MPA protection were able to reverse the
122
Kido & Murray: Variation in Lottia gigantea populations
effects of long-term, size-selective human impacts,effective MPAs would take decades to change the sizestructure of L. gigantea populations based on the ageof larger limpets and the potential for direct or indirect,human-induced modifications of limpet habitats.
Acknowledgements. We acknowledge R. Seapy, D. Eernisse,and 3 anonymous reviewers for their suggestions on earlierversions of this paper. We are especially grateful to T. G.Denis, J. Moeller, A. Lowe, S. Meulmester, J. Smith, and E.Yee, who provided valuable field assistance and constructivecomments on this manuscript, and to D. Pryor, H. Helling, P.Schooley, and the Monarch Bay Community and Beach Clubfor facilitating access to study sites. We thank K. Donovan forher cheerful assistance in preparing the figures. J.S.K. wouldlike to acknowledge support from the University of SouthernCalifornia Sea Grant Trainee program, which allowed her tocarry out much of this research. This work was funded by theNational Sea Grant College Program, National Oceanic andAtmospheric Administration, US Department of Commerce,under Grant NA 46 RG 0472, by the California ResourcesAgency, and by the Pacific Outer Continental Shelf Region,Minerals Management Service, US Department of Interiorand by the Coastal Marine Institute, University of California,Santa Barbara. The Departmental Association Council, andthe Department of Biological Science at CSU Fullerton alsoprovided support for this study. The views expressed hereindo not necessarily reflect the views of NOAA or MMS or anyof their subagencies. The US Government is authorized toreproduce and distribute copies of this paper for govern-mental purposes.
LITERATURE CITED
Abbott DP, Haderlie ED (1980) Prosobranchia: marine snails.In: Morris RH, Abbott DP, Haderlie EC (eds) Intertidalinvertebrates of California. Stanford University Press,Stanford, CA, p 230–307
Addessi L (1994) Human disturbance and long-term changeson a rocky intertidal community. Ecol Appl 4:786–797
Balaparameswara Rao M (1976) Studies on the growth of thelimpet Cellana radiata (Born) (Gastropoda: Prosobranchia).J Mollusc Stud 42:136–144
Bell EC, Denny MW (1994) Quantifying ‘wave exposure’: asimple device for recording maximum velocity and resultsof its use at several field sites. J Exp Mar Biol Ecol 181:9–29
Branch GM (1974) The ecology of Patella Linnaeus from theCape Peninsula, South Africa. 2. Reproductive cycles.Trans R Soc S Afr 41:111–160
Branch GM (1975) Notes on the ecology of Patella concolorand Cellana capensis, and the effects of human consump-tion on limpet populations. Zool Afr 10:75–85
Branch GM (1981) The biology of limpets: physical factors,energy flow, and ecological interactions. Oceanogr MarBiol Annu Rev 19:235–380
Castilla JC, Bustamante RH (1989) Human exclusion fromrocky intertidal of Las Cruces, central Chile: effects onDurvillea antarctica (Phaeophyta, Durvilleales). Mar EcolProg Ser 50:203–214
Castilla JC, Durán LR (1985) Human exclusion from the rockyintertidal zone of central Chile: the effects on Concholepasconcholepas (Gastropoda). Oikos 45:391–399
Catterall CP, Poiner IR (1987) The potential impact of human
gathering on shellfish populations, with reference to someNE Australian intertidal flats. Oikos 50:114–122
Choat JH (1977) The influence of sessile organisms on thepopulation biology of three species of acmaeid limpets.J Exp Mar Biol Ecol 26:1–26
Creese RG (1980a) Reproductive cycles and fecundities offour common eastern Australian Archaeogastropod lim-pets (Mollusca: Gastropoda). Aust J Mar Freshw Res 31:49–59
Creese RG (1980b) An analysis of distribution and abundanceof populations of the high-shore limpet, Notoacmea pet-terdi (Tenison-Woods). Oecologia 45:252–260
Creese RG (1982) Distribution and abundance of the acmaeidlimpet, Patelloida latistrigata, and its interaction withbarnacles. Oecologia 52:85–96
Daly GP (1975) Growth and reproduction in the marine limpetLottia gigantea (Gray) (Acmaeidae). MS thesis, San DiegoState University
Durán LR, Castilla JC (1989) Variation and persistence of themiddle rocky intertidal community of central Chile, withand without human harvesting. Mar Biol 103:555–562
Frank PW (1982) Effects of winter feeding on limpets byblack oystercatchers (Haematopus bachmani). Ecology 63:1352–1362
Griffiths CL, Branch GM (1997) The exploitation of coastalinvertebrates and seaweeds in South Africa: historicaltrends, ecological impacts and implications for manage-ment. Trans R Soc S Afr 52:121–148
Hickey BM (1993) Physical oceanography. In: Dailey MD,Reish DJ, Anderson JW (eds) Ecology of the southernCalifornia Bight. A synthesis and interpretation. Univer-sity of California Press, Berkeley, p 19–70
Hockey PAR, Bosman AL (1986) Man as an intertidal predatorin Transkeiy: disturbance, community convergence andmanagement of a natural food resource. Oikos 46:3–14
Hockey PAR, Branch GM (1994) Conserving marine biodiver-sity on the African coast: implications of a terrestrial per-spective. Aquat Conserv Mar Freshw Ecosyst 4:345–362
Jeffrey SW, Humphrey GF (1975) New spectrophotometricequations for determining chlorophylls a, b, c1, and c2 inhigher plants, algae, and natural phytoplankton. BiochemPhysiol Pflanzen 167:191–194
Keough MJ, Quinn GP, King A (1993) Correlations betweenhuman collecting and intertidal mollusc populations onrocky shores. Conserv Biol 7:378–390
Lasiak TA, Dye AH (1989) The ecology of the brown musselPerna perna in Transkei: implications for the managementof a traditional food resource. Biol Conserv 47:245–257
Levitan DR (1991) Influence of body size and population den-sity on fertilization success and reproductive output in afree-spawning invertebrate. Biol Bull (Woods Hole) 181:261–268
Levitan DR, Sewell MA, Chia FS (1992) How distribution andabundance influence fertilization success in the sea urchinStrongylocentrotus franciscanus. Ecology 73:248–254
Lewis JR, Bowman RS (1975) Local habitat-induced variationsin the population dynamics of Patella vulgata L. J Exp MarBiol Ecol 17:165–203
Lindberg DR, Warheit KI, Estes JA (1987) Prey preferenceand seasonal predation by oystercatchers on limpets atSan Nicolas Island, California, USA. Mar Ecol Prog Ser 39:105–113
Lindberg DR, Estes JA, Warheit KI (1998) Human influences ontrophic cascades along rocky shores. Ecol Appl 8:880–890
Lubchenco J, Gaines SD (1981) A unified approach to marineplant-herbivore interactions. I. Populations and communi-ties. Annu Rev Ecol Syst 12:405–437
123
Mar Ecol Prog Ser 257: 111–124, 2003
MacGinitie GE, MacGinitie N (1968) Natural history ofmarine animals. McGraw-Hill, New York
Manly BJ (1997) Randomization and Monte Carlo methods inbiology, 2nd edn. Chapman & Hall, London
McArdle DA (1997) California marine protected areas. PublNo. T-039, California Sea Grant College System, Univer-sity of California, La Jolla
McLachlan A, Lombard HW (1981) Growth and production inexploited and unexploited populations of a rocky shoregastropod, Turbo sarmaticus. Veliger 23:221–229
Moreno CA, Sutherland JP, Jara HF (1984) Man as a predatorin the intertidal zone of southern Chile. Oikos 42:155–160
Moreno CA, Lunecke KM, Lépez MJ (1986) The response ofan intertidal Concholepas concholepas (Gastropoda) pop-ulation to protection from man in southern Chile and theeffects on benthic sessile assemblages. Oikos 46:359–364
Murray SN (1998) Effectiveness of marine life refuges onsouthern California shores. In: Magoon OT, Converse H,Baird B, Miller-Henson M (eds) California and the WorldOcean ’97. Taking a look at California’s ocean resources:an agenda for the future. American Society of Civil Engi-neers, Reston, VA, p 1453–1465
Murray SN (2002) Individual-based parameters: age-determi-nation, growth rates, size structure, and reproduction. In:Murray SN, Ambrose RF, Dethier MN, Methods for per-forming monitoring, impact, and ecological studies onrocky shores. US Department of the Interior, MineralsManagement Service, Pacific OCS Region, OCS StudyMMS 01-070, Camarillo, CA, p 163–199
Murray SN, Denis TG, Kido JS, Smith JR (1999) Human visi-tation and the frequency and potential effects of collectingon rocky intertidal populations in southern Californiamarine reserves. Calif Coop Ocean Fish Invest Rep 40:100–106
Newton LC, Parkes EVH, Thompson RC (1993) The effectsof shell collecting on the abundance of gastropods onTanzanian shores. Biol Conserv 63:241–245
Oliva D, Castilla JC (1986) The effect of human exclusion onthe population structure of key-hole limpets Fissurellacrassa and F. limbata on the coast of central Chile. PSZN I:Mar Ecol 7:210–217
Ortega S (1987) The effect of human predation on the sizedistribution of Siphonaria gigas (Mollusca: Pulmonata) onthe Pacific Coast of Costa Rica. Veliger 29:251–255
Pombo OA, Escofet A (1996) Effect of exploitation on thelimpet Lottia gigantea: a field study in Baja California(Mexico) and California (USA). Pac Sci 50:393–403
Quinn GP, Keough MJ (2002) Experimental design and dataanalysis for biologists. Cambridge University Press, Cam-bridge
Raimondi PT, Ambrose RF, Engle JM, Murray SN, Wilson M(1999) Monitoring of rocky intertidal resources along thecentral and southern California mainland: 3-year reportfor San Luis Obispo, Santa Barbara, and Orange Counties(Fall 1995-Spring 1998). Project Report for the US De-partment of the Interior, Minerals Management Service,Pacific OCS Region, Camarillo, CA
Ricketts EF, Calvin J, Hedgpeth J, Phillips DW (1985) Be-tween pacific tides, 5th edn. Stanford University Press,Stanford, CA
Roy K, Collins AG, Becker BJ, Begovic E, Engle JM (2003)Anthropogenic impacts and historical declines in bodysize of rocky intertidal gastropods in southern California.Ecol Lett 6:1–7
Sapper SA, Murray SN (2003) Variation in structure of thesubcanopy assemblage associated with southern Cali-fornia populations of the intertidal rockweed Silvetia com-pressa (O. Fucales). Pac Sci 57:433–462
Seapy RR (1966) Reproduction and growth in the file limpet,Acmaea limatula Carpenter, 1864 (Mollusca: Gastropoda).Veliger 8:300–310
Sowls AL, DeGange AR, Nelson TW, Lester GS (1980) Cata-log of California seabird colonies. FWS/OBS 37/80, USDept Interior, Fish and Wildlife Service, Biological Pro-gram, Washington, DC
Stimson J (1970) Territorial behavior of the owl limpet, Lottiagigantea. Ecology 51:113–118
Stimson J (1973) The role of the territory in the ecology ofthe intertidal limpet Lottia gigantea (Gray). Ecology 54:1020–1030
Tablado A, López Gappa JJ, Magaldi NH (1994) Growth ofthe pulmonate limpet Siphonaria lessoni (Blainville) in arocky intertidal area affected by sewage pollution. J ExpMar Biol Ecol 175:211–226
Tegner MJ, Basch LV, Dayton PK (1996) Near extinction ofan exploited marine invertebrate. Trends Ecol Evol 11:278–280
Turon X, Giribet G, López S, Palacín C (1995) Growth andpopulation structure of Paracentrotus lividus (Echinoder-mata: Echinoidea) in two contrasting habitats. Mar EcolProg Ser 122:193–204
Underwood AJ (1979) The ecology of intertidal gastropods.Adv Mar Biol 16:111–210
Underwood AJ (1980) The effects of grazing by gastropodsand physical factors on the upper limits of distribution ofintertidal macroalgae. Oecologia 46:201–213
Underwood AJ (1984) Vertical and seasonal patterns incompetition for microalgae between intertidal gastropods.Oecologia 64:211–222
Underwood AJ (1997) Experiments in ecology. CambridgeUniversity Press, Cambridge
Underwood AJ, Jernakoff P (1981) Effects of interactionsbetween algae and grazing gastropods on the structureof a low-shore intertidal algal community. Oecologia 48:221–233
Vedder JG, Norris RM (1963) Geology of San Nicolas IslandCalifornia. US Geol Surv Prof Pap 369:1–65
von Bertalanffy L (1957) Quantitative laws in metabolism andgrowth. Q Rev Biol 32:217–231
Walford LA (1946) A new graphic method of describingthe growth of animals. Biol Bull (Woods Hole) 90:141–146
Wright WG, Lindberg DR (1982) Direct observation of sexchange in the patellacean limpet Lottia gigantea. J MarBiol Assoc UK 62:737–738
Zar JH (1999) Biostatistical analysis, 4th edn. Prentice-Hall,Upper Saddle River, NJ
Zedler JB (1978) Public use effects in the Cabrillo NationalMonument intertidal zone. 1978 Project Report for theUS Department of Interior, National Park Service, Wash-ington, DC
124
Editorial responsibility: Lisa Levin (Contributing Editor), La Jolla, California, USA
Submitted: March 26, 2002; Accepted: April 7, 2003Proofs received from author(s): July 17, 2003