Variability of phytoplankton and mesozooplankton biomass in the ... · of Sciences (NUAS), extended...
20
MARINE ECOLOGY PROGRESS SERIES Mar Ecol Prog Ser Vol. 250: 125–144, 2003 Published March 26 INTRODUCTION Interactions between physical and biological pro- cesses affect the biogeochemical cycling of carbon in the oceans. The basin scale circulation in the Atlantic Ocean incorporates a system of gyres located in the northern and southern hemispheres. North and south of the equator, from 20 to 45° latitude, anticyclonic gyres occur, which are dominated by downwelling processes. In this scheme, most extended upwelling areas in the Atlantic Ocean occur in zones of subtropi- cal divergences. The Northern Tropical Divergence stretches from 50° W to the African coast along 8° N latitude in the west and 8 to 15° N latitude in the east (Voituriez 1981, Bezrukov 1989). It is weakly devel- oped from the winter to the spring period, but achieves its maximum in the autumn. The Southern Tropical Divergence takes place along latitudes 4 to 5° S and turns eastward at 23° W and reaches 15° S latitude (Bezrukov 1989, Longhurst 1998). The northern and southwestern coasts of Africa are believed to have permanent upwelling with high con- centrations of nutrients reaching the subsurface layer. These nutrients are not fully utilised by phytoplankton and, with waters of the Canary and Benguela Currents, they are carried south and northwestwards. The regions with high chlorophyll concentration away from the up- welling regions have been remotely sensed by satellites (McClain et al. 1990, Falkowski et al. 1998, Hoepffner et al. 1999). The structural changes in the water masses also influence the major structural-functional character- istics of the plankton communities, which in turn causes differences in biological processes. Much of our understanding of the biological pro- cesses and distribution of the plankton biomass within the tropical Atlantic Ocean has been obtained from © Inter-Research 2003 · www.int-res.com *Corresponding author. Email: [email protected] Variability of phytoplankton and mesozooplankton biomass in the subtropical and tropical Atlantic Ocean Z. Z. Finenko 1 , S. A. Piontkovski 1, 4, *, R. Williams 2 , A. V. Mishonov 3 1 Institute of Biology of the Southern Seas, 2 Nakhimov Ave., Sevastopol 99011, Ukraine 2 Plymouth Marine Laboratory, Prospect Place, Plymouth PL1 3DH, United Kingdom 3 Department of Oceanography, Texas A & M University, College Station, Texas 77843-3146, USA 4 Present address: Marine Sciences Research Center, Stony Brook University, Stony Brook, New York 11794-5000, USA ABSTRACT: Data from over 40 yr (1950–1992) of expeditions to the Atlantic Ocean are summarised in the form of macroscale contour maps between 40° N and 40° S. The chl a concentrations from the sur- face and mesozooplankton in the upper layer (0 to 100 m) were analysed from 3992 casts and 1124 hauls respectively. General agreement between chlorophyll concentrations and mesozooplank- ton biomass distributions was noted on an ocean basin scale. There were non-linear relationships be- tween mean chlorophyll concentration within the 0 to 10 m layer and mesozooplankton biomass within the 0 to 100 m layer for summed data between December to May and June to November. A comparison of the total biomass of mesozooplankton und phytoplankton, in carbon units, indicated that this ratio varied from 0.15 to 1 in the 0 to 100 m layer and, on average, the phytoplankton biomass exceeded twice that of mesozooplankton. The seasonal cycles of phyto- and zooplankton biomass for 6 provinces of the tropical zone were qualitatively comparable. Quantitative differences were found in the sea- sonal amplitudes, which were greater for the regions with nutrient enrichment of the upper layer. Re- lationships were established between phytoplankton and mesozooplankton biomass for 8 provinces. KEY WORDS: Phytoplankton · Zooplankton · Spatial variability · Atlantic Ocean Resale or republication not permitted without written consent of the publisher
Transcript of Variability of phytoplankton and mesozooplankton biomass in the ... · of Sciences (NUAS), extended...

MARINE ECOLOGY PROGRESS SERIESMar Ecol Prog Ser
Vol. 250: 125–144, 2003 Published March 26
INTRODUCTION
Interactions between physical and biological pro-cesses affect the biogeochemical cycling of carbon inthe oceans. The basin scale circulation in the AtlanticOcean incorporates a system of gyres located in thenorthern and southern hemispheres. North and southof the equator, from 20 to 45° latitude, anticyclonicgyres occur, which are dominated by downwellingprocesses. In this scheme, most extended upwellingareas in the Atlantic Ocean occur in zones of subtropi-cal divergences. The Northern Tropical Divergencestretches from 50° W to the African coast along 8° Nlatitude in the west and 8 to 15° N latitude in the east(Voituriez 1981, Bezrukov 1989). It is weakly devel-oped from the winter to the spring period, but achievesits maximum in the autumn. The Southern TropicalDivergence takes place along latitudes 4 to 5° S and
turns eastward at 23° W and reaches 15° S latitude(Bezrukov 1989, Longhurst 1998).
The northern and southwestern coasts of Africa arebelieved to have permanent upwelling with high con-centrations of nutrients reaching the subsurface layer.These nutrients are not fully utilised by phytoplanktonand, with waters of the Canary and Benguela Currents,they are carried south and northwestwards. The regionswith high chlorophyll concentration away from the up-welling regions have been remotely sensed by satellites(McClain et al. 1990, Falkowski et al. 1998, Hoepffneret al. 1999). The structural changes in the water massesalso influence the major structural-functional character-istics of the plankton communities, which in turn causesdifferences in biological processes.
Much of our understanding of the biological pro-cesses and distribution of the plankton biomass withinthe tropical Atlantic Ocean has been obtained from
© Inter-Research 2003 · www.int-res.com*Corresponding author. Email: [email protected]
Variability of phytoplankton and mesozooplanktonbiomass in the subtropical and tropical Atlantic Ocean
Z. Z. Finenko1, S. A. Piontkovski1, 4,*, R. Williams2, A. V. Mishonov3
1Institute of Biology of the Southern Seas, 2 Nakhimov Ave., Sevastopol 99011, Ukraine2Plymouth Marine Laboratory, Prospect Place, Plymouth PL1 3DH, United Kingdom
3Department of Oceanography, Texas A & M University, College Station, Texas 77843-3146, USA
4Present address: Marine Sciences Research Center, Stony Brook University, Stony Brook, New York 11794-5000, USA
ABSTRACT: Data from over 40 yr (1950–1992) of expeditions to the Atlantic Ocean are summarised inthe form of macroscale contour maps between 40°N and 40°S. The chl a concentrations from the sur-face and mesozooplankton in the upper layer (0 to 100 m) were analysed from 3992 casts and1124 hauls respectively. General agreement between chlorophyll concentrations and mesozooplank-ton biomass distributions was noted on an ocean basin scale. There were non-linear relationships be-tween mean chlorophyll concentration within the 0 to 10 m layer and mesozooplankton biomass withinthe 0 to 100 m layer for summed data between December to May and June to November. A comparisonof the total biomass of mesozooplankton und phytoplankton, in carbon units, indicated that this ratiovaried from 0.15 to 1 in the 0 to 100 m layer and, on average, the phytoplankton biomass exceededtwice that of mesozooplankton. The seasonal cycles of phyto- and zooplankton biomass for 6 provincesof the tropical zone were qualitatively comparable. Quantitative differences were found in the sea-sonal amplitudes, which were greater for the regions with nutrient enrichment of the upper layer. Re-lationships were established between phytoplankton and mesozooplankton biomass for 8 provinces.
KEY WORDS: Phytoplankton · Zooplankton · Spatial variability · Atlantic Ocean
Resale or republication not permitted without written consent of the publisher

Mar Ecol Prog Ser 250: 125–144, 2003
shipboard observation collected within the frame-work of international and national projects: METEOR(1925–1927), Equalant I and II (1963–1965), CIPREA(1978–1979), SEQUAL-FOCAL (1983–1985), JGOFS(1989–1990), and World Ocean (national projectFormer Soviet Union, FSU 1970–1990). On the basisof these numerous measurements, maps were con-structed of the plankton distribution (Bogorov et al.1968, Corcoran & Manken 1969, Bé et al. 1971, Zernova1974, Semina 1977, Chromov 1986, Piontkovski &Ignatyev 1992, Piontkovski et al. 1997, Tseitlin etal. 1997a,b) and also for phytoplankton production(Koblentz-Mishke et al. 1970, Finenko 1978, 1994,Berger 1989). Similarities in the distributions of phyto-plankton, primary production and mesozooplanktonwith the circulation of surface water masses were notedin these studies. Observations of ocean colour from theCoastal Zone Color Scanner (CZCS) satellite showedthe macroscale variability (hundreds of km) of the nearsurface chlorophyll-like pigment concentration (NASA1989). These observations confirmed the role of physicsoperating in the ocean creating these large-scalegeographic and temporal patterns of chlorophyll con-centration (McClain et al. 1990, Falkowski et al. 1998).
The relationship between chlorophyll and primaryproduction in the integrated upper layer (Eppley et al.1985, 1987, Berger 1989, Monger et al. 1997), in theeuphotic layer (Lorenzen 1970, Smith 1981, Platt &Herman 1983) and chlorophyll vertical distribution andprimary production (Morel & Berthon 1989, Hoepffner etal. 1999) was shown for a number of regions. It has beenshown from these data that the chlorophyll concentrationin the upper layer might be used as an index of changesin water productivity i.e. primary production on a scale ofhundreds of km. Changes of primary production on thisscale are accompanied by changes of species, planktoncommunity size structure, and biomass ratio betweenphytoplankton, bacteria, protists, and mesozooplankton.In contrast to upwelling regions, high species diversityand a complex trophic web, which is affected by the sizeof the phytoplankton cells, can characterize the pelagiccommunities of oligotrophic waters in the tropical andsubtropical regions. Picoplankton (<1 µm) and nanno-phytoplankton (1 to 5 µm) comprises the major partof phytoplankton biomass (Olson et al. 1990, Li 1995,Buck et al. 1996) and serves as a major food resourcefor heterotrophic microplankton (Burkill et al. 1993,Harrison et al. 1993, Verity et al. 1993).
Microheterotrophs make up over 50% of the totalmetabolism of the heterotrophic part of the communityand carbon flux from primary production to zooplank-ton (Williams 1981, Bender et al. 1992, Fasham et al.1999, Bode et al. 2001). Mesozooplankton consumesa minor part of phytoplankton primary production(Moralis et al. 1991, Dam et al. 1993, Harrison et al.
1993). However, due to the balance of production pro-cesses in the plankton community, mesozooplanktonbiomass increases with the rise of phytoplankton pro-duction and chlorophyll concentration.
The results of continuous measurements of zoo-plankton abundance and biomass by optical planktoncounters in a range from 0.25 to 8.0 mm have indicatedthat minimal values are typical for the oligotrophicSouth Atlantic Subtropical Gyre and oligotrophic Ca-nary Basin along a transect from 49° N to 46° S (Galli-enne & Robins 1998). Values were 20 times higher inthe equatorial region and 10 times higher in the watersnear the West African upwelling. Sampling along atransect from 30° N to 50° S (Galbert & Agusti 1999)resulted in similar correlated changes of copepodabundance and chlorophyll concentration. This rein-forces the known fact that autotrophic and heterotro-phic production is more balanced in tropical watersthan in higher latitudes.
Vinogradov & Shushkina (1987), working with theplankton communities of the coastal upwelling regionsof Peru, reported the imbalance between primary pro-duction and its utilization by heterotrophs. This imbal-ance results in a weak correlation between phyto- andzooplankton biomass (Gibbons & Hutchings 1996).Overall, despite the spatial heterogeneity of distribu-tions of the plankton, the observed general tendency isthat the biomass of mesozooplankton and other het-erotrophs declines with the decline of primary produc-tion and phytoplankton biomass.
Micro- and mesozooplankton consume phytoplanktonand its production, therefore their distributions in spaceand time should be linked. However, these links are ex-tremely difficult to verify statistically due to their multi-scale spatial-temporal origins (Piontkovski & Williams1995). From the point of view of ocean-monitoring ofvariables by satellite, zooplankton can be considered asa ‘filter’ impacting, through trophic interactions, on theoceanic phytoplankton and primary production fields(Banse 1994). It is also known that zooplankton plays asignificant role in vertical transport of carbon withinmarine ecosystems, forming the so-called ‘biologicalpump’ (Longhurst & Harrison 1989).
We confined our work to the upper 100 m layerbecause in the subtropical and tropical regions, themajor part of phyto- and mesozooplankton biomass isconcentrated here. Our objectives were to compare thedistribution of the chlorophyll concentration with thatof the mesozooplankton biomass for the open oceansystem and coastal zone, and to examine the relation-ship between primary production, phytoplankton, andmesozooplankton stocks. In particular, we applied cor-relation analysis to ascertain whether there are de-fined co-variation patterns between chl a and meso-zooplankton biomass.
126
Finenko et al.: Phytoplankton-mesozooplankton biomass relationships
MATERIAL AND METHODS
Chlorophyll data. Methods: Water samples for chl aand phaeopigments were filtered through membranefilters (effective pore size 0.45 to 0.6 µm) and WhatmanGF/F glass-fiber filters (effective pore size 0.7 µm) andpigments were extracted in 90% acetone. After extrac-tion, chl a and its degradation products were measuredusing standard fluorometric (Jeffrey et al. 1997) andspectro-photometric (Jeffrey & Humphrey 1975) meth-ods. Phaeopigment concentration was not used in thiswork because the fluorometric method often over esti-mates the concentration of phaeopigments due to theabundant prokaryotes in the tropical waters and pres-ence of chlorophyll b (Neveux & Lantoine 1993).
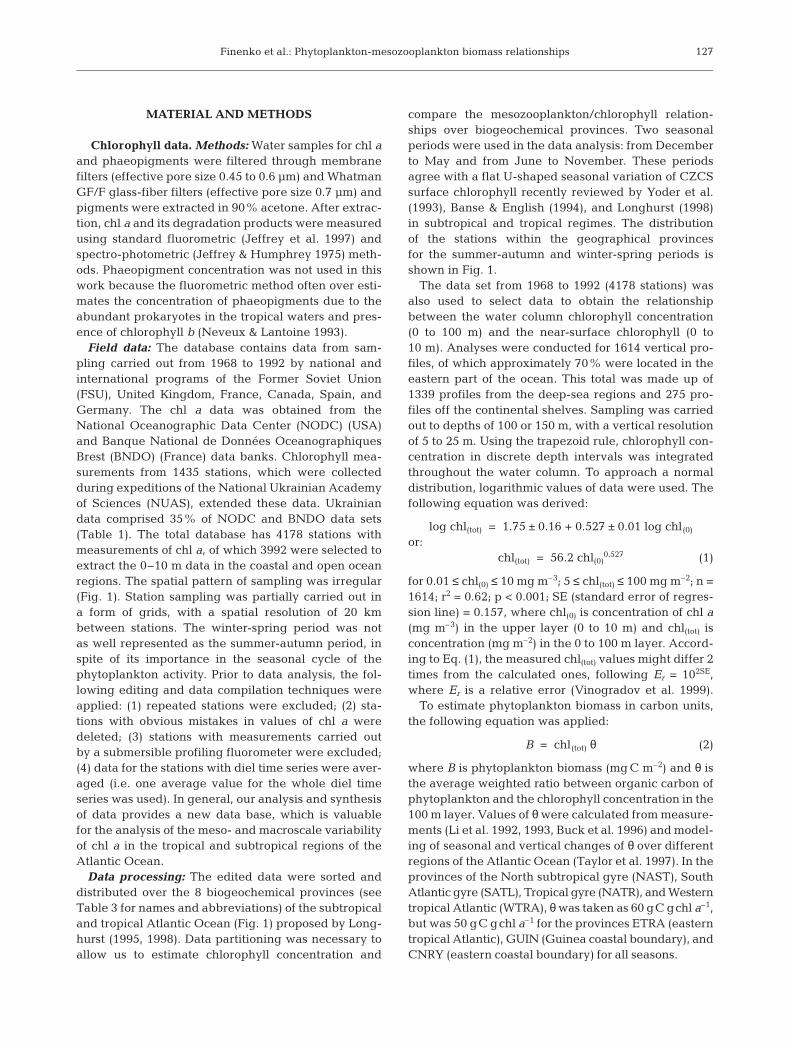
Field data: The database contains data from sam-pling carried out from 1968 to 1992 by national andinternational programs of the Former Soviet Union(FSU), United Kingdom, France, Canada, Spain, andGermany. The chl a data was obtained from theNational Oceanographic Data Center (NODC) (USA)and Banque National de Données OceanographiquesBrest (BNDO) (France) data banks. Chlorophyll mea-surements from 1435 stations, which were collectedduring expeditions of the National Ukrainian Academyof Sciences (NUAS), extended these data. Ukrainiandata comprised 35% of NODC and BNDO data sets(Table 1). The total database has 4178 stations withmeasurements of chl a, of which 3992 were selected toextract the 0–10 m data in the coastal and open oceanregions. The spatial pattern of sampling was irregular(Fig. 1). Station sampling was partially carried out ina form of grids, with a spatial resolution of 20 kmbetween stations. The winter-spring period was notas well represented as the summer-autumn period, inspite of its importance in the seasonal cycle of thephytoplankton activity. Prior to data analysis, the fol-lowing editing and data compilation techniques wereapplied: (1) repeated stations were excluded; (2) sta-tions with obvious mistakes in values of chl a weredeleted; (3) stations with measurements carried outby a submersible profiling fluorometer were excluded;(4) data for the stations with diel time series were aver-aged (i.e. one average value for the whole diel timeseries was used). In general, our analysis and synthesisof data provides a new data base, which is valuablefor the analysis of the meso- and macroscale variabilityof chl a in the tropical and subtropical regions of theAtlantic Ocean.
Data processing: The edited data were sorted anddistributed over the 8 biogeochemical provinces (seeTable 3 for names and abbreviations) of the subtropicaland tropical Atlantic Ocean (Fig. 1) proposed by Long-hurst (1995, 1998). Data partitioning was necessary toallow us to estimate chlorophyll concentration and
compare the mesozooplankton/chlorophyll relation-ships over biogeochemical provinces. Two seasonalperiods were used in the data analysis: from Decemberto May and from June to November. These periodsagree with a flat U-shaped seasonal variation of CZCSsurface chlorophyll recently reviewed by Yoder et al.(1993), Banse & English (1994), and Longhurst (1998)in subtropical and tropical regimes. The distributionof the stations within the geographical provincesfor the summer-autumn and winter-spring periods isshown in Fig. 1.
The data set from 1968 to 1992 (4178 stations) wasalso used to select data to obtain the relationshipbetween the water column chlorophyll concentration(0 to 100 m) and the near-surface chlorophyll (0 to10 m). Analyses were conducted for 1614 vertical pro-files, of which approximately 70% were located in theeastern part of the ocean. This total was made up of1339 profiles from the deep-sea regions and 275 pro-files off the continental shelves. Sampling was carriedout to depths of 100 or 150 m, with a vertical resolutionof 5 to 25 m. Using the trapezoid rule, chlorophyll con-centration in discrete depth intervals was integratedthroughout the water column. To approach a normaldistribution, logarithmic values of data were used. Thefollowing equation was derived:
log chl(tot) = 1.75 ± 0.16 + 0.527 ± 0.01 log chl(0)
or:chl(tot) = 56.2 chl(0)
0.527 (1)
for 0.01 ≤ chl(0) ≤ 10 mg m–3; 5 ≤ chl(tot) ≤ 100 mg m–2; n =1614; r2 = 0.62; p < 0.001; SE (standard error of regres-sion line) = 0.157, where chl(0) is concentration of chl a(mg m–3) in the upper layer (0 to 10 m) and chl(tot) isconcentration (mg m–2) in the 0 to 100 m layer. Accord-ing to Eq. (1), the measured chl(tot) values might differ 2times from the calculated ones, following Er = 102SE,where Er is a relative error (Vinogradov et al. 1999).
To estimate phytoplankton biomass in carbon units,the following equation was applied:
B = chl(tot) θ (2)
where B is phytoplankton biomass (mg C m–2) and θ isthe average weighted ratio between organic carbon ofphytoplankton and the chlorophyll concentration in the100 m layer. Values of θ were calculated from measure-ments (Li et al. 1992, 1993, Buck et al. 1996) and model-ing of seasonal and vertical changes of θ over differentregions of the Atlantic Ocean (Taylor et al. 1997). In theprovinces of the North subtropical gyre (NAST), SouthAtlantic gyre (SATL), Tropical gyre (NATR), and Westerntropical Atlantic (WTRA), θ was taken as 60 gC gchl a–1,but was 50 gC gchl a–1 for the provinces ETRA (easterntropical Atlantic), GUIN (Guinea coastal boundary), andCNRY (eastern coastal boundary) for all seasons.
127

Mar Ecol Prog Ser 250: 125–144, 2003128
Time period Ship and cruise no./ Region of Atlantic Source Number of stations/data set name data used
1968: May U7EX North subtropical NODC 6/61971: Jan–Feb X6 Morocco upwelling NODC 12/121972: Oct–Nov PLA Bay of Biscay NODC 7/71973: Apr–May PH32 Northeast NODC 27/271974: Mar CR Cape Blanc region NODC 39/391974: Mar–Apr CH Cape Blanc region NODC 78/781974: Mar–May AD14 Cape Blanc region NODC 56/561974: Mar–May AD18 Cape Blanc region NODC 126/1261976: Sep–Oct GM Canary Islands region NODC 75/751978: Jul–Aug NZ Gulf of Guinea NODC 51/511978: Aug–Sep Capricorne, 1 East equatorial BNDO 63/621978: Aug–Sep SU East equatorial NODC 59/581979: Feb SOP1 East equatorial NODC 13/131979: Apr Capricorne, 2 East equatorial BNDO 29/291979: May K110 Central equatorial NODC 159/1581979: Jun–Jul Capricorne, 3 Gulf of Guinea BNDO 49/481979: Oct–Nov Capricorne, 4 East equatorial BNDO 79/731979: Dec–1980: Jan Vodyanitsky, 7 Cape Blanc region IBSS Archives (1980) 49/491980: Jan Capricorne, 5 East equatorial BNDO, FOCAL 1 17/161980: Jan Lomonosov, 38 Conakri region MHI Archives (1980a) 33/251980: Nov Lomonosov, 40 Conakri region MHI Archives (1980b) 5/51981: Aug–Sep X25 Portugal coast NODC 8/81981: May Z Central subtropical NODC 9/81981: Dec–1982: Jan Vodyanitsky, 11 South subtropical IBSS Archives (1982a) 80/801982: Jul Capricorne, 6 Equatorial BNDO (FOCAL 2) 45/421982: Jul–Oct Vodyanitsky, 13 Tropical and central IBSS Archives (1982b) 126/1171983: Jan–Feb Capricorne, 7 Tropical and equatorial BNDO (FOCAL 3) 50/481983: Mar–Apr IF Cape Blanc region NODC 52/521983: Mar–Apr Meteor, 1 Cape Blanc region NODC 83/731983: Apr V302 West subtropical NODC 25/251983: Jul–Aug Capricorne, 8 Tropical and equatorial BNDO (FOCAL 4) 88/861984: Jan–Feb Capricorne, 9 Tropical and equatorial BNDO (FOCAL 5) 92/921984: Mar Meteor, 2 Cape Blanc region NODC 17/171984: Apr Meteor, 3 Cape Blanc region NODC 20/201984: Jul–Aug Capricorne, 10 Tropical and equatorial BNDO 96/911984: Dec V449 West Sargasso Sea NODC 7/61985: Jun–Aug Vernadsky, 32 West tropical MHI Archives (1985) 164/1641985: Aug V520 West Sargasso Sea NODC 4/21985: Nov–Dec Vodyanitsky, 20 Tropical IBSS Archives (1985b) 29/291986: Jun–Aug Capricorne, 11 East tropical BNDO 154/1521986: Jul U7DI East subtropical NODC 1/11986: Sep–Oct Vernadsky, 34 West tropical MHI Archives (1986a) 238/2381986: Oct–Dec Vodyanitsky, 21 Tropical IBSS Archives (1986) 48/481986: Nov Lomonosov, 47 East tropical MHI Archives (1986b) 281/2771987: Jun–Jul Vernadsky, 36 West tropical MHI Archives (1987) 234/2341987: Jun–Jul Hudson, 1 Northwest subtropical BNDO 16/121987: Jun–Jul V722 West Sargasso Sea NODC 105/1021987: Jul–Oct Vodyanitsky, 24 Tropical IBSS Archives (1987) 91/581988: Sep Hudson, 2 Northwest subtropical BNDO 16/161988: Sep V826 West Sargasso Sea NODC 15/151989: Mar SE1 Central subtropical NODC 7/01989: Mar–Apr DR1 Central subtropical NODC 20/201989: Apr DR2 East subtropical NODC 21/121989: Apr SE Central subtropical NODC 23/231989: Apr–May A2 North sutropical NODC 34/301989: Apr–May V903 West tropical NODC 29/29
Table 1. Sources of data for chlorophyll data base. IBSS = Institute of Biology of the Southern Seas, NASU, Sevastopol, Ukraine(see www.ibss.iuf.net); MHI = Marine Hydrophysical Institute, NASU, Sevastopol, Ukraine (see www.mhi.iuf.net); BNDO =Banque National de Données Oceanographiques, Brest, France (see www.ifremer.fr:582/sismer/sismer/banque_nat_ag. htql);NODC = National Oceanographic Data Center, Silver Spring, Maryland, USA (see www.nodc.noaa.gov/OC5/indwod98. html);BODC/BOFS = British Oceanographic Data Centre/BOFS CD-ROM (see www.bodc.ac.uk/); FOCAL = Programme Francais
Ocean et Climat Atlantique Equatorial
Finenko et al.: Phytoplankton-mesozooplankton biomass relationships
Zooplankton data. Methods: The plankton sampleswere collected by Bogorov-Rass nets and the oceanicmodel of the Juday nets (80 cm mouth diameter) withmesh sizes of 178 and 200 µm. All tows were taken ina vertical or oblique manner in the upper 100 to 0 mand hauled at a speed of approximately 0.5 m s–1. Typ-
ically, 50 m3 of water was filtered by the net during thecollection of each sample. The filtered volume wasestimated from the length of the wire out, mouth dia-meter of the net and duration of tow. The wet weight ofsamples was obtained either by displacement volume(precision ± 0.1 ml), assuming the specific gravity of
129
Time period Ship and cruise no./ Region of Atlantic Source Number of stations/data set name data used
1989: May A3 North tropical NODC 23/231989: May DR3 East subtropical NODC 30/301989: May–Jun DR4 Northeast tropical NODC 20/161989: Aug–Sep N8 Northeast tropical NODC 9/81989: Sep–Dec Vodyanitsky, 29 Morocco upwelling and IBSS Archives (1989) 57/41
Gulf of Guinea1989: Oct–1990: Sep Sg West subtropical NODC 52/521989: Nov–1990: Sep Sb West subtropical NODC 15/151990: Apr D001 West subtropical NODC 30/251990: Apr–May N9 East tropical NODC 14/141990: Apr–Jun BOFS NE and Morocco BODC/BOFS 334/3201991: Apr D101 West NODC 12/121991: Apr–May D17 Northwest tropical NODC 81/811992: Sep–Oct D237 NW and Morocco NODC 62/621992: Sep–Oct Hudson, 3 NW and Morocco BNDO 63/531992: Dec Jean Charcot Cape Blanc J. Neveux pers. comm. 16/13
Total 4178/3992
Table 1 (continued)
Fig. 1. Chl a measurements inthe upper 10 m layer. Stationsfrom expeditions conductedin summer-autumn (June to November) and winter-spring (December to May)
periods (1968–1992)

Mar Ecol Prog Ser 250: 125–144, 2003
seston to be 1 g cm–3, or by wet weighing, after blot-ting, using a balance (precision ± 0.1 mg). Organismslarger than 30 mm and all jelly fish (medusas, salps,and ctenophores) were removed from the samplesbefore determining the weight or volume. Jelly fishwere excluded when determining the weight of themesozooplankton.
Field data: The data on mesozooplankton biomass at1310 stations from 40 FSU expeditions to the AtlanticOcean (1950–1989) were used (Fig. 2, Table 2). Thesestations were obtained from archives of Marine Hydro-physical Institute (MHI) and Institute of Biology of theSouthern Seas (IBSS) and some of them (179) weretaken from publications. The network of national pro-grammes and the spatial resolution of sampling wasirregular (Fig. 2). Certain stations had fine spatial res-olution, ca. 10s of km, and were performed in stationgrids. The hauls were taken over many seasons andyears and at different times of the day. Prior to dataanalysis, the following editing and data compilationwere applied: (1) stations with obvious mistakes in thevalues of mesozooplankton biomass were excluded;(2) data for the stations with diel time series were aver-aged and one average value was used; (3) data werenot used when an excessive amount of phytoplanktonor detritus was noted in the seston samples.
The number of stations with mesozooplankton fol-lowing the above analysis was 1124. The maximum
number of stations (745) was in the following3 provinces: WTRA (230), ETRA (231), and SATL(284). The minimal number of stations was in CNRY(67) and the GUIN (11). The total number of stationsfor the winter-spring and summer-autumn seasonswere almost equal (537 and 587 respectively).
Carbon biomass conversions: Mesozooplanktonbiovolume was converted to carbon using a factor of0.05 g C cm–3. To convert wet weight (Ww) into dryweight (Wd), the formula Ww = 6.25Wd (Vinogradov &Shushkina 1987) was used. The relationship Wc =0.31Wd (Wiebe 1988) converted dry mesozooplanktonbiomass into carbon (Wc).
Basin-wide maps. Data on chlorophyll concentration(0 to 10 m) and mesozooplankton biomass of the upper0 to 100 m layer enabled us to reconstruct the spatialdistribution on a scale of the whole tropical andsubtropical Atlantic Ocean (Figs. 3 & 4). The SurferGolden Software (USA) package was applied to designthe macroscale field of chlorophyll and mesozooplank-ton. The Kriging gridding method (Cressie 1991) andsmoothing of the grid matrix, with the weight of matrixcenter = 2, and the distance- weighting power = 2,were applied to create the map.
The mean of all measurements at stations overprovinces were calculated to estimate chlorophyll inthe upper 10 m and mesozooplankton in the upper100 m (Table 3).
130
Fig. 2. Mesozooplankton mea-surements in the upper 100 m.Stations from expeditions ofthe Former Soviet Union forsummer-autumn (June to No-vember) and winter-spring(December to May) periods
(1950–1989)
Finenko et al.: Phytoplankton-mesozooplankton biomass relationships
Data sets of chlorophyll—mesozooplankton rela-tionship. To analyse relationships between chlorophyllconcentration in the 0 to 10 m layer, and mesozooplank-ton biomass in the 100 m layer, the subtropical andtropical Atlantic was partitioned over 3° × 3° trapeziumsand mean parameter values were estimated for each.Trapeziums containing data for only 1 parameter wereexcluded from the analysis. In the 3° trapeziums, theaverage number of measurements was 6 to 20 for chl aand 2 to 8 for mesozooplankton biomass.
RESULTS
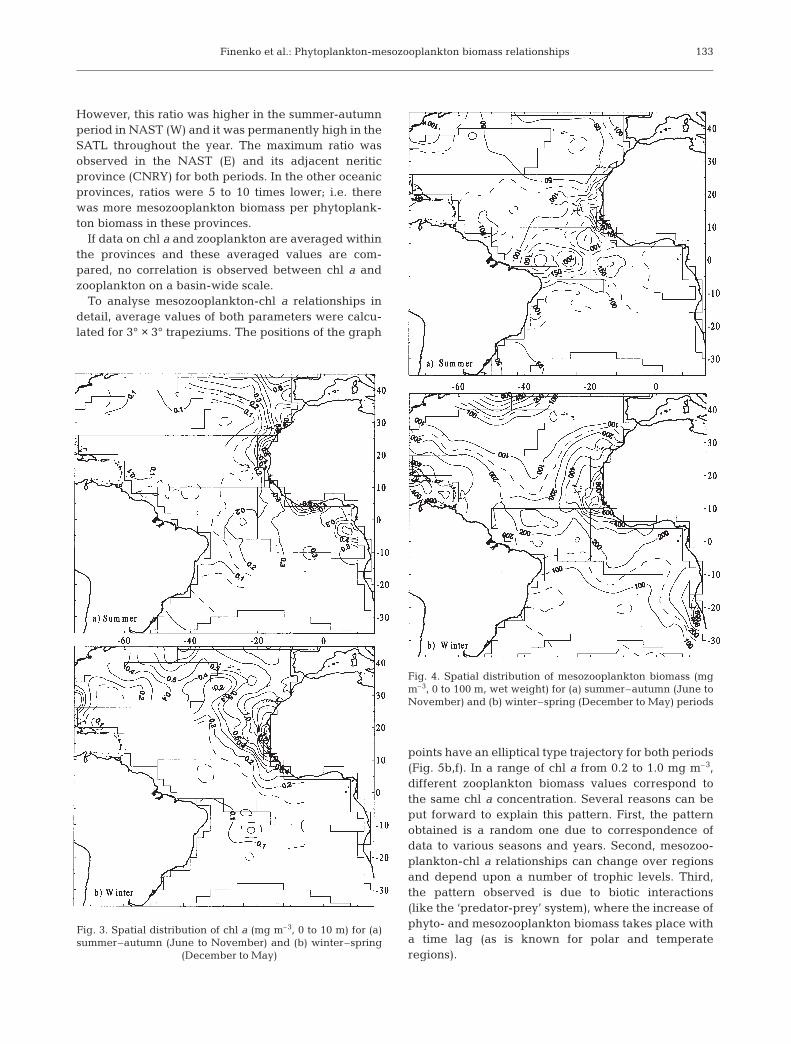
In spite of the sampling carried out during differentexpeditions, seasons and years, the macroscale pat-
terns of chl a and mesozooplankton biomass presentedin Figs. 3 & 4 show similarities in their distributions.
The chl a and zooplankton biomass increased fromoceanic to neritic waters. In the central regions of theNAST and SATL gyres, chl a and mesozooplanktonbiomass levels were low. In the winter-spring season,chl a and zooplankton biomass over the northern andeastern periphery of the subtropical gyre were higherthan those observed in the summer-autumn period.Details of patterns of isolines of biomass and theirgeometry changed over the seasons: the zooplanktondistributions through and around the equatorial regionwere more heterogeneous than those of chl a, espe-cially in the summer-autumn season.
The average biomass for the 8 provinces coveringthe subtropical and tropical zones allowed a compari-
131
Time period Ship and cruise no. Region of Atlantic Source Stn
1950: Jan Grot, 1 Guinea coast Semenova (1961), Chromov (1962) 51958: Mar–May Lomonosov, 2 Central subtropical Vladimirskaya (1972) 51958: Nov Chukovsky, 1 Guinea coast Chromov (1965) 21959: May Lomonosov, 5 Meridional section Kanaeva (1962, 1973) 481959: Aug–Dec Lomonosov, 6 Central subtropical Yashnov (1962) 461960: Jan–Apr Lomonosov, 7 Central subtropical and Cape Blanc Kanaeva (1962, 1973) 181960: Jul–1961: Jan Lomonosov, 8 Central subtropical and Cape Blanc Kanaeva (1962), Yashnov (1962) 111961: Mar Lomonosov, 10 Guinea coast Chromov (1965) 91962: Oct Lomonosov, 12 Guinea coast Chromov (1965) 41963: Mar–May Lomonosov, 13 Central equatorial and Guinea coast Greze (1971) 211963: Sep–Oct Lomonosov, 14 Central equatorial Greze (1971), MHI Archives (1963) 491964: Aug Ak. Kovalevsky Cuba coast Kolesnikov & Kovaleva (1973) 21964: Dec–1965: Feb Lomonosov, 17 Carribean Sea and Northwest MHI Archives (1965) 211964: May Lomonosov, 15 West tropical MHI Archives (1964), Greze (1971) 271967: Jan–Mar Kurchatov, 1 Carribean Sea, Guinea coast Lubni-Gercik (1972, 1975), 12
Kovalevskaya et al. 1968)1969: Mar Kurchatov, 3 West tropical Lubni-Gercik (1972, 1975) 41969: Dec–1970: Mar Lomonosov, 24 Central and Morocco Kolesnikov & Kovaleva (1973) 131970: Nov–Dec Vernadsky, 3 Carribean Sea MHI Archives (1970) 301971: Nov Kurchatov, 11 South Central Voronina (1975) 21972: Apr–May Lomonosov, 26 Central equatorial and Benguela MHI Archives (1972) 421973: Jan–Mar Kurchatov, 14 Carribean Sea Lubni-Gercik (1975) 111973: Jan–Mar Lomonosov, 27 South subtropical Greze et al. (1984) 81974: JanApr Vernadsky, 8 Central tropical MHI Archives74a 531974: Feb–Apr Lomonosov, 28 Central equatorial and Guinea coast MHI Archives (1974b) 361974: Nov Vernadsky, 9 W Mediterranean MHI Archives (1974c) 81976: Jun–Jul Lomonosov, 30 South subtropical Greze et al. (1984) 91976: Jul Vernadsky, 13 Mediterranean MHI Archives (1976) 11977: Jun–Aug Lomonosov, 32 Central equatorial Greze et al. (1984) 1121977: Jul–Aug Vernadsky, 16 Sargasso Sea MHI Archives (1977) 501977: Oct–Nov Vodyanitsky, 3 East subtropical IBSS Archives (1977) 231978: Feb–Apr Est.Oktaybr Easr equatorial ATLANTNIRO archives (1978) 481978: Dec–1979: Feb Vodyanitsky, 5 Southeast subtropical IBSS Archives (1979) 721981: Dec–1982: Jan Vodyanitsky, 11 South subtropical IBSS Archives (1982a) 981982: Jul–Oct Vodyanitsky, 13 Meridional grids IBSS Archives (1982b) 1421984: Aug Vernadsky, 28 West tropical MHI Archives (1984a) 171984: Aug–Oct Vernadsky, 29 West tropical MHI Archives (1984b) 301984: Dec–1985: Feb Vodyanitsky, 18 East Equatorial IBSS Archives (1985a) 421986: Oct–Nov Vodyanitsky, 21 East Equatorial IBSS Archives (1986) 461987: Jul–Sep Vodyanitsky, 24 East Equatorial IBSS Archives (1987) 781989: Oct–Dec Vodyanitsky, 29 East Equatorial and Cape Blanc IBSS Archives (1989) 55
Total: 1310
Table 2. Sources of data for mesozooplankton data base
Mar Ecol Prog Ser 250: 125–144, 2003
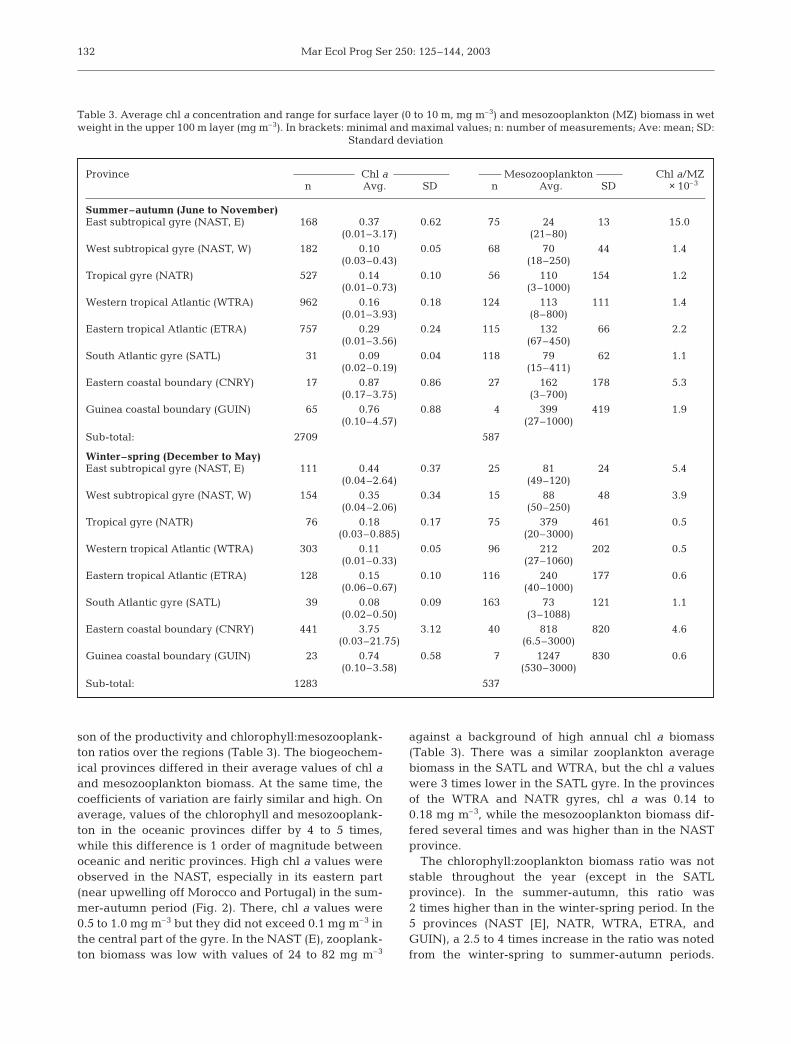
son of the productivity and chlorophyll:mesozooplank-ton ratios over the regions (Table 3). The biogeochem-ical provinces differed in their average values of chl aand mesozooplankton biomass. At the same time, thecoefficients of variation are fairly similar and high. Onaverage, values of the chlorophyll and mesozooplank-ton in the oceanic provinces differ by 4 to 5 times,while this difference is 1 order of magnitude betweenoceanic and neritic provinces. High chl a values wereobserved in the NAST, especially in its eastern part(near upwelling off Morocco and Portugal) in the sum-mer-autumn period (Fig. 2). There, chl a values were0.5 to 1.0 mg m–3 but they did not exceed 0.1 mg m–3 inthe central part of the gyre. In the NAST (E), zooplank-ton biomass was low with values of 24 to 82 mg m–3
against a background of high annual chl a biomass(Table 3). There was a similar zooplankton averagebiomass in the SATL and WTRA, but the chl a valueswere 3 times lower in the SATL gyre. In the provincesof the WTRA and NATR gyres, chl a was 0.14 to0.18 mg m–3, while the mesozooplankton biomass dif-fered several times and was higher than in the NASTprovince.
The chlorophyll:zooplankton biomass ratio was notstable throughout the year (except in the SATLprovince). In the summer-autumn, this ratio was2 times higher than in the winter-spring period. In the5 provinces (NAST [E], NATR, WTRA, ETRA, andGUIN), a 2.5 to 4 times increase in the ratio was notedfrom the winter-spring to summer-autumn periods.
132
Province Chl a Mesozooplankton Chl a/MZn Avg. SD n Avg. SD × 10–3
Summer–autumn (June to November)East subtropical gyre (NAST, E) 168 0.37 0.62 75 24 13 15.0
(0.01–3.17) (21–80)West subtropical gyre (NAST, W) 182 0.10 0.05 68 70 44 1.4
(0.03–0.43) (18–250)Tropical gyre (NATR) 527 0.14 0.10 56 110 154 1.2
(0.01–0.73) (3–1000)Western tropical Atlantic (WTRA) 962 0.16 0.18 124 113 111 1.4
(0.01–3.93) (8–800)Eastern tropical Atlantic (ETRA) 757 0.29 0.24 115 132 66 2.2
(0.01–3.56) (67–450)South Atlantic gyre (SATL) 31 0.09 0.04 118 79 62 1.1
(0.02–0.19) (15–411)Eastern coastal boundary (CNRY) 17 0.87 0.86 27 162 178 5.3
(0.17–3.75) (3–700)Guinea coastal boundary (GUIN) 65 0.76 0.88 4 399 419 1.9
(0.10–4.57) (27–1000)
Sub-total: 2709 587
Winter–spring (December to May)East subtropical gyre (NAST, E) 111 0.44 0.37 25 81 24 5.4
(0.04–2.64) (49–120)West subtropical gyre (NAST, W) 154 0.35 0.34 15 88 48 3.9
(0.04–2.06) (50–250)Tropical gyre (NATR) 76 0.18 0.17 75 379 461 0.5
(0.03–0.885) (20–3000)Western tropical Atlantic (WTRA) 303 0.11 0.05 96 212 202 0.5
(0.01–0.33) (27–1060)Eastern tropical Atlantic (ETRA) 128 0.15 0.10 116 240 177 0.6
(0.06–0.67) (40–1000)South Atlantic gyre (SATL) 39 0.08 0.09 163 73 121 1.1
(0.02–0.50) (3–1088)Eastern coastal boundary (CNRY) 441 3.75 3.12 40 818 820 4.6
(0.03–21.75) (6.5–3000)Guinea coastal boundary (GUIN) 23 0.74 0.58 7 1247 830 0.6
(0.10–3.58) (530–3000)
Sub-total: 1283 537
Table 3. Average chl a concentration and range for surface layer (0 to 10 m, mg m–3) and mesozooplankton (MZ) biomass in wetweight in the upper 100 m layer (mg m–3). In brackets: minimal and maximal values; n: number of measurements; Ave: mean; SD:
Standard deviation
Finenko et al.: Phytoplankton-mesozooplankton biomass relationships
However, this ratio was higher in the summer-autumnperiod in NAST (W) and it was permanently high in theSATL throughout the year. The maximum ratio wasobserved in the NAST (E) and its adjacent neriticprovince (CNRY) for both periods. In the other oceanicprovinces, ratios were 5 to 10 times lower; i.e. therewas more mesozooplankton biomass per phytoplank-ton biomass in these provinces.
If data on chl a and zooplankton are averaged withinthe provinces and these averaged values are com-pared, no correlation is observed between chl a andzooplankton on a basin-wide scale.
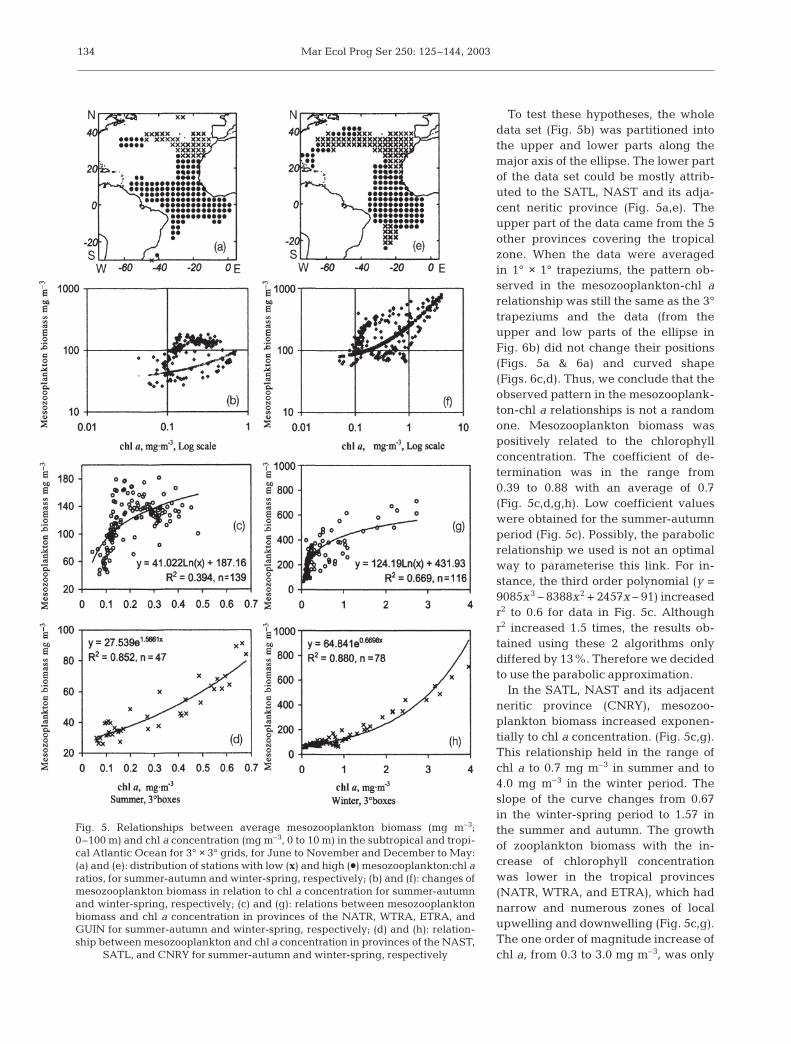
To analyse mesozooplankton-chl a relationships indetail, average values of both parameters were calcu-lated for 3° × 3° trapeziums. The positions of the graph
points have an elliptical type trajectory for both periods(Fig. 5b,f). In a range of chl a from 0.2 to 1.0 mg m–3,different zooplankton biomass values correspond tothe same chl a concentration. Several reasons can beput forward to explain this pattern. First, the patternobtained is a random one due to correspondence ofdata to various seasons and years. Second, mesozoo-plankton-chl a relationships can change over regionsand depend upon a number of trophic levels. Third,the pattern observed is due to biotic interactions(like the ‘predator-prey’ system), where the increase ofphyto- and mesozooplankton biomass takes place witha time lag (as is known for polar and temperateregions).
133
Fig. 3. Spatial distribution of chl a (mg m–3, 0 to 10 m) for (a)summer–autumn (June to November) and (b) winter–spring
(December to May)
Fig. 4. Spatial distribution of mesozooplankton biomass (mgm–3, 0 to 100 m, wet weight) for (a) summer–autumn (June toNovember) and (b) winter–spring (December to May) periods
Mar Ecol Prog Ser 250: 125–144, 2003
To test these hypotheses, the wholedata set (Fig. 5b) was partitioned intothe upper and lower parts along themajor axis of the ellipse. The lower partof the data set could be mostly attrib-uted to the SATL, NAST and its adja-cent neritic province (Fig. 5a,e). Theupper part of the data came from the 5other provinces covering the tropicalzone. When the data were averagedin 1° × 1° trapeziums, the pattern ob-served in the mesozooplankton-chl arelationship was still the same as the 3°trapeziums and the data (from theupper and low parts of the ellipse inFig. 6b) did not change their positions(Figs. 5a & 6a) and curved shape(Figs. 6c,d). Thus, we conclude that theobserved pattern in the mesozooplank-ton-chl a relationships is not a randomone. Mesozooplankton biomass waspositively related to the chlorophyllconcentration. The coefficient of de-termination was in the range from0.39 to 0.88 with an average of 0.7(Fig. 5c,d,g,h). Low coefficient valueswere obtained for the summer-autumnperiod (Fig. 5c). Possibly, the parabolicrelationship we used is not an optimalway to parameterise this link. For in-stance, the third order polynomial (y =9085x3 – 8388x2 + 2457x – 91) increasedr2 to 0.6 for data in Fig. 5c. Althoughr2 increased 1.5 times, the results ob-tained using these 2 algorithms onlydiffered by 13%. Therefore we decidedto use the parabolic approximation.
In the SATL, NAST and its adjacentneritic province (CNRY), mesozoo-plankton biomass increased exponen-tially to chl a concentration. (Fig. 5c,g).This relationship held in the range ofchl a to 0.7 mg m–3 in summer and to4.0 mg m–3 in the winter period. Theslope of the curve changes from 0.67in the winter-spring period to 1.57 inthe summer and autumn. The growthof zooplankton biomass with the in-crease of chlorophyll concentrationwas lower in the tropical provinces(NATR, WTRA, and ETRA), which hadnarrow and numerous zones of localupwelling and downwelling (Fig. 5c,g).The one order of magnitude increase ofchl a, from 0.3 to 3.0 mg m–3, was only
134
Fig. 5. Relationships between average mesozooplankton biomass (mg m–3;0–100 m) and chl a concentration (mg m–3, 0 to 10 m) in the subtropical and tropi-cal Atlantic Ocean for 3° × 3° grids, for June to November and December to May:(a) and (e): distribution of stations with low (x) and high (d) mesozooplankton:chl aratios, for summer-autumn and winter-spring, respectively; (b) and (f): changes ofmesozooplankton biomass in relation to chl a concentration for summer-autumnand winter-spring, respectively; (c) and (g): relations between mesozooplanktonbiomass and chl a concentration in provinces of the NATR, WTRA, ETRA, andGUIN for summer-autumn and winter-spring, respectively; (d) and (h): relation-ship between mesozooplankton and chl a concentration in provinces of the NAST,
SATL, and CNRY for summer-autumn and winter-spring, respectively

Finenko et al.: Phytoplankton-mesozooplankton biomass relationships
accompanied by a doubling of mesozooplankton-chlorophyll relationships (Fig. 5c–h) and the averagechl a concentration in each province (Table 3) mesozoo-plankton biomass in these regions (Fig. 5g). The meso-zooplankton-chlorophyll relationships (Fig. 5c–h) andthe average chl a concentration in each province(Table 3) was used to calculate the mesozooplanktonbiomass. These calculated values were in fairly goodagreement with the observed values in Table 3, with r2 =0.73. Distinct differences between calculated and ob-served values were observed for some of the coastal
provinces, where the average mesozooplankton biomasswas obtained from a low number of measurements (4to 7 stations).
In order to compare the phyto- and zooplanktonbiomass for the 0 to 100 m layer in carbon units, weused average chl a in the 0 to 10 m layer (data for 3°× 3°), ratio (1) and coefficients transferring chl a andwet zooplankton biomass into organic carbon (see‘Materials and methods’). The shapes of the relation-ships of the mesozooplankton and phytoplankton forthe 100 m layer in carbon units per m–2 are similar to
135
Fig. 6. Relationship between average mesozooplankton bio-mass (mg m–3, 0 to 100 m) and chl a concentration (mg m–3, 0to 10 m) for 1° × 1° grid in the subtropical and tropical AtlanticOcean in winter-spring period: (a) distribution of stations withlow (x) and high (d) mesozooplankton:chl a ratio; (b) relationof mesozooplankton biomass to chl a concentration. (c) rela-tionship between mesozooplankton biomass and chl a con-centration in provinces NATR, WTRA, ETRA, and GUIN (a) relationship between mesozooplankton and chl a concen-
tration in provinces of NAST, SATL, and CNRY
Mar Ecol Prog Ser 250: 125–144, 2003
those in Fig. 5. The mesozooplankton carbon in theNAST and SATL provinces for data between Juneand November can be characterized by the followingrelationships:
Ln BMZ = Ln 0.09 + 0.56 BP (3)
for 0.5 ≤ BP ≤ 5; r2 = 0.82, p < 0.001, n = 40
Between December and May:
Ln BMZ = Ln 0.20 + 0.37 BP (4)
for 0.5 ≤ BP ≤ 5; r2 = 0.84, p < 0.001, n = 77
where BMZ and BP are mesozooplankton and phyto-plankton carbon, gC m–2, respectively.
For the other provinces between June and Novem-ber:
BMZ = 0.39 Ln(BP) + 0.46 (5)
for 0.5 ≤ BP ≤ 3; r2 = 0.4, p < 0.01, n = 139
Between December and May:
BMZ = 1.17 Ln(BP) + 0.72 (6)
for 0.5 ≤ BP ≤ 3; r2 = 0.67, p < 0.001, n = 116
Eqs. (4) to (6) lead to the conclusion that the BMZ:Bp
ratio declines with an increasing phytoplankton bio-mass. This refers to the NAST and SALT provinceswhere the BMZ:BP ratio declines from 0.2 to 0.1 fromJune to November and from 0.5 to 0.2 from Decemberto May. In the other provinces, in summer and autumnthe BMZ:BP ratio equals 0.5 at a low level of phyto-plankton biomass (1 gC m–2), and 0.3 at a high level ofphytoplankton biomass (3 gC m–2). In the winter andspring seasons, this ratio increases 1.5 times and variesin the range of 0.4 to 0.8. Thus, in the subequatorialand tropical regions, mesozooplankton biomass is halfthat of phytoplankton. The lowest BMZ:Bp ratios were inthe NAST and SALT provinces, where values were thehalf those measured in the other provinces.
DISCUSSION
Chlorophyll a
Remote sensing of the ocean colour has enabled theestimation for the first time, on a global scale, of thespatial-temporal changes of chlorophyll concentra-tions in the upper layer of the ocean. The analysis ofthese data has shown that chlorophyll changes do cor-relate with oceanic circulation and physical processesfavouring the nutrient flux into the photosynthesiszone (Falkowski et al. 1998). In the central oceanicgyres (spanning NAST and SALT), where nutrientflux is low and chlorophyll concentration is <0.2 mgm–3, the oligotrophic area shrinks from summer to
winter in both hemispheres, between 40° N and 40° S,according to CZCS images (Falkowski et al. 1998).The map of chlorophyll concentration derived hereinfrom direct sampling is less detailed than the CZCSmaps. However, contours of regions with a significantchlorophyll concentration corroborate qualitatively. Inboth maps (i.e. in the CZCS and Fig. 3), high valueswere observed in coastal upwelling regions, whereasthe lowest ones were in the central oceanic gyres.From the map based on direct sampling (Fig. 3), thearea with low chlorophyll is wider in the northernsummer than in winter. From June to November,chlorophyll values in NAST (W), NATR, WTRA, ETRAand SALT were averaged from 1968 through 1992(Table 3). The CZCS data averaged from 1978through 1986 (Longhurst 1995) were different by only0.01 mg m–3. In the coastal provinces (CNRY andGUN), the CZCS data were 20% higher. In Decemberthrough May, differences between satellite and directfield measurements were higher, but they were in arange of ±30%. This low variability enables us toassume that climatic variability of chlorophyll is rela-tively low.
Mesozooplankton
We have compared our sampled data on mesozoo-plankton biomass (Fig. 4) with the map of zooplanktonbiomass published by Tseitlin et al. (1997b), who usedannually averaged values. Tseitlin et al. (1997b) useddata from different mesh sizes and depths sampled inthe 0 to 500 m layer and calculated the values for the0 to 100 m layer; he only used 9 of the 40 cruises givenin Table 2. We restricted ourselves to the data primar-ily collected at night using the same nets covering the0 to 100 m layer. In both maps, elevated values wereobserved outside the coastal upwelling off Africa,where the upwelling zones tend to span 50 to 100 kmcoastal zones. Elevated biomass values can coverseveral hundred km in these coastal zones (Cushing1975). The lowest values were in the NAST and SATLprovinces. According to our map, annual biomass wasin the range of 65 to 75 mg m–3. Tseitlin et al. (1997b)reported values from 25 to 100 mg m–3 for the sameregions. The most distinct differences noted werefor the central SATL where Tseitlin et al. had values<25 mg m–3. They emphasized, however, that due tothe lack of measurement between 20° and 40° S, thesevalues should be taken with caution.
Using concentrations of chlorophyll and mesozoo-plankton converted into carbon we determined thatthe mesozooplankton:phytoplankton ratio varied from0.15 to 1.0 in subtropical and tropical regions. Lowratios are typical for NAST and SALT with the aver-
136

Finenko et al.: Phytoplankton-mesozooplankton biomass relationships
age values of 0.15 and 0.23 for summer and winterseasons respectively. These values were 2.5 to 3 timeshigher in the other provinces. In general, the amountof mesozooplankton carbon per unit of phytoplanktoncarbon is less in low-productive regions, in compari-son with the moderate productive ones. One of thereasons is the difference in the phytoplankton con-sumption rate by mesozooplankton due to variance inits abundance and size structure. For instance, con-sumption of phytoplankton by copepods was studiedby Huskin et al. (2001a,b) in spring and autumn alongthe latitudinal transect from 50° N to 50° S. The ratemeasured by the chlorophyll content in copepodstomachs reached 150 mg C m–2 d–1 in the upwellingregion in the BENG province. At the equator (WTRAand ETRA), where zones of intensive or low up-welling were associated with the divergence, the ratewas 44 to 77 mgC m–2 d–1. In the regions with stablewater mass structure (i.e. NAST and SATL) the ratewas 9 to 12 and 17 to 34 mgC m–2 d–1 respectively,which, in terms of daily grazing, removes 3 to 29%of primary production. Quantitative assessments ofmesozooplankton grazing in regard to primary pro-duction rates were reported for various coastal andoceanic ecosystems by Calbert (2001), who showedthat in a wide range (from 28 to 4000 mgC m–2 d–1),the ingestion rate and the intensity of feeding (i.e.grazing rate normalized by mesozooplankton biomassin carbon units per day) could be represented by aparabolic equation with a degree of 0.64 and 0.53respectively. In low-productive communities, whereprimary production is in the region of 0.05 to 0.25 gCm–2 d–1, algae contribute 3 to 7% of the daily biomassdiet of mesozooplankton in carbon units. In the com-munities with moderate productivity (0.25 to 1.0 g Cm–2 d–1) this contribution was 7 to 15%, whereas inthe productive communities it was 15 to 30% (Calbert2001, Fig. 2). Estimates of phytoplankton consumptionby copepods in oligotrophic subtropical waters nearto the Azores indicated that, depending on season,phytoplankton contributes 4 to 12% (8% average) ofcopepod carbon biomass (Huskin et al. 2001b). For ametabolism of 60% as the level of food assimilation,the minimal food requirements of copepods with awet weight of 5 × 10⁻⁴ to 5 × 10⁻⁵ g should be 20 to40% of their body mass (Sushchenya 1975). Thusit seems obvious that copepods are unable to coverenergy expenditures at the ingestion rates observedin the oligotrophic regions of the tropical and subtrop-ical Atlantic. They can only supplement this energyrequirement if they act as predators. On the otherhand, when primary production changes from 0.05 to1.0 gC m–2 d–1, the phytoplankton contribution to thedaily diet of mesozooplankton can increase approxi-mately 5 times. Therefore, in the moderate productive
regions the amount of mesozooplankton carbon bio-mass per unit of phytoplankton carbon would behigher than in oligotrophic regions. Suggested rea-sons for these discrepancies are that in oligotrophicregions the length of the trophic chains are extendedand mesozooplankton (copepods) only take 3 to 7% ofavailable phytoplankton, while in productive regions,where the trophic chain is short, this consumptionreaches 15 to 30%.
Gasol et al. (1997) summarised the available datato estimate the pyramid of biomass (organic carbon)from 10 well-studied open ocean communities of theAtlantic, Pacific, Indian, and Mediterranean Sea, fromthe northern arctic to the southern subtropical lati-tudes. The authors concluded that the mesozooplank-ton:phytoplankton ratio declines with an increase ofphytoplankton biomass, and the average value of thisratio is about 0.5 in the plankton of low productiveregions (Gasol et al. 1997, their Fig. 4). The ratio (inorganic carbon) range was from 0.15 to 0.70 in theupper 200 m layer in the Indian Ocean (Tranter 1973),which is similar to that in the Atlantic Ocean.
Measurements carried out at a geographically fixedstation in the Arabian Sea (21° N, 64° E) showed thatthis ratio varied from 0.6 to 5.5 (Kumar et al. 2001).These seasonal differences were due to low annualvariability of mesozooplankton biomass (ranging from1.5 to 2.2 gC m–2) although phytoplankton biomassvaried from 0.4 to 2.2 gC m–2. Between 24° N and 10 to15° N phytoplankton varied from 1.1 to 2.2 gC m–2
during the southwest monsoon, and from 1.3 to 1.5 gCm–2 in the northeast monsoon (Shalopyonok et al. 2001).At that phytoplankton concentration, mesozooplank-ton biomass should be 0.5 to 0.8 gC m–2, according toEq. (5). Annually averaged mesozooplankton biomassis in the range from 0.75 to 1 gC m–2 (Rudjakov etal. 1997).
137
Province Mean annual valuesPP Phyto PP:Phyto MZ
gC m–2 d–1 gC m–2 d–1 gC m–2
West and east 0.30 1.20 0.25 0.28subtropical gyre
Tropical gyre 0.29 1.17 0.25 0.74Western tropical Atlantic 0.36 1.26 0.29 0.80Eastern tropical Atlantic 0.43 1.32 0.32 0.96South Atlantic gyre 0.21 1.04 0.20 0.24Coastal provinces 1.40 2.50 0.56 1.50
Table 4. Averaged primary production, phyto-, mesozoo-plankton biomass and rates of primary production to phyto-plankton biomass over the biogeochemical provinces of theAtlantic Ocean. PP: primary production from Longhurst et al.(1995); Phyto: phytoplankton biomass (0–100 m); MZ: meso-
zooplankton biomass (0–100 m)
Mar Ecol Prog Ser 250: 125–144, 2003
Overall, in the upper 100 m layer, in the 6 studiedprovinces (Table 4) the mesozooplankton comprisesapproximately 50% of phytoplankton biomass. Thislayer is the major biotope for phytoplankton algae. Inthe tropical regions of the Atlantic Ocean, the ratiobetween mesozooplankton biomass in the 0–100 m to0–500 m layer was equal to 0.5–0.7 (Lenz et al. 1993).If we accept an average value of 0.6, then it can be saidthat phyto- and mesozooplankton biomass are approx-imately equal in the upper 500 m layer.
Chlorophyll-zooplankton relations
Correlation between chlorophyll in the upper 5 mand chlorophyll, phytoplankton, and mesozooplanktonbiomass in the 0 to 200 m layer were calculated for thePacific (40° N to 40° S) and the Atlantic Ocean (20° N to40° S). Estimates of phyto- and mesozooplankton weremade at the same stations and usually from the same(180 l) bottles sampled at 12 to 24 depths in the upper200 m layer (Vinogradov et al. 1999). According to theircalculations, equation parameters were as follows:
BMZ = 1.16 chl0.433(7)
(r2 = 0.52, p = 0.0000, n = 99
BP = 1.47 chl0.448(8)
(r2 = 0.46, p = 0.0000, n = 95
chl(0–200) = 49.43 chl0.374(9)
(r2 = 0.67, p = 0.0000, n = 92
where BP and BMZ are phyto- and mesozooplanktonbiomass in gC m–2 (0 to 200 m), Chl is chlorophyll con-centration in the upper 5 m layer (mg m–3), Chl(0–200)
is chlorophyll concentration in the upper 200 m layer(mg m–2). From Eqs. (7) and (8) one notices that BMZ
does not increase linearly with BP. Dividing Eq. (7) byEq. (8), then the BMZ:BP ratio would not depend uponphytoplankton in the range from 0.2 to 4.0 gC m–2 andthe derived ratio would be approximately 0.8. ThesePacific-related values are somewhat higher than thoseobserved in the Atlantic Ocean. However, in thePacific Ocean they are for the 200 m layer. For thePacific Ocean regions, the ratio of mesozooplanktonbiomass through different depths (sampled layers) wasquantified by the equation (Tseitlin et al. 1997a):
k = (z1/z2)0.48 (10)
where k is the coefficient transferring biomass in the0–z2 m layer into the biomass in the 0–z1 m layer.According to this equation, biomass (mg m–2 wet bio-mass) in the 200 m layer is 1.4 times higher than thatin the 100 m layer. When the major phytoplankton bio-mass is in the 100 m layer, the ratio BMZ:BP will be 0.6.
This ratio results from Eq. (7) being divided by 1.4, andthis figure being further divided by Eq. (8). The valueis close to the values obtained for NATR, WTRA,ETRA, and GUN. However, it is 2 to 3 times higherthan that in NAST and SATL. Differences are due toestimates of phytoplankton biomass. Eqs. (8) & (9) indi-cate that in the 200 m layer, the chlorophyll:carbon(chl:c) ratio decreases from 0.04 to 0.03 with an in-crease of chlorophyll concentration from 0.05 to 5.0 mgm–3 in the upper layer. These data do not corroboratewell with a stated concept of nutrient impact on chloro-phyll concentration (Geider et al. 1997). When phyto-plankton is limited by nutrients the chl:c ratio de-creases. In oligotrophic waters this ratio differs fromthat measured in the other oceanic regions.
In nutrient-depleted tropical waters, such as thenorth Pacific Ocean, the chl:c ratio within the mixedlayer was 0.008 and declined to 0.04 at greater depth(Campbell et al. 1994). The values do not stronglydiverge from the data obtained in the Atlantic Oceanon chlorophyll concentration and phytoplankton bio-mass in June (1992) in the EUMELI programme. Dur-ing this period the sum of chl a and divinyl-chl a inoligotrophic waters was 34.6 mg m–2 and phytoplank-ton biomass measured with the flow cytometer on cellabundance and carbon content in the cell was 2.0 gCm–2 (Partensky et al. 1996). The comparison of thesevalues results in a chl:c in oligotrophic waters of 0.017.From the above data one can assume that the phyto-plankton biomass in oligotrophic regions, as reportedby Vinogradov et al. (1999), is underestimated by 2 to3 times.
Shushkina et al. (1997, their Table 1) summarised theannual data on average plankton biomass in theWorld’s Ocean. They presented average data whichsuggest that where chl a from satellites is <0.1 mg m–3,phytoplankton biomass is 0.42 gC m–2 and mesozoo-plankton is 0.3 gC m–2 in the upper 200 m layer oftropical oligotrophic waters. In the case of mesotrophicwaters, values were 0.1 to 0.3 mg m–3 for chl a, 0.56 gCm–2 for phytoplankton and 0.95 gC m–2 for meso-zooplankton. The mesozooplankton biomass exceededthat of phytoplankton according to these data inmesotrophic regions. The annual average mesozoo-plankton biomass we obtained for these chlorophyllconcentrations (i.e. 0.1 to 0.3 mg m–3) was 0.45 and0.90 gC m–2. These values were obtained as follows.Using Eq. (1) we determined the total chlorophyllvalue in the 0 to 100 m layer. This value was multipliedby 60 which gave phytoplankton biomass in carbonunits (gC m–2). These values were substituted in Eq. (5)& (6) in order to obtain zooplankton biomass in carbonunits for 2 seasons. The annual mean was obtainedfrom the above numbers. This mean corresponds fairlywell with the estimate given by Shushkina et al. (1997).
138
Finenko et al.: Phytoplankton-mesozooplankton biomass relationships
The mesozooplankton:phytoplankton ratio is different,which also is due to discrepancy in estimates of thephytoplankton biomass. Thus, if the chl a concen-tration per unit surface is calculated by Eq. (9) anddivided by the phytoplankton biomass given byShushkina et al. (1997), the chl a to carbon ratio is 0.03for ultra-oligotrophic and 0.05 for mesotrophic regions.This level has only been observed for phytoplanktonat the lower part of the photosynthetic zone (Furuya1990, Li et al. 1992, Campbell et al. 1994). In the upper10 m layer, with low nutrients, values of the chl a tocarbon ratio achieve 0.01 to 0.007 (Bucket al. 1996, Taylor et al. 1997) and wereon average 0.015 for the 200 m layer.
Seasonal cycles
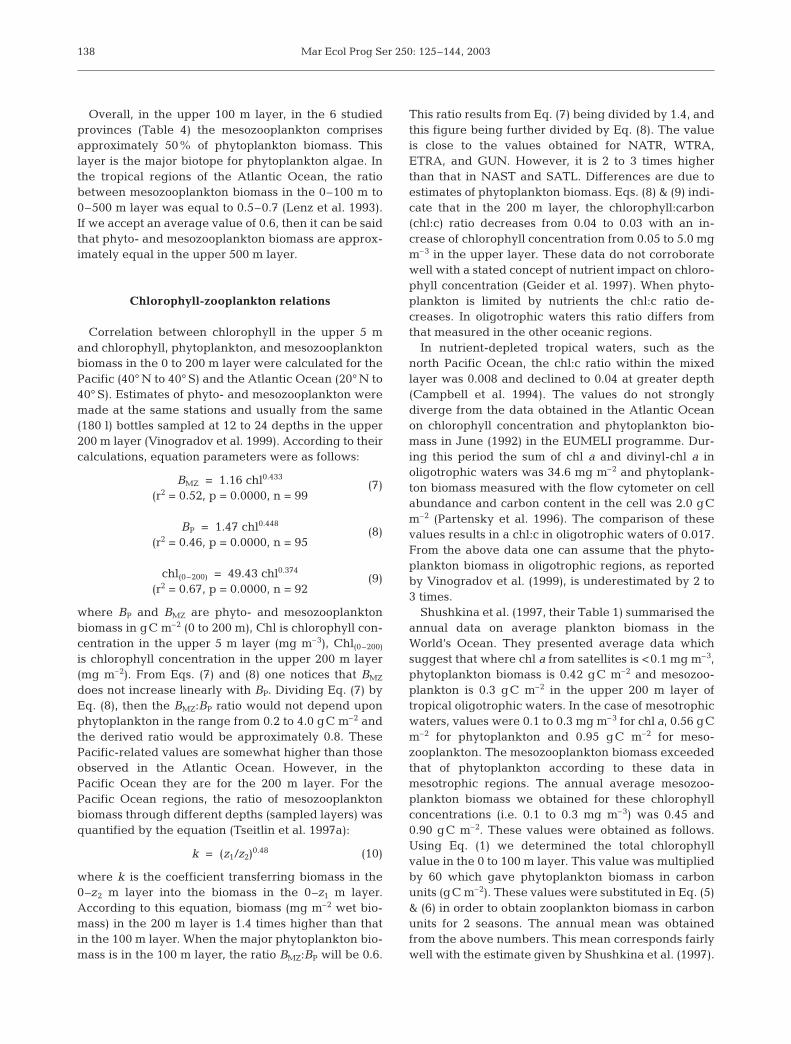
Cushing (1975) has postulated thatthere are 3 patterns of seasonal cyclesin phyto-zooplankton relationships. Thefirst is seen in Antarctic waters, wherethere is 1 summer peak of phyto- andzooplankton. The second is typical fortemperate regions, where there are 2peaks, a major one in spring and a lessdeveloped one in autumn. The seasonalpeaks are not well developed in thethird type, which is typical for tropicalregions. We have analysed seasonalchanges of primary production byLonghurst (1998), phyto- and meso-zooplankton biomass in carbon units(Fig. 7) using remotely sensed seasonalmeasurements of chl a from the upperlayer (Longhurst 1995) and mesozoo-plankton:chl a ratios (Fig. 5). In order todo that, an average surface concentra-tion was calculated for the upper 100 mlayer and multiplied by 60. FromEqs. (3) to (6), mesozooplankton bio-mass was calculated for each province.These enabled an estimate to be calcu-lated of the dynamics of the biomassin tropical regions where field data arescarce. It should be noticed that thesharp decline of the curves betweensummer to winter seasons in Fig. 7 isrelated to the method of data analysis,where only 2 (i.e. not all 4) seasons weredefined.
The maximum of phyto and zooplank-ton biomass in the province of the NASTand SATL occurs in the winter-springperiod. During this time, the phyto-
plankton biomass (1.2 to 1.8 gC m–2) was 1.5 to 2.0times greater than that in the summer-autumn period,and for zooplankton biomass about 2 times. Similarseasonal patterns of zooplankton biomass have beenreported for the Sargasso Sea, near Bermuda (Menzel& Ryther 1961, Madin et al. 2001) and for the north-western Atlantic Ocean (40 to 45° N), based on cope-pod abundance measurements (Planque et al. 1997).The measurements of phytoplankton biomass are inreasonable agreement with the chl a data. From a tran-sect carried out in August to September from 20° W,
139
Fig. 7. Seasonal cycle of primary production (3) described by Longhurst (1998)and phyto- (1) and mesozooplankton (2) biomass in individual provinces calculated with Eqs. (1) to (6) from the CZCS chlorophyll concentration
(Longhurst 1995)
Mar Ecol Prog Ser 250: 125–144, 2003
between 25° and 45° N, Buck et al. (1996) quantifiedthe phytoplankton biomass as 1.07 gC m–2. Theyachieved this by counting the algae using a flowcytometer, and from carbon measurements of individ-ual cells. We calculated the phytoplankton biomassfrom the chl a August values as 0.92 gC m–2 (Fig. 7).Mesozooplankton biomass was measured as 0.82 gCm–2, in April, along 20° W at 33° N by Lenz et al. (1993),and when calculated from the chl a values it was0.6 gC m–2. Similar values of mesozooplankton bio-mass (0.4 gC m–2) and phytoplankton biomass (1.4 gCm–2) were obtained for the northern province (20° W,47° N) at the end of April (Harrison et al. 1993, Lochteet al. 1993).
Seasonal variations of phytoplankton and mesozoo-plankton biomass over the year do not exceed 2 timesin the provinces of the western and tropical gyres(Fig. 7). In these provinces, where a weak upwellingtakes place, the production cycle for biomass has a lowamplitude. In the eastern tropical ocean, where sea-sonal changes of upwelling and hydrographic condi-tions are well developed (Longhurst 1993), changesin phyto- and mesozooplankton can reach 2- to 3-fold(Fig. 7). Minimal values of zooplankton biomass wereobserved in March to May (0.4 to 0.6 gC m–2) andincreased in December to 1.6 gC m–2. Gruzov (1973)and Borgne (1977) reported similar seasonal cyclesfor this region. From the equator to 12° S, zooplanktonbiomass changes from 0.3 to 0.6 gC m–2 during springand by the end of autumn it was 1.0 to 1.5 gC m–2. Thecharacteristic seasonal cycles in the phytoplanktonbiomass are in good agreement with the large-scalechanges of primary production and mesozooplanktonbiomass.
In general, our analysis indicated that the seasonaldynamics of phyto- and mesozooplankton biomasswere fairly similar in the subtropical and tropicalprovinces. Differences are observed in the amplitudeof biomass fluctuations, which are greater in regionswhere nutrient enrichment takes place in the upperlayer. For the large area of the eastern tropical Pacific,logarithmic values of primary production, chlorophylland mesozooplankton biomass were positively corre-lated with each other in each season and area (Black-burn 1981). The main point of interest is that the phyto-and mesozooplankton biomass seasonal changes weregenerally similar and small in the tropical Atlantic andPacific Oceans.
Phytoplankton specific production
Estimates of the plankton biomass of the World'sOcean have a useful role for assessments of the carboncycle. Annual values of phytoplankton production
among oceanic provinces range from 0.2 to 0.4 gC m–2
d–1 (Table 4). This carbon flux is driven by a phyto-plankton biomass of 1.0 to 1.3 gC m–2. On average,phytoplankton biomass in the oceanic provinces turnsover once per 3 to 5 d. The specific daily production ofphytoplankton (yearly average) is relatively constantover different latitudes: it varies between 0.2 and0.3 d–1 in the upper 100 m layer. In coastal provinces,where the concentration of nutrients is high, the spe-cific production is higher, at 0.5 d–1. Therefore, meso-zooplankton biomass might differ several times withthe same primary production level.
CONCLUSION
The concept of biogeochemical provinces wasapplied to the field measurements on chlorophyll andmesozooplankon in the tropical and subtropical re-gions obtained in the past 40 yr. This allowed us toderive trends of mesozooplankton-phytoplankton rela-tionships within the provinces, which could be used torestore macroscale mesozooplankton biomass distri-butions from remotely sensed chlorophyll data.
General patterns were obtained between chloro-phyll concentrations and mesozooplankton biomass onan ocean basin scale. The ratio of the total biomass ofphyto- and mesozooplankton, in carbon units, variedfrom 6 to 1 in the 0 to 100 m layer and on average, thephytoplankton biomass exceeded twice that of meso-zooplankton. The seasonal cycles of phyto- and zoo-plankton biomass for the 6 provinces of the tropicaland subtropical zones were qualitatively comparable.There were nonlinear relationships between meanchlorophyll concentration within the 0 to 10 m layerand mesozooplankton biomass within the 0 to 100 mlayer, which indicated that a different amount ofphytoplankton carbon biomass corresponds to meso-zooplankton biomass. In the moderate productiveregions, the amount of mesozooplankton carbon bio-mass per unit of phytoplankton carbon would behigher than in oligotrophic regions. Relationships wereestablished between primary production, phytoplank-ton and mesozooplankton biomass for the 6 oceanicprovinces.
Acknowledgements. This work was funded by NSF grant#DEB-0203622, NASA grant #NAG 5-3113 and the UKDarwin Initiative grant #162/8/251.
LITERATURE CITED
ATLANTNIRO Archives (1978) Cruise Report of theBMRT ‘Estafeta Oktyabra’. ATLANTNIRO, Kaliningrad(in Russian)
140

Finenko et al.: Phytoplankton-mesozooplankton biomass relationships
Banse K (1994) Grazing and zooplankton production as keycontrols of phytoplankton production in the open ocean.Oceanography 7:13–20
Banse K, English DC (1994) Seasonality of coastal zone colorscanner phytoplankton pigment in the offshore oceans.J Geophys Res 99:7323–7345
Bé AWH, Forns JM, Roels OA (1971) Plankton abundance inthe North Atlantic Ocean. In: Costlow JD (ed) Fertility ofthe sea. Gordon & Breach Publishers, New York, p 17–50
Bender ML, Ducklow W, Kiddon J, Marra J, Martin JH (1992)The carbon balance during the 1989 spring bloom in theNorth Atlantic Ocean at 47° N, 20° W. Deep Sea Res I 39:1707–1725
Berger WH (1989) Global maps of ocean productivity. In:Berger WH, Smetacek VS, Wfer G (eds) Productivity of theocean present and past. John Wiley & Sons, New York,p 429–455
Bezrukov Yr (1989) The structure hydrological of the watersin the northwest tropical Atlantic. Mar Hydrophys J 25:40–46 (in Russian)
Blackburn M (1981) Low latitude gyral regions. In: LonghurstAR (ed) Analysis of marine ecosystems. Academic Press,New York, p 3–29
Bode A, Barquero S, Varela M, Braun JG, deArmas D (2001)Pelagic bacteria and phytoplankton in oceanic waters nearthe Canary Islands in summer. Mar Ecol Prog Ser 209:1–17
Bogorov BG, Vinogradov ME, Voronina NM, Kanaeva IP,Suetova IA (1968) Distribution of zooplankton biomass inthe surface layer of the World Ocean. Dokl Akad NaukSSSR 182:1205–1208 (in Russian)
Borgne R (1977) Étude de la production pelagique de la zoneequatoriale de l’Atlantique a 4° W. Respiration et excretiond’azote et de phosphore du zooplancton. Cah ORSTOMOcéanogr 15:349–362
Buck KR, Chavez FP, Campbell L (1996) Basin-wide distribu-tion of living carbon components and the inverted trophicpyramid of the central gyre of the North Atlantic Ocean,summer 1993. Aquat Microb Ecol 10:283–298
Burkill PH, Edwards ES, John AWG, Sleigh MA (1993) Micro-zooplankton and their herbivorous activity in the north-eastern Atlantic Ocean. Deep Sea Res II 40:479–493
Calbet A (2001) Mesozooplankton grazing effect on primaryproduction: a global comparative analysis in marineecosystems. Limnol Oceanogr 46(7):1824–1830
Campbell L, Nolla HA, Vaulot D (1994) The importance ofProcholorococcus to community structure in the centralNorth Pacific Ocean. Limnol Oceanogr 39:1122–1140
Chromov NS (1962) Distribution and dynamics of the plank-ton and feeding of Sardinella in the fishery regions of thewestern coasts of Africa. Trudy Vses Naychn Inst MorskRybn Hoz Okeanogr 46, C7:204–235 (in Russian)
Chromov NS (1965) Some data on the plankton of the Dakar-Freetown region (data of the 10th and 12th cruises of theRV Michael Lomonosov, 1961–1962). Trudy Vses NaychnInst Morsk Rybn Hoz Okeanogr 57:47–69 (in Russian)
Chromov NS (1986) Some peculiarities of the plankton quan-titative distribution in the Atlantic Ocean. In: Moiseev PA,Parin NV, Elizarov AA (eds) Biologicheskie resyrsyAtlantichekogo okeana Nauka, Moscow, p 157–175 (inRussian)
Corcoran EF, Manken CVW (1969) Productivity of the Tropi-cal Atlantic Ocean. In: Proc Symp Oceanogr Fish ResTropical Atlantic. UNESCO-FAO, Paris, p 57–67
Cressie NAC (1991) Statistics for spatial data. John Wiley &Sons, New York
Cushing DH (1975) Marine ecology and fisheries. CambridgeUniversity Press, Cambridge
Dam HG, Miller CA, Jonasdottir SH (1993) The trophic roleof mesozooplankton at 47° N during the North AtlanticBloom Experiment. Deep Sea Res II 40:197–212
Eppley RW, Stewart E, Abbot MR, Heyman U (1985) Estimat-ing ocean primary production from satellite chlorophyll.Introduction to regional differences and Statistics for theSouthern California Bight. J Plankton Res 7:57–70
Eppley RW, Stewart E, Abbott MR, Owen RW (1987) Estimat-ing ocean production from satellite-derived chlorophyll:insights from the Eastropac data set. Oceanol Acta Proc,Intern Symp Equatorial Vertical Motion, Paris, 6–10 May1985. ORSTOM, Paris, p 109–113
Falkowski PG, Barber RT, Smetacek V (1998) Biogeochemicalcontrols and feedbacks on Ocean primary production.Science 281:200–206
Fasham MJR, Boyd PW, Savidge G (1999) Modeling the rela-tive contributions of autotrophs and heterotrophs to car-bon flow at a Lagrangian JGOFS station in the NortheastAtlantic: the importance of DOC. Limnol Oceanogr 44:80–94
Finenko ZZ (1978) Production in plant populations. In: KinneO (ed) Marine ecology, Vol. 1. John Wiley & Sons, NewYork, p 13–87
Finenko ZZ (1994) Satellite determination of the verticalstructure of phytoplankton biomass and primary pro-duction in the north east Atlantic ocean. Tech NoteNo. 1.94.135. Commission of the European Communities.Institute for Remote Sensing Applications, Ispra, p 1–27
Furuya K (1990) Subsurface chlorophyll maximum in the trop-ical and subtropical western Pacific Ocean: vertical pro-files of phytoplankton biomass and its relationship withchlorophyll a and particulate organic carbon. Mar Biol107:529–539
Galbert A, Agusti S (1999) Latitudinal changes of copepodegg producton rates in Atlantic waters: temperature andfood availability as the main driving factors. Mar Ecol ProgSer 181:155–162
Gallienne CP, Robins DB (1998) Trans-oceanic characteriza-tion of zooplankton community size structure using anoptical plankton counter. Fish Oceanogr 7:147–158
Gasol JM, Giorgio PA, Duarte CM (1997) Biomass distributionin marine planktonic communities. Limnol Oceanogr 42:1353–1363
Geider RJ, MacIntyre L, Kana TM (1997) A dynamic model ofphytoplankton growth and acclimation: responses of thebalanced growth rate and the chlorophyll a: carbon ratioto light, nutrient-limitation and temperature. Mar EcolProg Ser 148:187–200
Gibbons MJ, Hutchings L (1996) Zooplankton diversity andcommunity structure around southern Africa, with specialattention to the Benguela upwelling system. S Afr J Sci 92:63–76
Greze VN (1971) The biological structure and productivityof the tropical Atlantic pelagial. In: Greze VN (ed) Theplankton and biological productivity of the tropicalAtlantic. Naukova Dumka, Kiev, p 214–252 (in Russian)
Greze VN, Latun VS, Novoselov AA, Sheremetieva AI and 25others (1984) The bioproductive system of the large-scaleoceanic gyre. Naukova Dumka, Kiev (in Russian)
Gruzov LN (1973) The productive zone of the equatorialAtlantic: description and condition of its formation. In:Shuleikin VV (ed) Tropical zone of the World Ocean andassociated global processes. Nauka, Moscow, p 258–266
Harrison WG, Head EJH, Horne EPW, Irwin B, Li WKW, Long-hurst AR, Paranjape MA, Platt T (1993) The western NorthAtlantic bloom experiment. Deep Sea Res II 40:279–305
Hoepffner N, Sturm B, Finenko Z, Larkin D (1999) Depth-
141

Mar Ecol Prog Ser 250: 125–144, 2003
integrated primary production in the eastern tropicaland subtropical North Atlantic basin from ocean colourimagery. Int J Remote Sens 20:1435–1456
Huskin I, Anadon R, Woodd-Walker RS, Harris RP (2001a)Basin-scale latitudinal patterns of copepod grazing in theAtlantic Ocean. J Plankton Res 23(12):1361–1371
Huskin I, Anadon R, Medina G, Head RN, Harris RP (2001b)Mesozooplankton distribution and copepod grazing in thesubtropical Atlantic near the Azores: influence of meso-scale structures. J Plankton Res 23(7):671–691
IBSS Archives (1977) Report of the 3rd cruise of RV ‘ProfessorVodyanitsky’. Institute of Biology of the Southern Seas,Sevastopol (in Russian)
IBSS Archives (1979) Report of the 5th cruise of RV ‘ProfessorVodyanitsky’. Institute of Biology of the Southern Seas,Sevastopol (in Russian)
IBSS Archives (1980) Report of the 7th cruise of RV ‘ProfessorVodyanitsky’. Institute of Biology of the Southern Seas,Sevastopol (in Russian)
IBSS Archives (1982a) Report of the 11th cruise of RV ‘Profes-sor Vodyanitsky’. Institute of Biology of the Southern Seas,Sevastopol (in Russian)
IBSS Archives (1982b) Report of the 13th cruise of RV ‘Profes-sor Vodyanitsky’. Institute of Biology of the Southern Seas,Sevastopol (in Russian)
IBSS Archives (1985a) Report of the 18th cruise of RV ‘Profes-sor Vodyanitsky’. Institute of Biology of the Southern Seas,Sevastopol (in Russian)
IBSS Archives (1985b) Report of the 20th cruise of RV ‘Profes-sor Vodyanitsky’. Institute of Biology of the Southern Seas,Sevastopol (in Russian)
IBSS Archives (1986) Report of the 21st cruise of RV ‘ProfessorVodyanitsky’. Institute of Biology of the Southern Seas,Sevastopol (in Russian)
IBSS Archives (1987) Report of the 24th cruise of RV ‘ProfessorVodyanitsky’. Institute of Biology of the Southern Seas,Sevastopol (in Russian)
IBSS Archives (1989) Report of the 29th cruise of RV ‘ProfessorVodyanitsky’. Institute of Biology of the Southern Seas,Sevastopol (in Russian)
Jeffrey SW, Humphrey GF (1975) New specrophotometricequations for determining chlorophylls a, b, c1, c2 in higherplants and phytoplankton. Biochem Physiol Pflanz (BPP)167:191–194
Jeffrey SW, Mantoura RFC, Bjørnland T (1997) Data for theidentification of 47 key phytoplankton pigments. In: Jef-frey SW, Mantoura RFC, Wright SW (eds) Phytoplankton-pigments in oceanography guide lines to modern meth-ods. UNESCO Publishing, Paris, p 447–560
Kanaeva IP (1962) First results of the Soviet plankton researchin the Atlantic Ocean along the IGY and IGS programs.Trudy Vses Naychn Inst Morsk Rybn Hoz Okeanogr 46:201–214 (in Russian)
Kanaeva IP (1973) Quantitative distribution of the plankton inthe tropical region of the Atlantic Ocean (southern part).In: Tropical zone of the World’s Ocean and associatedglobal processes. Moscow, Nauka, p 288–292 (in Russian)
Koblentz-Mishke OI, Volkovinsky VV, Kabanova YuG (1970)Recent data on the quantity of primary production of theworld ocean. Dokl Akad Nauk SSSR 183:1189–1192 (inRussian)
Kolesnikov AN, Kovaleva TN (1973) Some peculiarities of theplankton distribution in the tropical Atlantic. Biol Morya28:85–93 (in Russian)
Kovalevskaya NV, Lubnyi-Gercik EA, Pasternak FA (1968) Bi-ological research in the first pilot cruise of RV ‘Akademi-cian Kurchatov’. Okeanologiya 8:169–171 (in Russian)
Kumar SP, Ramaiah N, Gauns M, Sarma VVSS and 5 others(2001) Physical forcing of biological productivity in theNorthern Arabian sea during the Northeast Monsoon.Deep Sea Res II 48:1115–1126
Lenz J, Morales A, Gunkel J (1993) Mesozooplankton stand-ing stock during the North Atlantic spring bloom study in1989 and its potential grazing pressure on phytoplankton:a comparison between low, medium and high latitudes.Deep Sea Res II 40:559–572
Li WKW (1995) Composition of ultraphytoplankton in thecentral North Atlantic. Mar Ecol Prog Ser 122:1–8
Li WKW, Dickie PM, Irwin BD, Wood AM (1992) Biomassof bacteria, cyanobacteria, prochlorophytes and photosyn-thetic eukaryotes in the Sargasso Sea. Deep Sea Res II 39:501–519
Li WKW, Dickie PM, Harrison WG, Irwin BD (1993) Biomassand production of bacteria and phytoplankton during thespring bloom in the western North Atlantic. Deep Sea ResII 40:307–328
Lochte K, Ducklow HW, Fasham MJR, Stienen C (1993)Plankton succession and carbon cycling at 47° N, 20° Wduring the JGOFS North Atlantic bloom experiment. DeepSea Res II 40:91–114
Longhurst AR (1993) Seasonal cooling and blooming in tropi-cal oceans. Deep Sea Res I 40:2145–2165
Longhurst AR (1995) Seasonal cycles of pelagic productionand consumption. Prog Oceanogr 36:77–167
Longhurst AR (1998) Ecological geography of the Sea. Acad-emic Press, London
Longhurst AR, Harrison G (1989) The biological pump: pro-files of plankton production and consumption in the upperocean. Prog Oceanogr 22:47–123
Longhurst AR, Sathyendranath S, Platt T, Caverhill C (1995)An estimate of global primary production in the oceanfrom satellite radiometer data. J Plankton Res 17:1245–1271
Lorenzen CJ (1970) Surface chlorophyll as an index of thedepth, chlorophyll content, and primary productivity ofthe euphotic layer. Limnol Oceanogr 38:1646–1665
Lubni-Gercik EP (1972) To the plankton of the western tropi-cal zone of the Atlantic Ocean in connection with pecu-liarities of hydrological regime. Okeanologiya 12:364–367(in Russian)
Lubni-Gercik EP (1975) Planktonic research in the regions ofthe Carribean Sea and the Puerto-Rico valley (January-March, 1973). Trudy PP Shirshov Inst Okeanol Akad NaukSSSR 101:35–39
Madin LP, Horgan EF, Steinberg DK (2001) Zooplankton atthe Bermuda Atlantic Time-series Study (BATS) station:diel, seasonal and interannual variation in biomass,1994–1998. Deep-Sea Res II 48:2063–2082
McClain CR, Esaias WE, Feldman GC, Elrod J and 5 others(1990) Physical and biological processes in the NorthAtlantic during the first GARP global experiment. J Geo-phys Res 95:18027–18048
Menzel DW, Ryther JH (1961) Zooplankton in the SargassoSea off Bermuda and its relation to organic production.J Cons Perm Int Explor Mer 26:250–258
MHI Archives (1963) Report of the 14th cruise of RV ‘MichaelLomonosov’. Marine Hydrophysical Institute, Sevastopol(in Russian)
MHI Archives (1964) Report of the 15th cruise of RV ‘MichaelLomonosov’. Marine Hydrophysical Institute, Sevastopol(in Russian)
MHI Archives (1965) Report of the 17th cruise of RV ‘MichaelLomonosov’. Marine Hydrophysical Institute, Sevastopol(in Russian)
142

Finenko et al.: Phytoplankton-mesozooplankton biomass relationships
MHI Archives (1970) Report of the 3rd cruise of RV ‘Academi-cian Vernadsky’. Marine Hydrophysical Institute, Sev-astopol (in Russian)
MHI Archives (1972) Report of the 26th cruise of RV ‘MichaelLomonosov’. Marine Hydrophysical Institute, Sevastopol(in Russian)
MHI Archives (1974a) Report of the 8th cruise of RV ‘Aka-demician Vernadsky’. Marine Hydrophysical Institute,Sevastopol (in Russian)
MHI Archives (1974b) Report of the 28th cruise of RV‘Michael Lomonosov’. Marine Hydrophysical Institute,Sevastopol (in Russian)
MHI Archives (1974c) Report of the 9th cruise of RV ‘Aka-demician Vernadsky’. Marine Hydrophysical Institute,Sevastopol (in Russian)
MHI Archives (1976) Report of the 13th cruise of RV ‘Acade-mician Vernadsky’. Marine Hydrophysical Institute, Sev-astopol (in Russian)
MHI Archives (1977) Report of the 16th cruise of RV ‘Acade-mician Vernadsky’. Marine Hydrophysical Institute, Sev-astopol (in Russian)
MHI Archives (1980a) Report of the 38th cruise of RV ‘MikhailLomonosov’. Marine Hydrophysical Institute, Sevastopol(in Russian)
MHI Archives (1980b) Report of the 40th cruise of RV ‘MikhailLomonosov’. Marine Hydrophysical Institute, Sevastopol(in Russian)
MHI Archives (1984a) Report of the 28th cruise of RV ‘Acade-mician Vernadsky’. Marine Hydrophysical Institute, Sev-astopol (in Russian)
MHI Archives (1984b) Report of the 29th cruise of RV ‘Acad-emician Vernadsky’. Marine Hydrophysical Institute, Sev-astopol (in Russian)
MHI Archives (1985) Report of the 32d cruise of RV ‘Acade-mician Vernadsky’. Marine Hydrophysical Institute, Sev-astopol (in Russian)
MHI Archives (1986a) Report of the 34th cruise of RV ‘Acade-mician Vernadsky’. Marine Hydrophysical Institute, Sev-astopol (in Russian)
MHI Archives (1986b) Report of the 47th cruise of RV ‘MikhailLomonosov’. Marine Hydrophysical Institute, Sevastopol(in Russian)
MHI Archives (1987) Report of the 36th cruise of RV ‘Acade-mician Vernadsky’. Marine Hydrophysical Institute, Sev-astopol (in Russian)
Monger B, McClain Ch, Murtugudde R (1997) Seasonalphytoplankton dynamics in the eastern tropical Atlantic.J Geophys Res 102:12389–12411
Moralis CE, Beod A, Harris RP, Tranter PRG (1991) Grazingof copepod assemblages in the north-east Atlantic: theimportance of the small size fraction. J Plankton Res 13:455–472
Morel A, Berthon JF (1989) Surface pigments, algal biomassprofiles, and potential production of the euphotic layer:relationships reinvestigated in view of remote-sensingapplications. Limnol Oceanogr 34:1545–1562
NASA (1989) Ocean color from space, CZCS images and textprepared by NSF/NASA. Woods Hole OceanographicInstitute with contributions from the Goddard Space FlightCenter, University of Miami and the University of RhodeIsland. Woods Hole Oceanographic Institute, WoodsHole, MA
Neveux J, Lantoine F (1993) Spectrofluorometric assay ofchlorophylls and pheopigments using least square ap-proximation technique. Deep Sea Res I 40:1747–1765
Olson RJ, Chisholm SW, Zettler ER, Altabet MA, DusenberryJA (1990) Spatial and temporal distributions of prochloro-
phyte picoplankton in the North Atlantic Ocean. Deep SeaRes II 37:1033–1051
Partensky F, Blanchot F, Lantoine F, Neveux J, Marie D (1996)Vertical structure of picophytoplankton at differenttrophic sites of the tropical northeastern Atlantic Ocean.Deep Sea Res II 34:1191–1213
Piontkovski SA, Ignatyev SM (1992) Macroscale distributionof zooplankton biomass of the tropical Atlantic. Hydrobiol28:20–25
Piontkovski SA, Williams R (1995) Multiscale variability oftropical ocean zooplankton biomass. ICES J Mar Sci 52:643–656
Piontkovski SA, Tokarev YuN, Bityukov EP, Williams R,Kiefer DA (1997) The bioluminescent field of the AtlanticOcean. Mar Ecol Prog Ser 156:33–41
Planque B, Hays GC, Ibanez F, Gamble JC (1997) Large scalespatial variations in the seasonal abundance of Calanusfinmarchicus. Deep Sea Res I 44:315–326
Platt T, Herman AW (1983) Remote sensing of phytoplanktonin the sea: surface layer chlorophyll as an estimate ofwater-column chlorophyll and primary production. Int JRemote Sens 4:343–351
Rudjakov JA, Tseitlin VB, Kitain VJ (1997) Annual meanmesoplankton biomass distribution in the surface layer ofthe Indian Ocean. Oceanology 37:553–558
Semenova TB (1961) Qualitative and quantitative charac-teristic of the plankton in the fishery regions of Dakar-Takoradi. Tr BALTNIRO 7:34–37 (in Russian)
Semina G (1977) Phytoplankton. In: Vinogradov M (Ed) Bio-logy of the ocean (Biologiya okeana), V.1. Nauka, Moscow,p 58–62 (in Russian)
Shalapyonok A, Olson RJ, Shalapyonok LS (2001) Arabiansea phytoplankton during Southwest and Northeast Mon-soons 1995: composition, size structure and biomass fromindividual cell properties measured by flow cytometry.Deep Sea Res II 48:1231–11261
Shushkina EA, Vinogradov ME, Lebedeva LP, Anohina LL(1997) Production characteristics of epipelagic communi-ties in the World Ocean. Oceanology 37:381–388
Smith RC (1981) Remote sensing and depth distribution ofocean chlorophyll. Mar Ecol Prog Ser 5:359–361
Sushchenya LM (1975) Quantitative patterns of crustaceagrazing. Science and Techniques, Minsk (in Russian)
Taylor AH, Geider RJ, Gilbert JH (1997) Seasonal and latitu-dinal dependencies of phytoplankton carbon-to-chloro-phyll a ratios: results of a modelling study. Mar Ecol ProgSer 152:51–66
Tranter DJ (1973) Seasonal studies of a pelagic ecosystem(meridian 100° E). In: Zeitzschel B (ed) The biology of theIndian Ocean. Chapman & Hall, London, p 487–520
Tseitlin VB, Rudjakov JA, Kitain VJ (1997a) Distribution ofzooplankton biomass in the surface layer of the Pacific.Oceanology 37:75–82
Tseitlin VB, Kitain VJ, Rudjakov JA (1997b) Annual meanmesoplankton biomass distribution in the surface layer ofthe Atlantic Ocean. Oceanology 37:666–671
Verity PG, Stoecker DK, Sieracki ME, Burkill PH, EdwardsES, Tronzo GR (1993) Abundance, biomass and distribu-tion of heterotrophic dinoflagellates during the NorthAtlantic spring bloom. Deep Sea Res II 40:227–244
Vinogradov ME, Shushkina EA (1987) The functioning of theplanctonic communities of the ocean epipelagia. Nesis KN(ed) Nauka, Moscow (in Russian)
Vinogradov ME, Shushkina EA, Nezlin NP, Vedernikov VI(1999) Correlation link between different ecosystem para-meters of the Worlds Ocean epipelagic. Oceanology 39:54–69
143
Mar Ecol Prog Ser 250: 125–144, 2003
Vladimirskaya EV (1972) Distribution and seasonal changesof zooplankton biomass of the north-western part of theAtlantic Ocean. Trudy Vses Naychn Inst Morsk Rybn HozOkeanogr 77(2):38–70 (in Russian)
Voituriez B (1981) Les sous-courants équatoriaux nord et sudet la formation des dômes thermiques tropicaux. OceanolActa 4:497–506
Voronina NM (1975) The ecology and biogeography of theplankton of the Southern Ocean. Trudy PP Shirshov InstOkeanol Akad Nauk SSSR 103:60–87 (in Russian)
Wiebe PH. (1988) Functional regression equations for zoo-plankton displacement volume, wet weight, dry weight,and carbon: a correction. Fish Bull 86:833–835
Williams PJL (1981) Microbial contribution to overall marinemetabolism: direct measurement of respiration. OceanolActa 4:359–364
Yashnov VA (1962) Plankton of the tropical region of theAtlantic Ocean. Tr Mors Gidrophys Inst 25:196–208 (inRussian)
Yoder JA, McClain CR, Feldman GC, Esaias WE (1993)Annual cycles of phytoplankton chlorophyll concentra-tions in the global ocean: a satellite view. Glob Bio-geochem Cycles 7:181–193
Zernova AA (1974) Phytoplankton biomass distribution inthe Atlantic Ocean tropical waters. Oceanology 6:1070–1076
144
Editorial responsibility: Otto Kinne (Editor), Oldendorf/Luhe, Germany
Submitted: November 24, 2000; Accepted: November 19, 2002Proofs received from author(s): March 7, 2003