Variability in snow cover phenology in China from 1952 to 2010 · PDF fileJi and Kang, 2013)....
16
Hydrol. Earth Syst. Sci., 20, 755–770, 2016 www.hydrol-earth-syst-sci.net/20/755/2016/ doi:10.5194/hess-20-755-2016 © Author(s) 2016. CC Attribution 3.0 License. Variability in snow cover phenology in China from 1952 to 2010 Chang-Qing Ke 1,2,6 , Xiu-Cang Li 3,4 , Hongjie Xie 5 , Dong-Hui Ma 1,6 , Xun Liu 1,2 , and Cheng Kou 1,2 1 Jiangsu Provincial Key Laboratory of Geographic Information Science and Technology, Nanjing University, Nanjing 210023, China 2 Key Laboratory for Satellite Mapping Technology and Applications of State Administration of Surveying, Mapping and Geoinformation of China, Nanjing University, Nanjing 210023, China 3 National Climate Center, China Meteorological Administration, Beijing 100081, China 4 Collaborative Innovation Center on Forecast and Evaluation of Meteorological Disasters Faculty of Geography and Remote Sensing, Nanjing University of Information Science & Technology, Nanjing 210044, China 5 Department of Geological Sciences, University of Texas at San Antonio, Texas 78249, USA 6 Collaborative Innovation Center of South China Sea Studies, Nanjing 210023, China Correspondence to: Chang-Qing Ke ([email protected]) Received: 12 February 2015 – Published in Hydrol. Earth Syst. Sci. Discuss.: 30 April 2015 Revised: 11 January 2016 – Accepted: 3 February 2016 – Published: 19 February 2016 Abstract. Daily snow observation data from 672 stations in China, particularly the 296 stations with over 10 mean snow cover days (SCDs) in a year during the period of 1952–2010, are used in this study. We first examine spatiotemporal vari- ations and trends of SCDs, snow cover onset date (SCOD), and snow cover end date (SCED). We then investigate the relationships of SCDs with number of days with tempera- ture below 0 ◦ C (TBZD), mean air temperature (MAT), and Arctic Oscillation (AO) index. The results indicate that years with a positive anomaly of SCDs for the entire country in- clude 1955, 1957, 1964, and 2010, and years with a negative anomaly of SCDs include 1953, 1965, 1999, 2002, and 2009. The reduced TBZD and increased MAT are the main rea- sons for the overall late SCOD and early SCED since 1952. This explains why only 12 % of the stations show significant shortening of SCDs, while 75 % of the stations show no sig- nificant change in the SCDs trends. Our analyses indicate that the distribution pattern and trends of SCDs in China are very complex and are not controlled by any single climate vari- able examined (i.e. TBZD, MAT, or AO), but a combination of multiple variables. It is found that the AO has the maxi- mum impact on the shortening trends of SCDs in the Shan- dong peninsula, Changbai Mountains, Xiaoxingganling, and north Xinjiang, while the combined TBZD and MAT have the maximum impact on the shortening trends of SCDs in the Loess Plateau, Tibetan Plateau, and Northeast Plain. 1 Introduction Snow has a profound impact on the surficial and atmospheric thermal conditions, and is very sensitive to climatic and en- vironmental changes, because of its high reflectivity, low thermal conductivity, and hydrological effects via snowmelt (Barnett et al., 1989; Groisman et al., 1994). The extent of snow cover in the Northern Hemisphere has decreased sig- nificantly over the past decades because of global warming (Robinson and Dewey, 1990; Brown and Robinson, 2011). Snow cover showed the largest decrease in the spring, and the decrease rate increased for higher latitudes in response to larger albedo feedback (Déry and Brown, 2007). In North America, snow depth in central Canada showed the great- est decrease (Dyer and Mote, 2006), and snowpack in the Rocky Mountains in the United States declined (Pederson et al., 2013). However, in situ data showed a significant increase in snow accumulation in winter but a shorter snowmelt sea- son over Eurasia (Bulygina et al., 2009). Decrease in snow- pack has also been found in the European Alps in the last 20 years of the twentieth century (Scherrer et al., 2004), but a very long time series of snowpack suggests large decadal variability and overall weak long-term trends only (Scher- rer et al., 2013). Meteorological data indicated that the snow cover over northwest China exhibited a weak upward trend in snow depth (Qin et al., 2006), with large spatiotemporal vari- ations (Ke et al., 2009; Ma and Qin, 2012). Simulation exper- Published by Copernicus Publications on behalf of the European Geosciences Union.
Transcript of Variability in snow cover phenology in China from 1952 to 2010 · PDF fileJi and Kang, 2013)....
Hydrol. Earth Syst. Sci., 20, 755–770, 2016
www.hydrol-earth-syst-sci.net/20/755/2016/
doi:10.5194/hess-20-755-2016
© Author(s) 2016. CC Attribution 3.0 License.
Variability in snow cover phenology in China from 1952 to 2010
Chang-Qing Ke1,2,6, Xiu-Cang Li3,4, Hongjie Xie5, Dong-Hui Ma1,6, Xun Liu1,2, and Cheng Kou1,2
1Jiangsu Provincial Key Laboratory of Geographic Information Science and Technology, Nanjing University,
Nanjing 210023, China2Key Laboratory for Satellite Mapping Technology and Applications of State Administration of Surveying, Mapping and
Geoinformation of China, Nanjing University, Nanjing 210023, China3National Climate Center, China Meteorological Administration, Beijing 100081, China4Collaborative Innovation Center on Forecast and Evaluation of Meteorological Disasters Faculty of Geography and Remote
Sensing, Nanjing University of Information Science & Technology, Nanjing 210044, China5Department of Geological Sciences, University of Texas at San Antonio, Texas 78249, USA6Collaborative Innovation Center of South China Sea Studies, Nanjing 210023, China
Correspondence to: Chang-Qing Ke ([email protected])
Received: 12 February 2015 – Published in Hydrol. Earth Syst. Sci. Discuss.: 30 April 2015
Revised: 11 January 2016 – Accepted: 3 February 2016 – Published: 19 February 2016
Abstract. Daily snow observation data from 672 stations in
China, particularly the 296 stations with over 10 mean snow
cover days (SCDs) in a year during the period of 1952–2010,
are used in this study. We first examine spatiotemporal vari-
ations and trends of SCDs, snow cover onset date (SCOD),
and snow cover end date (SCED). We then investigate the
relationships of SCDs with number of days with tempera-
ture below 0 ◦C (TBZD), mean air temperature (MAT), and
Arctic Oscillation (AO) index. The results indicate that years
with a positive anomaly of SCDs for the entire country in-
clude 1955, 1957, 1964, and 2010, and years with a negative
anomaly of SCDs include 1953, 1965, 1999, 2002, and 2009.
The reduced TBZD and increased MAT are the main rea-
sons for the overall late SCOD and early SCED since 1952.
This explains why only 12 % of the stations show significant
shortening of SCDs, while 75 % of the stations show no sig-
nificant change in the SCDs trends. Our analyses indicate that
the distribution pattern and trends of SCDs in China are very
complex and are not controlled by any single climate vari-
able examined (i.e. TBZD, MAT, or AO), but a combination
of multiple variables. It is found that the AO has the maxi-
mum impact on the shortening trends of SCDs in the Shan-
dong peninsula, Changbai Mountains, Xiaoxingganling, and
north Xinjiang, while the combined TBZD and MAT have
the maximum impact on the shortening trends of SCDs in
the Loess Plateau, Tibetan Plateau, and Northeast Plain.
1 Introduction
Snow has a profound impact on the surficial and atmospheric
thermal conditions, and is very sensitive to climatic and en-
vironmental changes, because of its high reflectivity, low
thermal conductivity, and hydrological effects via snowmelt
(Barnett et al., 1989; Groisman et al., 1994). The extent of
snow cover in the Northern Hemisphere has decreased sig-
nificantly over the past decades because of global warming
(Robinson and Dewey, 1990; Brown and Robinson, 2011).
Snow cover showed the largest decrease in the spring, and
the decrease rate increased for higher latitudes in response
to larger albedo feedback (Déry and Brown, 2007). In North
America, snow depth in central Canada showed the great-
est decrease (Dyer and Mote, 2006), and snowpack in the
Rocky Mountains in the United States declined (Pederson et
al., 2013). However, in situ data showed a significant increase
in snow accumulation in winter but a shorter snowmelt sea-
son over Eurasia (Bulygina et al., 2009). Decrease in snow-
pack has also been found in the European Alps in the last
20 years of the twentieth century (Scherrer et al., 2004), but
a very long time series of snowpack suggests large decadal
variability and overall weak long-term trends only (Scher-
rer et al., 2013). Meteorological data indicated that the snow
cover over northwest China exhibited a weak upward trend in
snow depth (Qin et al., 2006), with large spatiotemporal vari-
ations (Ke et al., 2009; Ma and Qin, 2012). Simulation exper-
Published by Copernicus Publications on behalf of the European Geosciences Union.

756 Chang-Qing Ke et al.: Variability in snow cover phenology in China from 1952 to 2010
iments using climate models indicated that, with continuing
global warming, the snow cover in China would show more
variations in space and time than ever before (Shi et al., 2011;
Ji and Kang, 2013). Spatiotemporal variations of snow cover
are also manifested as snowstorms or blizzards, particularly
excessive snowfall over a short time duration (Bolsenga and
Norton, 1992; Liang et al., 2008; Gao, 2009; Wang et al.,
2013; Llasat et al., 2014).
Total snow cover days in a year (SCDs hereafter) is an im-
portant index that represents the environmental features of
climate (Ye and Ellison, 2003; Scherrer et al., 2004), and is
directly related to the radiation and heat balance of the Earth–
atmosphere system. The SCDs vary in space and time and
contribute to climate change over short timescales (Zhang,
2005), especially in the Northern Hemisphere. Bulygina et
al. (2009) investigated the linear trends of SCDs observed at
820 stations from 1966 to 2007, and indicated that the dura-
tion of snow cover decreased in the northern regions of Eu-
ropean Russia and in the mountainous regions of southern
Siberia, while it increased in Yakutia and the Far East. Peng
et al. (2013) analysed trends in the snow cover onset date
(SCOD) and snow cover end date (SCED) in relation to tem-
perature over the past 27 years (1980–2006) from over 636
meteorological stations in the Northern Hemisphere. They
found that the SCED remained stable over North America,
whereas there was an early SCED over Eurasia. Satellite-
derived snow data indicated that the average snow season
duration over the Northern Hemisphere decreased at a rate
of 5.3 days per decade between 1972/1973 and 2007/2008
(Choi et al., 2010). Their results also showed that a major
change in the trend of snow duration occurred in the late
1980s, especially in western Europe, central and East Asia,
and mountainous regions in western United States.
There are large spatiotemporal differences in the SCDs in
China (Wang and Li, 2012). Analysis of 40 meteorological
stations from 1971 to 2010 indicated that the SCDs had a sig-
nificant decreasing trend in the western and south-eastern Ti-
betan Plateau, with the largest decline observed in Nielamu,
reaching 9.2 days per decade (Tang et al., 2012). Data anal-
ysis also indicated that the SCDs had a linear decreasing
trend at most stations in the Hetao region and its vicinity
(Xi et al., 2009). However, analysis of meteorological station
data in Xinjiang showed that the SCDs had a slight increas-
ing trend, occurring mainly in 1960–1980 (Q. Wang et al.,
2009). Li et al. (2009) analysed meteorological data from 80
stations in Heilongjiang province, Northeast China. Their re-
sults showed that the snow cover duration shortened, because
of both the late SCOD (by 1.9 days per decade) and early
SCED (by 1.6 days per decade), which took place mainly in
the lower altitude plains.
The SCDs are sensitive to local winter temperature and
precipitation, latitude (Hantel et al., 2000; C. Wang et al.,
2009; Serquet et al., 2011; Morán-Tejeda et al., 2013), and
altitudinal gradient and terrain roughness (Lehning et al.,
2011; Ke and Liu, 2014). Essentially, the variation in SCDs
is mainly attributed to large-scale atmospheric circulation or
climatic forcing (Beniston, 1997; Scherrer and Appenzeller,
2006; Ma and Qin, 2012; Birsan and Dumitrescu, 2014), such
as monsoons, the El Niño–Southern Oscillation, the North
Atlantic Oscillation, and the Arctic Oscillation (AO). Xu et
al. (2010) investigated the relationship between the SCDs
and monsoon index in the Tibetan Plateau and their results
indicated that there were great spatial differences. As an in-
dex of the dominant pattern of non-seasonal sea-level pres-
sure variations, the AO shows a large impact on the win-
ter weather patterns of the Northern Hemisphere (Thomp-
son and Wallace, 1998; Thompson et al., 2000; Gong et al.,
2001; Wu and Wang, 2002; Jeong and Ho, 2005). The inter-
annual variation of winter extreme cold days in the northern
part of eastern China is closely linked to the AO (Chen et al.,
2013). Certainly, the AO plays an important role in the varia-
tion of SCDs. An increase in the SCDs before 1990 and a de-
crease after 1990 have been reported in the Tibetan Plateau,
and snow duration has positive correlations with the winter
AO index (You et al., 2011), and a significant correlation be-
tween the AO and snowfall over the Tibetan Plateau on an
inter-decadal timescale was also reported by Lü et al. (2008).
The focus of this study is the variability in the snow cover
phenology in China. A longer time series of daily observa-
tions of snow cover is used for these spatial and temporal
analyses. We first characterise the spatial patterns of change
in the SCDs, SCOD, and SCED in different regions of China;
we then examine the sensitivity of SCDs to the number of
days with temperature below 0 ◦C (TBZD), the mean air tem-
perature (MAT), and the Arctic Oscillation (AO) index dur-
ing the snow season (between SCOD and SCED).
2 Data and methods
2.1 Data
We use daily snow cover and temperature data in China from
the 1 September 1951 to the 31 August 2010, provided by the
National Meteorological Information Centre of China Mete-
orological Administration (CMA). According to the Specifi-
cations for Surface Meteorological Observations (China Me-
teorological Administration, 2003), an SCD is defined as a
day when the snow cover in the area meets the following re-
quirement: at least half of the observation field is covered by
snow. For any day with at least half of the observation field
covered by snow, snow depth is recorded as a rounded-up
integer. For example, a normal SCD is recorded if the snow
depth is equal to or more than 1.0 cm (measured with a ruler),
or a thin SCD if the snow depth is less than 1.0 cm. A snow
year is defined as the time period from 1 September of the
previous year to 31 August of the current year. For instance,
September, October, and November 2009 are treated as the
autumn season of snow year 2010, December 2009 and Jan-
uary and February 2010 as the winter season of snow year
Hydrol. Earth Syst. Sci., 20, 755–770, 2016 www.hydrol-earth-syst-sci.net/20/755/2016/

Chang-Qing Ke et al.: Variability in snow cover phenology in China from 1952 to 2010 757
Figure 1. Locations of weather stations and major basins, mountains, and plains mentioned in the paper, overlying the digital elevation model
for China.
2010, and March, April, and May 2010 as the spring season
of snow year 2010.
Station density is high in eastern China, where the obser-
vational data for most stations are complete, with relatively
long histories (as long as 59 years), while station density
is low in western China, and the observation history is rel-
atively short, although two of the three major snow regions
are located in western China. If all stations with short time se-
ries are eliminated, the spatial representativeness of the data
set would be a problem. Therefore, a time series of at least
30 years is included in this study.
Because of topography and climate conditions, the discon-
tinuous nature of snowfall is obvious in western China, espe-
cially in the Tibetan Plateau, with patchy snow cover, and
there are many thin SCD records (Ke and Li, 1998). How-
ever, in order to enhance data reliability, according to the
previous studies (An et al., 2009; Wang and Li, 2012), thin
SCDs in the original data set are not taken into account in
this paper.
Totally, there are 722 stations in the original data set. Since
station relocation and changes in the ambient environment
could cause inconsistencies in the recorded data, we imple-
ment strict quality controls (such as inspection for logic, con-
sistency, and uniformity) on the observational data sets in
order to reduce errors (Ren et al., 2005). The standard nor-
mal homogeneity test (Alexandersson and Moberg, 1997) at
the 95 % confidence level is applied to the SCDs and tem-
perature series data in order to identify possible breakpoints.
Time series gap filling is performed after all inhomogeneities
are eliminated, using nearest neighbour interpolation. After
being processed as mentioned above, the 672 stations with
annual mean SCDs greater than 1 (day) are finally selected
for subsequent investigation (Fig. 1).
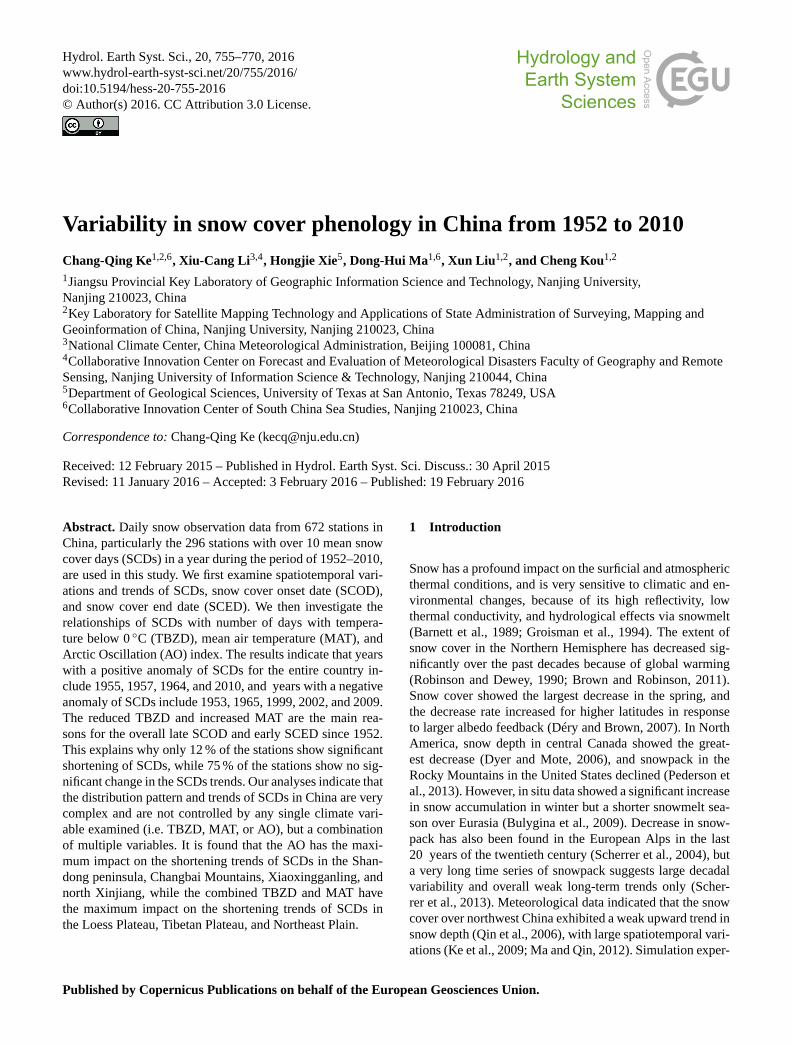
The observation period for each station is different, vary-
ing between 59 years (1951/1952–2009/2010) and 30 years
(1980/1981–2009/2010). Overall, 588 stations have observa-
tion records between 50 and 59 years, 47 stations between
40 and 49 years, and 37 stations between 30 and 39 years
(Fig. 2). Most of the stations with observation records of less
than 50 years are located in remote or high-elevation areas.
All 672 stations are used to analyse the spatiotemporal distri-
bution of SCDs in China, while only 296 stations with more
than 10 annual mean SCDs are used to study the changes of
the relationships of SCOD, SCED, and SCDs with TBZD,
MAT, and the AO index.
The daily AO index constructed by projecting the
daily (00Z) 1000 mb height anomalies poleward of
20◦ N, from http://www.cpc.ncep.noaa.gov/products/precip/
CWlink/daily_ao_index/ao.shtml, is used. A positive (nega-
tive) AO index corresponds to low (high) pressure anomalies
throughout the polar region and high (low) pressure anoma-
lies across the subtropical and midlatitudes (Peings et al.,
2013). We average the daily AO indexes during the snow sea-
son of each station as the AO index of the snow year. A time
series of AO indexes from 1952 to 2010, for each of the 296
stations, is then constructed.
www.hydrol-earth-syst-sci.net/20/755/2016/ Hydrol. Earth Syst. Sci., 20, 755–770, 2016
758 Chang-Qing Ke et al.: Variability in snow cover phenology in China from 1952 to 2010
Figure 2. Percentage of weather stations with different measure-
ment lengths.
A digital elevation model from the Shuttle Radar Topo-
graphic Mission (SRTM, http://srtm.csi.cgiar.org) of the Na-
tional Aeronautics and Space Administration (NASA) with a
resolution of 90 m and the administration map of China are
used as the base map.
2.2 Methods
We apply a Mann–Kendall (MK) test to analyse the trends of
SCDs, SCOD, and SCED. The MK test is an effective tool to
extract the trends of time series, and is widely applied to the
analysis of climate series (Marty, 2008). The MK test is char-
acterised as being more objective, since it is a non-parametric
test. A positive standardised MK statistic value indicates an
upward or increasing trend, while a negative value demon-
strates a downward or decreasing trend. Confidence levels of
90 and 95 % are taken as thresholds to classify the signifi-
cance of positive and negative trends of SCDs, SCOD, and
SCED.
At the same time, if SCDs, SCOD, or SCED at one climate
station has a significant MK trend (above 90 %), their linear
regression analyses are performed against time, respectively.
The slopes of the regressions represent the changing trends
and are expressed in days per decade. The statistical signif-
icance of the slope for each of the linear regressions is as-
sessed by the Student’s t test (two-tailed test of the Student
t distribution), and confidence levels of 90 and 95 % are con-
sidered.
Correlation analysis is used to examine the SCDs relation-
ships with the TBZD, MAT, and the AO index, and the Pear-
son product-moment correlation coefficients (PPMCCs) have
been calculated. The PPMCC is a widely used estimator for
describing the spatial dependence of rainfall processes, and
it indicates the strength of the linear covariance between two
variables (Habib et al., 2001; Ciach and Krajewski, 2006).
The statistical significance of the correlation coefficients is
calculated using the Student’s t test, and confidence levels
above 90 % are considered significant in our analysis.
The spatial distribution of SCDs, SCOD, and SCED, and
their calculated results, are spatially interpolated by applying
the ordinary Kriging method.
3 Results
3.1 Cross-validation of the spatial interpolations
All mean errors are near zero, all average standard errors
are close to the corresponding root mean squared errors,
and all root mean squared standardised errors are close to
1 (Table 1). Prediction errors are unbiased and valid, except
for slightly overestimated coefficients of variation (CVs) and
slightly underestimated SCDs in 2002. Overall, the interpo-
lation results have small errors and are acceptable.
3.2 Spatiotemporal variations of SCDs
3.2.1 Spatial distribution of SCDs
The analysis of observations from 672 stations indicates that
there are three major stable snow regions with more than 60
annual mean SCDs (Li, 1990): Northeast China, north Xin-
jiang, and the Tibetan Plateau, with Northeast China being
the largest of the three (Fig. 3a). In the Daxinganling, Xi-
aoxingganling, and Changbai Mountains of Northeast China,
there are more than 90 annual mean SCDs, corresponding
to a relatively long snow season. The longest annual mean
SCDs, 163 days, is at Arxan Station (in the Daxinganling
Mountains) in Inner Mongolia. In north Xinjiang, the SCDs
are relatively long in the Tianshan and Altun Mountains, fol-
lowed by the Junggar Basin. The annual mean SCDs in the
Himalayas, Nyainqentanglha, Tanggula Mountains, Bayan
Har Mountains, Anemaqen Mountains, and Qilian Moun-
tains of the Tibetan Plateau are relatively long, although most
of these regions have fewer than 60 annual SCDs. The Ti-
betan Plateau has a high elevation, a cold climate, and many
glaciers, but its mean SCDs are not as large as those of the
other two stable snow regions.
Areas with SCDs of 10–60 per year are called unstable
snow regions with annual periodicity (definite snow cover
every winter) (Li, 1990). It includes the peripheral parts of
the three major stable snow regions, Loess Plateau, North-
east Plain, North China Plain, Shandong peninsula, and re-
gions north of the Qinling–Huaihe line (along the Qinling
Mountains and Huaihe River to the east). Areas with SCDs
of 1–10 per year are called unstable snow regions without an-
nual periodicity (the mountainous regions are excluded) (Li,
1990). It includes the Qaidam Basin, the Badain Jaran desert,
the peripheral parts of Sichuan Basin, the northeast part of
the Yungui Plateau, and the middle and lower Yangtze River
Plain. Areas with occasional snow and mean annual SCDs
of less than 1.0 (day) are distributed north of the Sichuan
Hydrol. Earth Syst. Sci., 20, 755–770, 2016 www.hydrol-earth-syst-sci.net/20/755/2016/
Chang-Qing Ke et al.: Variability in snow cover phenology in China from 1952 to 2010 759
Table 1. Prediction errors of cross-validation for the spatial interpolation with the ordinary Kriging method (the unit is day for snow cover
days (SCDs), snow cover onset day (SCOD), and snow cover end day (SCED); there is no unit for the coefficient of variation (CV)).
Item Mean Average standard Root mean Root mean squared
(figures) error error squared error standardised error
Mean SCDS (Fig. 3a) −0.0230 11.0558 13.7311 1.1097
CV (Fig. 3b) 0.0017 0.7364 0.5510 0.7579
SCDS in 1957 (Fig. 5a) −0.0015 11.1561 13.4662 1.1898
SCDS in 2002 (Fig. 5b) 0.0306 6.6185 8.5887 1.2522
SCDS in 2008 (Fig. 5c) 0.0477 7.3167 8.1968 1.0969
SCED in 1957 (Fig. 5d) −0.0449 15.0528 18.9860 1.1921
SCED in 1997 (Fig. 5e) 0.0696 15.5722 17.7793 1.1040
SCOD in 2006 (Fig. 5f) 0.0482 15.4503 16.1757 1.0449
SCOD (Fig. 8a) 0.0293 11.2458 13.9078 1.1712
SCED (Fig. 8b) −0.0222 15.2265 18.3095 1.1308
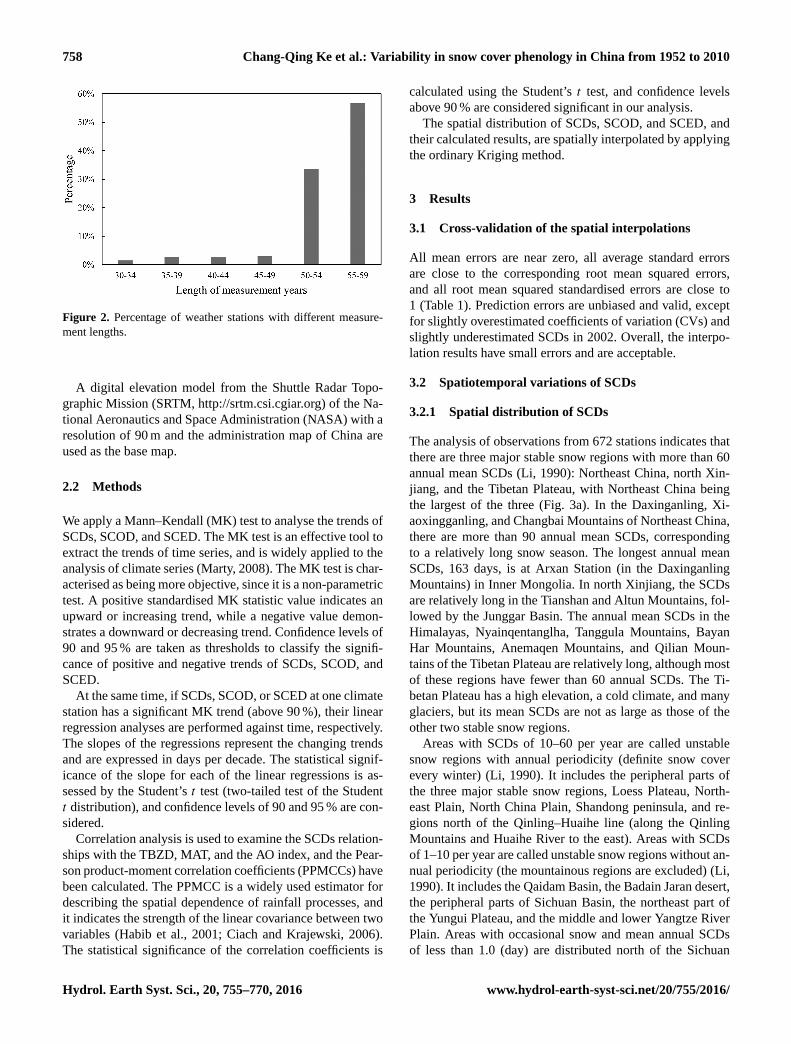
Figure 3. Annual mean snow cover days (SCDs) from 1980/1981 to 2009/2010 (a), and their coefficients of variation (CVs) (b).
Basin and in the belt along Kunming, Nanling Mountains,
and Fuzhou (approximate latitude of 25◦ N). Because of the
latitude or local climate and terrain, there is no snow in the
Taklimakan Desert, Turpan Basin, the Yangtze River Valley
in the Sichuan Basin, the southern parts of Yunnan, Guangxi,
Guangdong, and Fujian, and on the island of Hainan.
The spatial distribution pattern of SCDs based on climate
data with longer time series is similar to previous studies
(Li and Mi, 1983; Li, 1990; Liu et al., 2012; C. Wang et
al., 2009; Wang and Li, 2012). Snow distribution is closely
linked to latitude and elevation, and is generally consistent
with the climate zones (Lehning et al., 2011; Ke and Liu,
2014). There are relatively more SCDs in Northeast China
and north Xinjiang, and fewer SCDs to the south (Fig. 3a).
In the Tibetan Plateau, located in south-western China, the
elevation is higher than eastern areas at the same latitude,
and the SCDs are greater than in eastern China (Tang et al.,
2012). The amount of precipitation also plays a critical role
in determining the SCDs (Hantel et al., 2000). In the north-
eastern coastal areas of China, which are affected consider-
ably by the ocean, there is much precipitation. In north Xin-
jiang, which has a typical continental (inland) climate, the
precipitation is less than in Northeast China, and there are
more SCDs in the north of Northeast China than in north
Xinjiang (Dong et al., 2004; Q. Wang et al., 2009). More-
over, the local topography has a relatively large impact on
the SCDs (Lehning et al., 2011). The Tarim Basin is located
inland, with relatively little precipitation, thus snowfall there
is extremely rare except in the surrounding mountains (Li,
1993). The Sichuan Basin is surrounded by high mountains,
therefore situated in the precipitation shadow in winter, re-
sulting in fewer SCDs (Li and Mi, 1983; Li, 1990).
The three major stable snow regions, Northeast China,
north Xinjiang, and the eastern Tibetan Plateau, have smaller
CVs in the SCDs (Fig. 3b). Nevertheless, the SCDs in arid or
semi-arid regions, such as South Xinjiang, the northern and
south-western Tibetan Plateau, and central and western Inner
Mongolia, show large fluctuations because there is little pre-
cipitation during the cold seasons, and certainly little snow-
fall and large CVs of SCDs. In particular, the Taklimakan
www.hydrol-earth-syst-sci.net/20/755/2016/ Hydrol. Earth Syst. Sci., 20, 755–770, 2016

760 Chang-Qing Ke et al.: Variability in snow cover phenology in China from 1952 to 2010
Figure 4. Seasonal variation of SCDs; the number in the centre de-
notes annual mean SCDs, the blue colour in the circle the SCDs
represents the winter season, the green colour spring, and the red
colour autumn.
Desert in the Tarim Basin is an extremely arid region, with
only occasional snowfall. Therefore, it has a very large range
of fluctuations of SCDs. Additionally, the middle and lower
Yangtze River Plain also has large SCDs fluctuations because
of warm-temperate or subtropic climate with a short winter
and little snowfall. Generally, the fewer the SCDs, the larger
the CV (C. Wang et al., 2009). This is consistent with other
climate variables, such as precipitation (Yang et al., 2015).
3.2.2 Temporal variations of SCDs
Seasonal variation of SCDs is primarily controlled by tem-
perature and precipitation (Hantel et al., 2000; Scherrer et
al., 2004; Liu et al., 2012). In north Xinjiang and North-
east China, snow is primarily concentrated in the win-
ter (Fig. 4). In these regions, the SCDs exhibit a single-
peak distribution. In the Tibetan Plateau, however, the sea-
sonal variation of SCDs is slightly different, i.e. more snow
in the spring and autumn combined than in the winter.
The mean temperature and precipitation at Dangxiong sta-
tion (30◦29′ N, 91◦06′ E; 4200.0 m) in winter are −7.7 ◦C
and 7.9 mm, respectively, and those at Qingshuihe station
(33◦48′ N, 97◦08′ E; 4415.4 m) are −15.8 ◦C and 16.3 mm,
respectively. It is too cold and dry to produce enough snow
in the Tibetan Plateau (Hu and Liang, 2014).
The temporal variation of SCDs shows very large differ-
ences from 1 year to another. We define a year with a posi-
tive (negative) anomaly of SCDs in the following way: for a
given year, if 70 % of the stations have a positive (negative)
anomaly and 30 % of the stations have SCDs larger (smaller)
than the mean± 1 standard deviation (1 SD), it is regarded as
a year with a positive (negative) anomaly of SCDs. The years
with a positive anomaly of SCDs in China are 1955, 1957,
1964, and 2010 (Table 2). Moreover, the stations with SCDs
larger than the mean + 2 SD account for 25 and 26 % of all
stations in 1955 and 1957, respectively, and these 2 years
are considered as years with an extremely positive anomaly
of SCDs. In 1957, there was an almost nationwide positive
anomaly of SCDs except for north Xinjiang (Fig. 5a). This
1957 event had a great impact on agriculture, natural ecol-
ogy, and social-economic systems, and resulted in a heavy
snow-caused disaster (Hao et al., 2002).
Years with a negative anomaly of SCDs include 1953,
1965, 1999, 2002, and 2009 (Table 2). If there is too little
snowfall in a specific year, a drought is possible. Drought
resulting from little snowfall in the cold season is a slow pro-
cess and can sometimes cause serious damages. For exam-
ple, East China displayed an apparent negative anomaly of
SCDs in 2002 (Fig. 5b), and had very little snowfall, lead-
ing to an extreme winter drought in Northeast China, where
snowfall is the primary form of winter precipitation (Fang et
al., 2014).
Because of different atmospheric circulation backgrounds,
vapour sources, and topographic conditions in different re-
gions of China, there are great differences in the SCDs, even
in 1 year. For example, in 2008, there were more SCDs
and longer snow duration in the Yangtze River Basin, North
China, and the Tianshan Mountains in Xinjiang (Fig. 5c),
especially in the Yangtze River Basin, where large snowfall
was normally not observed. However, four episodes of severe
and persistent snow, extreme low temperatures, and freezing
weather occurred in 2008 and led to a large-scale snowstorm
in this region (Gao, 2009). As reported by the Ministry of
Civil Affairs of China, the 2008 snowstorm killed 107 peo-
ple and caused losses of USD 15.45 billion. Both the SCDs
and scale of economic damage broke records from the past
5 decades (Wang et al., 2008). On the contrary, there was no
snowstorm in north Xinjiang, the Tibetan Plateau, and Pan-
Bohai Bay region in 2008. Moreover, Northeast China had
an apparent negative anomaly of SCDs (Fig. 5c).
There are great differences in the temporal variations of
SCDs, even in the three major stable snow regions. If we re-
define a year with a positive (negative) anomaly of SCDs us-
ing a much higher standard (i.e. 80 % of stations have a pos-
itive (negative) anomaly and 40 % of stations have an SCDs
larger (smaller) than the mean ±1 SD), it is found that 1957,
1973, and 2010 are years with a positive anomaly of SCDs
in Northeast China, while 1959, 1963, 1967, 1998, 2002,
and 2008 are years with a negative anomaly of SCDs (Ta-
ble 3, Fig. 5a–c). Years with a positive anomaly of SCDs in
north Xinjiang include 1960, 1977, 1980, 1988, 1994, and
2010, and years with a negative anomaly of SCDs include
1974, 1995, and 2008 (Table 3, Fig. 5c). North Xinjiang is
one of the regions prone to extreme snow events, where fre-
quent heavy snowfall greatly affects the development of ani-
mal husbandry (Hao et al., 2002).
Hydrol. Earth Syst. Sci., 20, 755–770, 2016 www.hydrol-earth-syst-sci.net/20/755/2016/

Chang-Qing Ke et al.: Variability in snow cover phenology in China from 1952 to 2010 761
Table 2. Percentage (%) of stations with anomalies (P for positive and N for negative) of snow cover days (SCDs) in a year, snow cover onset
date (SCOD), and snow cover end date (SCED). Percentage (%) of stations with anomalies of SCDs, SCOD, and SCED larger (smaller)
than the mean ± 1 or 2 standard deviations (SD), with the bold number denoting years with a positive (negative) anomaly of SCDs, and late
(early) years for SCOD or SCED in China. All the percentages are calculated based on 672 stations.
SCDs SCOD SCED
Year P 1 SD 2 SD −2 SD −1 SD N P 1 SD 2 SD −2 SD −1 SD N P 1 SD 2 SD −2 SD −1 SD N
1952 31 2 0 13 33 69 69 40 21 2 9 31 55 17 2 12 17 45
1953 28 7 0 3 36 72 40 8 2 2 18 60 37 8 1 10 18 63
1954 57 31 12 0 8 43 35 8 4 1 18 65 56 11 0 0 10 44
1955 79 45 25 1 5 21 37 9 4 1 22 63 77 21 2 1 6 23
1956 46 10 0 0 4 54 69 20 2 0 9 31 61 24 1 2 12 39
1957 85 62 26 0 3 15 26 6 1 0 15 74 84 35 5 1 4 16
1958 48 15 4 0 14 52 46 17 0 0 18 54 52 17 3 4 18 48
1959 28 7 1 4 23 72 53 26 8 1 18 47 59 23 3 1 5 41
1960 37 13 3 0 16 63 49 11 2 0 10 51 59 24 6 4 18 41
1961 36 7 1 1 18 64 25 9 2 1 27 75 30 6 1 7 26 70
1962 41 11 3 0 10 59 44 13 4 2 10 56 58 18 3 0 11 42
1963 25 5 2 2 27 75 34 14 5 1 23 66 51 14 0 8 17 49
1964 76 36 11 0 1 24 31 3 1 4 24 69 64 18 1 0 5 36
1965 26 8 0 1 32 74 59 18 5 1 8 41 55 14 2 3 17 45
1966 28 6 1 0 13 72 46 21 6 0 13 54 67 12 1 2 5 33
1967 31 5 0 3 23 69 40 11 3 2 15 60 43 5 0 3 12 57
1968 61 29 12 3 8 39 35 8 1 0 13 65 34 13 0 4 26 66
1969 42 18 5 4 21 58 45 13 1 3 20 55 67 20 1 1 7 33
1970 46 15 1 2 11 54 38 10 3 2 24 62 62 19 3 0 7 38
1971 53 12 1 1 9 47 38 15 4 1 17 62 53 9 1 1 8 47
1972 55 23 11 0 8 45 37 9 2 1 21 63 46 16 4 1 9 54
1973 50 19 2 1 7 50 35 10 1 2 23 65 43 9 1 1 8 57
1974 33 8 0 3 23 67 53 29 6 1 11 47 52 12 1 1 10 48
1975 41 10 4 1 15 59 26 7 2 1 21 74 43 15 3 2 16 57
1976 35 11 3 1 23 65 60 25 12 0 5 40 77 31 5 1 3 23
1977 45 20 3 0 9 55 28 5 1 0 25 72 57 14 3 2 12 43
1978 60 22 8 0 2 40 43 13 2 2 13 57 55 10 1 0 8 45
1979 41 8 1 0 7 59 43 11 1 0 20 57 79 32 2 0 4 21
1980 39 12 1 0 5 61 41 9 1 1 16 59 82 27 2 0 4 18
1981 42 13 2 0 13 58 45 20 4 2 18 55 44 13 1 2 15 56
1982 40 12 1 1 15 60 23 9 2 0 30 77 58 23 6 6 16 42
1983 50 19 6 0 12 50 44 14 1 1 11 56 67 26 2 1 9 33
1984 26 9 1 1 28 74 68 32 16 0 5 32 48 8 1 2 13 52
1985 66 24 3 0 3 34 32 8 1 1 24 68 46 8 2 1 8 54
1986 50 14 2 0 12 50 32 5 1 1 19 68 63 18 4 3 10 38
1987 67 23 4 0 4 33 40 7 1 2 15 60 60 23 3 1 8 40
1988 56 17 1 0 2 44 24 6 1 3 26 76 69 23 0 1 7 31
1989 47 18 4 0 11 53 71 29 7 1 6 29 41 6 1 3 18 59
1990 56 19 2 0 7 44 52 9 1 0 9 48 49 12 1 2 10 51
1991 34 4 0 2 9 66 60 21 3 0 4 40 72 26 3 1 4 28
1992 50 13 4 1 7 50 54 18 5 0 4 46 50 13 1 5 19 50
1993 58 19 2 1 4 42 43 9 1 0 17 57 49 18 2 2 21 51
1994 58 19 2 0 4 42 28 6 2 1 22 72 39 11 0 3 18 61
1995 36 10 3 3 15 64 57 24 3 1 15 43 49 8 1 7 18 51
1996 26 8 2 2 22 74 71 30 4 0 5 29 55 11 1 2 15 45
1997 37 3 0 1 18 63 44 13 3 2 12 56 18 4 2 9 49 82
1998 34 8 2 4 18 66 37 11 3 1 20 63 30 9 1 7 25 70
1999 25 4 1 1 35 75 61 23 12 1 7 39 51 11 2 5 15 49
2000 64 17 4 0 5 36 59 18 2 0 9 41 39 7 0 5 22 61
2001 67 29 8 0 5 33 39 16 2 1 22 61 42 17 1 3 15 58
2002 17 2 0 5 32 83 59 22 4 1 4 41 31 6 0 12 30 69
2003 57 29 4 1 8 43 36 6 1 0 21 64 50 9 2 6 18 50
2004 35 3 1 0 16 65 42 11 2 1 26 58 32 7 1 13 33 68
2005 60 18 1 0 4 40 48 15 2 0 11 52 33 4 0 2 19 67
2006 48 11 3 0 8 52 70 33 7 0 5 30 57 16 0 1 10 43
2007 30 6 1 0 22 70 69 25 5 1 6 31 29 3 1 7 26 71
2008 43 19 5 3 20 57 68 27 7 0 8 32 41 10 1 4 24 59
2009 24 6 0 1 31 76 73 23 9 0 5 27 27 4 0 3 25 73
2010 75 42 11 0 10 25 42 11 2 1 18 58 72 20 1 1 7 28
www.hydrol-earth-syst-sci.net/20/755/2016/ Hydrol. Earth Syst. Sci., 20, 755–770, 2016

762 Chang-Qing Ke et al.: Variability in snow cover phenology in China from 1952 to 2010
Figure 5. SCDs anomalies in 1957 (a), 2002 (b) and 2008 (c), anomaly of snow cover onset date (SCOD) in 2006 (d), and anomalies of
snow cover end date (SCED) in 1957 (e) and 1997 (f).
Years with a positive anomaly of SCDs in the Tibetan
Plateau include 1983 and 1990, whereas years with a neg-
ative anomaly of SCDs include 1965, 1969, and 2010 (Ta-
ble 3). The climate in the Tibetan Plateau is affected by the
Indian monsoon from the south, westerlies from the west,
and the East Asian monsoon from the east (Yao et al., 2012).
Therefore, there is a spatial difference in the SCDs within the
Tibetan Plateau, and a difference in the spatiotemporal distri-
bution of snowstorms (Wang et al., 2013). Our results differ
from the conclusions drawn by Dong et al. (2001), as they
only used data from 26 stations, covering only a short period
(1967–1996).
Hydrol. Earth Syst. Sci., 20, 755–770, 2016 www.hydrol-earth-syst-sci.net/20/755/2016/

Chang-Qing Ke et al.: Variability in snow cover phenology in China from 1952 to 2010 763
Table 3. The same as Table 2, but only for the years with a positive (negative) anomaly of SCDs and only for the three major stable snow
regions: Northeast China (78 stations), north Xinjiang (21 stations), and the Tibetan Plateau (63 stations).
Northeast China North Xinjiang Tibetan Plateau
Year P 1 SD 2 SD −2 SD −1 SD N P 1 SD 2 SD −2 SD −1 SD N P 1 SD 2 SD −2 SD −1 SD N
1957 98 72 16 0 0 2 22 0 0 2 33 78 74 52 13 0 4 26
1959 2 0 0 15 73 98 88 38 0 0 0 12 37 11 3 0 6 63
1960 39 14 1 0 26 61 100 88 29 0 0 0 23 0 0 3 30 77
1963 11 0 0 6 41 89 26 0 0 5 26 74 20 0 0 0 28 80
1965 66 24 0 1 16 34 21 0 0 0 37 79 12 4 0 4 50 88
1967 16 0 0 14 59 84 78 22 0 0 6 22 23 6 0 0 15 77
1969 21 1 0 15 43 79 78 28 0 0 6 22 4 0 0 6 53 96
1973 89 60 4 0 0 11 42 0 0 5 11 58 36 11 2 0 21 64
1974 55 18 0 3 21 45 5 0 0 21 58 95 38 3 0 2 14 62
1977 73 32 4 0 5 27 95 74 0 0 5 5 36 19 7 0 7 64
1980 65 18 1 0 8 35 95 63 5 0 0 5 45 10 2 0 3 55
1983 62 23 3 0 3 38 26 0 0 0 21 74 95 60 19 0 0 5
1988 70 23 0 0 3 30 100 68 11 0 0 0 52 22 5 0 2 48
1990 40 0 0 0 11 60 32 5 0 0 21 68 81 41 3 0 0 19
1994 94 29 1 0 0 6 95 53 0 0 0 5 46 14 2 0 11 54
1995 33 1 0 3 15 67 5 0 0 21 74 95 75 42 11 0 0 25
1998 4 0 0 14 64 96 63 5 0 5 11 37 82 39 12 0 0 18
2002 4 0 0 19 63 96 26 0 0 5 21 74 22 2 0 0 15 78
2008 7 0 0 11 48 93 5 0 0 5 47 95 59 6 0 2 14 41
2010 92 69 17 0 3 8 100 67 11 0 0 0 15 6 0 2 50 85
Table 4. Significance of trends according to the Mann–Kendall test of SCDs, SCOD, and SCED, significance of relationships among SCDs,
SCOD, SCED, respectively, with TBZD, significance of relationship between SCDs and MAT, and significance of relationship between
SCDs and AO (296 stations in total). All of them have two significance levels, 90 and 95 %.
SCDs SCOD SCED
95 % 90 % I∗ 95 % 90 % I∗ 95 % 90 % I∗
Trend Positive 19 37 125 178 196 74 1 3 37
Negative 26 35 99 5 8 18 72 103 153
TBZD Positive 124 154 126 0 1 50 72 99 170
Negative 1 1 15 61 87 158 0 2 25
MAT Positive 0 2 22
Negative 114 148 124
AO Positive 31 45 90
Negative 33 48 113
Note: I∗ represents insignificant trends or relations.
3.2.3 SCD trends
Changing trends of annual SCDs are examined, as shown in
Fig. 6a, and summarised in Table 4. Among the 296 stations,
there are 35 stations (12 %) with a significant negative trend,
and 37 stations (13 %) with a significant positive trend (both
at the 90 % level), while 75 % of stations show no signifi-
cant trends. The SCDs exhibit a significant downward trend
in the Xiaoxingganling, the Changbai Mountains, the Shan-
dong peninsula, the Qilian Mountains, the North Tianshan
Mountains, and the peripheral zones in the south and eastern
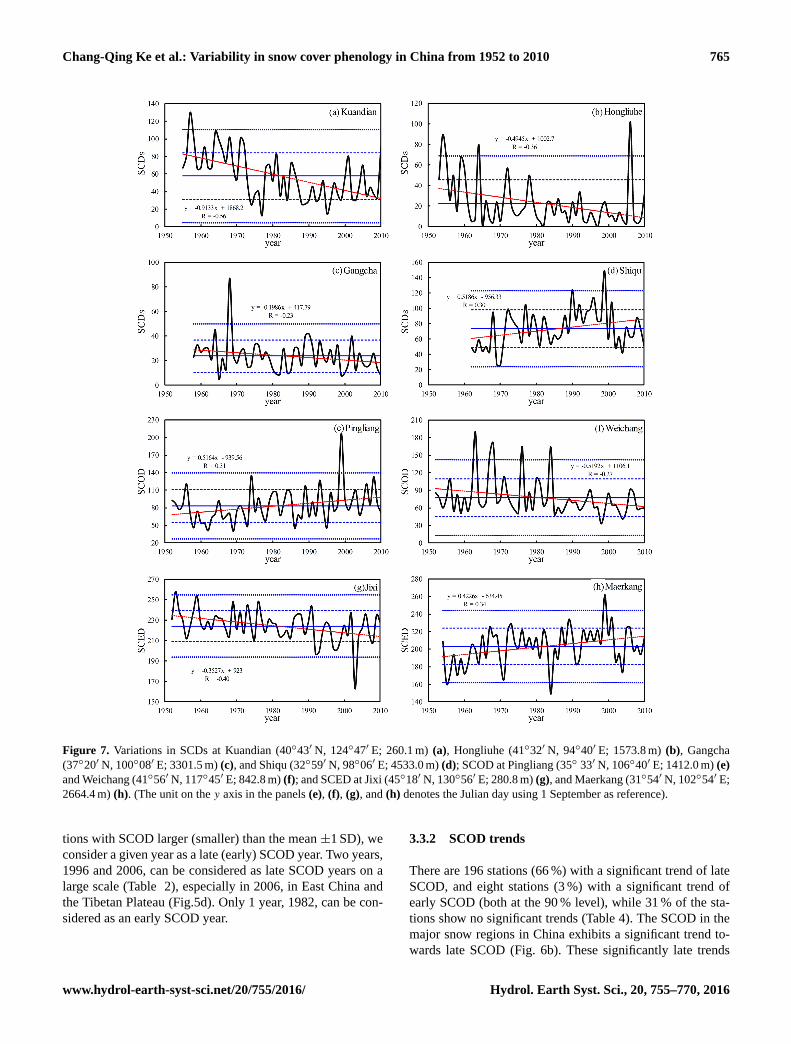
Tibetan Plateau (Fig. 6a). For example, the SCDs decreased
by 50 days from 1955 to 2010 at the Kuandian station in
Northeast China, 28 days from 1954 to 2010 at the Hongli-
uhe station in Xinjiang, and 10 days from 1958 to 2010 at the
Gangcha station on the Tibetan Plateau (Fig. 7a–c).
The SCDs in the Bayan Har Mountains, the Anemaqen
Mountains, the Inner Mongolia Plateau, and the Northeast
Plain, exhibit a significant upward trend (Fig. 6a). For ex-
ample, at the Shiqu station on the eastern border of the Ti-
betan Plateau, the SCDs increased 26 days from 1960 to 2010
(Fig. 7d). The coexistence of negative and positive trends
in the change of SCDs was also reported by Bulygina et
al. (2009) and Wang and Li (2012).
www.hydrol-earth-syst-sci.net/20/755/2016/ Hydrol. Earth Syst. Sci., 20, 755–770, 2016

764 Chang-Qing Ke et al.: Variability in snow cover phenology in China from 1952 to 2010
Figure 6. Significance of trends according to the Mann–Kendall test of SCDs (a), SCOD (b), and SCED (c) from the 296 stations with more
than 10 annual mean SCDs, significance of relationship between the SCDs and days with temperature below 0 ◦C (TBZD) (d), significance
of relationship between the SCDs and mean air temperature (MAT) (e), and significance of relationship between the SCDs and Arctic
Oscillation (AO) index (f).
3.3 Spatiotemporal variations of SCOD
3.3.1 SCOD variations
The SCOD is closely related to both latitude and elevation
(Fig. 8a). For example, snowfall begins in September on the
Tibetan Plateau, in early or middle October on the Daxingan-
ling, and in middle or late October on the Altai Mountains in
Xinjiang. The SCOD also varies from one year to another
(Table 2). Using the definition of a year with a positive (neg-
ative) anomaly of SCDs, as introduced before (i.e. 70 % sta-
tions with positive (negative) SCOD anomaly and 30 % sta-
Hydrol. Earth Syst. Sci., 20, 755–770, 2016 www.hydrol-earth-syst-sci.net/20/755/2016/
Chang-Qing Ke et al.: Variability in snow cover phenology in China from 1952 to 2010 765
Figure 7. Variations in SCDs at Kuandian (40◦43′ N, 124◦47′ E; 260.1 m) (a), Hongliuhe (41◦32′ N, 94◦40′ E; 1573.8 m) (b), Gangcha
(37◦20′ N, 100◦08′ E; 3301.5 m) (c), and Shiqu (32◦59′ N, 98◦06′ E; 4533.0 m) (d); SCOD at Pingliang (35◦ 33′ N, 106◦40′ E; 1412.0 m) (e)
and Weichang (41◦56′ N, 117◦45′ E; 842.8 m) (f); and SCED at Jixi (45◦18′ N, 130◦56′ E; 280.8 m) (g), and Maerkang (31◦54′ N, 102◦54′ E;
2664.4 m) (h). (The unit on the y axis in the panels (e), (f), (g), and (h) denotes the Julian day using 1 September as reference).
tions with SCOD larger (smaller) than the mean ±1 SD), we
consider a given year as a late (early) SCOD year. Two years,
1996 and 2006, can be considered as late SCOD years on a
large scale (Table 2), especially in 2006, in East China and
the Tibetan Plateau (Fig.5d). Only 1 year, 1982, can be con-
sidered as an early SCOD year.
3.3.2 SCOD trends
There are 196 stations (66 %) with a significant trend of late
SCOD, and eight stations (3 %) with a significant trend of
early SCOD (both at the 90 % level), while 31 % of the sta-
tions show no significant trends (Table 4). The SCOD in the
major snow regions in China exhibits a significant trend to-
wards late SCOD (Fig. 6b). These significantly late trends
www.hydrol-earth-syst-sci.net/20/755/2016/ Hydrol. Earth Syst. Sci., 20, 755–770, 2016

766 Chang-Qing Ke et al.: Variability in snow cover phenology in China from 1952 to 2010
Figure 8. Spatial distribution of SCOD (a) and SCED (b) based on the stations with an average of more than 10 SCDs.
dominate the major snow regions in China. In particular, the
late SCOD in Northeast China is consistent with a previous
study (Li et al., 2009). Only the SCOD in the east Liaoning
Bay region exhibits a significant trend towards early SCOD.
For example, the SCOD at the Pingliang station in Gansu
province shows a late rate of 5.2 days per decade from 1952
to 2010, but the SCOD at the Weichang station in Hebei
province shows an early rate of 5.2 days per decade from
1952 to 2010 (Fig. 7e–f).
3.4 Spatiotemporal variations of SCED
3.4.1 SCED variations
The pattern of SCED is similar to that of SCOD (Fig. 8b),
i.e. places with early snowfall normally show late snowmelt,
while places with late snowfall normally show early
snowmelt. Like the SCOD, temporal variations of SCED are
large (Table 2). Using the same standard for defining the
SCOD anomaly, we judge a given year as a late (early) SCED
year. Three years, 1957, 1976 and 1979, can be considered
as late SCED years on a large scale (Table 2). It is evident
that 1957 was a typical year whose SCED was late, which
was also the reason for the great SCDs (Fig. 5a and e). The
SCED in 1997 was early for almost all of China except for
the Tibetan Plateau, western Tianshan Mountains, and west-
ern Liaoning (Fig. 5f).
3.4.2 SCED trends
For the SCED, there are 103 stations (35 %) with a signifi-
cantly early trend (at the 90 % level), while 64 % of stations
show no significant trends (Table 4). The major snow re-
gions in China all show early SCED, significant for Northeast
China, north Xinjiang, and the Tibetan Plateau (Fig. 6c). The
tendency of late SCED is limited, with only three stations
(1 %) showing a significant trend. For example, the SCED at
the Jixi station in Northeast China shows an early rate of 3.5
days per decade from 1952 to 2010, while the SCED at the
Maerkang station in Sichuan province shows a late rate of
4.2 days per decade from 1954 to 2010 (Fig. 7g–h).
4 Discussion
In the context of global warming, 196 stations (66 %) show
significantly late SCOD, and 103 stations (35 %) show sig-
nificantly early SCED, all at the 90 % confidence level. It is
not necessary for one station to show both significantly late
SCOD and early SCED. This explains why only 12 % of sta-
tions show a significantly negative SCDs trend, while 75 %
of stations show no significant change in the trends of SCDs.
The latter is inconsistent with the overall shortening of the
snow period in the Northern Hemisphere reported by Choi
et al. (2010). One reason could be the different time periods
used in the two studies, 1972–2007 in Choi et al. (2010) as
compared to 1952–2010 in this study. Below, we discuss the
possible connections between the spatiotemporal variations
of snow cover and the warming climate and changing AO.
4.1 Relationship with TBZD
The number of days with temperature below 0 ◦C (TBZD)
plays an important role in the SCDs. There are 280 stations
(95 % of 296 stations) showing positive correlations between
TBZD and SCDs, with 154 of them (52 %) having signifi-
cantly positive correlations (Table 4, Fig. 6d). For example,
there is a significantly positive correlation between SCDs and
TBZD at the Chengshantou station (Fig. 9a). Therefore, gen-
erally speaking, the smaller the TBZD, the shorter the SCDs.
For the SCOD, there are 245 stations with negative cor-
relations with TBZD, accounting for 83 % of 296 stations,
Hydrol. Earth Syst. Sci., 20, 755–770, 2016 www.hydrol-earth-syst-sci.net/20/755/2016/

Chang-Qing Ke et al.: Variability in snow cover phenology in China from 1952 to 2010 767
Figure 9. SCDs relationships with TBZD at Chengshantou (37◦24′ N, 122◦41′ E; 47.7 m) (a), MAT at Tieli (46◦59′ N, 128◦01′ E; 210.5 m)
(b), and AO index at Huajialing (35◦23′ N, 105◦00′ E; 2450.6 m) (c) and Tonghua (41◦41′ N, 125◦54′ E; 402.9 m) (d).
whereas only 51 stations (17 %) show positive correlations
(Table 4). This means that for smaller TBZD, the SCOD is
later. For the SCED, there are 269 stations with positive cor-
relations, accounting for 91 % of 296 stations, whereas only
27 stations (9 %) have negative correlations. This means that
for smaller TBZD, the SCED is earlier.
Very similar results are found for the MAT (Table 4,
Fig. 6e), and Fig. 9b shows an example (the Tieli station).
4.2 Relationship with AO
Although the AO index has shown a strong positive trend
in the past decades (Thompson et al., 2000), its impact on
the SCDs in China is spatially distinctive. Positive correla-
tions (46 % of 296 stations) are found in the eastern Tibetan
Plateau and the Loess Plateau (Table 4, Fig. 6f), and Fig. 9c
shows an example (the Huajialing station). Negative correla-
tions (54 % of 296 stations) exist in north Xinjiang, North-
east China, and the Shandong peninsula, and Fig. 9d shows
an example (the Tonghua station).
5 Conclusion
This study examines the snow cover change based on 672
stations in 1952–2010 in China. Specifically, the 296 stations
with more than 10 annual mean SCDs are used to study the
changing trends of SCDs, SCOD, and SCED, and SCD re-
lationships with TBZD, MAT, and AO index during snow
seasons. Some important results are summarised below.
Northeast China, north Xinjiang, and the Tibetan Plateau
are the three major snow regions. The overall inter-annual
variability of SCDs is large in China. The years with a pos-
itive anomaly of SCDs in China include 1955, 1957, 1964,
and 2010, while the years with a negative anomaly of SCDs
are 1953, 1965, 1999, 2002, and 2009. Only 12 % of stations
show a significantly negative SCDs trend, while 75 % of sta-
tions show no significant SCDs trends. Our analyses indicate
that the distribution pattern and trends of SCDs in China are
very complex and are not controlled by any single climate
variable examined (i.e. TBZD, MAT, or AO), but by a com-
bination of multiple variables.
It is found that significantly late SCOD occurs in nearly
the whole of China except for the east Liaoning Bay region;
significantly early SCED occurs in nearly all major snow re-
gions in China. Both the SCOD and SCED are closely related
to the TBZD and MAT, and are mostly controlled by local
latitude and elevation. Owing to global warming since the
1950s, the reduced TBZD and increased MAT are the main
reasons for overall late SCOD and early SCED, although it is
not necessary for one station to experience both significantly
late SCOD and early SCED. This explains why only 12 %
of stations show significantly negative trends in SCDs, while
75 % of stations show no significant SCDs trends.
Long-duration, consistent records of snow cover and depth
are rare in China because of many challenges associated with
taking accurate and representative measurements, especially
in western China; the station density and metric choice also
vary with time and locality. Therefore, more accurate and re-
liable observation data are needed to further analyse the spa-
www.hydrol-earth-syst-sci.net/20/755/2016/ Hydrol. Earth Syst. Sci., 20, 755–770, 2016
768 Chang-Qing Ke et al.: Variability in snow cover phenology in China from 1952 to 2010
tiotemporal distribution and features of snow cover phenol-
ogy. Atmospheric circulation causes variability in the snow
cover phenology, and its effect requires deeper investiga-
tions.
Acknowledgements. This work is financially supported by the
Program for National Nature Science Foundation of China
(no. 41371391), and the Program for the Specialized Research
Fund for the Doctoral Program of Higher Education of China
(no. 20120091110017). This work is also partially supported by
the Collaborative Innovation Center of Novel Software Technology
and Industrialization. We would like to thank the National Climate
Center of China (NCC) in Beijing for providing valuable climate
data sets. We thank the three anonymous reviewers and the editor
for valuable comments and suggestions that greatly improved the
quality of this paper.
Edited by: H.-J. Hendricks Franssen
References
Alexandersson, H. and Moberg, A.: Homogenization of Swedish
temperature data Part 1: homogeneity test for linear trends, Int.
J. Climatol., 17, 25–34, 1997.
An, D., Li, D., Yuan, Y., and Hui, Y.: Contrast between snow cover
data of different definitions, J. Glaciol. Geocrol., 31, 1019–1027,
2009.
Barnett, T. P., Dumenil, L., and Latif, M.: The effect of Eurasian
snow cover on regional and global climate variations, J. Atmos.
Sci., 46, 661–685, 1989.
Beniston, M: Variations of snow depth and duration in the Swiss
Alps over the last 50 years: Links to changes in large-scale cli-
matic forcings, Clim. Change, 36, 281–300, 1997.
Birsan, M. V. and Dumitrescu, A.: Snow variability in Romania in
connection to large-scale atmospheric circulation, Int. J. Clima-
tol., 34, 134–144, 2014.
Bolsenga, S. J. and Norton, D. C.: Maximum snowfall at long-term
stations in the U.S./Canadian Great Lakes, Nat. Hazards, 5, 221–
232, 1992.
Brown, R. D. and Robinson, D. A.: Northern Hemisphere spring
snow cover variability and change over 1922–2010 including
an assessment of uncertainty, The Cryosphere, 5, 219–229,
doi:10.5194/tc-5-219-2011, 2011.
Bulygina, O. N., Razuvaev, V. N., and Korshunova, N. N.: Changes
in snow cover over Northern Eurasia in the last few decades, En-
viron. Res. Lett., 4, 045026, doi:10.1088/1748-9326/4/4/045026,
2009.
Chen, S., Chen, W., and Wei, K.: Recent trends in winter temper-
ature extremes in eastern China and their relationship with the
Arctic Oscillation and ENSO, Adv. Atmos. Sci., 30, 1712–1724,
2013.
China Meteorological Administration: Specifications for Surface
Meteorological Observations, Beijing, China Meteorological
Press, 1–62, 2003.
Choi, G., Robinson, D. A., and Kang, S.: Changing Northern Hemi-
sphere snow seasons, J. Climate, 23, 5305–5310, 2010.
Ciach, G. J. and Krajewski, W. F.: Analysis and modeling of spatial
correlation structure in small-scale rainfall in Central Oklahoma,
Adv. Water Resour., 29, 1450–1463, 2006.
Déry, S. J. and Brown, R. D.: Recent Northern Hemi-
sphere snow cover extent trends and implications for the
snow-albedo feedback, Geophys. Res. Lett., 34, L22504,
doi:10.1029/2007GL031474, 2007.
Dong, A., Guo, H., Wang, L., and Liang, T.: A CEOF analysis on
variation about yearly snow days in Northern Xinjiang in recent
40 years, Plateau Meteorol., 23, 936–940, 2004.
Dong, W., Wei, Z., and Fan, J.: Climatic character analysis of snow
disasters in east Qinghai-Xizang Plateau livestock farm, Plateau
Meteorol., 20, 402–406, 2001.
Dyer, J. L. and Mote, T. L.: Spatial variability and trends in ob-
served snow depth over North America, Geophys. Res. Lett., 33,
L16503, doi:10.1029/2006GL027258, 2006.
Fang, S., Qi, Y., Han, G., Zhou, G., and Cammarano, D.: Meteoro-
logical drought trend in winter and spring from 1961 to 2010 and
its possible impacts on wheat in wheat planting area of China,
Sci. Agr. Sin., 47, 1754–1763, 2014.
Gao, H.: China’s snow disaster in 2008, who is the principal player?,
Int. J. Climatol., 29, 2191–2196, 2009.
Gong, D. Y., Wang, S. W., and Zhu, J. H.: East Asian winter mon-
soon and Arctic oscillation, Geophys. Res. Lett., 28, 2073–2076,
2001.
Groisman, P. Y., Karl, T. R., and Knight, R. W.: Observed impact of
snow cover on the heat-balance and the rise of continental spring
temperatures, Science, 263, 198–200, 1994.
Habib, E., Krajewski, W. F., and Ciach, G. J.: Estimation of rainfall
interstation correlation, J. Hydrometeorol., 2, 621–629, 2001.
Hantel, M., Ehrendorfer, M., and Haslinger, A.: Climate sensitivity
of snow cover duration in Austria, Int. J. Climatol., 20, 615–640,
2000.
Hao, L., Wang, J., Man, S., and Yang, C.: Spatio-temporal change of
snow disaster and analysis of vulnerability of animal husbandry
in China, J. Nat. Disaster, 11, 42–48, 2002.
Hu, H. and Liang, L.: Temporal and spatial variations of snowfall in
the east of Qinghai-Tibet Plateau in the last 50 years, Acta Geogr.
Sin., 69, 1002–1012, 2014.
Jeong, J. H. and Ho, C. H.: Changes in occurrence of cold surges
over East Asia in association with Arctic oscillation, Geophys.
Res. Lett., 32, L14704, doi:10.1029/2005GL023024, 2005.
Ji, Z. and Kang, S.: Projection of snow cover changes over China
under RCP scenarios Clim. Dyn., 41, 589–600, 2013.
Ke, C. Q. and Li, P. J.: Spatial and temporal characteristics of snow
cover over the Tibetan plateau, Acta Geogr. Sin., 53, 209–215,
1998.
Ke, C. Q. and Liu, X.: MODIS-observed spatial and temporal vari-
ation in snow cover in Xinjiang, China, Clim. Res., 59, 15–26,
2014.
Ke, C. Q., Yu, T., Yu, K., Tang, G. D., and King, L.: Snowfall trends
and variability in Qinghai, China, Theor. Appl. Climatol., 98,
251–258, 2009.
Lehning, M., Grünewald, T., and Schirmer, M.: Mountain
snow distribution governed by an altitudinal gradient
and terrain roughness, Geophys. Res. Lett., 38, L19504,
doi:10.1029/2011GL048927, 2011.
Hydrol. Earth Syst. Sci., 20, 755–770, 2016 www.hydrol-earth-syst-sci.net/20/755/2016/
Chang-Qing Ke et al.: Variability in snow cover phenology in China from 1952 to 2010 769
Li, D., Liu, Y., Yu, H. and Li, Y.: Spatial-temporal variation of the
snow cover in Heilongjiang Province in 1951-2006, J. Glaciol.
Geocrol., 31, 1011–1018, 2009.
Li, P. J.: Dynamic characteristic of snow cover in western China,
Acta Meteorol. Sin., 48, 505–515, 1993.
Li, P. J.: A preliminary study of snow mass variations over past
30 years in China, Acta Geogr. Sin., 48, 433–437, 1990.
Li, P. J. and Mi, D.: Distribution of snow cover in China, J. Glaciol.
Geocrol., 5, 9–18, 1983.
Liang, T. G., Huang, X. D., Wu, C. X., Liu, X. Y., Li, W. L., Guo, Z.
G., and Ren, J. Z.: An application of MODIS data to snow cover
monitoring in a pastoral area: A case study in Northern Xinjiang,
China, Remote Sens. Environ., 112, 1514–1526, 2008.
Liu, Y., Ren, G., and Yu, H.: Climatology of Snow in China, Sci.
Geogr. Sin., 32, 1176–1185, 2012.
Llasat, M. C., Turco, M., Quintana-Seguí, P., and Llasat-Botija, M.:
The snow storm of 8 March 2010 in Catalonia (Spain): a paradig-
matic wet-snow event with a high societal impact, Nat. Hazards
Earth Syst. Sci., 14, 427–441, doi:10.5194/nhess-14-427-2014,
2014.
Lü, J. M., Ju, J. H., Kim, S. J., Ren, J. Z., and Zhu, Y. X.: Arctic
Oscillation and the autumn/winter snow depth over the Tibetan
Plateau, J. Geophys. Res., 113, D14117, 2008.
Ma, L. and Qin, D.: Temporal-spatial characteristics of observed
key parameters of snow cover in China during 1957–2009, Sci.
Cold Arid Reg., 4, 384–393, 2012.
Marty, C.: Regime shift of snow days in Switzerland, Geophys. Res.
Lett., 35, L12501, doi:10.1029/2008GL033998, 2008.
Morán-Tejeda, E., López-Moreno, J. I., and Beniston, M.: The
changing roles of temperature and precipitation on snowpack
variability in Switzerland as a function of altitude, Geophys. Res.
Lett., 40, 2131–2136, 2013.
Pederson, G. T., Betancourt, J. L., and Gregory, J. M.: Regional
patterns and proximal causes of the recent snowpack decline in
the Rocky Mountains, U.S., Geophys. Res. Lett., 40, 1811–1816,
2013.
Peings, Y., Brun, B., Mauvais, V., and Douville, H.: How stationary
is the relationship between Siberian snow and Arctic Oscillation
over the 20th century, Geophys. Res. Lett., 40, 183–188, 2013.
Peng, S., Piao, S., Ciais, P., Friedlingstein, P., Zhou, L., and
Wang, T.: Change in snow phenology and its potential feed-
back to temperature in the Northern Hemisphere over the last
three decades, Environ. Res. Lett., 8, 014008, doi:10.1088/1748-
9326/8/1/014008, 2013.
Qin, D., Liu, S., and Li, P.: Snow cover distribution, variability,
and response to climate change in western China, J. Climate, 19,
1820–1833, 2006.
Ren, G. Y., Guo, J., Xu, M. Z., Chu, Z. Y., Zhang, L., Zou, X. K., Li,
Q. X., and Liu, X. N.: Climate changes of China’s mainland over
the past half century, Acta. Meteorol. Sin., 63, 942–956, 2005.
Robinson, D. A. and Dewey, K. F.: Recent secular variations in the
extent of northern hemisphere snow cover, Geophys. Res. Lett.,
17, 1557–1560, 1990.
Scherrer, S. C., Appenzeller, C., and Laternser, M.: Trends
in Swiss Alpine snow days: The role of local- and large-
scale climate variability, Geophys. Res. Lett., 31, L13215,
doi:10.1029/2004GL020255, 2004.
Scherrer, S. C., and Appenzeller, C.: Swiss Alpine snow pack vari-
ability: major patterns and links to local climate and large-scale
flow, Clim. Res., 32, 187–199, 2006.
Scherrer, S. C., Wüthrich, C., Croci-Maspoli, M., Weingartner, R.,
and Appenzeller, C.: Snow variability in the Swiss Alps 1864-
2009, Int. J. Clim., 33, 3162–3173, doi:10.1002/joc.3653, 2013.
Serquet, G., Marty, C., Dulex, J.-P., and Rebetez, M.: Seasonal
trends and temperature dependence of the snowfall/precipitation-
day ratio in Switzerland, Geophys. Res. Lett., 38, L07703,
doi:10.1029/2011GL046976, 2011.
Shi, Y., Gao, X., Wu, J., and Giorgi, F.: Changes in snow cover
over China in the 21st century as simulated by a high reso-
lution regional climate model, Environ. Res. Lett., 6, 045401,
doi:10.1088/1748-9326/6/4/045401, 2011.
Tang, X., Yan, X., Ni, M., and Lu, Y.: Changes of the snow cover
days on Tibet Plateau in last 40 years, Acta. Geogr. Sin., 67, 951–
959, 2012.
Thompson, D. W. J. and Wallace, J. M.: The Arctic oscillation
signature in the wintertime geopotential height and temperature
fields, Geophys. Res. Lett., 25, 1297–1300, 1998.
Thompson, D. W. J., Wallace, J. M., and Hegerl, G. C.: Annular
modes in the extratropical circulation, part II: Trends, J. Climate,
13, 1018–1036, 2000.
Wang, C. and Li, D.: Spatial-temporal variations of the snow cover
days and the maximum depth of snow cover in China during re-
cent 50 years, J. Glaciol. Geocrol., 34, 247–256, 2012.
Wang, C., Wang, Z., and Cui, Y.: Snow cover of China during the
last 40 years: Spatial distribution and interannual variation, J.
Glaciol. Geocrol., 31, 301-310, 2009.
Wang, L., Gao, G., Zhang, Q., Sun, J. M., Wang, Z. Y., Zhao, Y.,
Zhao, S. S., Chen, X. Y., Chen, Y., Wang, Y. M., Chen, L. J., and
Gao, H.: Characteristics of the extreme low-temperature, heavy
snowstorm and freezing disasters in January 2008 in China, Me-
teorol. Mon., 34, 95–100, 2008.
Wang, Q., Zhang, C., Liu, J., and Liu, W.: The changing tendency
on the depth and days of snow cover in Northern Xinjiang, Adv.
Clim. Change Res., 5, 39–43, 2009.
Wang, W., Liang, T., Huang, X., Feng, Q., Xie, H., Liu, X., Chen,
M., and Wang, X.: Early warning of snow-caused disasters in
pastoral areas on the Tibetan Plateau, Nat. Hazards Earth Syst.
Sci., 13, 1411–1425, doi:10.5194/nhess-13-1411-2013, 2013.
Wu, B. Y. and Wang, J.: Winter Arctic oscillation, Siberian high
and East Asian winter monsoon, Geophys. Res. Lett., 29, 1897,
doi:10.1029/2002GL015373, 2002.
Xi, Y., Li, D., and Wang, W.: Study of the temporal-spatial charac-
teristics of snow covers days in Hetao and its vicinity, J. Glaciol.
Geocrol., 31, 446–456, 2009.
Xu, L., Li, D., and Hu, Z.: Relationship between the snow cover
day and monsoon index in Tibetan Plateau, Plateau Meterol., 29,
1093–1101, 2010.
Yang, H., Yang, D., Hu, Q., and Lv, H.: Spatial variability of
the trends in climatic variables across China during 1961–2010,
Theor. Appl. Climatol., 120, 773–783, 2015.
Yao, T., Thompson, L., Yang, W., Yu, W., Gao, Y., Guo, X., Yang,
X., Duan, K., Zhao, H., Xu, B., Pu, J., Lu, A., Xiang, Y., Kattel,
D. B., and Joswiak, D.: Different glacier status with atmospheric
circulations in Tibetan Plateau and surroundings, Nature Clim.
Change, 2, 663–667, 2012.
www.hydrol-earth-syst-sci.net/20/755/2016/ Hydrol. Earth Syst. Sci., 20, 755–770, 2016

770 Chang-Qing Ke et al.: Variability in snow cover phenology in China from 1952 to 2010
Ye, H. and Ellison, M.: Changes in transitional snowfall sea-
son length in northern Eurasia, Geophys. Res. Lett., 30, 1252,
doi:10.1029/2003GL016873, 2003.
You, Q., Kang, S., Ren, G., Fraedrich, K., Pepin, N., Yan, Y., and
Ma, L.: Observed changes in snow depth and number of snow
days in the eastern and central Tibetan Plateau, Clim. Res., 46,
171–183, 2011.
Zhang, T.: Influence of the seasonal snow cover on the ground ther-
mal regime: An overview, Rev. Geophys., 43, 1–23, 2005.
Hydrol. Earth Syst. Sci., 20, 755–770, 2016 www.hydrol-earth-syst-sci.net/20/755/2016/