Variability in muscle activation of simple speech motions ...
12
Variability in muscle activation of simple speech motions: A biomechanical modeling approach Negar M. Harandi, 1,a) Jonghye Woo, 2 Maureen Stone, 3 Rafeef Abugharbieh, 1 and Sidney Fels 1 1 Electrical and Computer Engineering Department, University of British Columbia, Vancouver, British Columbia, Canada 2 Department of Radiology, Harvard Medical School/MGH, Boston, Massachusetts 02114, USA 3 University of Maryland Dental School, Baltimore, Maryland 21201, USA (Received 10 August 2015; revised 31 January 2017; accepted 27 February 2017; published online 12 April 2017) Biomechanical models of the oropharynx facilitate the study of speech function by providing infor- mation that cannot be directly derived from imaging data, such as internal muscle forces and mus- cle activation patterns. Such models, when constructed and simulated based on anatomy and motion captured from individual speakers, enable the exploration of inter-subject variability of speech biomechanics. These models also allow one to answer questions, such as whether speakers produce similar sounds using essentially the same motor patterns with subtle differences, or vastly different motor equivalent patterns. Following this direction, this study uses speaker-specific modeling tools to investigate the muscle activation variability in two simple speech tasks that move the tongue forward (/@-gis/) vs backward (/@-suk/). Three dimensional tagged magnetic resonance imaging data were used to inversely drive the biomechanical models in four English speakers. Results show that the genioglossus is the workhorse muscle of the tongue, with activity levels of 10% in different subdivisions at different times. Jaw and hyoid positioners (inferior pterygoid and digastric) also show high activation during specific phonemes. Other muscles may be more involved in fine tuning the shapes. For example, slightly more activation of the anterior portion of the transverse is found during apical than laminal /s/, which would protrude the tongue tip to a greater extent for the apical /s/. V C 2017 Acoustical Society of America. [http://dx.doi.org/10.1121/1.4978420] [LK] Pages: 2579–2590 I. INTRODUCTION Speech production is a complex neuromuscular function that involves sophisticated and synchronized activation of the oropharyngeal muscles. Much of speech biomechanics remains unknown to date, as instrumental measurements remain imperfect. Electromyography (EMG) generates mus- cle activation information, but is invasive, hard to interpret for interdigitated muscles in the mouth, and incompatible with a normal setting for speech production. Imaging techni- ques, such as ultrasound and magnetic resonance imaging (MRI), can yield insight into articulatory motion of the tongue (Wrench and Scobbie, 2011; Takano and Honda, 2007; Xing et al., 2013), especially when combined with computational methods (Vasconcelos et al., 2012; Ventura et al., 2009; Ventura et al., 2013); however, they fail to pro- vide information on internal tissue forces and muscle activa- tions during speech. Therefore, while audio and image processing tools have revealed substantial information on how different people speak, there remains a gap in our knowledge of how human variations occur with respect to the neurological, anatomical and biomechanical constraints. Such information, if available, could improve our under- standing of speech biomechanics, and may potentially enable clinical applications such as treatment planning for speech therapy pertaining to different causes of speech impairment. Estimates of the internal biomechanics of tissue can be derived through biomechanical models. Generic models of oropharyngeal structures have been previously developed and incorporated into speech movement (Perrier et al., 2003; Stavness et al., 2012), and further refined to encompass a wide range of structures, including the tongue (G erard et al., 2003; Dang and Honda, 2004; Buchaillard et al., 2009), the mandible and hyoid (Stavness et al., 2011), and the face and skull (Badin et al., 2002; Stavness et al., 2014a). Models of articulators have also been coupled in a unified simulation platform (Stavness et al., 2014b). The generic nature of these models, however, hinders their data-driven simulation and evaluation. For example, speech data are often specific to certain speakers whose anatomy is dissimilar to that of the generic model. Previous studies either performed heuristic registration of the speaker’s data to the generic model (Fang et al., 2009; Sanchez et al., 2013), or validated their simula- tion results in comparison to the average population data (Stavness et al., 2012). Nevertheless, the usage and rele- vancy of these generic models remain limited in speech pro- duction research. Further expansion of such models to encompass individualized information provides a promising tool in investigation of speaker-specific variations in speech biomechanics. a) Electronic mail: [email protected] J. Acoust. Soc. Am. 141 (4), April 2017 V C 2017 Acoustical Society of America 2579 0001-4966/2017/141(4)/2579/12/$30.00
Transcript of Variability in muscle activation of simple speech motions ...
Variability in muscle activation of simple speech motions:A biomechanical modeling approach
Negar M. Harandi,1,a) Jonghye Woo,2 Maureen Stone,3 Rafeef Abugharbieh,1 andSidney Fels1
1Electrical and Computer Engineering Department, University of British Columbia, Vancouver,British Columbia, Canada2Department of Radiology, Harvard Medical School/MGH, Boston, Massachusetts 02114, USA3University of Maryland Dental School, Baltimore, Maryland 21201, USA
(Received 10 August 2015; revised 31 January 2017; accepted 27 February 2017; published online12 April 2017)
Biomechanical models of the oropharynx facilitate the study of speech function by providing infor-
mation that cannot be directly derived from imaging data, such as internal muscle forces and mus-
cle activation patterns. Such models, when constructed and simulated based on anatomy and
motion captured from individual speakers, enable the exploration of inter-subject variability of
speech biomechanics. These models also allow one to answer questions, such as whether speakers
produce similar sounds using essentially the same motor patterns with subtle differences, or vastly
different motor equivalent patterns. Following this direction, this study uses speaker-specific
modeling tools to investigate the muscle activation variability in two simple speech tasks that move
the tongue forward (/@-gis/) vs backward (/@-suk/). Three dimensional tagged magnetic resonance
imaging data were used to inversely drive the biomechanical models in four English speakers.
Results show that the genioglossus is the workhorse muscle of the tongue, with activity levels of
10% in different subdivisions at different times. Jaw and hyoid positioners (inferior pterygoid and
digastric) also show high activation during specific phonemes. Other muscles may be more
involved in fine tuning the shapes. For example, slightly more activation of the anterior portion of
the transverse is found during apical than laminal /s/, which would protrude the tongue tip to a
greater extent for the apical /s/. VC 2017 Acoustical Society of America.
[http://dx.doi.org/10.1121/1.4978420]
[LK] Pages: 2579–2590
I. INTRODUCTION
Speech production is a complex neuromuscular function
that involves sophisticated and synchronized activation of
the oropharyngeal muscles. Much of speech biomechanics
remains unknown to date, as instrumental measurements
remain imperfect. Electromyography (EMG) generates mus-
cle activation information, but is invasive, hard to interpret
for interdigitated muscles in the mouth, and incompatible
with a normal setting for speech production. Imaging techni-
ques, such as ultrasound and magnetic resonance imaging
(MRI), can yield insight into articulatory motion of the
tongue (Wrench and Scobbie, 2011; Takano and Honda,
2007; Xing et al., 2013), especially when combined with
computational methods (Vasconcelos et al., 2012; Ventura
et al., 2009; Ventura et al., 2013); however, they fail to pro-
vide information on internal tissue forces and muscle activa-
tions during speech. Therefore, while audio and image
processing tools have revealed substantial information on
how different people speak, there remains a gap in our
knowledge of how human variations occur with respect to
the neurological, anatomical and biomechanical constraints.
Such information, if available, could improve our under-
standing of speech biomechanics, and may potentially enable
clinical applications such as treatment planning for speech
therapy pertaining to different causes of speech impairment.
Estimates of the internal biomechanics of tissue can be
derived through biomechanical models. Generic models of
oropharyngeal structures have been previously developed
and incorporated into speech movement (Perrier et al., 2003;
Stavness et al., 2012), and further refined to encompass a
wide range of structures, including the tongue (G�erard et al.,2003; Dang and Honda, 2004; Buchaillard et al., 2009), the
mandible and hyoid (Stavness et al., 2011), and the face and
skull (Badin et al., 2002; Stavness et al., 2014a). Models of
articulators have also been coupled in a unified simulation
platform (Stavness et al., 2014b). The generic nature of these
models, however, hinders their data-driven simulation and
evaluation. For example, speech data are often specific to
certain speakers whose anatomy is dissimilar to that of the
generic model. Previous studies either performed heuristic
registration of the speaker’s data to the generic model (Fang
et al., 2009; Sanchez et al., 2013), or validated their simula-
tion results in comparison to the average population data
(Stavness et al., 2012). Nevertheless, the usage and rele-
vancy of these generic models remain limited in speech pro-
duction research. Further expansion of such models to
encompass individualized information provides a promising
tool in investigation of speaker-specific variations in speech
biomechanics.a)Electronic mail: [email protected]
J. Acoust. Soc. Am. 141 (4), April 2017 VC 2017 Acoustical Society of America 25790001-4966/2017/141(4)/2579/12/$30.00

Speaker-specific biomechanical modeling of the oro-
pharynx is challenging. The making of current generic mod-
els relies heavily on expert interaction—a process that is not
cost effective when dealing with many individual cases. It is
also possible that a generic model does not match exact
modeling requirements, such as the required spatial resolu-
tion, for a specific speech task. Hence, further automation
and modification of generic modeling procedures are critical
for speaker-specific modeling. Investigating this direction,
Harandi et al. (2015) proposed a framework for speaker-
specific biomechanical modeling of the oropharynx that
exploits muscular information embedded in a state-of-the-art
generic tongue model (Buchaillard et al., 2009), and allows
for adjustment of the resolution and muscle definitions.
Their model, though validated for only one male speaker,
was able to track the internal tongue tissue motion derived
from MRI data, and to simulate plausible muscle activation
patterns for synthesis of the vowels /@/ and /i/. The predicted
acoustic output was subsequently shown to possess spectral
features comparable to the associated recorded audio.
Based on the promising results in Harandi et al. (2015)
for vowel synthesis, the present study investigates motor
control of the tongue, jaw and hyoid during two speech utter-
ances, /@-gis/ and /@-suk/, which move the tongue in oppo-
site directions: forward vs backward. Both these utterances
contain the /s/ sound, which is formed in a region of the
vocal tract where small changes in the position and shape of
the tongue are audible and can compromise the production
of the /s/ (Stevens, 1989). In addition, these utterances use
the high vowels /i/ and /u/, which minimize the need for jaw
opening and require that most vocal tract shaping, including
tongue elevation, is done by the tongue. Finally these utter-
ances use the velar consonants /k/ and /g/. These two sounds
differ in voicing, but are virtually identical in tongue
positioning.
There are two /s/ gestures previously identified in the lit-
erature: the apical /s/, which uses the tongue tip to contact
the alveolar ridge, and the laminal /s/, which uses the tongue
blade (Dart, 1991). The present study examines the motor
control and motion patterns of these two /s/-types. In addi-
tion, the other sounds allow us to explore the patterns of
motion for velar consonants, and the effects of different
vowel contexts and utterance position. By creating speaker-
specific models based on MRI data of multiple speakers, this
study explores possible answers to two questions: What are
the key muscles responsible for the motion into the various
phonemes including any differences between the laminal
and apical realization of the /s/? and how does the activation
pattern change with direction of motion across different
speakers?
We base our modeling framework on 3D tagged and
cine MRI data, which capture the motion of the tongue’s
tissue-points during the production of our speech tasks. Using
this quantified tissue-point motion, Xing et al. (2015) calcu-
lated internal motion patterns, as well as the amount of short-
ening and lengthening of individual muscles. However, the
data alone provide an incomplete picture of the motor control
to the tongue. For example, the active and passive shortening
of a muscle can cause similar motion, and co-contraction of
antagonist muscles can result in no shortening. It is, therefore,
difficult to disambiguate the causes of muscle shortening
from MRI alone. In this study, we create a biomechanical
model from each speaker’s data, and use it in conjunction
with tissue-point motion, as described in Sec. II, to first infer
which muscles are actively shortening (using an inverse
model) and then to actively shorten those muscles to predict
tissue-point motion (forward model). We then compare the
results with the tagged MRI trajectories in order to fine-tune
the predicted muscle activations. Our results, as presented in
Sec. III and discussed in Sec. IV, supplement and enhance
current knowledge of how muscle activations are related to
tongue motion patterns.
II. MATERIALS AND METHODS
Figure 1 shows the proposed work-flow for the speaker-
specific modeling and simulation presented in this study. The
cine and tagged magnetic resonance (MR) images were
recorded during synchronized repetition of the desired speech
utterances (Sec. II A). The internal tongue tissue displace-
ments were calculated from tagged MRI, and further
enhanced with tongue surface information from the cine MRI
data (Sec. II B). Biomechanical models of the tongue, mandi-
ble, hyoid, and maxilla were then constructed for each
speaker (Sec. II D) based on the surface geometries seg-
mented from the cine MRI data (Sec. II C). The speaker-
specific models were then simulated based on the tissue dis-
placements (Sec. II E). We used the Artisynth platform
(www.artisynth.org) which supports both forward and inverse
simulations. Forward simulation yields kinematic trajectories
of the model based on muscle activations, and the inverse
simulation provides estimates of muscle activation patterns
based on the tissue trajectories measured at specific control
points from the data. The data-driven simulation converges
after iteration between the forward and inverse simulations.
A. MRI data acquisition and speech corpus
Our MRI data capture four healthy American English
speakers with mid-Atlantic dialect. The speakers signed an
informed consent form, and data were collected in accor-
dance with the protocol approved by the Institutional Review
FIG. 1. (Color online) Proposed work-flow for speaker-specific modeling
and simulation of speech. The inputs are color-coded in white, the methods
in green (dark) and the output in gray (light).
2580 J. Acoust. Soc. Am. 141 (4), April 2017 M. Harandi et al.

Board (IRB) of the University of Maryland, Baltimore. Each
speaker repeated the utterances /@-gis/ and /@-suk/ in time with
a metronome. Speakers were trained to speak to the same met-
ronome beat that was used in the MRI scanner, and to inhale
and exhale at fixed points within each cycle. The training used
a metronome with a four beat sequence, set at 0, 333, 800, and
1400 ms in a 2 s repeat time. The first two beats were for the
speech task (/@-gis/ or /@-suk/) and the last two beats were
used for a controlled inhalation and exhalation. The timing
was coordinated to the trigger of the MRI machine, based on
the work of Masaki et al. (1999).
Both cine and tagged MRI data were acquired using a
Siemens 3.0T Tim-Trio MRI scanner with a 12-channel
head and a four-channel neck coil. The in-plane image reso-
lution was 1.875 mm� 1.875 mm with a slice thickness of
6 mm. The sequence parameters were the following: repeti-
tion time (TR) 36 ms, echo time (TE) 1.47 ms, flip angle 6�,and turbo factor 11. Data were collected in three orientations
(axial, sagittal, and coronal). The cine data were collected in
a single scan sequence per orientation. For the cine MRI
scan, each speaker repeated the task (/@-gis/ or /@-suk/)
five times per slice, with between five and 12 slices per ori-
entation, or between 25 and 60 repetitions. The tagged MRI
acquisition used Magnitude Image C-Spamm Reconstruction
(MICSR). A MICSR dataset is composed of four data acquisi-
tions. Two of them contain horizontal tags and two contain
vertical tags; each tag direction is acquired twice, once with a
cosine tag pattern and once with a minus cosine tag pattern.
Each of these four acquisitions requires three repetitions per
slice, in order to acquire adequate Fourier data for analysis.
Thus for seven sagittal slices there are four separate acquisi-
tions, each containing 21 repetitions of the task, with three
intervening pauses (Parthasarathy et al., 2007).
Table I summarizes the information of each speaker.
Each time-frame (TF) takes 38.46 ms, resulting in 26 fps. TFs
associated with phonemes of interest—the /@/, /g/, /i/ and /s/
in /@-gis/, and the/@/, /s/, /u/ and /k/ in /@-suk/—were identi-
fied visually, from the sagittal stack of cine MRI, by a speech
scientist. Since the speakers spoke in time with a metronome,
their timing was usually consistent across sagittal, coronal,
and axial stacks. Speakers whose MRI data were not tempo-
rally aligned across stacks were not included in the study, and
are not shown in the table. In addition, speech recordings
were made in the MRI scanner with a noise-reduction fiber-
optic microphone (Optoacoustics, Ltd., Israel) with no metal-
lic components. These audio data were used only to corrobo-
rate the accuracy of phoneme segment breaks, using Praat
Software (Boersma and Weenink, 2015), and are not dis-
cussed further. Each vowel was identified at the TF before the
tongue began to move toward the next consonant. Each con-
sonant was identified at the TF when the tongue first con-
tacted the palate. These TFs were chosen because they were
identified fairly easily from the MRI movies.
The axial, sagittal, and coronal stacks of cine MRI slices
were combined to form isotropic super-resolution volumes
for 26 TFs, using a maximum a posteriori estimation of
Markov random fields with an edge-preserving regulariza-
tion scheme (Woo et al., 2012). Figure 2 shows the midsagit-
tal slice of the reconstructed image volume at the TF
associated with the /s/ for each speaker in both utterances.
As it can be seen in Table I, two of the speakers had apical
and two had laminal /s/ production. Palate height above
14 mm is considered to be a high palate (Stone et al., 2012).
TABLE I. Speaker information in this study: sex, age, /s/-type, palate height
and time-frames associated with individual sounds in the /@-gis/ and /@-suk/
utterances.
Speaker Sex Age PalateTF # for /@-gis/ TF # for /@-suk/
index (M/F) (years) /s/-type (mm) @ g i s @ s u k
A M 23 apical 13.38 8 12 16 21 8 13 19 21
B M 22 apical 11.22 6 10 18 20 7 10 16 19
C F 43 laminal 13.37 8 10 14 23 4 9 15 18
D F 21 laminal 14.82 5 9 13 19 7 10 17 19
FIG. 2. Midsagittal slice of cine MRI at the /s/ in /@-gis/ and /@-suk/ for
speakers A to D. Speakers A and B show apical and speakers C and D show
laminal /s/ gestures. Tongue surface is outlined for better visualization.
J. Acoust. Soc. Am. 141 (4), April 2017 M. Harandi et al. 2581

B. Tissue displacement
The two dimensional (2D) motion of the tongue tissue-
points was estimated from tagged MR image slices using the
harmonic phase (HARP) algorithm (Osman et al., 2000). The
three stacks of tagged MRI data were aligned using transla-
tion only to prevent distortion of tag direction in the 3D data-
set. We applied the enhanced incompressible deformation
estimation algorithm (E-IDEA) to combine the 2D motion
data and make a 3D deformation field, using an incompressi-
bility constraint (Xing et al., 2013). E-IDEA imposes a set of
smoothing, divergence-free vector splines to seamlessly inter-
polate displacement fields across the tongue. In addition, it
improves the reliability of the displacement field by incorpo-
rating the 3D deformation of the tongue surface computed
from cine MRI, as illustrated in Fig. 3.
In HARP, the displacement field at each TF is calcu-
lated with reference to the first TF when the tags were ini-
tially applied. However, in order to simulate our models, we
needed to calculate displacements between successive TFs.
In order to get from the nth to the (n þ 1)th TF, we first
went from the nth to the first TF—via the inverse of the nth
displacement field—and then moved from the first to the
(n þ 1)th TF by applying the (n þ 1)th displacement field.
The process is described by
Tn!nþ1 ¼ Tn!1 � T1!nþ1; (1)
where Ti!j denotes the displacement field from the ith to the
jth TF. We computed Tn!1 by inverting the E-IDEA
displacement field T1!n using a simple fixed-point algorithm
(Chen et al., 2008).
In this study, we performed spatial and temporal regu-
larization to reduce potential noise in the estimated motion.
In the spatial domain, the displacement vectors were aver-
aged in a spherical region of predefined radius around each
point of interest (called control points: see Sec. II E 1); in the
time domain, a cubic interpolation was performed between
successive TFs to smooth the trajectories and calculate the
intermediate displacements.
C. Surface segmentation
To build our speaker-specific models, we needed to
delineate the surface geometry of the articulators from
cine MRI data. Unfortunately, cine MRI only provides par-
tial visibility of bone, which makes the results of manual seg-
mentation poor and inadequate for detecting sites of muscle
insertions and location of the temporomandibular joint (TMJ).
Static MRI, however, provides higher resolution and a
better representation of bone surfaces. Woo et al. (2015) cre-
ated a high resolution static MRI atlas that includes speaker
data used in the present study, as shown in Fig. 4. In the fig-
ure, Di denotes the deformation from static MRI of speaker ionto the atlas space. We first built a segmentation mask for
the mandible in the atlas space, and then morphed the mask
onto the static MRI of the speaker (using the inverse of Di
[D�1i ]). Finally, we performed an image-based elastic registra-
tion (Vercauteren et al., 2009) between the static and cine
MRI images of each speaker, to generate the mask in the cine
FIG. 3. (Color online) Tissue displace-
ments calculated from tagged MRI
using HARP (Osman et al., 2000),
IDEA (Liu et al., 2012), and enhanced
by surface normals from cine MRI as
in E-IDEA (Xing et al., 2013). [#
Xing et al. (2013).]
FIG. 4. (Color online) Atlas deforma-
tion for jaw segmentation. Di denotes
the deformation from static MRI of
speaker i onto the atlas space; D�1i is
the inverse of Di, and Ri stands for the
elastic registration from the static to
cine MRI space. Jaw masks are shown
in solid beige.
2582 J. Acoust. Soc. Am. 141 (4), April 2017 M. Harandi et al.

MRI (at the first TF). In the figure, this final registration is
denoted by Ri. The final mask (in the cine MRI space) yields
a partial mandible surface, as shown in Fig. 5 (for speaker A).
We deployed this partial surface as the guide for (manual)
sculpting of a generic mandible mesh (available in ArtiSynth).
For sculpting, we used BlendSeg, a customized plug-in for the
Blender mesh editing software (www.blender.org) that allows
inspection of the mesh intersection with image data, through-
out the sculpting process (Ho et al., 2014).
Soft tissue has higher contrast than bone in MRI, and,
hence, its delineation is more straightforward. However, the
tongue surface needs to be extracted from every single TF of
cine MRI data in order to enhance the tissue displacements
computed from tagged MRI, as described in Sec. II B. The
surface extracted from the first TF works also as a base for
the biomechanical models. This adds up to 26 (TFs)� 2
(utterances) � 4 (speakers) ¼ 208 segmentation tasks, each
of which is labour-intensive. We eased the segmentation pro-
cess by using a mesh-to-image registration method, proposed
by Harandi et al. (2014); an initial mesh (from the first TF)
was deformed to match the image data (of another TF),
while a speech scientist guided the deformation. Each seg-
mentation was then inspected in ITK-SNAP (Yushkevich
et al., 2006) and corrected, if necessary, by the expert.
D. Speaker-specific modeling
1. Tongue
In order to generate the speaker-specific tongue models,
this study modifies the finite element (FE) tongue modeling
technique previously proposed by Harandi et al. (2015).
Based on the tongue surface (S) segmented from the first TF
of the speaker’s cine MR image volume, we built a high res-
olution tongue model using a three-step process.
(a) Registration. A state-of-the-art generic FE model of
the tongue (Buchaillard et al., 2009)1 was registered to
the surface S using the Mesh-Match-and-Repair regis-
tration technique (Bucki et al., 2010). The registered
FE model has the same resolution as the generic
tongue, and thus is referred to as FElow.
(b) Meshing. A higher resolution FE model was generated
from S using a regular mixed-element meshing tech-
nique (Lobos, 2012). The fourth level of grid refine-
ment in the algorithm yielded the desired spatial
resolution—typically about 2800 nodes and 3900 ele-
ments (Harandi et al., 2015). The resulting model is
referred to as FEhigh.
(c) Muscle definition. Each muscle bundle in the generic
tongue model is defined as a set of muscle fibers
(which indicate the direction of the muscular force)
and a set of elements (which represent the muscular
material). This muscle information was carried on to
FElow through registration in step 1 and was used to
define muscle bundles in FEhigh as we describe below.
Figure 6 (top) illustrates the process of defining the mus-
cle elements in high resolution. The goal is to define the
muscle bundle Mhigh in FEhigh that corresponds to a certain
muscle bundle, Mlow, in FElow. Since both FElow and FEhigh
share the same coordinates, the fibers of Mlow (shown in red
in Fig. 6) are simply copied to Mhigh. The elements of Mhigh,
however, need to be redefined. Consider the element e in
FEhigh. In their proposed method, Harandi et al. (2015)
assign e to Mhigh if e falls within a predefined distance (d) of
the fibers of Mhigh. That method is intuitive and simple, but
no single value of d yields satisfactory results. First, in the
regions where fibers are very close to each other, their corre-
sponding elements tend to overlap. Overlapping elements
may introduce error in the inverse solver, where an unrelated
muscle may be considered responsible for a certain motion.
Second, in the regions where fibers are relatively far from
each other, elements in between fibers tend to fall out of the
muscle definition and create holes in the muscle. These holesmay cause inhomogeneity in the force-activation behaviour
of the muscle. In this study, we assign e to a certain Mhigh if
the elements of the corresponding Mlow contain e. In addi-
tion, we incorporate adjacency relationships between the
tongue muscles—as in the generic tongue model—to avoid
overlap of non-overlapping bundles. Figure 6 (bottom)
shows the muscle elements for the five functional segments
FIG. 5. (Color online) Mandible segmentation for speaker A. The generic
model is manually sculpted to match the partial surface while its intersection
with the image data is inspected. The orange contours in the bottom row
show the final result at mid-views of the first TF of cine MRI.
FIG. 6. (Color online) Defining the muscle elements in the high resolution
FE tongue model (top row), as well as functional segments of the genioglos-
sus muscle for speaker C (bottom row). Overlapping elements are shown in
black for the muscle elements used by Harandi et al. (2015).
J. Acoust. Soc. Am. 141 (4), April 2017 M. Harandi et al. 2583
of the genioglossus (GG) muscle for speaker C. In the figure,
results from the proposed method are compared to Harandi
et al. (2015); the muscle elements in FElow serve as the
ground truth. Note that the proposed method preserves the
boundary of each segment, while preventing overlaps and
holes in muscle definition.
The bone attachments in the tongue model—the FE
nodes at which the model is biomechanically coupled to the
mandible and hyoid rigid bodies—were also transferred
from FElow to FEhigh. For each attachment node in FElow, the
closest node (by Euclidean distance) in FEhigh was consid-
ered to be the corresponding attachment.
We used a Blemker muscle model (Blemker et al.,2005) with fifth-order Mooney-Rivlin material to account
for non-linearity, incompressibility and hyper-elasticity of
the tongue tissue. The mechanical parameters of the material
were set according to the values suggested by Buchaillard
et al. (2009) for the generic tongue model.
2. Mandible and hyoid
Our speaker-specific model of the mandible and hyoid is
similar to the ArtiSynth generic model (Stavness et al.,2011) in its biomechanics: it was coupled to the tongue FE
model via multiple attachment points that were included in
the constitutive equations of the system as bilateral con-
straints. Bilateral point-to-point Hill-type actuators, as listed
in Sec. III, were used to represent the associated muscles and
the TMJ was modeled by curvilinear constraint surfaces.
The bone density was set to 2000 kg/m3 as used by Dang and
Honda (2004). For each speaker, the geometries of mandible
and hyoid bone rigid bodies were replaced with the corre-
sponding surfaces segmented from the first TF of cine MRI
data, as described in Sec. II C. Each muscle’s origin and
insertion were adjusted according to the speaker image data
in ArtiSynth’s graphical user interface. The bone-tongue
attachment points were computed based on the generic
tongue model, as described in Sec. II D1.
E. Data-driven simulation
Forward dynamic simulation requires fine tuning of
muscle activations of the model over time. EMG recordings
of the tongue have been used to simulate a generic biome-
chanical model (Fang et al., 2009); however, EMG suffers
from the lack of suitable technology to deal with the moist
surface and the highly deformable body of the tongue
(Yoshida et al., 1982). In addition, the relationship between
the EMG signal and muscle forces is not straightforward. As
an alternative, muscle activations can be predicted from the
available kinematics (i.e., position and/or velocities over
time) by solving an inverse problem (Erdemir et al., 2007;
Stavness et al., 2012).
In ArtiSynth, the system velocities are computed in
response to the active and passive forces during forward sim-
ulation. For inverse simulation, the solver uses a sub-space
(v) of total system velocities as its target and computes the
normalized activations (a) by solving a quadratic equation
subject to the condition 0� a� 1:
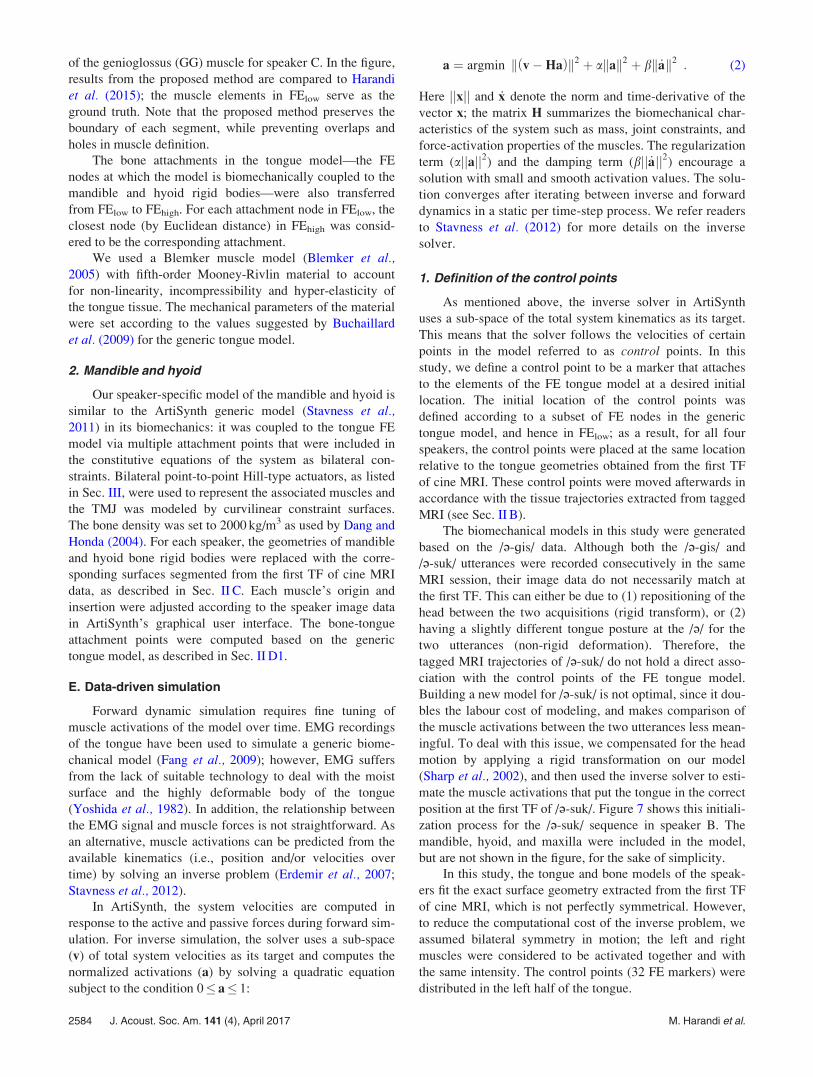
a ¼ argmin k v�Hað Þk2 þ akak2 þ bk _ak2� �
: (2)
Here jjxjj and _x denote the norm and time-derivative of the
vector x; the matrix H summarizes the biomechanical char-
acteristics of the system such as mass, joint constraints, and
force-activation properties of the muscles. The regularization
term (ajjajj2) and the damping term (bjj _ajj2) encourage a
solution with small and smooth activation values. The solu-
tion converges after iterating between inverse and forward
dynamics in a static per time-step process. We refer readers
to Stavness et al. (2012) for more details on the inverse
solver.
1. Definition of the control points
As mentioned above, the inverse solver in ArtiSynth
uses a sub-space of the total system kinematics as its target.
This means that the solver follows the velocities of certain
points in the model referred to as control points. In this
study, we define a control point to be a marker that attaches
to the elements of the FE tongue model at a desired initial
location. The initial location of the control points was
defined according to a subset of FE nodes in the generic
tongue model, and hence in FElow; as a result, for all four
speakers, the control points were placed at the same location
relative to the tongue geometries obtained from the first TF
of cine MRI. These control points were moved afterwards in
accordance with the tissue trajectories extracted from tagged
MRI (see Sec. II B).
The biomechanical models in this study were generated
based on the /@-gis/ data. Although both the /@-gis/ and
/@-suk/ utterances were recorded consecutively in the same
MRI session, their image data do not necessarily match at
the first TF. This can either be due to (1) repositioning of the
head between the two acquisitions (rigid transform), or (2)
having a slightly different tongue posture at the /@/ for the
two utterances (non-rigid deformation). Therefore, the
tagged MRI trajectories of /@-suk/ do not hold a direct asso-
ciation with the control points of the FE tongue model.
Building a new model for /@-suk/ is not optimal, since it dou-
bles the labour cost of modeling, and makes comparison of
the muscle activations between the two utterances less mean-
ingful. To deal with this issue, we compensated for the head
motion by applying a rigid transformation on our model
(Sharp et al., 2002), and then used the inverse solver to esti-
mate the muscle activations that put the tongue in the correct
position at the first TF of /@-suk/. Figure 7 shows this initiali-
zation process for the /@-suk/ sequence in speaker B. The
mandible, hyoid, and maxilla were included in the model,
but are not shown in the figure, for the sake of simplicity.
In this study, the tongue and bone models of the speak-
ers fit the exact surface geometry extracted from the first TF
of cine MRI, which is not perfectly symmetrical. However,
to reduce the computational cost of the inverse problem, we
assumed bilateral symmetry in motion; the left and right
muscles were considered to be activated together and with
the same intensity. The control points (32 FE markers) were
distributed in the left half of the tongue.
2584 J. Acoust. Soc. Am. 141 (4), April 2017 M. Harandi et al.

III. RESULTS
The muscle activation patterns were estimated using the
inverse simulation with kinematic trajectories from the MRI
data. Table II shows the tracking error for each speaker dur-
ing the utterances /@-gis/ and /@-suk/. To obtain the values
reported in the table, we first averaged the error over all con-
trol points in each TF to get values meani 6 stdi where
1� i� 26 is the TF number. We then computed the mean
and the standard deviation of the meani (row Mean), and the
stdi (row Std) over the 26 TFs. Note that the tracking error is
in the range of the tagged MRI resolution.
Figures 8 and 9 show the muscle activation patterns. The
four speakers are in columns A to D with TFs (1–26) along
the x axis. Speakers A and B used an apical /s/; speakers C
and D used a laminal /s/. The muscles of the tongue include
the following: genioglossus (GG), hyoglossus (HG), stylo-
glossus (STY), verticalis (VERT), transversus (TRANS), gen-
iohyoid (GH), mylohyoid (MH), and longitudinal [inferior
(IL), superior (SL)]. The GG, VERT, and TRANS muscle
bundles were further divided into five smaller functionally
distinct segments (a: posterior to e: anterior), as suggested by
Miyawaki et al. (1975) and Stone et al. (2004). We also fol-
lowed Fang et al. (2009) in dividing the STY muscle into two
functional segments (p: posterior and a: anterior). The
muscles of the jaw and hyoid include the following: temporal
[anterior (AT), middle (MT), posterior (PT)], masseter [super-
ficial (SM), deep (DM)], pterygoid [medial (MP), superior-
lateral (SP) inferior-lateral (IP)], digastric [anterior (AD), pos-
terior (PD)], and stylo-hyoid (SH).
A. Tongue-protruder muscles
Tongue protruder muscles include the posterior region
of the genioglossus muscle (GGa/b/c), which pulls the
tongue forward, as well as the TRANS and VERT muscles.
The GGa/b/c and TRANS muscles also elevate the tongue
body. The floor muscles GH and MH assist in tongue eleva-
tion and protrusion (Zemlin, 1997).
Our results, as demonstrated in Figs. 8 and 9, show that
for both utterances, the GGa/b (row 1) became more active
over time and were maximally active prior to the final conso-
nant. The exception to this pattern was the upper pharyngeal
region of the GG (GGb) for speakers C and D, which had little
to zero activity toward the end of the utterance. Speaker B
used the GGb more than the other speakers, to position the
vowel. The GGc pulse occurred during both vowels /i/ and /u/.
The TRANS muscle (row 2), like the GG muscle,
showed distinct activations in its different segments. It did
not activate as a single muscle, and its pattern of activation
was quite different across speakers. For example, speakers B
and C used different segments of the TRANS to elevate the
tongue for the consonants in /@-suk/. Speaker B used the
TRANSa/d/e to narrow the tongue during the /s/, and contin-
ued to increase activation of the TRANSa (the tongue root)
and TRANSe (the tongue blade) for the /k/. On the other
hand, speaker C used the TRANSb/c (the posterior oral and
upper pharyngeal segments) primarily for the /s/, increasing
into the /k/, though all segments participated in both sounds.
Overall, the TRANSd/e increased activity before the /s/, espe-
cially in /@-gis/, consistent with local tongue tip protrusion,
but more so for the apical speakers (A and B). The VERTd
had a similar activation pattern as the TRANSd/e, for all four
speakers in each utterance. Since the co-activation of these
muscle segments protrudes the tongue tip, such similar pat-
terns must be an integral part of the /s/ gesture.
In row 4, the GH (which elevates the tongue body)
showed activation during the high vowels, /i/ and /u/, and the
velar consonants, /k/ and /g/, except for speaker B who did
not use the GH at all. Speaker A also showed low levels of
GH activation in /@-suk/. The MH is active only occasionally,
such as during the /g/ and /s/ for speaker A in /@-gis/, and dur-
ing the /s/ and /k/ for speaker B in /@-suk/. This is consistent
with MH’s role to assist tongue elevation during high tongue
positions.
B. Tongue-retractor muscles
The tongue is retracted by the extrinsic muscles, the
STY and HG, which pull the tongue backward/upward and
backward/downward, respectively. Two intrinsic muscles,
the SL and IL, also retract the tongue; they additionally ele-
vate (SL) and lower (IL) the tip. Finally, the anterior fibers
of the genioglossus (GGd/e) lower the upper body and blade
of the tongue, causing backward motion of the tongue body
(Zemlin, 1997).
In our simulations, more activation of the retractor
muscles was expected for /@-suk/ than /@-gis/, since the
tongue moves backwards during /suk/. For /@-suk/, the SL
(row 4) increased in activation for speakers B and C until the
/u/ was reached. Speakers A and D had minimal SL activity.
For /@-gis/, SL activation was higher after the /g/ than during
it, consistent with elevating the tongue tip for the /i/ and /s/.
The IL was mostly quiescent during the two utterances, that
is it showed less than 1% activation.
FIG. 7. (Color online) Initializing simulation of the /@-suk/ sequence for
speaker B. Mid-sagittal view of the FE tongue model after rigid registration
from the first TF of /@-gis/ (left) vs result of inverse simulation to match
the first TF of /@-suk/. Blue(light)/green(dark) circles show target tracking
points before/after inverse simulation. The mandible, hyoid, and maxilla
are included in the model, but are not shown in the figure, for the sake of
simplicity.
TABLE II. Absolute tracking error (mm) for speakers A to D over all con-
trol points and all time-frames in /@-gis/ and /@-suk/.
A B C D
/@-gis/ Mean 1.80 6 0.68 1.95 6 0.75 1.85 6 0.64 1.70 6 0.66
Std 0.83 6 0.35 0.71 6 0.26 0.67 6 0.22 0.73 6 0.26
/@-suk/ Mean 1.90 6 0.55 1.88 6 0.81 1.94 6 0.60 1.90 6 0.69
Std 0.49 6 0.19 0.79 6 0.27 0.97 6 0.28 0.62 6 0.21
J. Acoust. Soc. Am. 141 (4), April 2017 M. Harandi et al. 2585

The largest activations among retractor muscles, in both
utterances, were seen in the GGd/e (row 1) for all four
speakers (5%–10% activation). The GGd muscle—the most
active—lowers or stabilizes the tongue dorsum, and the GGe
further lowers the tongue blade. For /@-gis/, the speakers
used the GGd throughout the utterance, with smaller activa-
tions in the /g/ than the /i/ and /s/. During /@-suk/, the GGd
was most active before the /u/. The GGe was active for the
/@/ in both utterances, with activation for the first consonant,
irrespective of what it was. The exception was the /g/ in
speaker B that had no GGe activation. The GGe was also
active towards the end of /@-gis/.
Of the two extrinsic retractors, the STY (row 4) was
fairly quiescent for both utterances. Minimal activations of
the STYa, and STYp were recorded for speaker B during the
/g/ in /@-gis/, and for the STYa in speaker C at the /s/, and
/k/ in /@-suk/. The HG, on the other hand, was active for
three speakers (A, B, and C), mostly during the /@/ and /s/ in
both utterances. The HG activation during the /s/ is consis-
tent with stabilizing the tongue body as the tip raises.
C. Other muscles
Row 5 in Figs. 8 and 9 contains the jaw closing muscles
(AT, MT, PT, MP, DM, and SM), which globally elevate the
FIG. 8. (Color online) Muscle activations estimated by inverse solver during the utterance /@-gis/ for speakers A to D, presented as the percentage of the maxi-
mal force for each muscle. Muscles of the tongue (rows 1–4) are followed by the jaw-closers (row 5), and the jaw-openers (row 6). The dotted lines indicate
the key time-frames of the utterance. Note that the scale for the bottom row is doubled. In some sub-figures some muscles may be absent as they showed zero
activation.
2586 J. Acoust. Soc. Am. 141 (4), April 2017 M. Harandi et al.

tongue. For /@-gis/, these muscles had larger peaks of activ-
ity during closure into the /g/, and smaller ones during the
motion into the /s/, consistent with tongue elevation for those
sounds. The exception was speaker D, who showed this pat-
tern for the SM, but did not activate the other jaw closing
muscles. For /@-suk/, speaker C and D activated their jaw
closing muscles from the /@/ into the /s/. Speakers B and D
also showed jaw closing activity during the /k/. Once again,
speaker D relied only on the SM and not the other jaw clos-
ing muscles.
Among the muscles in row 6, the IP and SP are jaw pro-
truding and closing muscles. The SH and PD pull the hyoid
back and up; the AD pulls the hyoid forward, which pushes
the tongue up (Zemlin, 1997). The IP exhibited notable acti-
vation, especially for speakers A and B during /@-gis/. In
these speakers, peak activation occurred prior to or during
the /g/ and /s/, consistent with IP’s role in jaw closure.
During /@-suk/, the IP was active throughout the utterance
(speakers A, D) or during the first half (speakers B, C). The
SP showed low-level activation during both utterances for
speakers A, C, and D. SP’s activation, when present, was
mostly constant throughout the utterances, and hence may
have been used to stabilize the jaw.
The hyoid is a particularly unstable bone, as it is the
only bone in the human body that does not articulate with
another bone. It is stabilized entirely by muscles. Among the
FIG. 9. (Color online) Muscle activations estimated by inverse solver during the utterance /@-suk/ for speakers A to D, presented as the percentage of the maximal
force for each muscle. Muscles of the tongue (rows 1–4) are followed by the jaw-closers (row 5), and the jaw-openers (row 6). The dotted lines indicate the key
time-frames of the utterance. Note that the scale for the bottom row is doubled. In some sub-figures some muscles may be absent as they showed zero activation.
J. Acoust. Soc. Am. 141 (4), April 2017 M. Harandi et al. 2587

hyoid positioning muscles, the AD pulls it forward, PD and
SH pull it back and up (Zemlin, 1997). The SH, PD, and AD
(row 6) showed a pulse of activity around the /g/ and /k/.
Turning to the /s/, the SH showed a peak for speakers B and
C in /@-suk/ and speaker B in /@-gis/. The PD muscle showed
a peak at the /s/ for all speakers in /@-gis/, and subjects A, B,
and C in /@-suk/. This is consistent with upward and back-
ward pull on the hyoid, which would pull the posterior
tongue up and back during these consonants. The AD
showed activity during the /s/ for speakers A, and B in
/@-gis/, and speakers A, B, and C in /@-suk/. This is consis-
tent with an upward and forward pull on the hyoid, which
when combined with the PD and SH would elevate the
tongue more directly upward during the consonants.
IV. DISCUSSION
This study used speaker-specific biomechanical models
to investigate differences in the tongue and jaw muscle acti-
vation patterns during two simple speech utterances /@-gis/
and /@-suk/—that differ in direction of tongue motion, and
vowel type (/i/ vs /u/)—among speakers who differ in the /s/
type (apical vs laminal). We discuss the results below.
A. Commonalities across speakers
Since tongue muscle activity measured from EMG usu-
ally shows variability among speakers, it is not surprising to
see individual differences among speakers in our simulation
results. However, there are some similarities that can be
observed among all speakers.
The first commonality across speakers is the relatively
large amount of activation in the largest tongue muscle, the
GG, followed by the jaw advancement muscle [the internal
pterygoid (IP)], and the hyoid positioner muscles [the digas-
tric (AD, PD) and the stylo-hyoid (SH)]. The GGa/b/c were
the most active muscles of protrusion/elevation for all speak-
ers, with as much as 15% activation. The GGd/e were the
most active muscles of retraction/lowering, with up to 10%
activation. The GGa was always activated during articulation
of the consonants, to elevate the tongue to the palate without
jaw assistance. The GGd was continually active in both
utterances—possibly to stabilize the upper tongue surface so
it did not hit the palate inadvertently. Jaw advancement, con-
trolled by the IP muscle, is important for jaw positioning
during the /s/. Jaw position is critical for the /s/, as it sup-
ports a precise tongue-palate contact. In other consonants
jaw position is more variable (Stone and Vatikiotis-Bateson,
1995). The IP was more active during the forward-moving
/gis/, but was still quite active in /suk/, where it was most
active for the /s/ and tapered off for the /k/. In both utteran-
ces, the IP was quite active at or before the /s/.
The hyoid-positioners AD, PD and SH were active in
both utterances, often with pulses for the consonants. The
PD and SH were often active synchronously, sometimes
with AD and sometimes without. These muscles position the
hyoid to allow anterior�posterior tongue body motion dur-
ing vowels. They also resist the anterior pull on the hyoid
(from the GGa) during the /s/, and the /k/ or /g/. In addition,
they assist in changing pitch, as hyoid/thyroid position varies
with pitch in speaking (Vilkman et al., 1996).
The second commonality among speakers was the vari-
ety of activation patterns across the GG regions (a/b/c/d/e),
consistent with independent activation of fibers throughout
the GG. Sokoloff and Deacon (1992) found very high inner-
vation ratios for the fibers of the tongue muscles. That is,
there are many nerve endings in the tongue, which can inde-
pendently activate local regions. Stone et al. (2004) and
Miyawaki et al. (1975) found independent regions of com-
pression and activation in the genioglossus muscle. As it can
be seen in Figs. 8 and 9, the GG—which is inserted along
almost the entire length of the tongue—showed the occa-
sional occurrence of simultaneous and oppositional activa-
tion during both of the speech utterances. For example, in /@-
suk/, all speakers increased the activation of the GGa (most
posterior), and decreased the activation of the GGe (most
anterior), from the /@/ to the /k/. This creates a controlled
gesture that pulls the tongue root forward and allows the
tongue blade to elevate. The other muscles that make up a
structural unit with the GG, namely the TRANS and VERT
[see Takemoto (2001)], show considerably less activation
(<5%) and may be used to fine-tune the position and surface
shape of the tongue. Some behavioral differences in these
muscles were consistent with differences in the apical vs
laminal /s/ (see Sec. IV B). The floor muscles, GH and MH,
have little activation during these utterances and may be
more important for swallowing.
B. Apical vs laminal speakers
Speakers A, B used an apical /s/, and speakers C, D
used a laminal /s/. The TRANSd/e were more active for the
apical /s/. This difference is not seen in the GG data; how-
ever, it should be remembered that for the TRANS, region eextends into the tongue tip, whereas the GGe stops at the
tongue blade. It is possible that these small additional activa-
tions create a very subtle difference in tongue positioning.
The activation differences involved in creating an apical vs a
laminal /s/ may require less active effort than one would
expect. For example, Stone et al. (2012) found that palate
shape has a strong effect on choice of /s/-type and some of
the difference in tongue tip shape may reflect palate shape.
Moreover, thus far, only a slightly faster tip motion in apical
/s/ has been found to distinguish the two motions (Reichard
et al., 2012). Perhaps the simultaneous activation of VERTd
and TRANSd/e protrudes the tip slightly more in apical /s/
and the palate constraint reduces the overall activation
needed. In the present dataset, three of the speakers had low
palates, including both apical /s/ producers (see Table I).
The low-palate laminal speaker (speaker C) was more lami-
nal in /@-gis/ and more apical in /@-suk/ (see Fig. 2).
Additional study is needed to reveal the strength of the link
between palate and tongue features in the /s/.
C. Mechanisms of tongue elevation
Turning our attention to the velar consonants, /g/ and /k/,
we first consider the hyoid elevator muscles, AD and PD. One
or both of these are active for the velar sounds in both
2588 J. Acoust. Soc. Am. 141 (4), April 2017 M. Harandi et al.

utterances, consistent with a link between hyoid elevation and
tongue body elevation. The TRANS also showed activation
before the /g/ in /@-gis/ for speakers A, B, C, and an increase
in activation for speakers B and C during the /uk/ in /@-suk/.
The transverse increases the bulk of the midline tongue and
may be used by these speakers to improve closure during the
velar stop.
One or more of the pharyngeal segments of the GG (a/b/
c) were active into the last consonant of each utterance,
whether it was the /s/ or /k/, while the jaw closing muscles
appeared more active at the beginning of the utterance. This
can be explained by the context. The /@/ at the start of each
utterance uses an open jaw, while the following consonant
uses a closed jaw. Many of the jaw closure muscles showed
a pulse of activity between the /@/ and the first consonant
during /@-gis/, and for speakers C and D during /@-suk/. This
pulse assists the tongue muscles in elevating/fronting the
tongue for the initial consonant. When these same conso-
nants appear at the end of the utterance, however, the jaw is
already quite closed for the preceding vowel (/i/ or /u/); and
so the tongue must internally elevate and front its body,
increasing activation in the GGa/b/c. This significant role of
the genioglossus is consistent with its volume; it is the larg-
est muscle of the tongue (Stone et al., 2016). Interestingly,
activation of the styloglossus, which might be expected to
elevate and retrude the tongue, was seen only rarely, such as
preceding the /g/ in speaker B during /@-gis/.
V. CONCLUSION AND FUTURE WORK
This study demonstrates the benefits of speaker-specific
biomechanical modeling of the oropharynx in understanding
speech production. A previously published framework
(Harandi et al., 2015) is extended with efficient schemes for
bone segmentation from MRI, and for muscle bundle defini-
tion in an FE tongue model. The framework is then applied
to the MRI data of four healthy speakers, in order to investi-
gate the motor control of two utterances that differ in direc-
tion of tongue motion, and of the /s/ sound variants, apical
and laminal. The results reveal the predominant use of the
genioglossus muscle over other tongue muscles. The five
subdivisions are active to varying degrees throughout the
utterances, indicating varying patterns of simultaneous and
oppositional activation. The transverse subdivisions also
exhibit a fair amount of activation, though usually in the
same phonemes. The other tongue muscles appear to have
small localized patterns that vary across speakers, consistent
with fine tuning the tongue shape for the individual speakers’
vocal tracts. It should be noted that our modeling and simu-
lation experiments are based on the MRI data of only two
utterances from four English speakers. A larger database is
needed in order to confirm the generality of our findings.
Our team is currently working towards a more in-depth
post processing of tagged MRI data, that groups the motion of
tissue-points to enable tracking of individual muscles in the
tongue. The results might be used for validation of inverse
simulations, or incorporated into a muscle-based (as opposed
to a point-based) inverse simulation scheme, ensuring a more
meaningful averaging of tagged MRI tracking data.
Extra generic or speaker-specific medical data would
increase the reliability of our modeling and simulation.
Some possible examples are (1) digitized cadaver tissue to
provide a higher resolution of muscle fibers for our generic
tongue model, (2) computed tomography images to remove
the complexity and ambiguity of bone segmentation, (3) jaw
optical tracking to provide mandible trajectories as an input
to our inverse simulations, and (4) biomechanical measure-
ments—such as maximum jaw exertion force—to help with
tuning each speaker-specific model.
Another natural extension to this work could be to
include biomechanical models of other oropharyngeal organs,
such as the velum, uvula, epiglottis, and lips (upon which the
shape of the vocal tract depends). Such models are currently
included in a head-and-neck generic model (Anderson et al.,2015), and will be part of the future subject-specific modeling
efforts.
Finally, it is worth mentioning that the current oropha-
ryngeal models are designed for healthy adult speakers.
Therefore, it is reasonable to suspect their fidelity (as a refer-
ence for speaker-specific modeling) in cases where the anat-
omy and/or neurology deviates vastly from such norms. An
example would be larger, slower speech movements in chil-
dren caused by different underlying control processes [e.g.,
Smith and Goffman (1998)]. Further study is needed to find
speaker-specific solutions for such incompatible cases.
ACKNOWLEDGMENTS
This work is funded by Natural Sciences and
Engineering Research Council of Canada (NSERC),
NSERC-Collaborative Health Research Project (CHRP),
Network Centre of Excellence on Graphics, Animation and
New Media (GRAND), and National Institutes of Health-
National Cancer Institute, NIH-R01-CA133015.
1The FE model consists of 946 nodes, 740 hexahedral elements, and
embedded muscle bundles with bilateral symmetry, as listed in Sec. III.
Anderson, P., Harandi, N. M., Moisik, S., Stavness, I., and Fels, S. (2015).
“A comprehensive 3D biomechanically-driven vocal tract model including
inverse dynamics for speech research,” in Proceedings of InterSpeech, pp.
2395–2399.
Badin, P., Bailly, G., Reveret, L., Baciu, M., Segebarth, C., and Savariaux,
C. (2002). “Three-dimensional linear articulatory modeling of tongue, lips
and face, based on MRI and video images,” J. Phon. 30, 533–553.
Blemker, S. S., Pinsky, P. M., and Delp, S. L. (2005). “A 3D model of mus-
cle reveals the causes of nonuniform strains in the biceps brachii,”
J. Biomech. 38, 657–665.
Boersma, P., and Weenink, D. (2015). “Praat: Doing phonetics by computer
[computer program],” Version 5.4.08, available at http://www.praat.org/
(Last viewed March 1, 2016).
Buchaillard, S., Perrier, P., and Payan, Y. (2009). “A biomechanical model
of cardinal vowel production: Muscle activations and the impact of gravity
on tongue positioning,” J. Acoust. Soc. Am. 126, 2033–2051.
Bucki, M., Lobos, C., and Payan, Y. (2010). “A fast and robust patient spe-
cific finite element mesh registration technique: Application to 60 clinical
cases,” Med. Image Anal. 14, 303–317.
Chen, M., Lu, W., Chen, Q., Ruchala, K. J., and Olivera, G. H. (2008). “A
simple fixed-point approach to invert a deformation field,” Med. Phys. 35,
81–88.
Dang, J., and Honda, K. (2004). “Construction and control of a physiologi-
cal articulatory model,” J. Acoust. Soc. Am. 115, 853–870.
Dart, S. (1991). “Articulatory and acoustic properties of apical and laminal
articulations,” in UCLA Working Papers in Phonetics 79.
J. Acoust. Soc. Am. 141 (4), April 2017 M. Harandi et al. 2589

Erdemir, A., McLean, S., Herzog, W., and van den Bogert, A. J. (2007).
“Model-based estimation of muscle forces exerted during movements,”
Clin. Biomech. 22, 131–154.
Fang, Q., Fujita, S., Lu, X., and Dang, J. (2009). “A model-based investiga-
tion of activations of the tongue muscles in vowel production,” Acoust.
Sci. Technol. 30, 277–287.
G�erard, J. M., Wilhelms-Tricarico, R., Perrier, P., and Payan, Y. (2003). “A
3D dynamical biomechanical tongue model to study speech motor con-
trol,” Recent Res. Dev. Biomech. 1, 49–64.
Harandi, N. M., Abugharbieh, R., and Fels, S. (2014). “3D segmentation of
the tongue in MRI: A minimally interactive model-based approach,”
Comput. Methods Biomech. Biomed. Eng. Imag. Vis. 3, 178–188.
Harandi, N. M., Stavness, I., Woo, J., Stone, M., Abugharbieh, R., and Fels,
S. (2015). “Subject-specific biomechanical modeling of the oropharynx:
Towards speech production,” Comput. Methods Biomech. Biomed. Eng.
Imaging Vis. 1–11.
Ho, A. K., Nicosia, M. A., Dietsch, A., Pearson, W., Rieger, J., Solomon,
N., Stone, M., Inamoto, Y., Saitoh, E., Green, S., and Fels, S. (2014). “3D
dynamic visualization of swallowing from multi-slice computed
tomography,” in ACM SIGGRAPH Posters, no. 103.
Liu, X., Abd-Elmoniem, K., Stone, M., Murano, E., Zhuo, J., Gullapalli, R. P.,
and Prince, J. L. (2012). “Incompressible deformation estimation algorithm
(IDEA) from tagged MR images,” IEEE Trans. Med. Imag. 31, 326–340.
Lobos, C. (2012). “A set of mixed-elements patterns for domain boundary
approximation in hexahedral meshes,” Stud. Health Technol. Inform. 184,
268–272.
Masaki, S., Tiede, M. K., Honda, K., Shimada, Y., Fujimoto, I., Nakamura,
Y., and Ninomiya, N. (1999). “MRI-based speech production study using
a synchronized sampling method,” J. Acoust. Soc. Jpn. 20, 375–379.
Miyawaki, O., Hirose, H., Ushijima, T., and Sawashima, M. (1975). “A pre-
liminary report on the electromyographic study of the activity of lingual
muscles,” Ann. Bull. RILP 9, 406.
Osman, N. F., McVeigh, E. R., and Prince, J. L. (2000). “Imaging heart
motion using harmonic phase MRI,” IEEE Trans. Med. Imaging 19,
186–202.
Parthasarathy, V., Prince, J. L., Stone, M., Murano, E. Z., and NessAiver,
M. (2007). “Measuring tongue motion from tagged cine-MRI using har-
monic phase (HARP) processing,” J. Acoust. Soc. Am. 121, 491–504.
Perrier, P., Payan, Y., Zandipour, M., and Perkell, J. (2003). “Influences of
tongue biomechanics on speech movements during the production of velar
stop consonants: A modeling study,” J. Acoust. Soc. Am. 114, 1582–1599.
Reichard, R., Stone, M., Woo, J., Murano, E., and Prince, J. L. (2012).
“Motion of apical and laminal /s/ in normal and post-glossectomy speak-
ers,” J. Acoust. Soc. Am. 131, 3346–3350.
S�anchez, C. A., Stavness, I., Lloyd, J. E., and Fels, S. (2013). “Forward dynam-
ics tracking simulation of coupled multibody and finite element models:
Application to the tongue and jaw,” in Proceedings of CMBBE, pp. 261–270.
Sharp, G. C., Lee, S. W., and Wehe, D. K. (2002). “ICP registration using
invariant features,” IEEE Trans. Pattern Anal. 24, 90–102.
Smith, A., and Goffman, L. (1998). “Stability and patterning of speech
movement sequences in children and adults,” J. Speech Lang. Hear. Res.
41, 18–30.
Sokoloff, A. J., and Deacon, T. W. (1992). “Musculotopic organization of
the hypoglossal nucleus in the cynomolgus monkey, Macaca fascicularis,”J. Comp. Neurol. 324, 81–93.
Stavness, I., Lloyd, J. E., and Fels, S. (2012). “Automatic prediction of
tongue muscle activations using a finite element model,” J. Biomech. 45,
2841–2848.
Stavness, I., Lloyd, J. E., Payan, Y., and Fels, S. (2011). “Coupled hard-soft
tissue simulation with contact and constraints applied to jaw-tongue-hyoid
dynamics,” Int. J. Numer. Method Biomed. Eng. 27, 367–390.
Stavness, I., Nazari, M. A., Flynn, C., Perrier, P., Payan, Y., Lloyd, J. E.,
and Fels, S. (2014a). “Coupled biomechanical modeling of the face, jaw,
skull, tongue, and hyoid bone,” in 3D Multiscale Physiological Human,
edited by Magnenat-Thalmann, N., Ratib, O., and Choi, H. F. (Springer,
London), pp. 253–274.
Stavness, I., S�anchez, C. A., Lloyd, J. E., Ho, A., Wang, J., Fels, S., and
Huang, D. (2014b). “Unified skinning of rigid and deformable models for
anatomical simulations,” in SIGGRAPH Asia Technical Briefs, pp. 9.
Stevens, K. N. (1989). “On the quantal nature of speech,” J. Phonetics 17,
3–45.
Stone, M., Epstein, M. A., and Iskarous, K. (2004). “Functional segments in
tongue movement,” Clin. Linguist. Phonet. 18, 507–521.
Stone, M., Rizk, S., Woo, J., Murano, E. Z., Chen, H., and Prince, J. L.
(2012). “Frequency of apical and laminal /s/ in normal and post-
glossectomy patients,” J. Med. Speech Lang. Pathol. 20, 106–111.
Stone, M., and Vatikiotis-Bateson, E. (1995). “Trade-offs in tongue, jaw and
palate contributions to speech production,” J. Phonet. 23, 81–100.
Stone, M., Woo, J., Lee, J., Poole, T., Seagraves, A., Chung, M., Kim, E.,
Murano, E. Z., Prince, J. L., and Blemker, S. S. (2016). “Structure and var-
iability in human tongue muscle anatomy,” Comput. Methods Biomech.
Biomed. Eng. Imag. Vis. 1–9.
Takano, S., and Honda, K. (2007). “An MRI analysis of the extrinsic tongue
muscles during vowel production,” Speech Commun. 49, 49–58.
Takemoto, H. (2001). “Morphological analyses of the human tongue muscu-
lature for three-dimensional modeling,” J. Speech Lang. Hear. Res. 44,
95–107.
Vasconcelos, M. J., Ventura, S. M., Freitas, D. R., and Tavares, J. M. R.
(2012). “Inter-speaker speech variability assessment using statistical
deformable models from 3.0 Tesla magnetic resonance images,” Proc.
Inst. Mech. Eng. H 226, 185–196.
Ventura, S. R., Freitas, D. R., Ramos, I. M. A., and Tavares, J. M. R. (2013).
“Morphologic differences in the vocal tract resonance cavities of voice
professionals: An MRI-based study,” J. Voice 27, 132–140.
Ventura, S. R., Freitas, D. R., and Tavares, J. M. R. (2009). “Application of
MRI and biomedical engineering in speech production study,” Comput.
Methods Biomech. Biomed. Eng. 12, 671–681.
Vercauteren, T., Pennec, X., Perchant, A., and Ayache, N. (2009).
“Diffeomorphic demons: Efficient non-parametric image registration,”
Neuroimage 45, S61–S72.
Vilkman, E., Sonninen, A., Hurme, P., and K€orkk€o, P. (1996). “External
laryngeal frame function in voice production revisited: A review,”
J. Voice 10, 78–92.
Woo, J., Lee, J., Murano, E. Z., Xing, F., Al-Talib, M., Stone, M., and
Prince, J. L. (2015). “A high-resolution atlas and statistical model of the
vocal tract from structural MRI,” Comput. Methods Biomech. Biomed.
Eng. Imag. Vis. 3, 47–60.
Woo, J., Murano, E. Z., Stone, M., and Prince, J. L. (2012). “Reconstruction
of high resolution tongue volumes from MRI,” IEEE Trans. Biomed. Eng.
59, 3511–3524.
Wrench, A. A., and Scobbie, J. M. (2011). “Very high frame rate ultrasound
tongue imaging,” in Proceedings of ISSP, pp. 155–162.
Xing, F., Woo, J., Murano, E. Z., Lee, J., Stone, M., and Prince, J. L. (2013).
“3D tongue motion from tagged and cine MR images,” in Proceedings ofMICCAI, pp. 41–48.
Xing, F., Ye, C., Woo, J., Stone, M., and Prince, J. L. (2015). “Relating
speech production to tongue muscle compressions using tagged and high-
resolution magnetic resonance imaging,” Proc. SPIE 2015,
94131L1–94131L6.
Yoshida, K., Takada, K., Adachi, S., and Sakuda, M. (1982). “Clinical sci-
ence EMG approach to assessing tongue activity using miniature surface
electrodes,” J. Dent. Res. 61, 1148–1152.
Yushkevich, P. A., Piven, J., Hazlett, H. C., Smith, R. G., Ho, S., Gee, J. C.,
and Gerig, G. (2006). “User-guided 3D active contour segmentation of
anatomical structures: Significantly improved efficiency and reliability,”
Neuroimage 31, 1116–1128.
Zemlin, W. R. (1997). Speech and Hearing Science, Anatomy andPhysiology, 4th ed. (Pearson, Boston), pp. 277–295.
2590 J. Acoust. Soc. Am. 141 (4), April 2017 M. Harandi et al.