Instruments and Methods Diel nitrate cycles observed with ...

AQUATIC BIOLOGYAquat Biol
Vol. 23: 167–182, 2015doi: 10.3354/ab00618
Published online February 11
INTRODUCTION
Respiration and biocalcification of marine animalssuch as molluscs can be a source of CO2 into the eco-system and their role in the carbon cycle has beendemonstrated in temperate environments (Chauvaudet al. 2003, Clavier et al. 2009, Lejart et al. 2012, Mis-tri & Munari 2013). This contribution can be assessed
empirically through oxygen respiratory fluxes con-verted to carbon using available respiratory quotients(Boucher & Clavier 1995) or by directly assessing car-bon metabolism through respiration and calcificationmeasurements (e.g. Martin et al. 2006). While moststudies have focused on temperate molluscs, either toinfer their role in the carbon cycle (Martin et al. 2006,Lejart & Hily 2011, Lejart et al. 2012, Mistri & Munari
© The authors 2015. Open Access under Creative Commons byAttribution Licence. Use, distribution and reproduction are un -restricted. Authors and original publication must be credited.
Publisher: Inter-Research · www.int-res.com
*Corresponding author: [email protected]
Variability in diel and seasonal in situ metabolismof the tropical gastropod Tectus niloticus
A. Lorrain1,*, J. Clavier2, J. Thébault2, L. Tremblay-Boyer3, F. Houlbrèque4, E. Amice2, M. Le Goff2, L. Chauvaud2
1IRD, Laboratoire des Sciences de l’Environnement Marin (UMR 6539 CNRS/UBO/IRD/IFREMER), BP A5, 98848 Nouméa cedex, New Caledonia, France
2Université de Brest, Institut Universitaire Européen de la Mer, Laboratoire des Sciences de l’Environnement Marin (UMR 6539 CNRS/UBO/IRD/IFREMER), 29280 Plouzané, France
3Biodiversity Centre, University of British Columbia, Vancouver, British Columbia V6T 1Z4, Canada4IRD, UR CoRéUs 2, BP A5, 98848 Nouméa cedex, New Caledonia, France
ABSTRACT: Researchers often use metabolic measurements in the field over narrow time periodsto estimate an organism’s metabolism over large time scales. Here, we measured in situ respira-tion, calcification and excretion rates of the tropical gastropod Tectus niloticus L. through benthicchamber experiments. Our samples spanned a 21 h time frame and were taken during both thewarm and cool seasons. We assessed diel and seasonal variability in metabolic rates, as well as theeffect of individual size and the contribution of shell epi- and endobionts. Our results show thatmetabolic rates vary through time at both diel and seasonal scales, as measured fluxes for respira-tion and calcification were significantly higher at night during the warm season. This nocturnalpattern was not significant in the cool season. Size effects were significant with higher respirationand calcification rates for small individuals regardless of the season, although the differencetended to be more pronounced in the warm season. We also found that shell epi- and endobiontsmade an important contribution to respiration, as 40 and up to 100% of total measured fluxes fornight and day, respectively, could be attributed to the shell community. More importantly, thedirection of the measured flux was occasionally opposite that of the individual trochus, highlight-ing that the contribution of shell epi- and endobionts must be accounted for in order to achieve anaccurate understanding of individual metabolism. Lastly, depending on the time of day and seasonwhen measurements are taken, ignoring diel or seasonal variations in metabolic rates could resultin important under- or overestimation of the contributions of gastropods to carbon and calciumcarbonate fluxes in coastal ecosystems.
KEY WORDS: Gastropod · Seasonal variations · Diel variations · Size · Carbon fluxes · CO2 ·CaCO3 · New Caledonia
OPENPEN ACCESSCCESS
Aquat Biol 23: 167–182, 2015
2013) or to gain better insight into their adaptivestrategies (Tagliarolo et al. 2012, 2013a,b), few studiesare available for tropical molluscs (but see Boucher-Rodoni & Boucher 1993).
Tectus niloticus L. is a large tropical marine snailcommonly known as topshell or trochus. The speciesis widespread throughout Southeast Asia and theWestern Pacific, and has been introduced in manySouth Pacific islands (Purcell & Cheng 2010). Trochusmeat is a source of protein, while its shells have beentraditionally used for ornaments by indigenous peo-ple (Castell & Sweatman 1997, Hoang et al. 2008).This species is also one of the most valuable andsought-after reef gastropods because its shell can beused in the manufacture of mother-of-pearl buttons(Castell & Sweatman 1997), which can be a valuablesource of income for people in the Indo-Pacific re -gion. However, overharvesting is causing a rapid de -cline in its numbers (Nash 1993, Castell 1997, Castell& Sweatman 1997). Because of commercial interestand the risk of overfishing, this species has beenthe subject of numerous biological studies (e.g. Bour1989, Castell & Sweatman 1997, Pakoa et al. 2010,Purcell & Cheng 2010).
Trochus can be found in both intertidal and sub-tidal reef areas, generally in high energy sections ofthe reef (Bour 1990, Pakoa et al. 2010). While theoptimum depth for T. niloticus is between 0 and 15 m,individuals can be found as deep as 25 m (Pakoa etal. 2010). Juveniles are quite cryptic but larger indi-viduals are found easily on tropical coral reef flats(Castell 1997). T. niloticus has a large, thick shell andcan grow to over 15 cm (basal diameter). Typical life-span is 15 to 20 yr, and reproductive maturity isreached after 2 yr and at a basal diameter of ca. 6 cm(Castell 1997). Trochus are herbivores and tend to eatturf algae and biofilm by grazing on corals and rocks(Villanueva et al. 2013). They are mainly nocturnal(Bour 1989), with feeding rates increasing signifi-cantly at night (Heslinga & Hillmann 1981).
Together with the objective of increasing generalknowledge of an exploited tropical gastropod, ex -amining trochus diel activity patterns provide anexcellent opportunity to consider variations of carbonmetabolism over a 24 h cycle. Variations in res pira -tion or calcification of marine organisms have al -ready been measured over different seasons (Lejartet al. 2012), but diel variations are rarely consideredsince measurements tend to be taken only during theday, even for large-scale extrapolations of carbonmetabolism. Furthermore, trochus shells, similar tocarbonate substrates (Tribollet 2008), are colonizedby epi- and endobionts such as bacterial biofilm, turf
algae, encrusting calcareous algae and endo lithicflora (Heisterkamp et al. 2013). Until now, the influ-ence of these epi- and endobionts on respiration andcalcification in molluscs has never been considered.The objectives of this study were therefore to (1) esti-mate in situ diel variations of trochus underwater res-piration and calcification in a tropical ecosystem, (2)test the influence of individual size and seasons onthe corresponding carbon, calcium carbonate andammonium fluxes, and (3) determine if shell epi- andendobionts have a significant impact on these differ-ent fluxes.
MATERIALS AND METHODS
Study site
Field work was conducted from the RV ‘Alis’ in thesouthwest New Caledonian lagoon on the Tabou reef(22° 28.861’ S; 166° 26.793’ E; Fig. 1) on 4−5 February(warm season) and 23−24 August 2012 (cool season),to sample 2 seasons with contrasting temperatures.In this region, lower water temperatures occur dur-ing the cool season from May to November whilehigh water temperatures are seen in January andFebruary (22.3 vs. 28.1°C; Clavier & Garrigue 1999).Trochus individuals were harvested by SCUBA diversat between 2 and 7 m depth at the Amédée reef(22° 28.804’ S; 166° 27.877’ E; Fig. 1), where the highestaverage density occurs for this species in New Cale-donia (0.69 ± 0.43 ind. m−2; P. Dumas pers. comm.).Specimens were then transferred to the study site ata depth of 7 m in February, and 3 m in August. Seatemperatures for the Amédée reef station (Fig. 1) wereobtained at 30 min intervals via a Seabird SBE56from the ReefTEMPS network (http:// webgops. ird.nc/ geoserver/www/reeftemps_network.html).
Incubation protocol
Dissolved inorganic carbon (DIC) and calcium car-bonate (CaCO3) fluxes associated with Tectus niloti-cus were measured in situ using transparent Plexi-glas benthic chambers 0.19 m in diameter (Fig. 2).The enclosed volume ranged from 6.3 to 6.9 l(depending on the exact length of hoses connectingthe different parts of the experimental system and ontrochus volume). Once during the warm and the coolseason, 4 chambers were deployed simultaneouslyand a series of 8 incubations with the same speci-mens were performed over a 24 h period to encom-
168

Lorrain et al.: Variability in Tectus niloticus metabolism
pass the full range of daily irradiance levels. Each ofthese incubations was carried out for 1 h. The enclo-sures were then opened for at least 30 min betweensubsequent incubations to restore ambient condi-tions in the chamber. Adjustable submersible pumpsconnected to waterproof batteries mixed the waterinside the enclosures at a water flow rate of 2 l min−1
(see Fig. 2). To assess the effect of animal size onfluxes, the chambers contained either small trochus(max. basal diameter 51 to 75 mm) or large trochus(112 to 121 mm) (2 chambers per size treatment). Thesmall size treatment chambers contained 4 smalltrochus and the large size treatment chambers con-tained one large trochus to maintain the sameamount of total biomass in each benthic chamber.
The contribution of epi- and endobionts colonizingtrochus shell surfaces (hereafter referred to as the‘shell community’) to the fluxes was assessed by her-metically closing the aperture of the same trochusshells with sealing wax and measuring the fluxesover the same range of irradiance covered by theprevious experiment. All individuals had approxi-mately the same epi- and endobiont coverage. At theend of the experiments, the biomass of the specimens
169
166°10’E 166°20’ 166°30’ 166°40’
22°30’
22°20’
22°10’ S
Tabou reef
Amédée reef
NOUMÉA
164°E 165°E 166°E 167°E
20°S
21°S
22°S
23°S
N
S
LandReef
Pacific Ocean
Barrier reef
Fig. 1. Sampling site for Tectus niloticus metabolism measurements (Tabou reef) and environmental survey (Amédée reef) in the southwest lagoon of New Caledonia
1
3
4 5
6
2
Fig. 2. Schematic representation of the experimental systemfor Tectus niloticus metabolic measurements, showing 1:benthic chamber containing a trochus; 2: seawater samplingport; 3: flow meter; 4: battery in a waterproof housing; 5: adjustable submersible pump; 6: multiparameter probe.
Arrows indicate direction of water flux

Aquat Biol 23: 167–182, 2015
was determined by drying trochus flesh at 60°C for24 h and combusting at 450°C for 4 h. The ash masswas then subtracted from the dry mass to obtain theash-free dry weight (AFDW). All biomass results areexpressed as g AFDW.
Respiration and calcification measurements
Photosynthetically active radiation (PAR, 400 to700 nm) irradiance (I, μmol photons m−2 s−1) wasmeasured underwater at the same depth as benthicchambers using a quantum sensor (LI-192 SA cou-pled to Li1400, LI-COR). Dissolved oxygen concen-tration, temperature, salinity and depth were re -corded every minute inside each chamber with amultiparameter probe (YSI 6920). We assessed thesystem’s performance by checking that the temporalpattern of oxygen concentration remained linear dur-ing the incubations (r2 > 0.99). Oxygen saturation wasalways above 90% at the end of the experiments,indicating the absence of hypoxic stress in the ben-thic chambers. Seawater samples were collected with450 ml syringes inside chambers at the beginningand end of each incubation to obtain measurementsof pH, total alkalinity (TA), and ammonium andnitrate concentrations. The pH was measured im -mediately on-board using a pH-meter (RadiometerpH240) standardised with TRIS/HCl (2-amino-2-hydroxymethyl-1, 3-propanediol) and 2-aminopyri-dine/HCl buffer solutions in synthetic seawater ofsalinity 35. TA samples were filtered through 0.7 μmWhatman glass-fiber filters (GF/F) and stored in250 ml bottles in the dark. TA (mmol kg−1) was fur-ther determined on 20 ml subsamples (6 replicates)by Gran automatic potentiometric titration (Radiome-ter, Titrilab TIM 865) using 0.01 M HCl. The meanstandard deviation of replicate measurements wasless than 0.003 mmol kg−1.
The concentration of DIC was calculated from pH,TA, temperature, salinity, phosphate and silicate con-centrations (Pierrot et al. 2006). Southwest lagoonphosphate (0.04 μmol l−1) and silicate (2 μmol l−1) con-centrations from Jacquet et al. (2006) were used forcalculations. The values of the CO2 dissociation con-stants K1 and K2 were taken from Roy et al. (1993).Ammonium ions (NH4
+), the major nitrogenous wasteproduct of aquatic molluscs (Bishop et al. 1983),potentially caused an increase in TA by 1 equivalentper mole, resulting in an underestimation of calcifica-tion fluxes. The rates of ammonia excretion weretherefore determined for large and small individualsto correct TA fluxes, and secondarily to estimate
nitrogen excretion of trochus individuals. Ammo-nium concentrations were analyzed on-board usingthe fluorometric method (Holmes et al. 1999; TurnerTrilogy fluorometer). Nitrates were also measured,but no significant variations were observed duringincubations, and therefore these fluxes were not con-sidered further.
Calcification was estimated using the alkalinityanomaly technique (Smith & Key 1975) based on thefact that TA decreases by 2 equivalents for each moleof CaCO3 precipitated. Calcification (G, μmol CaCO3
h−1) and respiration (R, μmol DIC h−1) rates per cham-ber were estimated using the following equations:
(1)
(2)
where ΔTA is the variation in TA during incubation(μmol l−1) corrected from the ammonium fluxes, ΔDICis the variation in DIC concentration (μmol l−1), v isthe volume of the benthic chamber (l) and Δt is theincubation time (h). Positive CaCO3 fluxes refer tocalcification while negative or null fluxes expressdissolution or no calcification.
At the individual scale, estimations of the mollusccontribution to carbon and carbonate fluxes are com-plex as the shell offers habitat for other organisms.The total metabolic rate (total respiration rate andtotal calcification rate) then results from the gastro-pod activity itself (respiration, shell calcification,shell dissolution), and from shell community, whoseactivity also might vary between night and day.Epibiont primary production should decrease DICconcentration during the day, resulting in underesti-mates of trochus respiration for that time period. Inthe same way, epibiont respiration at night shouldinflate DIC levels and result in overestimates of gas-tropod respiration. The same is true with CaCO3 dis-solution from epibionts, which would lead to anunderestimation of trochus calcification, while calci-fication of calcareous algae would lead to overesti-mation of CaCO3 fluxes during the day. To correcttrochus fluxes from epi- and endobiont influence,wax-sealed shell production vs. irradiance curvesand calcification vs. irradiance curves were estab-lished (i.e. the Michaelis & Menten model) accordingto the following equation (Vermaat 2009):
(3)
where P is the shell community production or calcifi-cation rate (μmol C or CaCO3 h−1), Vm is the maximal
Gv
t= − ×
×ΔΔTA
2
Rv
tG= − × −Δ
ΔDIC
PV IK I
R= ×+
−m
m
170
Lorrain et al.: Variability in Tectus niloticus metabolism
production or calcification rate (μmol C or CaCO3
h−1), I is the in situ PAR irradiance (μmol photons m−2
s−1), Km is the half saturation constant (μmol photonsm−2 s−1), and R is the respiration rate (μmol C h−1) orcalcification rate in the dark (i.e. dissolution, μmolCaCO3 h–1). Total fluxes were then corrected by sub-tracting the shell community fluxes to estimate trochusrespiration and calcification rates at any irradiance.
The respiratory quotient was calculated as RQ =|ΔCO2 / ΔO2| by functional regressions in which theslope of the RQ is the ratio of 2 standard deviations(SD): RQ = SD production CO2 / SD consumption O2.
Statistical treatment
To determine RQ, slopes of the functional regres-sions were compared and tested against the nullhypothesis of isometry (b = 1) using a Z-test (Scherrer1984). Statistical analyses were performed usingthe R statistical software (R Development Core Team2013). An information−theoretic approach (Burnhamet al. 2011) was taken to investigate the effects of ourexperimental treatments on the 3 variables measuredin the field (respiration, calcification, ammonifica-tion). The experiment featured 3 fixed factors with 2levels each: season (warm, cool), time (day, night),and trochus individual size (small, large). We did notinclude a random effect for the ex perimental cham-ber as only 4 chambers were used, which is less thanthe minimum number recommended for the inclu-sion of a random effect (Bolker et al. 2009). A set ofcandidate models was defined using all possiblecombinations of factors and 2-way interactions(Table 1). Generalised linear models (GLMs) were
fitted for each response variable on all candidatemodels. Normality in the model residuals was veri-fied using Q–Q plots and histograms of the residuals.Model selection for fixed terms was performed byselecting the candidate model with the lowest cor-rected Akaike Information Criterion (AICc, a versionof AIC corrected for small sample size; Symonds &Moussalli 2011) with the R package ‘AICcmodavg’(Mazerolle 2013). AICc results are presented for thetop 3 ranked models. Unless otherwise specified, para -meter estimates and statistical sig nificance of modelterms are presented for the top-ranked model only.
RESULTS
Environmental parameters
As recorded by the in situ multiparameter probe atthe Tabou reef station, average bottom temperatureswere 27.1 ± 0.2 and 22.3 ± 0.3°C for the warm andcool season, respectively (i.e. a 4.8°C differencebetween February and August). Maximum tempera-ture variation between night and day was 0.4°C inthe warm season vs. 0.6°C in the cool season. Oxy-gen measurements from the in situ multiparameterprobes showed no clear diel pattern, but in generallower values were observed at night (5.7 mg l−1)while higher values (7.5 mg l−1) were observed at thehighest irradiances, between 10:00 and 13:00 h. Tem-perature data were available at the Amédée reeffrom April 2012 to April 2013, and showed good cor-respondence between temperatures at Tabou andAmédée reefs on 23 and 24 August 2012 (22.3 ± 0.3vs. 21.6 ± 0.4°C for Tabou and Amédée reefs, respec-
171
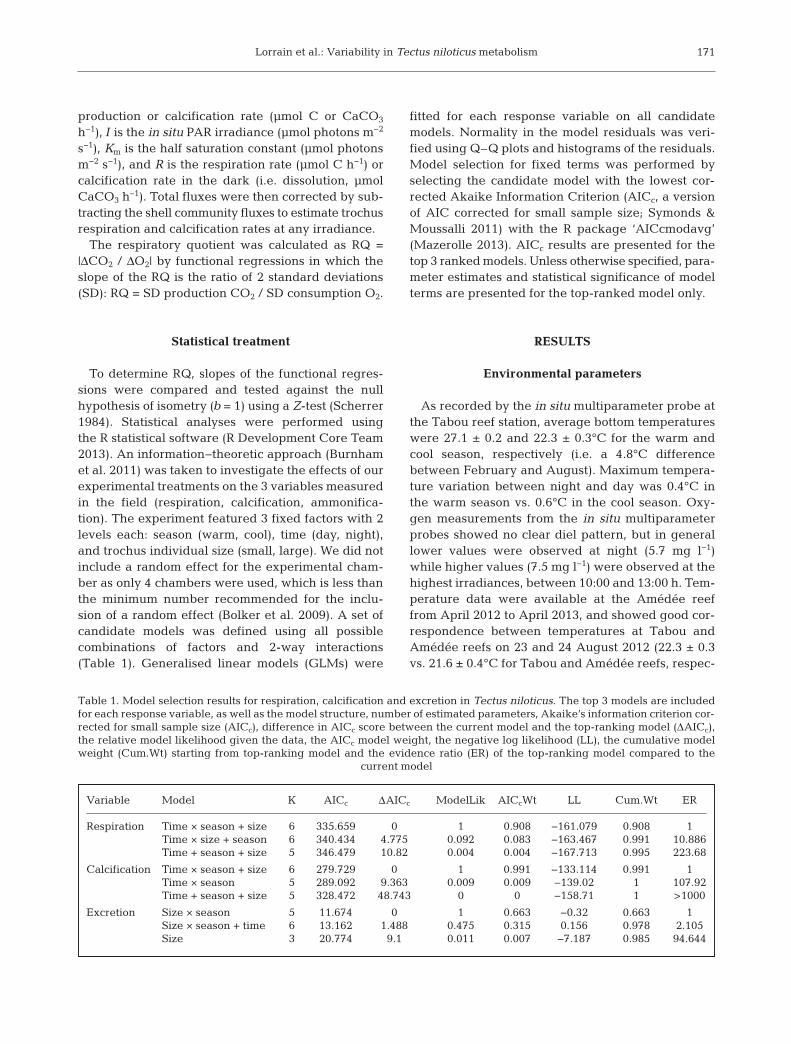
Variable Model K AICc ΔAICc ModelLik AICcWt LL Cum.Wt ER
Respiration Time × season + size 6 335.659 0 1 0.908 −161.079 0.908 1Time × size + season 6 340.434 4.775 0.092 0.083 −163.467 0.991 10.886Time + season + size 5 346.479 10.82 0.004 0.004 −167.713 0.995 223.68
Calcification Time × season + size 6 279.729 0 1 0.991 −133.114 0.991 1Time × season 5 289.092 9.363 0.009 0.009 −139.02 1 107.92Time + season + size 5 328.472 48.743 0 0 −158.71 1 >1000
Excretion Size × season 5 11.674 0 1 0.663 −0.32 0.663 1Size × season + time 6 13.162 1.488 0.475 0.315 0.156 0.978 2.105Size 3 20.774 9.1 0.011 0.007 −7.187 0.985 94.644
Table 1. Model selection results for respiration, calcification and excretion in Tectus niloticus. The top 3 models are includedfor each response variable, as well as the model structure, number of estimated parameters, Akaike’s information criterion cor-rected for small sample size (AICc), difference in AICc score between the current model and the top-ranking model (ΔAICc),the relative model likelihood given the data, the AICc model weight, the negative log likelihood (LL), the cumulative modelweight (Cum.Wt) starting from top-ranking model and the evidence ratio (ER) of the top-ranking model compared to the
current model

Aquat Biol 23: 167–182, 2015
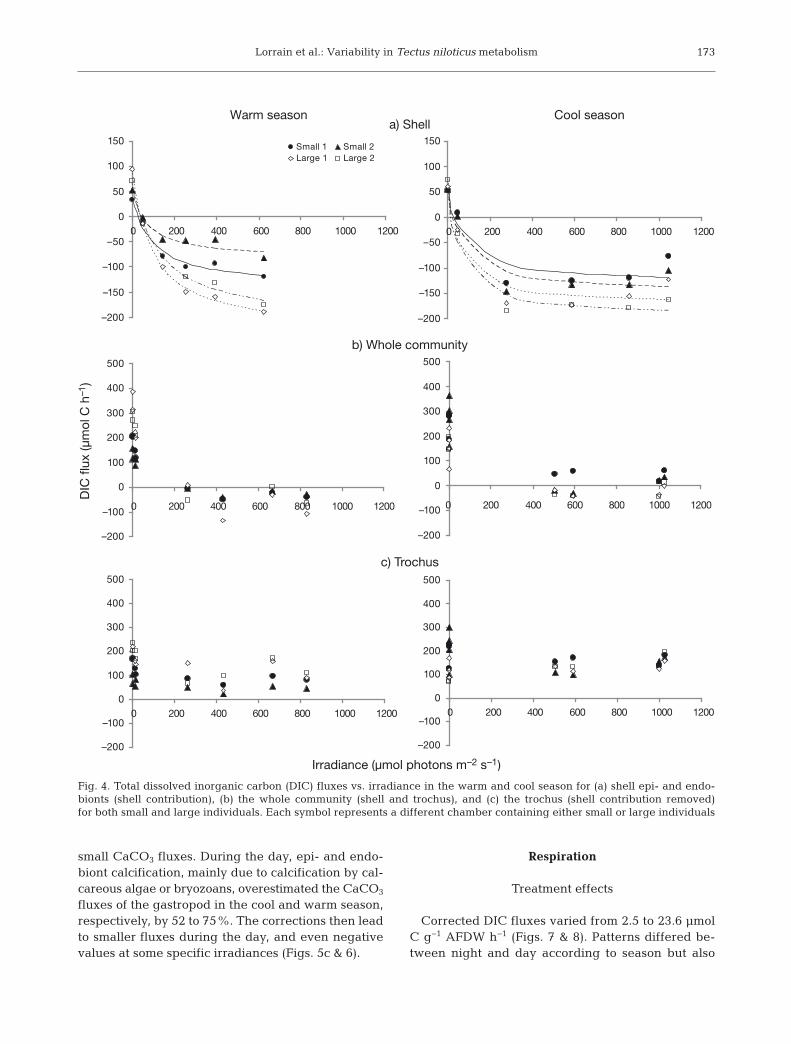
tively) (Fig. 3). Fig. 3 also shows that our samplingperiods were representative of average temperaturesfound during the cool and warm seasons. Measuredbottom seawater irradiances were higher in the coolseason than in the warm season (1099 vs. 839 μmolphotons m−2 s−1 at 12:00 h), mainly due to meteoro-logical conditions (i.e. sunniest during the cool sea-son ex periment), but also to the shallower depth ofthe ex periment in the cool season (3 vs. 7 m).
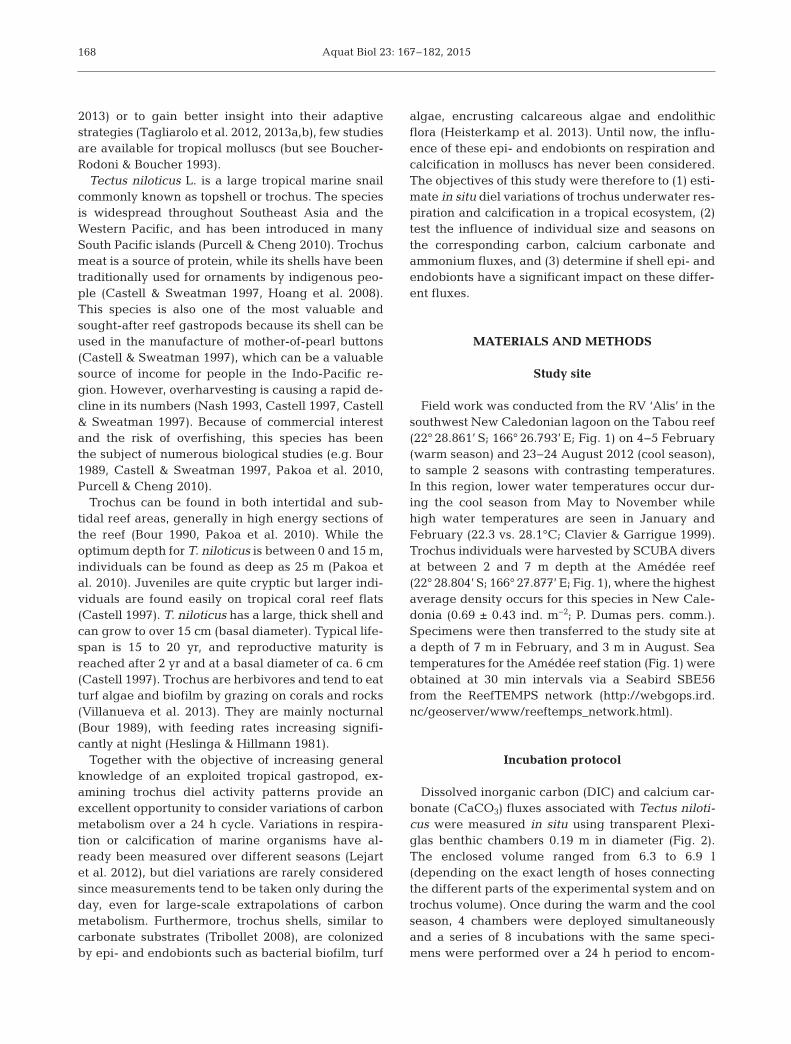
Shell community contribution
Shell community fluxes were assessed in both sea-sons for DIC and CaCO3 but only in August 2012 forammonium. A clear decrease in DIC fluxes andincrease in CaCO3 fluxes was observed with increas-ing irradiance (Figs. 4a & 5a). To obtain DIC andCaCO3 fluxes from trochus alone (Figs. 4c & 5c), theshell community contribution was subtracted fromthe total flux at each irradiance (Figs. 4b & 5b). Shellcommunity ammonium fluxes were very low, anddisplayed a non-consistent relationship with irradi-ance. The average value of −0.04 μmol NH4
+ h−1 wasused to correct all ammonium fluxes from the influ-ence of the shell, both in February and in August.
Fig. 4a shows shell community positive DIC fluxesat night (up to 100 μmol C h−1) due to epi- and endo-biont respiration, and increasing CO2 consumption(max. negative flux ca. −200 μmol C h−1) with irradi-ance, reflecting photosynthesis by epibionts. Fig. 4b
shows total respiration rates (i.e. uncorrected fromshell contribution), revealing contrasting night andday patterns with positive fluxes at night (up to400 μmol C h−1), and negative fluxes (−150 μmol Ch−1) during the day, reflecting epibiont photosynthe-sis. At night, respiration from epi- and endobiontscontributed to ~30% of the whole community respi-ration flux in both seasons. Shell contribution washigher for large than for small individuals (44 and39% vs. 23 and 26% in the cool and warm seasons,respectively). Conversely, during the day, primaryproduction of calcareous algae and other primaryproducers on the shell fully counterbalanced CO2
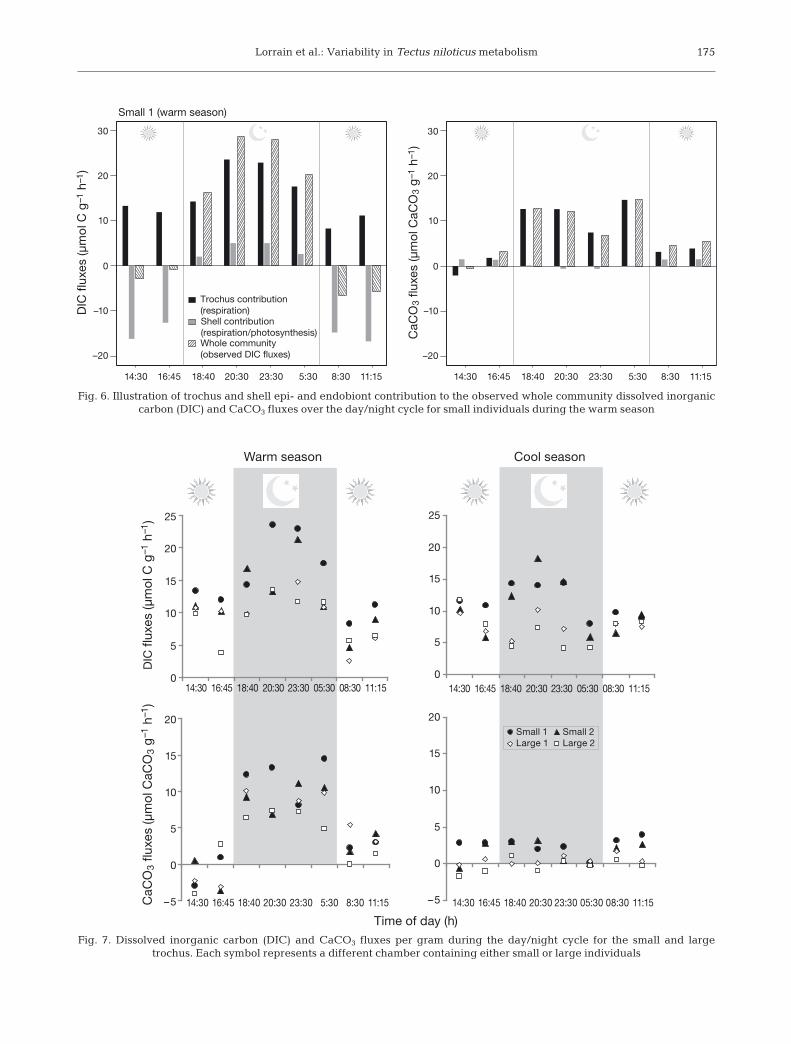
production from trochus respiration, strongly under-estimating its respiration (Fig. 4b,c). As an examplefor small individuals in the warm season, Fig. 6 illus-trates the diel pattern of the respective contributionof the shell community and the trochus itself toobserved DIC fluxes. The shell community contribu-tion is particularly strong during the day.
For calcification, shell carbonate dissolution (up to−15 μmol CaCO3 h−1) was observed at night, andCaCO3 fluxes then increased with irradiance (up to20 μmol CaCO3 h−1; Fig. 5a). Whole individual ratesvaried from −40 to 160 μmol CaCO3 h−1 (Fig. 5b).Shell contribution to CaCO3 fluxes was minor forhigh fluxes; i.e. at night in the warm season (6%) butmore important in the cool season for lower fluxes(100%). Fig. 6 illustrates that the shell contribution isparticularly minor at night when most of the calcifi-cation occurs, but more important during the day for
172
20
21
22
23
24
25
26
27
28
04/12 05/12 06/12 07/12 08/12 09/12 10/12 11/12 12/12 01/13 02/13 03/13 04/13
COOL SEASON WARM SEASONWARM SEASON
Tem
per
atur
e (°
C)
Date (mm/yy)
Fig. 3. Temperature at the Amédée reef station from April 2012 to April 2013. Black arrow: August cruise during the cool season.White arrow: period of the warm season cruise (although it was actually done in February of the previous year i.e. Feb 2012)
Lorrain et al.: Variability in Tectus niloticus metabolism
small CaCO3 fluxes. During the day, epi- and endo-biont calcification, mainly due to calcification by cal-careous algae or bryozoans, overestimated the CaCO3
fluxes of the gastropod in the cool and warm season,respectively, by 52 to 75%. The corrections then leadto smaller fluxes during the day, and even negativevalues at some specific irradiances (Figs. 5c & 6).
Respiration
Treatment effects
Corrected DIC fluxes varied from 2.5 to 23.6 μmolC g−1 AFDW h−1 (Figs. 7 & 8). Patterns differed be -tween night and day according to season but also
173
–200
–150
–100
–50
0
50
100
150
0 200 400 600 800 1000 1200
Small 1 Small 2Large 1 Large 2
–200
–100
0
100
200
300
400
500
0 200 400 600 800 1000 1200
–200
–100
0
100
200
300
400
500
0 200 400 600 800 1000 1200
–200
–150
–100
–50
0
50
100
150
0 200 400 600 800 1000 1200
–200
–100
0
100
200
300
400
500
0 200 400 600 800 1000 1200
–200
–100
0
100
200
300
400
500
0 200 400 600 800 1000 1200
Warm season Cool season
DIC
flu
x (µ
mol
C h
–1)
Irradiance (µmol photons m–2 s–1)
a) Shell
b) Whole community
c) Trochus
Fig. 4. Total dissolved inorganic carbon (DIC) fluxes vs. irradiance in the warm and cool season for (a) shell epi- and endo-bionts (shell contribution), (b) the whole community (shell and trochus), and (c) the trochus (shell contribution removed)for both small and large individuals. Each symbol represents a different chamber containing either small or large individuals

Aquat Biol 23: 167–182, 2015
varied with the size of the individuals. Night andday respiration rates tended to be more variable inthe warm season, showing a more pronounced dieldifference (14.8 ± 4.4 vs. 8.3 ± 2.1 μmol C g−1
AFDW h−1 for night and day, respectively) com-pared to the cool season (9.1 ± 3.1 vs. 8.8 ± 1.2 μmol
C g−1 AFDW h−1 for night and day, respectively). Inaddition, small individuals tended to have higherrespiration rates than large ones especially duringthe night (17.6 vs. 9.9 and 12.7 vs. 8.6 μmol C g−1
AFDW h−1 for the warm and cool season, respec-tively; Fig. 8).
174
–20
–10
0
10
20
30
0 200 400 600 800 1000 1200
–20
–10
0
10
20
30
0 200 400 600 800 1000 1200
–80
–50
–20
10
40
70
100
130
160
190
0 200 400 600 800 1000 1200
–80
–50
–20
10
40
70
100
130
160
190
0 200 400 600 800 1000 1200
–80
–50
–20
10
40
70
100
130
160
190
0 200 400 600 800 1000 1200
–80
–50
–20
10
40
70
100
130
160
190
0 200 400 600 800 1000 1200
CaC
O3
flux
(µm
ol C
aCO
3 h–
1)
Warm season Cool season
Small 1 Small 2Large 1 Large 2
a) Shell
b) Whole community
c) Trochus
Irradiance (µmol photons m–2 s–1)
Fig. 5. Total CaCO3 fluxes vs. irradiance in the warm and cool season for (a) shell epi- and endobionts (shell contribution), (b)the whole community (shell and trochus), and (c) the trochus (shell contribution removed) for both small and large individuals.
Each symbol represents a different chamber containing either small or large individuals
Lorrain et al.: Variability in Tectus niloticus metabolism 175
Small 1 (warm season)
Trochus contribution (respiration) Shell contribution (respiration/photosynthesis) Whole community (observed DIC fluxes)
CaC
O3
fluxe
s (µ
mol
CaC
O3
g–1
h–1
)
DIC
flu
xes
(µm
ol C
g–1
h–1
)
14:30 16:45 18:40 20:30 23:30 5:30 8:30 11:1514:30 16:45 18:40 20:30 23:30 5:30 8:30 11:15
30
20
10
0
–10
–20
30
20
10
0
–10
–20
Fig. 6. Illustration of trochus and shell epi- and endobiont contribution to the observed whole community dissolved inorganic carbon (DIC) and CaCO3 fluxes over the day/night cycle for small individuals during the warm season
0
5
10
15
20
25
14:30 16:45 18:40 20:30 23:30 05:30 08:30 11:15
–5
0
5
10
15
20
14:30 16:45 18:40 20:30 23:30 5:30 8:30 11:15
0
5
10
15
20
25
–5
0
5
10
15
20Small 1 Small 2Large 1 Large 2
Warm season
Time of day (h)
Cool season
14:30 16:45 18:40 20:30 23:30 05:30 08:30 11:15
14:30 16:45 18:40 20:30 23:30 05:30 08:30 11:15CaC
O3
fluxe
s (µ
mol
CaC
O3
g–1
h–1
)D
IC fl
uxes
(µm
ol C
g–1
h–1
)
Fig. 7. Dissolved inorganic carbon (DIC) and CaCO3 fluxes per gram during the day/night cycle for the small and large trochus. Each symbol represents a different chamber containing either small or large individuals

Aquat Biol 23: 167–182, 2015
The top-ranked AICc candidate model predictedrespiration as a function of time, season and size, withan interaction between season and time (Table 1).The second-ranked model had a relatively highAkaike weight and indicated an interaction betweentime and size. There is thus high support for an inter-action with time, but the response data does not con-tain enough information to distinguish with high certainty whether this interaction is with size or sea-son—though support is higher for the former, with anAIC evidence ratio of 10.89 (that is, the first model isca. 10 times more likely than the second). Focusingon the top-ranked model, small size had a positiveeffect on respiratory rates (4.212, p < 0.0001), andthere was a positive interaction between night andthe warm season (6.046, p = 0.0005; Table 2).
Respiratory quotients
The RQ ranged between 0.6 and 0.7 for the cooland warm seasons, respectively. These values aresignificantly different from 1, but the 2 slopes are notsignificantly different (Z-test, p < 0.05) and the result-ing RQ combining both seasons is 0.7. Interestingly,calculating a RQ without removing the shell commu-nity influence would have led to more elevated val-ues much closer to 1 (0.9 vs. 0.7 for the warm and coolseasons, respectively).
Calcification
Shell CaCO3 fluxes were generally small with dissolution/calcification rates ranging from −4.0 to14.5 μmol CaCO3 g−1 AFDW h−1 (Fig. 7). Most of the
176
Warm Cool Warm Cool
SmallLarge
–5
0
5
10
15
20
Warm Cool Warm Cool
–5
0
5
10
15
Cal
cific
atio
n (µ
mol
CaC
O3
g–1
h–1
)
Res
pira
tion
(µm
ol C
g–1
h–1
)
Fig. 8. Day and night respiration and calcification rates for small (dark grey) and large trochus (light grey) during both seasons(warm and cool). Boxplots show the median (middle line) and the interquartile range (IQR, box). The whiskers extend to theminimum and maximum observations, or to a distance equal to 1.5 x IQR from the lower or upper hinges of the box, whichever
is closer. Observations are shown as outlier points if they occur beyond the whiskers
Estimate SE t p-value
Intercept 6.7096 0.9105 7.3695 <0.0001Time (night) 0.2413 1.1497 0.2098 0.8345Season (warm) −0.4125 1.1497 −0.3588 0.7211Size (small) 4.2121 0.8198 5.1378 <0.0001Time:season 6.0459 1.6396 3.6873 0.0005(night:warm)
Table 2. Results from generalised linear model (GLM) respi-ration rates; intercept (‘baseline’) levels were time: day,
season: cool, size: large
Estimate SE t p-value
Intercept 0.3194 0.5841 0.5469 0.5865Time (night) −0.2582 0.7376 −0.3501 0.7275Season (warm) −0.6327 0.7376 −0.8578 0.3945Size (small) 1.8188 0.5259 3.4581 0.001Time:season 8.9695 1.0519 8.527 <0.0001(night:warm)
Table 3. Results from generalised linear model (GLM) cal -cification rates; intercept (‘baseline’) levels were time: day,
season: cool, size: large

Lorrain et al.: Variability in Tectus niloticus metabolism
calcification occurred at night during the warm sea-son for both small and large trochus (10.7 and7.8 μmol CaCO3 g−1 AFDW h−1 for small and largetrochus, respectively; Figs. 7 & 8). Some dissolutionwas observed at 14:30 and 16:45 h during the warmseason, and to a lesser extent during the cool seasonindependent of the hour.
The top-ranked AICc GLM model predicted calcifi-cation rates as a function of time, season, and size withan interaction between time and season (Table 1).This model had a much greater probability than theother candidate models (about 100 times more prob-able than the second-highest ranked model; AIC evi-dence ratio = 107.9). For this top-ranked model, timeand season had little effect, but their interaction washighly significant with a positive effect of 8.9695 (p <0.0001) for calcification rates at night during thewarm season (Table 3). Size had a small effect, withsmall individuals having slightly higher calcificationrates (1.8188, p = 0.0010). The value for the interceptwas not statistically significant (p = 0.5865), meaningthat large individuals in the day during the cool sea-son had calcification rates not significantly differentfrom 0.
Ammonium excretion
Ammonium fluxes (after subtracting the shell com-munity influence) varied from 0 to 0.6 and from 0 to1.2 μmol NH4
+ g−1 AFDW h−1 for small and largetrochus, respectively. The largest ranges were ob -served during the warm season for the 2 large indi-viduals (0.0 to 1.2 μmol NH4
+ g−1 AFDW h−1). Bothsmall and large individuals exhibited a much lowerrange in ammonium fluxes during the cool season(0.0 to 0.6 μmol NH4
+ g−1 AFDW h−1; Table 4). TheAICc top-ranking model for ammonium excretion usedsize, season and their inter action as model terms(Table 1). The second top-performing model also hada high probability but will not be discussed here. For
the top-ranking model, excretion rates in the warmseason were higher (0.2669, p = 0.0039) but the inter -action be tween size and season was such that smallindi viduals had significantly lower excretion ratesthan large individuals in the warm season (estimateof the interaction = −0.4719, p = 0.0004; Table 5).Overall, estimated effects were small, with the lowerbound of the 95% confidence interval close to zerofor all terms.
DISCUSSION
Shell community contribution to carbon metabolism in the trochus
One of the most striking results of our study was thelarge influence of shell epi- and endobionts on ob-served CO2 and (to a lesser extent) CaCO3 fluxes. Be-cause of epibiotic primary production, uncorrectedDIC fluxes strongly overestimated respiration of thegastropod at night, by up to 44% for the large individ-uals in the cool season. Conversely, gastropod respi-ration was underestimated during the day. This hadan impact on the observed diel variations, which weremuch more pronounced for total fluxes compared tocorrected ones (e.g. Fig. 4b,c). The influence of theshell community on CaCO3 fluxes was less important.When calcification was the highest for the trochus (atnight during the warm season), there was only a 6%underestimation of the fluxes. The shell contributionto CaCO3 is therefore only substantial when trochusfluxes are small; i.e. during the day in both seasons,and at night in the cool season. This uncertainty mightbe compounded by the added difficulty of determiningsmall carbonate fluxes accurately via the alkalinityanomaly technique.
To our knowledge, our study is the first to discrimi-nate these fluxes, and we have shown that their con-tribution is not negligible. Future studies on organ-isms bearing epi- and endobionts on their shells (i.e.gastropods, bivalves) should account for the influ-
177
Estimate SE t p-value
Intercept 0.1913 0.0628 3.0459 0.0034Size (small) 0.1019 0.0888 1.1473 0.2558Season (warm) 0.2669 0.0888 3.0054 0.0039Size:season −0.4719 0.1256 −3.7576 0.0004(small:warm)
Table 5. Results from generalised linear model (GLM) ex -cretion rates; intercept (‘baseline’) levels were time: day,
season: cool, size: large
Ammonium excretion ratesSmall Large
Warm season Day 0.1 ± 0.1 0.4 ± 0.3Warm season Night 0.1 ± 0.1 0.5 ± 0.5Cool season Day 0.2 ± 0.2 0.2 ± 0.1Cool season Night 0.4 ± 0.2 0.2 ± 0.1
Table 4. Average night and day ammonium fluxes (μmolNH4
+ g−1 AFDW h−1, ± SD, n = 8 for each value) for small and large Tectus niloticus during the warm and cool season

Aquat Biol 23: 167–182, 2015
ence of the shell community on measured carbon andCaCO3 fluxes. However, these communities were notexplored in detail during our study. The taxonomiccomposition and quantity of these organisms is prob-ably highly variable between trochus individuals,seasons or localities (Wernberg et al. 2010), and as -sessing their diversity and structure would help tounderstand their role.
Respiration
Few studies have been conducted on tropical gas-tropod respiration rates, and most of them measuredoxygen fluxes without removing the shell community influence (e.g. Baldwin et al. 2007) or by manuallycleaning the shells from epibionts (e.g. Baums et al.2003). On average, corrected oxygen fluxes in ourstudy varied from 8 to 19 μmol O2 g−1 AFDW h−1
(ranging from 3 to 29 μmol O2 g−1 AFDW h−1), whichis lower than what was found for small gastropodssuch as the corallivorous gastropod Coralliophilaabbreviata (27 to 37 μmol O2 g−1 AFDW h−1; Baums etal. 2003) or Nerita articulata (40 to 57 μmol O2 g−1
AFDW h−1; Houlihan 1979). This disparity is probablydue to the large size differences between gastropodsin these 2 studies (1 to 3 cm) compared to trochus(5 to 12 cm), as we expect higher respiration rates forsmall individuals (see below). More similar respira-tion rates were found for the similarly sized gas -tropod Haliotis asinina (a tropical abalone), at 2 to10 μmol O2 g−1 AFDW h−1 for resting and crawlingindividuals, respectively (Baldwin et al. 2007). Averagecarbon fluxes measured in our study (5 to 18 μmol Cg−1 AFDW h−1) are also similar to those previouslypublished on temperate gastropods such as Patellavulgata (7 to 17 μmol C g−1 AFDW h−1; Tagliarolo etal. 2013b) and Crepidula fornicata (2 to 44 μmol C g−1
AFDW h−1; Martin et al. 2006).Our study demonstrates significant diel and sea-
sonal variations in CO2 production. There was also apronounced size effect: small trochus had higher res-piration rates than larger individuals at night (Fig. 8),as previously reported for other mollusc species, andthis size effect was independent of the time of the dayor the season (e.g. Baums et al. 2003, Martin et al.2006). This is not sur prising since body size is one ofthe most im portant factors affecting metabolism.Young animals respire at higher rates per unit bodymass since their higher growth rates increase meta-bolic demands (Marsden et al. 2012).
Respiration data also highlighted nocturnal behav-iour in trochus, with enhanced respiration at night in
the warm season (February). During the cool season,small trochus apparently released more CO2 at nightthan during the day (12.7 vs. 8.6 μmol C g−1 AFDWh−1; Fig. 8) although we could not distinguish with fullcertainty whether the interaction was between timeand season, or time and size. This result is in agree-ment with previous studies that observed nocturnalbehaviour in this species (Bour 1989). The enhancedactivity at night would then increase oxygen require-ments, and subsequently, CO2 release. In abalone forexample, crawling individuals have higher respirationrates than resting ones (Baldwin et al. 2007). No de-tailed study on trochus activity rhythms is available tointerpret the difference we observed between sea-sons, which could be related to differences in foragingstrategies or movement patterns. Temperature varia-tions between night and day are small in the lagoon(between 0.4 and 0.6°C in this study) and would prob-ably not generate the observed trend. Nevertheless,respiration of benthic molluscs is generally only stud-ied during daytime for short periods of time. Ourstudy shows the importance of also considering night-time respiration rates, in particular when extrapola-tions of carbon fluxes at large scales are required.
Seasonal variation in respiration rates was ob -served as well, with increased respiration rates dur-ing the warm season, but only at night (11.7 vs.5.4 μmol C g−1 AFDW h−1 for large individuals and17.6 vs. 12.7 μmol C g−1 AFDW h−1 for small individ-uals). These variations are comparable to what hasbeen found in temperate environments such as theBay of Brest, where a 2-fold increase in respirationrates was observed between seasons for the slipperlimpet C. fornicata (Martin et al. 2006). Such differ-ences were expected to be lower as smaller tempera-ture differences between seasons (4.8°C) occur in thesouthwest lagoon of New Caledonia compared to the~8°C seasonal variations in the Bay of Brest (France).Temperature is arguably the most important environ-mental variable driving the physiological rates ofectotherms (Lewis 1971, Hochachka & Somero 2002),however other factors can also explain increases inrespiration rates, such as enhanced food availabilityand timing of the reproduction period (Santini et al.2000, Marsden et al. 2012). For instance, the repro-ductive period for trochus lasts from October to Aprilin New Caledonia (Bour et al. 1982) and could gener-ate higher respiration rates during the warm season.Alternatively, benthic production and micro- andmacroflora biomasses (on which trochus feed) arehigher in the warm season (Garrigue 1991, Clavier &Garrigue 1999), which could also explain the sea-sonal signal observed here.
178

Lorrain et al.: Variability in Tectus niloticus metabolism
Respiratory quotient
The RQ is often used to estimate CO2 released bymollusc respiration from O2 consumption (Hawkins &Bayne 1985). Indeed, measurements of CO2 from thepH/alkalinity method and DIC variations are moredifficult to conduct than continuous oxygen measure-ments. The average RQ of trochus was 0.7. Usually,RQs are related to the catabolic substrate used in res-piration. Catabolism of proteins and lipids theoreti-cally results in RQ values of 0.8 and 0.7, respectively(Richardson 1929), which would indicate that lipidsare used as metabolic substrates. Values around 0.7have previously been reported for other tropical mol-luscs such as the cephalopod Nautilus macromphalusin New Caledonia (Boucher-Rodoni & Boucher 1993).Such low values are mainly representative of starv-ing animals that have to use their lipid reserves(Emerson & Duerr 1967). However, these theoreticalvalues apply to tissues and not necessarily to wholeorganisms (Mayzaud et al. 2005).
Furthermore, it has been suggested that for calcify-ing organisms, CO2 produced by respiration mightbe re-routed into the shell for calcification, whichcould artificially lower the numerator in the RQ for-mula (Tagliarolo et al. 2013b). This CO2 can not bemeasured by our method, as it is directly incorpo-rated within the shell during calcification via theextrapallial fluid. The actual RQ of small trochuscould then be higher than the measured value of 0.7.Interestingly, uncorrected RQs (including fluxes fromthe shell) would have led to much higher—and typi-cal—RQ values close to 0.9 (i.e. catabolism from pro-teins), showing again the need to consider epi- andendobiont contributions.
Calcification
Calcification rates of trochus varied on averagefrom 0 to 14.5 μmol CaCO3 g−1 AFDW h−1 from thecool to the warm season, respectively. In a few cases,we also observed dissolution (from −0.1 to −4 μmolCaCO3 g−1 AFDW h−1), with the highest values occur-ring during the day in the warm season, but we haveno explanation for this pattern. Similar studies oftemperate gastropods found calcification rates be -tween 0 and 44 μmol CaCO3 g−1 AFDW h−1 for C. for-nicata (Martin et al. 2006), and between 1 and 8 μmolCaCO3 g−1 AFDW h−1 for P. vulgata (Tagliarolo et al.2013b). Our values are therefore in agreement withthese studies, though we might have expected highercalcification rates since tropical species tend to have
thicker shells (Vermeij 1978). Our study demon-strates season, size and diel variations in CaCO3 pro-duction. Small individuals precipitated more CaCO3
than large specimens, and CaCO3 production rateswere higher in the warm season and at night. Theimportance of age and temperature is well docu-mented in mollusc growth (Rhoads & Lutz 1980). Thedecreasing growth pattern with age and during thecool season is in agreement with shell growth for thistropical species, as well as for many others species(Bour et al. 1982, Appeldoorn 1988).
The increased CaCO3 fluxes at night during peri-ods of intense calcification (i.e. the warm season)have been less documented in the literature and areparticularly interesting. It is well known that pH de -creases at night, favouring CaCO3 dissolution (Shawet al. 2012). Therefore environmental pH variationsat night can not, on their own, explain the higher cal-cification rates observed here. Enhanced calcifica-tion at night is then most probably biologicallyinduced, perhaps resulting from the nocturnal activ-ity of trochus individuals (i.e. foraging activity). Thisresult is of particular interest for sclerochronologistsworking on growth rhythms and proxy calibration(Schöne & Gillikin 2013). Sclerochronology is analo-gous to dendrochronology for trees, that is, it usesinformation provided by the skeleton of aquaticorganisms to reconstruct records of environmentaland climatic change through space and time, basedon growth patterns observed at various temporalscales (see Gröcke & Gillikin 2008). As an example,Lazareth et al. (2007) explained night and day differ-ences in the magnesium content (a seawater temper-ature proxy) in the shell of the gastropod Concho -lepas concholepas by the nocturnal feeding activityof the species. Schwartzmann et al. (2011) also pro-vided an instructive example of the benefits of cou-pling growth rate and animal behaviour studies withthe giant clam Hippopus hippopus in New Caledo-nia. Better proxy calibration between observed pat-terns in shells and environmental parameters such astemperature could be achieved by understanding theanimal’s daily growth patterns.
Ammonium excretion
In this study, we measured ammonium fluxes tocorrect alkalinity and properly assess trochus calci-fication fluxes. These ammonium fluxes were minor(0 to 1.2 μmol NH4
+ g−1 AFDW h−1), as alreadyreported for limpets (0.5 to 2.3 μmol NH4
+ g−1 AFDWh−1; Martin et al. 2006). Furthermore, estimated size
179

Aquat Biol 23: 167–182, 2015
or season effects for these fluxes were small. Still,from our analysis it appears that excretion is slightlyhigher in the warm compared to the cool seasonwhen both calcification and respiration rates areat the highest. Martin et al. (2006) found no corre -lation between the seasonal cycle of ammoniumexcretion and respiration. More experiments areneeded to properly assess excretion patterns fortrochus individuals.
CONCLUSIONS
Corrected respiration and calcification rates fromour study revealed (1) a nocturnal activity reflectedin higher respiration and calcification rates ofTectus niloticus during the warm season (February)for both small and large individuals, (2) higher res-piration and calcification rates for small individuals,and (3) a significant contribution of shell epi- andendobionts to the fluxes. Ignoring these variationscould severely bias estimates of the contribution ofgastropods to carbon and CaCO3 fluxes. Theseresults are not only relevant to our fundamentalknowledge of tropical gastropods (which is neces-sary to predict how, for instance, this group will beaffected by climate change), but also provide impor-tant information for sclerochronologists working onshell proxy calibration. Indeed, knowledge of respi-ration and calcification circadian rhythms on a dailybasis is important for a mechanistic understandingof proxy incorporation. Studies of activity rhythmsover a 24 h cycle on small and large trochus in bothseasons would be particularly helpful to substantiateour results. Finally, examining respiration and calci-fication rates for the whole mollusc community (ani-mal + shell epi- and endobionts) would be benefi-cial, as long as the study aimed to quantify rates atthe ecosystem scale. If the goal is to study metabo-lism at the individual scale, however, further experi-ments on epi- and endobiont contribution would berequired, including precise quantification of the different species involved.
Many field studies have measured metabolic ratesof individuals in the field over small time periods,ignored the contribution of the shell community, andassumed that these rates are representative of thepopulation over the year. Our work has shown thatmetabolic rates extrapolated from such measure-ments are likely to be biased, and that variablesknown to affect metabolism, such as time of day, sea-son, individual size and epi- and endobiont activity,should not be ignored.
Acknowledgements. This study was supported by IRD andthe INSU EC2CO PNEC and CYTRIX IBANOE program. Wethank the crew of the RV ‘ALIS’ for their help during the two2012 cruises. We are grateful to ReefTEMPS (Réseau de cap-teurs de température dans le domaine côtier), the GOPS andD. Varillon from US191 IMAGO and IRD Nouméa for seasurface temperature at the Amédée reef. Finally, we thankthe LAMA laboratory and P. Gerard for ammonium and ni -trates analyses, P. Dumas for helpful discussions on trochus,and P. Douillet for providing the map through the softwareMapCamelia.
LITERATURE CITED
Appeldoorn RS (1988) Age determination, growth, mortalityand age of first reproduction in adult queen conch,Strombus gigas L., off Puerto Rico. Fish Res 6: 363−378
Baldwin J, Elias JP, Wells RMG, Donovan DA (2007) Energymetabolism in the tropical abalone, Haliotis asininaLinné: comparisons with temperate abalone species.J Exp Mar Biol Ecol 342: 213−225
Baums IB, Miller MW, Szmant AM (2003) Ecology of a coral-livorous gastropod, Coralliophila abbreviata, on twoscleractinian hosts. II. Feeding, respiration and growth.Mar Biol 142: 1093−1101
Bishop SH, Ellis LL, Burcham JM (1983) Amino acid metab-olism in molluscs. In: Hochachka PW (ed) The Mollusca: metabolic biochemistry and molecular biomechanics.Academic Press, New York, NY, p 243−327
Bolker BM, Brooks ME, Clark CJ, Geange SW, Poulsen JR,Stevens MHH, White JSS (2009) Generalized linearmixed models: a practical guide for ecology and evolu-tion. Trends Ecol Evol 24: 127−135
Boucher G, Clavier J (1995) Carbon flux at the water-sedi-ment interface of tropical lagoons. International work-shop on carbon cycling and coral reef metabolism.Miyakojima, 16−25 Oct 1995, p 76−81. http://epic.awi.de/29183/
Boucher-Rodoni R, Boucher G (1993) Respiratory quotientand calcification of Nautilus macromphalus (Cephalo -poda: Nautiloidea). Mar Biol 117: 629−633
Bour W (1989) Biologie, écologie, exploitation et gestionrationnelle des trocas (Trochus niloticus L.) de NouvelleCalédonie. PhD dissertation, Université de Montpellier
Bour W (1990) The fishery resources of Pacific Island coun-tries. Part 3. Trochus. FAO Fish Tech Pap No. 272.3,Noumeau, New Caledonia
Bour W, Gohin F, Bouchet P (1982) Croissance et mortaliténaturelle des trocas (Trochus niloticus L.) de Nouvelle-Calédonie (Mollusca, Gastropoda). Haliotis 12: 71−90
Burnham KP, Anderson DR, Huyvaert KP (2011) AIC modelselection and multimodel inference in behavioral eco -logy: some background, observations, and comparisons.Behav Ecol Sociobiol 65: 23−35
Castell LL (1997) Population studies of juvenile Trochusniloticus on a reef flat on the north-eastern Queenslandcoast, Australia. Mar Freshw Res 48: 211−217
Castell LL, Sweatman HPA (1997) Predator–prey inter -actions among some intertidal gastropods on the GreatBarrier Reef. J Zool 241: 145−159
Chauvaud L, Thompson JK, Cloern JE, Thouzeau G (2003)Clams as CO2 generators: the Potamocorbula amurensisexample in San Francisco Bay. Limnol Oceanogr 48: 2086−2092
180

Lorrain et al.: Variability in Tectus niloticus metabolism
Clavier J, Garrigue C (1999) Annual sediment primary pro-duction and respiration in a large coral reef lagoon (SWNew Caledonia). Mar Ecol Prog Ser 191: 79−89
Clavier J, Castets M, Bastian T, Hily C, Boucher G, Chauvaud L (2009) An amphibious mode of life in theintertidal zone: aerial and underwater contribution ofChthamalus montagui to CO2 fluxes. Mar Ecol Prog Ser375: 185−194
Emerson DN, Duerr FG (1967) Some physiological effects ofstarvation in the intertidal prosobranch Littorina planaxis(Philippi, 1847). Comp Biochem Physiol 20: 45−53
Garrigue C (1991) Biomass and production of two Halimedaspecies in the southwest New Caledonian lagoon.Oceanol Acta 14: 581−588
Gröcke DR, Gillikin DP (2008) Advances in mollusc scle-rochronology and sclerochemistry: tools for understand-ing climate and environment. Geo-Mar Lett 28: 265−268
Hawkins AJS, Bayne BL (1985) Seasonal variation in the relative utilization of carbon and nitrogen by the musselMytilus edulis: budgets, conversion efficiencies andmaintenance requirements. Mar Ecol Prog Ser 25: 181−188
Heisterkamp IM, Schramm A, Larsen LH, Svenningsen NB,Lavik G, de Beer D, Stief P (2013) Shell biofilm-associatednitrous oxide production in marine molluscs: processes,precursors and relative importance. Environ Microbiol15: 1943−1955
Heslinga GA, Hillmann A (1981) Hatchery culture of thecommercial top snail Trochus niloticus in Palau, CarolineIslands. Aquaculture 22: 35−43
Hoang DH, Tuyen HT, Hoang DL (2008) Growth rate ofTrochus niloticus (L., 1767) fed different food types. SPCTrochus Information Bulletin 14: 7−11
Hochachka PW, Somero GN (2002) Biochemical adaptation: mechanism and process in physiological evolution.Oxford University Press, New York, NY
Holmes RM, Aminot A, Kérouel R, Hooker BA, Peterson BJ(1999) A simple and precise method for measuringammonium in marine and freshwater ecosystems. Can JFish Aquat Sci 56: 1801−1808
Houlihan DF (1979) Respiration in air and water of threemangrove snails. J Exp Mar Biol Ecol 41: 143−161
Jacquet S, Delesalle B, Torrton J, Blanchot J (2006)Response of phytoplankton communities to increasedanthropogenic influences (southwestern lagoon, NewCaledonia). Mar Ecol Prog Ser 320: 65−78
Lazareth CE, Guzman N, Poitrasson F, Candaudap F,Ortlieb L (2007) Nyctemeral variations of magnesiumintake in the calcitic layer of a Chilean mollusk shell(Concholepas concholepas, Gastropoda). Geochim Cos-mochim Acta 71: 5369−5383
Lejart M, Hily C (2011) Differential response of benthicmacrofauna to the formation of novel oyster reefs (Crass-ostrea gigas, Thunberg) on soft and rocky substrate inthe intertidal of the Bay of Brest, France. J Sea Res 65: 84−93
Lejart M, Clavier J, Chauvaud L, Hily C (2012) Respirationand calcification of Crassostrea gigas: contribution of anintertidal invasive species to coastal ecosystem CO2
fluxes. Estuaries Coasts 35: 622−632Lewis JB (1971) Comparative respiration of some tropical
intertidal gastropods. J Exp Mar Biol Ecol 6: 101−108Marsden ID, Shumway SE, Padilla DK (2012) Does size
matter? The effects of body size and declining oxygentension on oxygen uptake in gastropods. J Mar BiolAssoc UK 92: 1603−1617
Martin S, Thouzeau G, Chauvaud L, Jean F, Guérin L,Clavier J (2006) Respiration, calcification, and excretionof the invasive slipper limpet, Crepidula fornicata L.: implications for carbon, carbonate, and nitrogen fluxes inaffected areas. Limnol Oceanogr 51: 1996−2007
Mayzaud P, Boutoute M, Gasparini S, Mousseau L, LefevreD (2005) Respiration in marine zooplankton—the otherside of the coin: CO2 production. Limnol Oceanogr 50: 291−298
Mazerolle MJ (2013) AICcmodavg: model selection andmultimodel inference based on (Q)AIC(c). R packageversion 1.35. http: //CRAN.R-project.org/package=AICc-modavg
Mistri M, Munari C (2013) The invasive bag mussel Arcuat-ula senhousia is a CO2 generator in near-shore coastalecosystems. J Exp Mar Biol Ecol 440: 164−168
Nash WJ (1993) Trochus. In: Wright A, Hill L (eds) Near-shore marine resources of the South Pacific. Institute ofPacific Studies, Suva, Forum Fisheries, Honiara, p 451−497
Pakoa K, Friedman K, Damlamian H (2010) The status oftrochus (Trochus niloticus) in Tongatapu Lagoon, King-dom of Tonga. SPC Trochus Inf Bull 15: 3−15
Pierrot D, Lewis E, Wallace D (2006) CO2SYS_calc_XLS: MSExcel program developed for CO2 system calculations.Carbon Dioxide Information Analysis Center, Oak RidgeNational Laboratory, US Department of Energy, OakRidge, TN
Purcell SW, Cheng YW (2010) Experimental restocking andseasonal visibility of a coral reef gastropod assessed bytemporal modelling. Aquat Biol 9: 227−238
R Development Core Team (2013) R: a language and en -vironment for statistical computing. R Foundation for statistical computing, Vienna
Rhoads DC, Lutz RA (1980) Skeletal growth of aquaticorganisms: biological records of environmental changes.Plenum, New York, NY
Richardson HB (1929) The respiratory quotient. Physiol Rev9: 61−125
Roy RN, Roy LN, Vogel KM, Porter-Moore C and others(1993) The dissociation constants of carbonic acid in sea-water at salinities 5 to 45 and temperatures 0 to 45°C.Mar Chem 44: 249−267
Santini G, Williams GA, Chelazzi G (2000) Assessment offactors affecting heart rate of the limpet Patella vulgataon the natural shore. Mar Biol 137: 291−296
Scherrer B (1984) Biostatistique. Gaetan Morin Editeur,Montreal
Schöne BR, Gillikin DP (2013) Unraveling environmentalhistories from skeletal diaries—advances in sclerochrono -logy. Palaeogeogr Palaeoclimatol Palaeoecol 373: 1−5
Schwartzmann C, Durrieu G, Sow M, Ciret P, Lazareth CE,Massabuau JC (2011) In situ giant clam growth ratebehavior in relation to temperature: a one-year coupledstudy of high-frequency noninvasive valvometry andsclerochronology. Limnol Oceanogr 56: 1940−1951
Shaw EC, McNeil BI, Tilbrook B (2012) Impacts of oceanacidification in naturally variable coral reef flat eco -systems. J Geophys Res 117: C03038, doi: 10.1029/2011 JC007655
Smith SV, Key GS (1975) Carbon dioxide and metabolism inmarine environments. Limnol Oceanogr 20: 493−495
Symonds MRE, Moussalli A (2011) A brief guide to modelselection, multimodel inference and model averaging inbehavioural ecology using Akaike’s information crite-rion. Behav Ecol Sociobiol 65: 13−21
181

Aquat Biol 23: 167–182, 2015
Tagliarolo M, Clavier J, Chauvaud L, Koken M, Grall J(2012) Metabolism in blue mussel: intertidal and subtidalbeds compared. Aquat Biol 17: 167−180
Tagliarolo M, Clavier J, Chauvaud L, Grall J (2013a) Carbonemission associated with respiration and calcification ofnine gastropod species from the intertidal rocky shore ofWestern Europe. Mar Biol 160: 2891−2901
Tagliarolo M, Grall J, Chauvaud L, Clavier J (2013b) Aerialand underwater metabolism of Patella vulgata: com -parison of three intertidal levels. Hydrobiologia 702: 241−253
Tribollet A (2008) The boring microflora in modern coral reefecosystems: a review of its roles. In: Wisshak M, TapanilaL (eds) Current developments in bioerosion. Springer,
Berlin, p 67−94Vermaat JE (2009) Linking clonal growth patterns and eco-
physiology allows the prediction of meadow-scaledynamics of seagrass beds. Perspect Plant Ecol Evol Syst11: 137−155
Vermeij GJ (1978) Biogeography and adaptation: patterns ofmarine life. Harvard University Press, Cambridge, MA
Villanueva RD, Baria MVB, Cruz DW (2013) Effects of graz-ing by herbivorous gastropod (Trochus niloticus) on thesurvivorship of cultured coral spat. Zool Stud 52: 44
Wernberg T, Tuya F, Thomsen MS, Kendrick GA (2010) Tur-ban snails as habitat for foliose algae: contrasting geo-graphical patterns in species richness. Mar Fresh Res 61:1237−1242
182
Editorial responsibility: Riccardo Cattaneo-Vietti, Ancona, Italy
Submitted: June 30, 2014; Accepted: December 4, 2014Proofs received from author(s): January 30, 2015