Vaporization and Zonal Mixing in Performance Modeling · PDF fileVaporization and Zonal Mixing...
21
American Institute of Aeronautics and Astronautics 1 Vaporization and Zonal Mixing in Performance Modeling of Advanced LOX-Methane Rockets George J. Williams, Jr. 1 The Ohio Aerospace Institute, NASA GRC, Cleveland , OH, 44135 Benjamin R. Stiegemeier 2 Vantage Partners, LLC, NASA GRC, Cleveland , OH, 44142 Initial modeling of LOX-Methane reaction control (RCE) 100 lb f thrusters and larger, 5500 lb f thrusters with the TDK/VIPER code has shown good agreement with sea-level and altitude test data. However, the vaporization and zonal mixing upstream of the compressible flow stage of the models leveraged empirical trends to match the sea-level data. This was necessary in part because the codes are designed primarily to handle the compressible part of the flow (i.e. contraction through expansion) and in part because there was limited data on the thrusters themselves on which to base a rigorous model. A more rigorous model has been developed which includes detailed vaporization trends based on element type and geometry, radial variations in mixture ratio within each of the “zones” associated with elements and not just between zones of different element types, and, to the extent possible, updated kinetic rates. The Spray Combustion Analysis Program (SCAP) was leveraged to support assumptions in the vaporization trends. Data of both thrusters is revisited and the model maintains a good predictive capability while addressing some of the major limitations of the previous version. Nomenclature A* = Throat area, in 2 A e = Nozzle exit area, in 2 C* = Characteristic velocity, ft/s C F,PI = Thrust coefficient (for a perfect injector), lb f /lbm s F VAC = Thrust (adjusted to vacuum ambient conditions), lb f G = Mixture ratio variation factor I SP,VAC = Specific impulse (adjusted to vacuum ambient conditions), s L’ = Characteristic length of the combustion chamber, in m = Mass flow rate, lb m /s MR = Mixture ratio, oxydizer to fuel ODE = Subscript indicating a value calculated assuming one-dimensional equilibrium flow p a = Ambient pressure, psia p e = Nozzle exit pressure, psia p o * = Effective chamber pressure, psia TDK = Two-dimensional kinetics code VIPER = Viscous Interaction Performance Evaluation Routine = Characteristic velocity efficiency = Specific impulse efficiency MIX = Mixing efficiency 1 Senior Scientist, OAI, Propulsion and Propellants Branch, 21000 Brookpark Rd., MS 16-1, Associate Fellow. 2 Aerospace Engineer, Propulsion and Propellants Branch, 3000 Aerospace Parkway, AIAA Member. https://ntrs.nasa.gov/search.jsp?R=20150007665 2018-05-26T01:16:44+00:00Z
Transcript of Vaporization and Zonal Mixing in Performance Modeling · PDF fileVaporization and Zonal Mixing...
American Institute of Aeronautics and Astronautics
1
Vaporization and Zonal Mixing in Performance Modeling of
Advanced LOX-Methane Rockets
George J. Williams, Jr.1
The Ohio Aerospace Institute, NASA GRC, Cleveland , OH, 44135
Benjamin R. Stiegemeier2
Vantage Partners, LLC, NASA GRC, Cleveland , OH, 44142
Initial modeling of LOX-Methane reaction control (RCE) 100 lbf thrusters and larger,
5500 lbf thrusters with the TDK/VIPER code has shown good agreement with sea-level and
altitude test data. However, the vaporization and zonal mixing upstream of the compressible
flow stage of the models leveraged empirical trends to match the sea-level data. This was
necessary in part because the codes are designed primarily to handle the compressible part
of the flow (i.e. contraction through expansion) and in part because there was limited data
on the thrusters themselves on which to base a rigorous model. A more rigorous model has
been developed which includes detailed vaporization trends based on element type and
geometry, radial variations in mixture ratio within each of the “zones” associated with
elements and not just between zones of different element types, and, to the extent possible,
updated kinetic rates. The Spray Combustion Analysis Program (SCAP) was leveraged to
support assumptions in the vaporization trends. Data of both thrusters is revisited and the
model maintains a good predictive capability while addressing some of the major limitations
of the previous version.
Nomenclature
A* = Throat area, in2
Ae = Nozzle exit area, in2
C* = Characteristic velocity, ft/s
CF,PI = Thrust coefficient (for a perfect injector), lbf /lbm s
FVAC = Thrust (adjusted to vacuum ambient conditions), lbf
G = Mixture ratio variation factor
ISP,VAC = Specific impulse (adjusted to vacuum ambient conditions), s
L’ = Characteristic length of the combustion chamber, in
m = Mass flow rate, lbm/s
MR = Mixture ratio, oxydizer to fuel
ODE = Subscript indicating a value calculated assuming one-dimensional equilibrium flow
pa = Ambient pressure, psia
pe = Nozzle exit pressure, psia
po* = Effective chamber pressure, psia
TDK = Two-dimensional kinetics code
VIPER = Viscous Interaction Performance Evaluation Routine
= Characteristic velocity efficiency
= Specific impulse efficiency
MIX = Mixing efficiency
1 Senior Scientist, OAI, Propulsion and Propellants Branch, 21000 Brookpark Rd., MS 16-1, Associate Fellow.
2 Aerospace Engineer, Propulsion and Propellants Branch, 3000 Aerospace Parkway, AIAA Member.
https://ntrs.nasa.gov/search.jsp?R=20150007665 2018-05-26T01:16:44+00:00Z

American Institute of Aeronautics and Astronautics
2
I. Introduction
N an effort to provide a higher-performing, more environmentally compatible alternative to hydrazine-based
space storable propellants, NASA’s Propulsion and Cryogenics Advanced Development (PCAD) project within
the Exploration Technology Development Program (ETDP) pursued the demonstration of LOX-methane rocket
engines.1,2
Integrated main and reaction control propulsion systems utilizing LOX-LCH4 could provide substantial
savings in overall system masses. In addition, the moderately higher performance could enable larger payloads or
more demanding maneuvers as the mission architectures develop.
The Aerojet Corporation was contracted to develop and test a 100 lbf class LOX-LCH4 reaction control engine
(RCE).3 Extensive sea-level testing at Aerojet and altitude testing at the NASA Glenn Research Center (NASA
GRC) allows one-to-one comparison of the sea level and altitude data. Details of performance characterizations are
discussed in separate publications for both sea level and altitude testing.4,5
However, trends in observed data are
discussed in light of the modeling. A brief discussion of the hardware and the different configurations is provided
below. Preliminary modeling of the RCE performance was given by Williams.6
The Aerojet Corporation was also contracted to develop and test a 5500 lbf class LOX-LCH4 engine as risk-
mitigation for a potential ascent main engine (AME) for a lunar lander.7 The ascent main engine development
program was specifically tailored to enable the anchoring of analytical models with engine performance data.
Details of performance characterizations are discussed in separate publications for both sea level and altitude
testing. 8,9
A brief discussion of the hardware and the different configurations is provided below. Sufficient data
were collected to enable validation of performance models for both configurations.10
Numerical modeling conducted at GRC in support of this effort is presented. The objectives of the modeling
were to demonstrate the ability to accurately incorporate LOX-LCH4 kinetics using standard performance codes to
predict performance at sea level and to demonstrate the ability to extrapolate altitude performance given sea-level
test data. In particular, variation in the trends of specific impulse, ISP, with mixture ratio, MR, differed significantly
from the trends of one-dimensional equilibrium flow (ODE) predictions. As discussed below, these deviations are
significant because they impact the design of the injector. The Two-Dimensional Kinetics (TDK) code from SEA
has been used successfully in several previous investigations.11,12,13,14,
In this investigation, the 2004 version of
TDK15
and an updated version with a Parabolized Navier Stokes (PNS) solver, the Viscous Interaction Performance
Evaluation Routine (VIPER) Version 3.6.2 (updated in 2008)16
were used. The VIPER code was developed
especially for pressure-fed, high-area-ratio engines.16
II. Experimental Hardware
A. RCE Thrusters
Data were collected on the 100 lbf RCE thrusters at Aerojet (sea-level3) and NASA GRC (sea-level and
altitude).4,5
Altitude testing at NASA WSTF did not yield performance data, but did demonstrate system integration.
Aerojet manufactured several injector and thrust chamber configurations for the 100 lbf RCE. Two of the injectors
are modeled. Both consisted of three zones; a core zone, a barrier zone, and a dedicated fuel film cooling (FFC)
zone for wall compatibility. The designs differed in that one has 20% FFC and the other has 30% FFC. Both were
extensively tested at sea level with different thrust chambers, but only the better performing 20% FFC injector was
used during altitude testing.
Table 1 summarizes the hardware modeled in this investigation. The RCE thrust chambers for both sea-level
and altitude testing were radiatively-cooled columbium (Nb). Nominally designed for an expansion ratio of 80:1 in
space, expansion ratios of 3:1 and 45:1 were fabricated for sea-level and altitude testing, respectively.
Ignition of the engines was accomplished using a torch igniter/spark plug assembly designed to operate at a
nominal mixture ratio of approximately 1.8. The integral igniter remained on for the duration of the thruster firing.
As the igniter feed line set points were determined by the overall engine operating point, the exact igniter mixture
ratio changed slightly with engine test conditions. However, the flow through the igniter was so small, roughly
2.5% of the total flow, that the impact on overall thruster mixture ratio was less than 1%.4
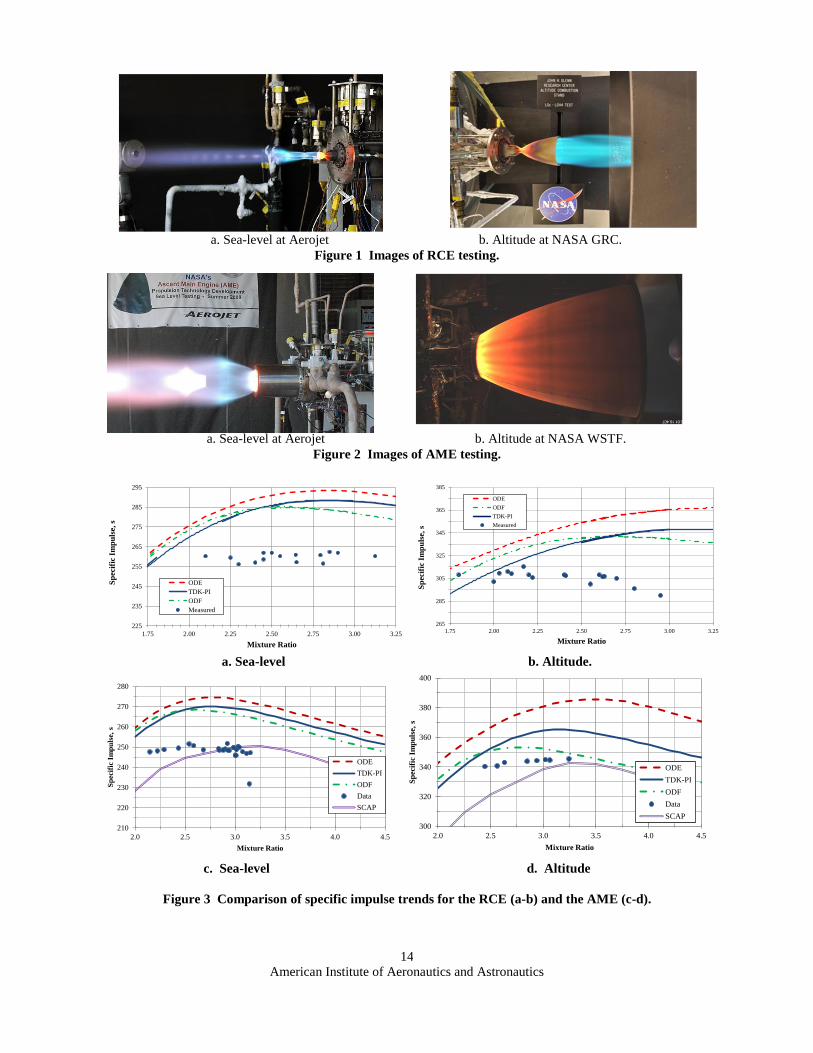
Figure 1 shows photographs of the RCE operating at sea-level (a) and at altitude (b). Both show steady, long
duration operation as opposed to short-pulse operation. While the RCE was nominally designed for operating in a
series of short pulses, and was characterized extensively at both sea-level and altitude in this regard, modeling of the
transient nature of the pulsed tests was beyond the scope of this investigation.
I
American Institute of Aeronautics and Astronautics
3
B. AME Thrusters
Data were collected on a 5500 lbf AME designed and manufactured by Aerojet at Aerojet (sea-level) and NASA
WSTF (altitude). The engine is designed to operate at a nominal chamber pressure of 250 psia and an overall
mixture ratio of 3.0. As with the RCE, the injector consists of three main zones; a core zone, a barrier zone and a
dedicated fuel film cooling (FFC) zone for wall compatibility. The nominal engine flow rates (including igniter) are
11.6 lbm/s LOX and 3.87 lbm/s methane.
Ignition for the engine is accomplished using a torch igniter/spark plug assembly designed to operate at a
nominal mixture ratio of approximately 1.0. Propellant flow to the igniter was drawn from the main run lines and
controlled at the entrance to the igniter manifolds by 0.375 in diameter solenoid valves. As the igniter feed line set
points were determined by the overall engine operating point, the exact igniter mixture ratio slightly changed with
engine test conditions. A custom designed spark plug was used to initiate combustion in the igniter. In all tests
conducted in this program, oxygen flow to the igniter was terminated at approximately 0.35 sec into the engine
profile while methane was allowed to flow during the entire engine run to preclude hot combustion products from
flowing into the igniter body.
There were separate AME ablative combustion chambers for operation at sea level and at altitude. Both thrust
chambers had a conically converging design with an upstream contraction ratio of about 2.5. The expansion of the
sea-level chamber, also conical, was to an area ratio of 1.9. The altitude chamber was designed to operate with a
radiatively cooled nozzle extension. A Space Shuttle Orbital Maneuvering Engine (OME) nozzle extension
constructed of FS-85 columbium was attached to the altitude chamber ablative liner at an area ratio of approximately
14 with the total expansion ratio being about 129:1. The altitude chamber’s contour downstream of the throat was
contoured to smoothly transition to the nozzle extension. Table 1 also provides a summary of the nominal target
geometry and test conditions of the AME altitude engine.
Figure 2 shows the AME operating at sea-level (a) and at altitude (b). Note that the AME was fired vertically
downward at WSTF and the image in Fig. 2b has been rotated for the sake of presentation. The AME was designed
to operate for several minutes per firing. The radiating nozzle reached a steady thermal condition after about 40 s.
III. Theory and Modeling
Thorough discussions of the modules and calculation logic of TDK are available in the literature12,13,15,16
and are
not repeated here. However, for ease in understanding of the discussions below, a few aspects are revisited. The
one-dimensional equilibrium (ODE) module of TDK calculates one-dimensional engine performance using chemical
equilibrium conditions throughout the combustion and expansion processes. Boundary layer effects and flow
divergence are not incorporated. By convention, the ODE calculation for an engine using a single zone is
considered ideal performance.17
Radial mixing (zoning), vaporization, total pressure loss, boundary layer losses,
and two-dimensional divergence are incorporated as modifications (reductions) in the ODE performance. The TDK
module includes boundary layer effects. Without additional constraints on the mixing and vaporization processes,
the TDK calculation with boundary layer effects is an approximation to a perfect injector (TDK-PI).17
Thrust and specific impulse calculated by TDK and VIPER assume a vacuum exit condition. For comparison to
the predicted values, experimental data were ―corrected‖ to vacuum exit conditions by increasing the thrust by paAe.
The ambient pressure was measured in the vicinity of the test and not near the exit plane of the nozzle. The
uncertainty introduced by measuring the pressure in this way was very small for altitude testing, but significant for
sea-level. However, the sea-level correction is a constant fraction of the overall thrust and its uncertainty should not
impact the trends in performance.
Figure 3 compares ODE, TDK-PI, and one-dimensional frozen flow (ODF) contours to the RCE and AME sea-
level and altitude data. (SCAP curves are also shown, but are discussed below.) For all cases, the experimental data
are, as expected, below the ideal curves, but they also do not follow the trends of these curves. One would expect a
significant decrease in performance at lower MR, but this is not observed. Indeed, the performance appears to first
order to be largely independent of MR. That this is the trend for both the very small RCE and the relatively large
AME suggest that this may be a universal trend for methane thrusters. This trend is not captured through simple
application of existing codes such as TDK or VIPER. But, the trend is potentially very significant since there are
significant advantages to operating away from the nominal peak performing MR. These include the ability to
operate cooler at lower overall MR, reducing the fraction of the fuel needed for a film cooling layer. However,
without the ability to accurately predict the dependency of performance on MR (or lack thereof), the design process
will be limited to an experiential process which is expensive and currently limited due to the small database of LOX-

American Institute of Aeronautics and Astronautics
4
LCH4 thrusters. The following discussion presents the approach taken to make reasonable predictions in a
systematic way.
A. Fundamental Parameters
The following definitions and conventions were used in the analysis of the measured and predicted performance
parameters. Conventions used to generate the experimental values, e.g. mass flow rate, and their respective
uncertainties are discussed in detail in separate publications.9
VIPER does not directly incorporate a total pressure loss during the combustion of the propellants. During both
sea-level and altitude testing, the chamber pressure was measured at the face of the injector. However, both
performance calculations based on measured values, e.g. C*, and VIPER require the total pressure at the throat, the
effective chamber pressure, To be consistent, the experimental C* values reported below use the effective
chamber pressure assumed in the model.
Because the AME has a conically converging chamber and not a cylindrical chamber with a short converging
section, it is inappropriate to apply the standard JANNAF analytical method to estimate the total pressure loss
during vaporization and energy addition. The energy and mass addition are occuring at higher velocities and
therefore the momentum loss, i.e. the total pressure drop, will be greater. For reference, for the AME geometry the
analytical method yields a total pressure drop of 3%.8
An approximation used sucessfully in previous investigations utilizes TDK/VIPER to predict the pressure
loss.10
For the perfect injector approximation (TDK with boundary layer), the total pressure at the throat can be
calculated using
po*
Fvac
(1)
where Fvac is the measured thrust corrected for vacuum and the thrust coefficient, CF, is the perfect injector value
assuming the pressure at the face of the injector as the chamber pressure. This method is most useful for small
expansion ratios where the nozzle loss is small compared to the combustor inefficiency. The sea-level chamber with
an expansion ratio of 1.9 is ideal. Using this method, an average pressure drop of 5 percent for the AME tests was
calculated and used in the remaining analysis for calculation of po*.
Because the RCE has a conventional cylindrical chamber with a short converging section, it is appropriate to
apply the standard JANNAF empirical method to estimate the total pressure loss during vaporization and energy
addition. The empirical method suggests a total pressure drop of 1.5 percent.17
The pressures used in the modeling
when comparing to data were accordingly set to 98.5% of the measured values independent of the operating point.
Other measured and predicted performance perameters are calculated using the following expressions:
Fvac FMEAS+paAe (2)
C po*A
*
m (3)
I Fvac
m (4)
(5)
(6)
B. Contours
The contour of the thrust chamber is input into VIPER in two sets, one upstream and one downstream of the
throat. The upstream section is defined by characteristic parameters such as the contraction ratio and L-prime. The
downstream region is specified by a matrix of points corresponding to the expansion region. The altitude expansion
conforms to an 80% bell, however the sea-level expansion is a simple cone. The approximations of both
configurations agree well with hardware line drawings.
The throat area was measured as a matter of course between tests. Consistent, cold values for both the AME and
RCE were used in Eqns. 1 and 3. Cold values for Ae were also used. Because Nb has a very low coefficient of
American Institute of Aeronautics and Astronautics
5
thermal expansion—and the ablative of the AME an even smaller coefficient, the enlargement of the throat area
during operation is likely negligible. For a throat temperature around 1600 ºR, the RCE’s throat area will increase
by roughly 1 percent. While the variation in throat area could be incorporated into the modeling as a function of
MRFFC, it was not. In was included in the calculation of C* which set the effective chamber pressure.
C. Radial Variation in Mixture Ratio
Radial variation in mixture ratio can be modeled in VIPER by establishing stream-tube ―zones.‖ For each zone,
the mixture ratio and fraction of total mass flow are specified. The zones can be allowed to mix. If they do not mix,
the gradients between zones can be large. However, the PNS solver in VIPER removes the zones and large gradients
can result in computational instability. Therefore, transitional regions are incorporated into the VIPER model with
low mass flow fractions to ensure relatively smooth computation.
The zones are defined by the primary regions of the injector: core, boundary zone, and fuel film cooling (FFC).
Design calculations and cold flows conducted by Aerojet allow approximations of the MR near the face of the
injector and are characterized by the percentage of the fuel in each zone. In this simple approach, the zone near the
wall is assumed to entrain some oxygen into the FFC fuel flow. The amount is correlated with the cold flow data as
well as with wall temperatures seen during testing. All zonal MR scale with the overall MR. The oxygen flow rates
and MR for the other zones are then adjusted to maintain mass conservation given total flow rates and an overall
mixture ratio.
Unlike in TDK, the zonal variations in the region upstream of the throat are not maintained in the expansion in
VIPER models. Instead the zones are allowed to mix, and the entirety is modeled as one flow for the final
performance prediction. This mixing results in increased reactions near the throat and a slight shift towards
equilibrium flow for VIPER predictions relative to TDK predictions.
The contribution of the local (zonal) MR to the overall performance of the engine will depend on the amount of
flow in the zone and the degree to which the zone is at higher or lower performance than the mean MR. To illustrate
the impact of radial MR variation for a model with N zones, the MR zone factor has been defined as
(6)
where, the ISP,PI is the TDK calculated perfect injector (TDK-PI) vacuum specific impulse and MR-bar is the
nominal (average) MR for the entire injector. For a single zone, G≡0. Dedicating 30% of the fuel to FFC resulted
in large (> 1.5x nominal) MR in the core flows of that injector. Reducing this to around 20% yielded MR perhaps
10% greater than the nominal MR.10
MR variations and flow fractions consistent with the Aerojet measurements are
assumed throughout the analysis. In addition to the cold flow measurements which provide at least a relative MR
distribution across the face, the boundary layer MR can be inferred from the wall temperature.
It should be noted that there are other options in both TDK and VIPER to accommodate radial mixing. In
particular, the VARMIX option will allow a limited amount of mixing between zones, entrainment, to occur
upstream of the throat. The ENTRAINMENT option is more versatile and is used instead to model the vaporization
and mixing and to model the interaction of the barrier elements with the FFC zone. The last results in the increase
of the MR of the FFC zone along the length of the chamber to one which yields the observed wall temperatures at
the throat. Since an MR=0 would be computationally unstable, an initial MR for the FFC zone is assumed. This
value is scaled with overall MR and tied to the injector design. For the 30% FFC injector and for an average MR of
2.5, MRFFC is 0.5 at the injector and increases via entrainment to 1.3 at the throat. 43% of the fuel is assumed to be
in the barrier elements of which one-third is entrained into the wall zone. For the 20% FFC injector MRFFC is
initially 0.6 transitioning to 1.6 at the throat.
D. Vaporization
Vaporization can be incorporated into VIPER either by specifically allowing for droplet vaporization via the
Spray Combustion Analysis Program (SCAP) routine18
or by controlling the availability of a reactant for combustion
as a function of distance from the injector face. In the latter, all flow is assumed to begin as cold gas flow. Because
of the very small droplets being considered in this investigation and because of the variation in injector element
design across the face of the injector, the latter method has been incorporated. However, as a tool, the SCAP routine
can be used to generate vaporization curves for different operating conditions. A third option of a rigorous
vaporization and combustion model which can then serve as an input into VIPER was not pursued. We deemed that
American Institute of Aeronautics and Astronautics
6
the uncertainties associated with the assumptions of that approach threatened to mask what is truly a macroscopic
adjustment of VIPER.
One way of modeling the availability of propellants is to entrain species as a function of distance from the face
of the injector. In effect, this entrainment consists of another layer of zoning in which, as with the FFC zone
discussed above, two flows are mixed to give a final MR. In this case, each of the non-FFC zones is divided into an
initial flow and a co-propagating flow which is ―added‖ to the original flow. By adding energy and momentum to
the flow, the final zonal flow rate is established.
Three effects are captured through the vaporization model which is applied to each zone within the model except
the FFC zone. One is the overall vaporization of the propellants as a function of distance from the injector face.
The rate of entrainment for vaporization is specified as a function of axial position normalized to the throat radius as
is shown in Figure 4a. The curve is based on a Priem-method estimation of vaporization assuming a standard
distribution of droplets sizes19
.
The second effect is the delayed vaporization of the methane relative to the LOX. The initial flow is assumed to
have a lower MR than the average zonal MR and the entrained flow is assumed to be higher. For nominal inlet
conditions, it is assumed that 50% of the LCH4 is vaporized at the beginning of the model while only 25% of the
LOX is. The entrained flow then adds the remaining 75% of the LOX and 50% of the LCH4 as it combusts. The
differences in temperature and momentum for the two flows result in a significant decrease in performance for most
cases, especially for high overall MR. However, at low overall MR, the initial mixture ratio in the zone is close to
stoichiometric and the added flow, being mostly light, does not detract as much. This approach is consistent with
data as will be discussed below. If the two flows are assumed to be in equilibrium (i.e., fully reacted) as they are
introduced, the differences in the MR would be very high, the chemistry of the flow would be wrong, and the
temperature would be too high. To maintain ―reasonable‖ MR and to allow for extended combustion along L-prime,
some of the LOX and LCH4 are introduced as unreacted species in the initial and entrained flows, respectively. In
cases where either or both of the propellants are assumed to enter the chamber as gases, the gaseous propellant is
introduced as a non-equilibrium component of the initial flow to ensure stability of the entrainment option.
The third effect of the vaporization model is capturing the higher than expected performance of methane at low
MR. LOX-LCH4 thrusters of very different sizes have exhibited a strong deviation from the trends suggested by
TDK-type models. As mentioned above, this is partly explained by the variation in MR across the face of the
injector. However, this flattens and shifts the peak performance to lower MR while largely maintaining the same
parabolic trend. One possibility for the manifestation of a completely different trend is the impact of the change in
momentum ratios of the injector elements with MR. An attempt to empirically capture the change through varying
the vaporization rate proved successful in modeling the Aerojet AME.10
Figure 4 shows schematically the
difference in vaporization curves. Figure 4a compares extended and shortened profiles with a nominal profile.
Figure 3b compares the SCAP vaporization profiles for MRs of 2.0 and 3.5. Note that the LOX vaporization is
predicted to ―extend‖ at the higher MR as is assumed in this effort. The LCH4 is predicted to have negligible
dependence on MR. The combined effect is consistent with the approach shown in Fig 4a. Figure 4c shows the
impact of changing the vaporization curve on C*. Because the injector elements are not only different in size but
also in kind between the AME and the RCE thrusters, the change in vaporization with MR was retailored for sea-
level data for the RCE thrusters.
E. Kinetics
Kinetic equations and rates used in TDK and VIPER were modified to include a methane combustion set of
reactions consistent with the NIST recommended rates for chemical reactions.20
Order of magnitude variations in
the controlling rates had negligible impact on the predicted performance. However, entrained CH4 tends to be
treated as an inert (like soot) in TDK/VIPER so a reasonable set of rates was needed to override the default. One
explanation for the tendency of TDK to under predict altitude performance data given agreement with sea-level
performance data is that the methane kinetic rates are too high resulting in over prediction of sea-level performance
(which is ―corrected‖ by adjusting other things as discussed above) and eliminating additional equilibration through
the early stages of the expansion.
Low temperature specific gravities and specific heats were specified for all of the reactants. As long as the
reactants remained liquid leaving the injector, sensitivity to their temperature was negligible, (< 0.1 s in ISP for a 20
deg F change in propellant temperature). For gaseous propellants, changes were made to the initial enthalpies,
densities, and temperatures in the initial input deck as well as in the ENTRAINMENT modules. These changes
produced a noticeable effect, 1 or 2 s of increased performance. However, the effect is additive to the change in
vaporization assumptions given a gaseous reactant.

American Institute of Aeronautics and Astronautics
7
F. Boundary Layer
A major advantage of the VIPER code over the TDK code is the rigorous boundary layer calculation associated
with the PNS solver. Comparison of the boundary layer thicknesses and losses is given below in the discussion of
altitude data. The differences in the short sea-level nozzle were negligible as is noted.
In both codes, a fully kinetic boundary layer is assumed. There is little computational time impact from this
assumption. Since the boundary layer is allowed to transition to turbulent when the Reynolds number reaches 460, a
fully turbulent boundary layer is assumed throughout the length of the thrust chamber.
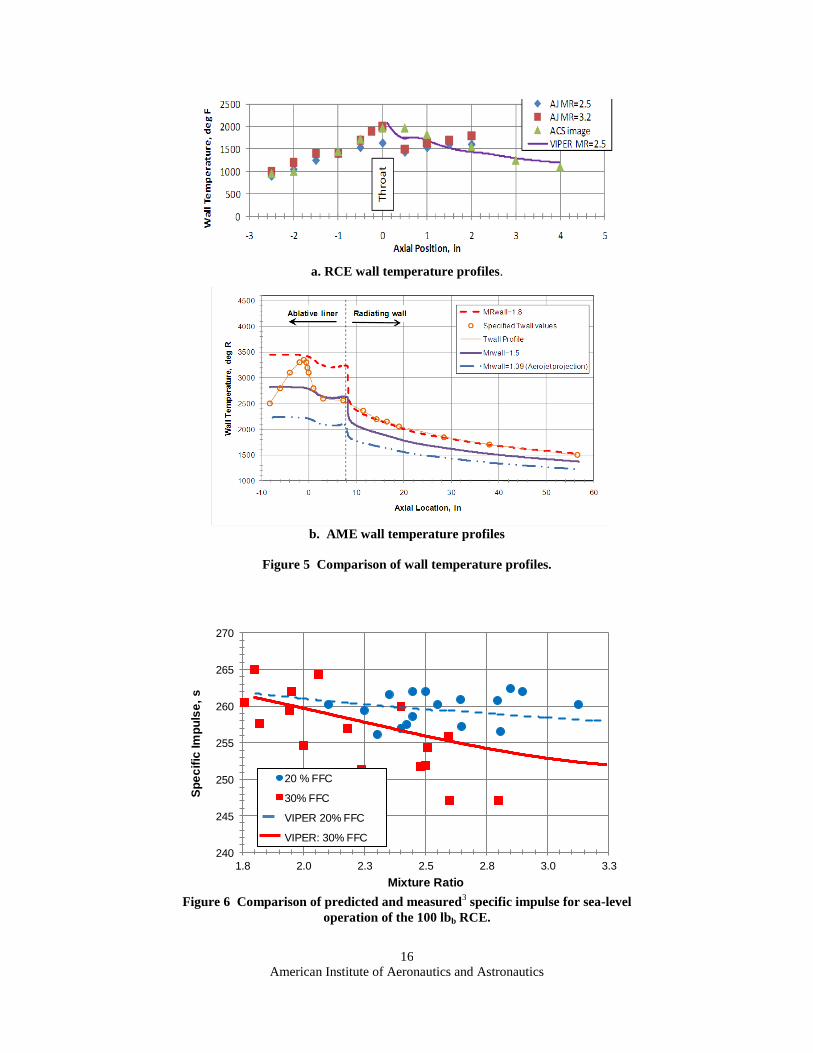
G. Wall Temperature
Wall temperatures can be calculated by or input to the VIPER model for both the RCE and AME thrusters. Data
were collected which allows specification of the wall temperature to a rough degree. For the RCE, Figure 5a
compares the temperature profiles for an average MR of 2.5 for the 20% FFC case estimated by Aerojet CFD
modeling, estimated via color-temperature at both sea-level and altitude, and the profile generated by TDK for a
MRffc of 1.6. Note the remarkably good agreement. Because of the good agreement, a radiative wall condition was
assumed for all cases and MRffc was scaled with overall MR and with the percent FFC.
For the AME, Figure 5b compares temperature profiles calculated for MRffc = 1.5 and 1.8, an Aerojet CFD
projection, and an estimate from color temperature. Unlike for the RCE, the color temperature was limited to the
radiating wall of the nozzle extension. A long duration, 110 s, test was run at sea-level with an MR=3.0. This test
provided sufficient char information on the ablative for Aerojet to estimate the steady-state surface temperatures.
This data is included in Fig. 5b as the Aerojet projection. The primary difference is in the upstream region. The
image-based profiles (color temperature) of the nozzle extension after 40 s of operation are anchored to pyrometer
data near the transition to the nozzle extension (indicated in the Figure by a dashed line). Specifying this predicted
wall temperature profile increased the predicted performance over the original assumption (a wall MR of 1.4) by
about 2 s in ISP. A wall MR of 1.5 was used along with a specified wall termperture based on the char measurements
and nozzle imaging to match the sea-level data and to predict data at altitude. A composite of these profiles yields a
curve with the open circles in the figure. The distribution given by the thin line was used as a baseline for the MR =
3.0 operating point. The MRffc varied with MR and the wall temperature profile was scaled accordingly.
H. Summary of the Method
Beginning with the TDK-PI model (in VIPER), a radial variation in mixture ratio was added. This variation was
based on the aperture geometry of the different injectors as well as Aerojet’s estimates of flow splits for an MR 2.5.
The MR in each of the zones was then scaled with the desired average MR while conserving mass in the total flow
rate. The chamber pressure was set to and the vaporization was adjusted to match the resulting C*. Once
enough data were in hand to validate these models, in principle the vaporization profile could be set a priori.
Because of the uncertainties associated with both sea-level and altitude data (from scatter independent of
systematic uncertainties) it is difficult to use either set of data as an absolute reference for anchoring the model to
predict the other set. Never-the-less, except for the nozzle contour itself, all settings established to model the sea-
level data were used to predict altitude performance. This approach does not play to the strength of VIPER since it,
like TDK, is designed primarily to model the kinetic expansion nozzle flow and not the combustion itself.
Validating an approach to approximating the combustion processes is intended to strengthen the applicability of
VIPER to development of new thrusters.
IV. Results
A. Comparison of Numerical Predictions to RCE Sea Level Data
The RCE was tested over a large range of MR and Pc at Aerojet. The majority of this testing was with the L-
prime used in altitude testing and only these data are discussed here. The test configuration, engine, and
performance data are discussed in detail in Robinson.3 Modeling of different L-primes is discussed in Williams.
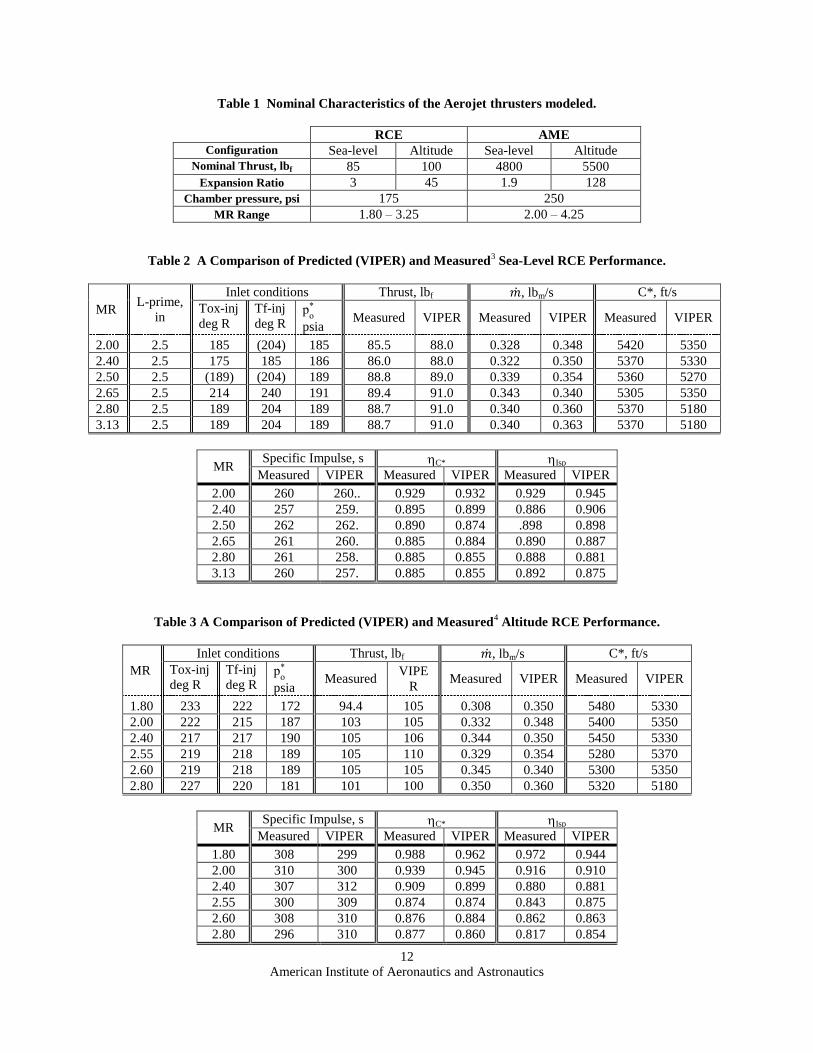
6
Table 2 provides a summary of the sea-level data and predictions for those points. Only a subset of data collected
are in the Table.
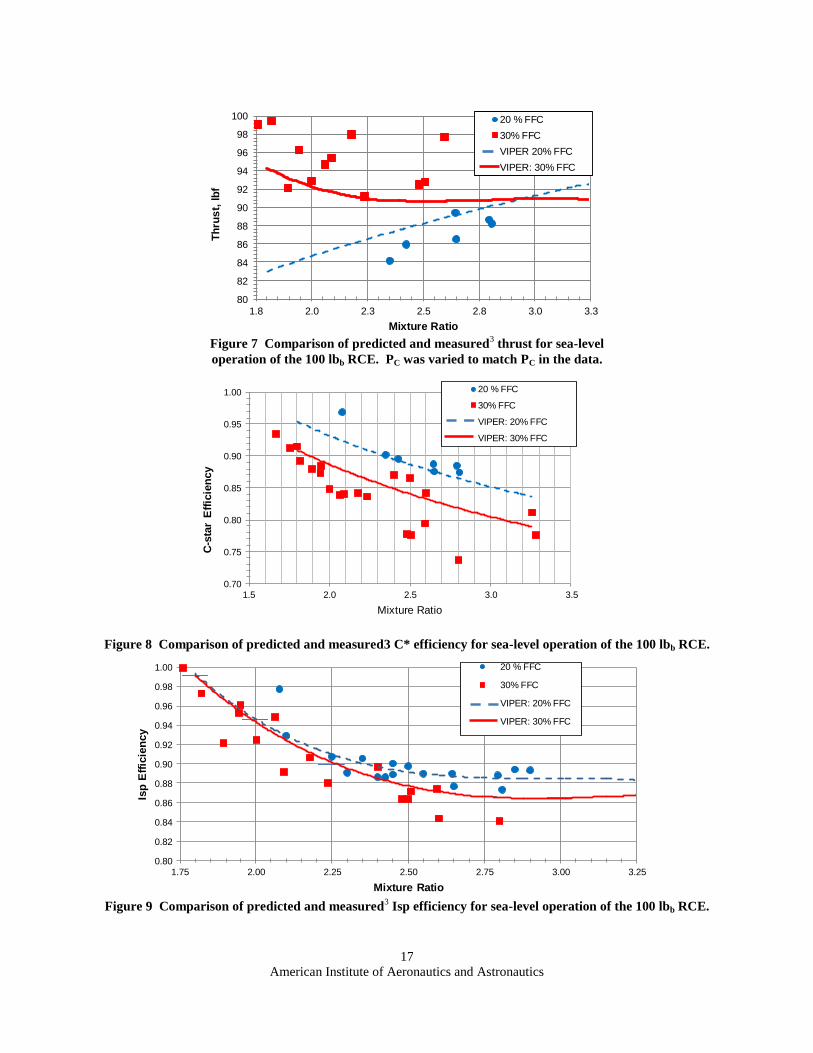
Figure 6 compares the predicted and measured specific impulse for the sea-level testing of both the 20% and
30% FFC sea-level chambers. Note that the VIPER curves fall in the middle of the data spreads capturing their
respective trends. There is good agreement with the data at low MR. Usually there is very poor agreement in this

American Institute of Aeronautics and Astronautics
8
region, but the modification of the axial mixing efficiency appears to capture the trend. All of the discussion
regarding agreement of prediction and measurement should be understood in the context of the uncertainties
associated with both. An uncertainty of ±2 percent ( ±5 s in ISP) is estimated for the sea-level data. Thus the band of
uncertainty captures the entire range of measured and predicted data. Within the predictions themselves, there is
considerable, perhaps even greater, uncertainty as suggested by the above discussions. Regardless, the specific
impulse predictions and measurements lie within 2% of each other and appear to follow the same trends.
Figure 7 shows that the measured and predicted thrust are within 1% of the each other. Figures 8-9 compare the
predicted and calculated C* and ISP efficiencies. Note that all trend up at low MR. For both injector designs, the
entrainment/vaporization rate within a zone was determined by the MR for that zone. In this respect, the same
assumptions used for one injector were shown to be consistent with the other. Because the zone-to-zone MR
variation of the 20% FFC RCE was smaller than that for the 30% FFC RCE, the impact of the assumptions
associated with the vaporization model, in particular with respect to accommodating changes in momentum ratios as
MR decreases, is more pronounced. While the assumptions capture the observed performance well, more
investigation is required to determine if this is the best or the most appropriate approach.
B. Comparison of Numerical Predictions to RCE Altitude Data
The 20% FFC RCE with a 45:1 nozzle was tested over a range of MR and inlet temperatures at the Altitude
Combustion Stand (ACS) facility at NASA GRC. The test configuration, engine, and performance data are
discussed in detail in Marshall.4 The exit pressure of the nozzle was nearly exactly matched to that of the test
chamber resulting in a negligible thrust correction. A region of significant non-luminosity is evident at the exit of
the thruster between the core flow and the nozzle wall. This ―cool‖ region is likely a combination of boundary layer
displacement and film cooling. While there were no in-situ diagnostics to measure this region, images suggest the
thickness of the non-luminescence to be roughly 0.35-inches. The VIPER code predicts a boundary layer thickness
of 0.1-inch at the exit, but it also predicts a cool region of gas (300 deg C) extending 0.25-inches into the flow.
Coupled with the reasonable approximation to the observed wall temperature, the agreement in boundary layer
thickness suggests that the VIPER model is capturing the boundary effects well.
The radial MR variation assumed in the sea-level cases was carried over to predict the altitude performance.
Axial mixing and thereby C* was maintained as a function of MR from the sea-level data. Following this
convention, it is possible to evaluate the extension of sea-level data to altitude data. Indeed, differences in the
predicted performance might then be attributed to the accuracy of the expansion modeling and not to the modeling
of the combustion chamber.
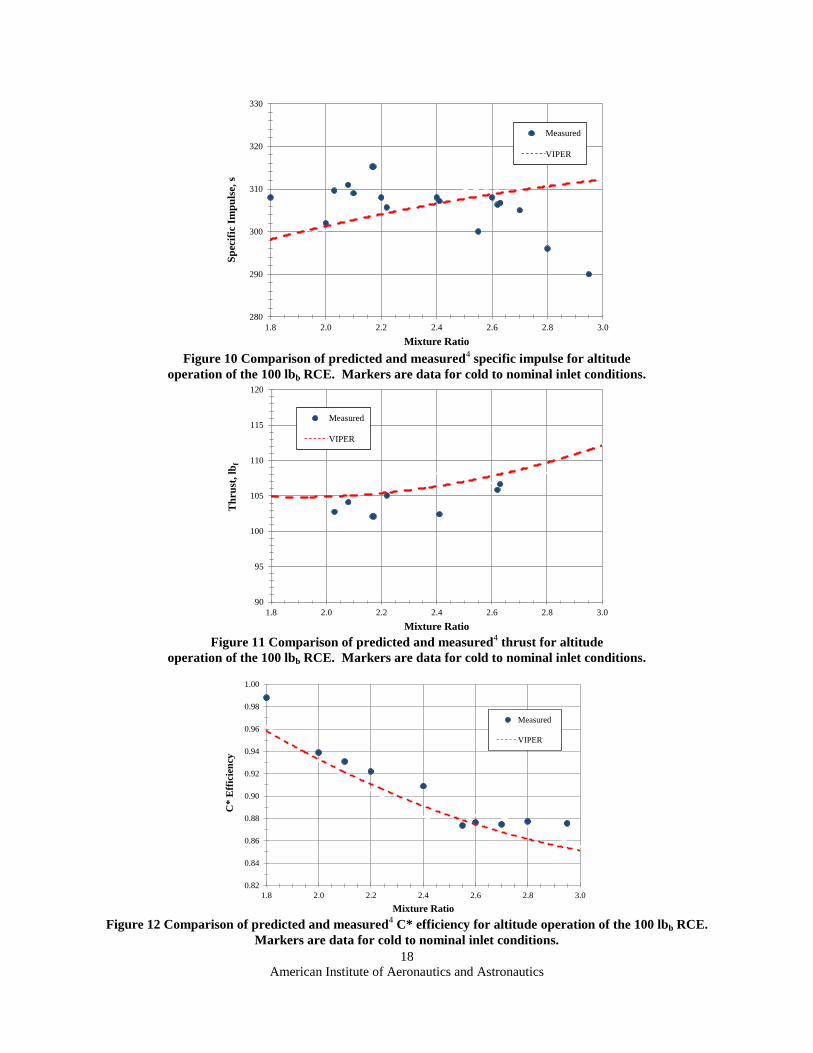
Figure 10 compares the predicted and measured specific impulse for the altitude testing for nominal and ―cold-
cold‖ inlet conditions. These two categories of inlet conditions are considered together since the impact due to
enthalpy differences is small. The predicted specific impulses are within 1% of the measured values. There is a 3.5
to 4 % uncertainty in the measured values (±17 s) and the uncertainty in the predicted values is at least as large
given the assumptions regarding mixing.
Figure 11-13 compare the predicted and measured thrust, C* efficiency and ISP efficiency, respectively. There is
still very good agreement. Note that the two efficiencies no longer follow the same trend which reflects the impact
of the larger nozzle. As expected, there are greater nozzle-induced losses in ηIsp for the altitude cases.
Table 3 provides a summary of the altitude data and predictions for those points. Only a sample of the altitude
data and predicted values are tabulated here. Note that there is generally good agreement between the experimental
and predicted values, though the differences are higher than the data and calculations for sea-level operation. In part
this results from a ―normalizing‖ of the model to the sea-level data.
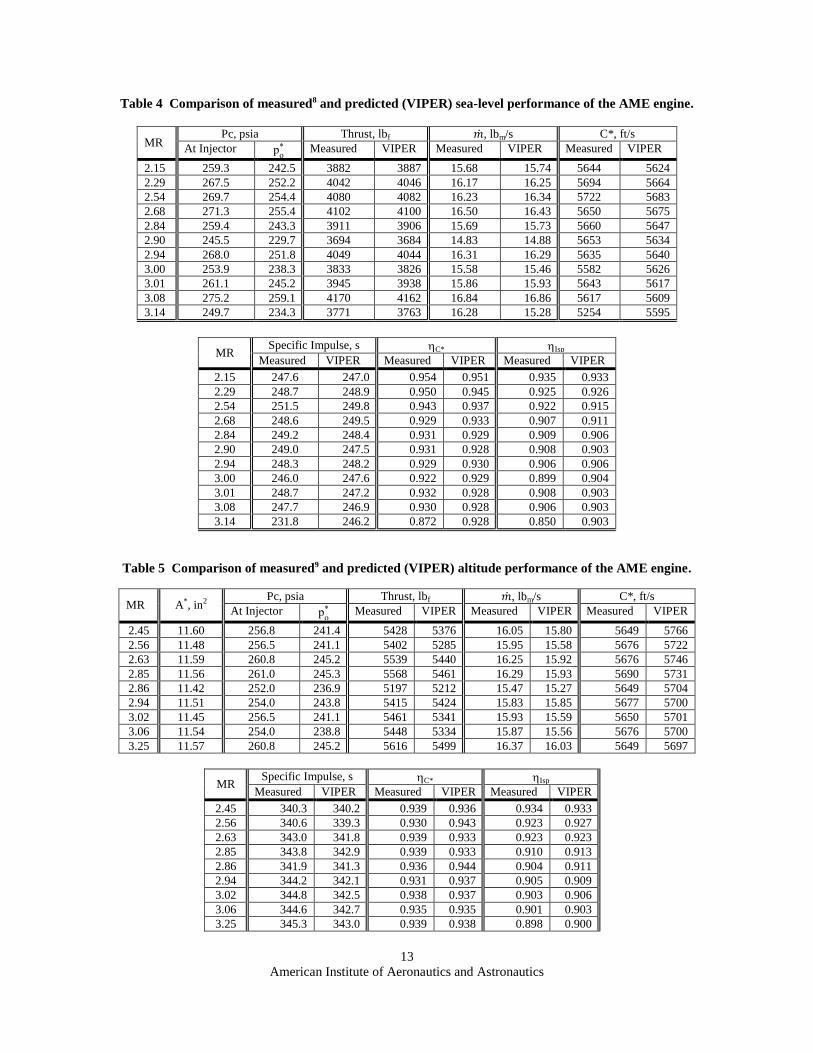
C. Comparison of Numerical Predictions to AME Sea-level Data
The atmospheric chamber was tested at sea-level over a large range of MR and PC at Aerojet. As with the RCE,
the majority of this testing was with the L-prime used in altitude testing and those are the data discuessed here. The
test configuration, engine, and performance data are discussed in detail in Robinson.8 Discussion of predictions of
performance with other L-primes and nozzle configurations is given in Williams.10
Table 4 provides a summary of
the atmospheric data and predictions for those points. Only a subset of data collected are in the Table.
Figure 14 compares the predicted and measured specific impulse for the atmospheric testing. Note that there is
good agreement across the entire range of MR. As with the RCE, the modification of the vaporization rate and the
axial mixing efficiency appears to capture the experimental trend. All of the discussion regarding agreement of
prediction and measurment should be understood in the context of the uncertainties associated with both. An
uncertainty of ±2 percent ( ±5 s in ISP) is estimated for the sea-level data. Thus the band of uncertainty captures the

American Institute of Aeronautics and Astronautics
9
entire range of measured and predicted data. Within the predictions themselves, there is considerable, perhaps even
greater, uncertainty as suggested by the above discussions. Regardless, the specific impulse predictions and
measurements lie within 1 % of each other and now appear to follow the same trends.
Figure 15 shows that the measured and predicted thrust are also within 1% of the each other. Indeed, there is
remarkable agreement between the predicted and measured values. VIPER calculates the mass flow rate given an
effective chamber pressure which has been set in the model to the value of each experimental point (via Eqn 1).
Uncertainties in the thrust measurements are shown by error bars. This uncertainty is more easily quantified than
others due to direct measurement. It carries over as a lower bound for the ISP calculations.
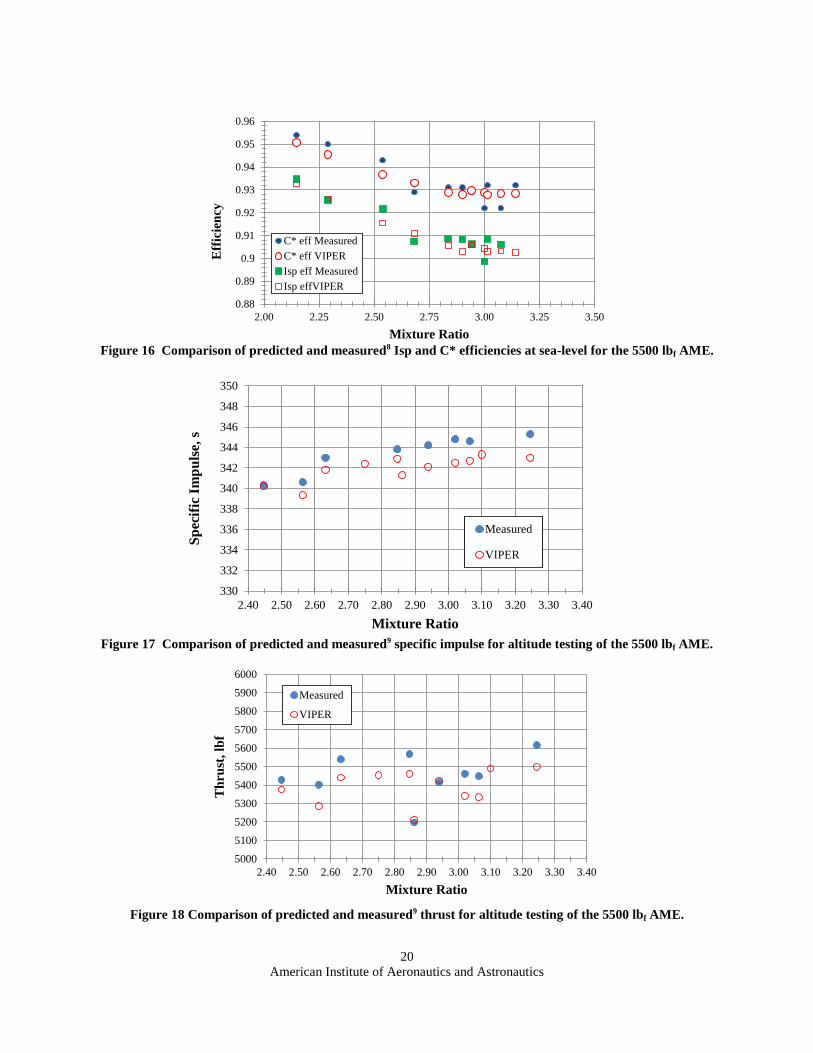
Figure 16 compares the predicted and calculated C* and ISP efficiencies. Note that all reach minima near the
―optimal‖ MR of 3.0. In the predicted values, and perhaps by inference more than in reality, the collective
minimazation results from the release of methane for reaction sooner in the lower MR cases. Within the region of
interest (i.e. 2.7<MR<3.1) there is both good agreement and little variation. However, the values are somewhat
lower than one might expect, suggesting that there is room to enhance the performance of the engine through
perhaps more than one means.
D. Comparison of Numerical Predictions to AME Altitude Data
The altitude engine configuration was tested over a range of mixture ratios at the White Sands Test Facility
(WSTF). The test configuration, engine, and performance data are discussed in detail in Stiegemeier.9 The same
correction for effective chamber pressure is assumed in the calculation of the characteristic velocity and its
efficiency. This pressure is used to calculate both measured and projected C* values. Note in Fig. 2b there is
evidence of a large boundary layer at the exit of the nozzle but that the flow shows no evidence of shocks from
overexpansion. The exit pressure is predicted to be more than a factor of 5 higher than the background pressure
during the test. No direct measurement of the boundary layer thickness was made during testing. However,
overlap of an in-situ scale to the image suggests that the displacement thickness at the exit of the nozzle is on the
order of 1.5 inches. TDK predicts a displacement thickness of 0.6 inches. However, the VIPER code indicates a
thickness of 1.4 inches without a significant difference in performance estimation. For both cases, a fully turbulent
boundary layer was assumed.
As with the RCE, the radial MR variation assumed in the sea-level AME cases was carried over into the altitude
modeling. Axial vaporization and mixing and thereby C* was maintained as a function of MR from the sea-level
data. Following this convention, it is possible to evaluate the extension of atmospheric data to altitude data for the
larger engine. Differences in the predicted performance might then be attributed to the accuracy of the expansion
modeling and not to the modeling of the combustion chamber.
Figure 7 compares the predicted and measured specific impulse for the altitude testing. The predicted specific
impulses are within 1% of the measured values, but always are slightly underpredicting. The reason for this
underprediction is unclear. However, there is again a 2 to 2.5 % uncertainty in the measured values (±7 to 10 s) and
the uncertainty in the predicted values is at least as large given the assumptions regarding mixing. One obvious
possibility is the inclusion of ablative material in the plume as ―free‖ propellant which will increase thrust.
However, post-test inspection of the liner showed negligible ablation, much less the 5.5 lbm needed to provide the
additional flow rate.
Figure 18compares the predicted and measured thrust as a function of MR. Again these follow the same trend
due to the nature of the modelling, but are in very good agreement with the measured values.
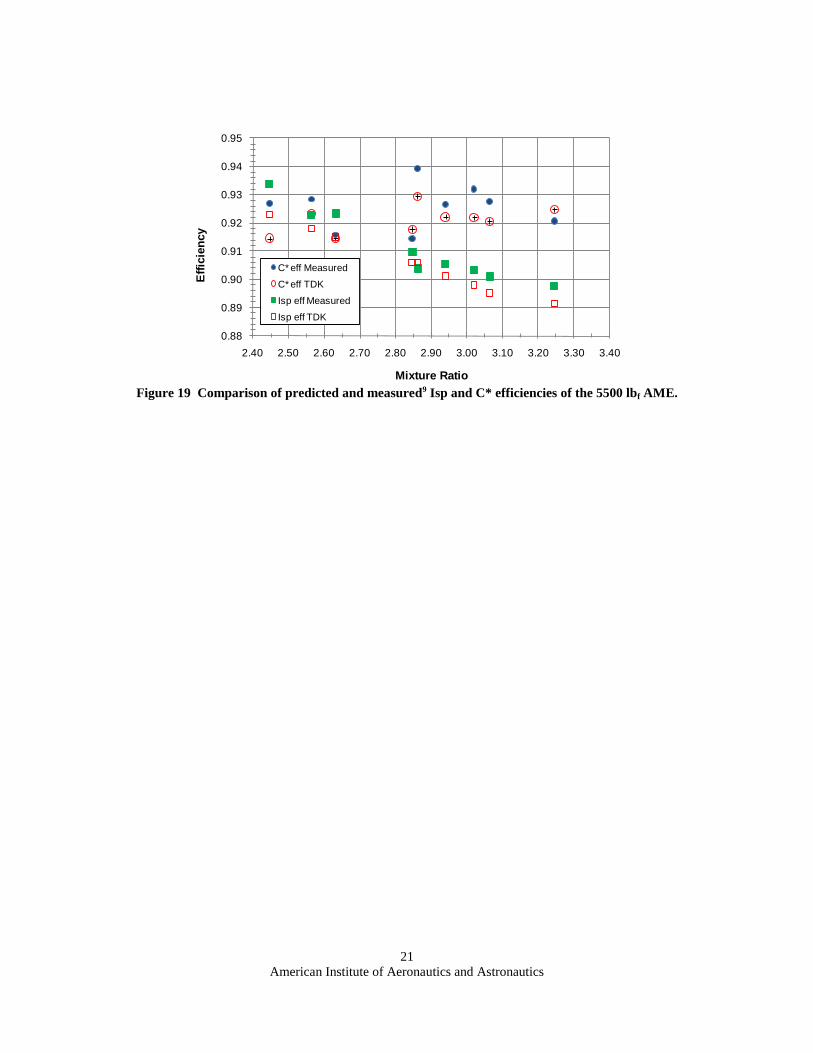
Figure 19 compares the C* and ISP efficiencies as a function of MR. There is very good agreement between
values and trends. Note that the two efficiencies no longer follow the same trend which reflects the impact of the
larger nozzle. As expected, there are greater nozzle-induced losses in for the altitude cases. Table 5 provides a
summary of the altitude data and predictions for those points.
V. Discussion
Good agreement between measured and predicted performance has been demonstrated. Key to this agreement
was capturing C* in a way that preserved the mass flow rate. The assumptions used in this analysis were self-
consistent, but may have masked the impact of other parameters since significant uncertainty remains in the
estimation of the effective chamber pressure, the vaporization rate, and in the radial mixing of the reacting streams.
However, the modification of vaporization rates and mixing rates yields trends with MR which now follow
experimental data for both small and large thrusters.

American Institute of Aeronautics and Astronautics
10
The use of the ENTRAINMENT function in VIPER to incorporate the effects of non-ideal combustion appears
to be of value. In addition to capturing the effects of vaporization, it provided a means to decrease the performance
in accordance with predicted total-pressure losses associated with energy addition in the combustion chamber.
Detailed vaporization and mixing data for elements as a function of MR are needed to extend the predictive
capability of this approach.
VIPER appears to offer significant advantages over TDK. These include the ENTRAINMENT capability and a
more robust calculation of boundary layer thicknesses. Together, these give a much better prediction of wall
temperatures, overall performance, and sensitivity to injector design. In particular, capturing the relatively flat
performance curve enables a more accurate assesment of the impact of operating off-stoichiometric MR on
performance. Basing a design on the peaks in the TDK-PI curves suggests significantly poorer performance than is
observed at the cooler-operating lower MR. The procedures demonstrated in this analysis capture the trends in the
observed performance and may allow the designing of injectors to the lower MR with confidence in reasonable
performance.
The demonstrated performance of the AME at altitude is a significant improvement over state of the art
hypergolic systems. There is roughly a 20 s increase in specific impulse over the more advanced hydrazine engines
and as much as 50 s above the Shuttle OMS engine.21
With the tested injector, the engine could operate for several
hundred if not a few thousand seconds before the throat area increased prohibitively. The modeling presented here
suggests several approaches to improving the performance. These agree with Aerojet internal analyses which
include adjusting the distribution of MR across the face of the injector and optimizing the film cooling layer. These
improvements, which are not prohibitive, are projected to yield a several percent increase in overall efficiency.
VI. Conclusion
Good agreement between measured and predicted performance has been demonstrated using the VIPER code
with modified vaporization and mixing profiles as a function of mixture ratio. Predicted values of specific impulse
and characteristic exhaust velocity were within 1 percent of the measured values for both a small RCE thruster and a
large AME thruster. The agreement shown between the measured altitude data and the projected performance based
on sea-level data increases the confidence in making these projections in the future.
Key to achieving the agreement between measured and predicted performance was capturing C* in a way that
preserved the mass flow rate. This agreement was achieved primarily by varying the vaporization and mixing rates
with MR. In this way, significant deviation from the ODE profiles are achieved and reasonable assessment of
performance can be made. This technique, may enable the optimization of methane thrusters to lower MR, which
was previously thought to incur a prohibitively low performance.
VIPER appears to offer significant advantages over TDK. It offers several mechanisms for incorporating non-
ideal combustion. It is possible that a true vaporization model may be incorporated into this as well, but, as shown,
the effect is more complex than simple vaporization. In this regard, VIPER offers significantly more flexibility than
TDK.
References
1Motil, S., Meyer, M., and Tucker, S., ―Cryogenic Fluid Management Technologies for Advanced Green Propulsion Systems,‖
AIAA Paper 2007-343, January, 2007.
2Collins, J., Hurbert, E., Rornig, K., Melcher, J. C., Hobson, A., and Eaton, P., ―Sea-Level Flight Demonstration and Altitude
Characterization of a LO2/LCH4 Based Ascent Propulsion Lander,‖ AIAA Paper 2009-4948, August, 2009.
3Robinson, P.J., Veith, E.M., Hurlbert, E.A., Jimenez, R., and Smith, T.D., "100-lbf LO2/LCH4 - Reaction Control Engine
Technology Development for Future Space Vehicles", 59th International Astronautical Federation, Glasgow, Scotland, United
Kingdom, September 29 - October 3, 2008.
4Marshall, W. M., and Kleinhenz, J. E., ―Hot-Fire Testing of a 100lbf LOX/LCH4 Reaction Control Engine at Altitude
Conditions,‖ JANNAF Propulsion Meeting, May, 2010.
5Stiegemeier, B. R., and Marshall, W. M., ―Sea-Level Testing of a 100-lbf LOX/Methane Reaction Control Engine,‖ JANNAF
Propulsion Meeting, May, 2010.
6Williams, G., J., and Stiegemeier, B. R., ―Performance Modeling of a Pressure-fed LOX-Methane 100-lbf–Class Engine,‖
JANNAF Propulsion Meeting, December, 2011.

American Institute of Aeronautics and Astronautics
11
7Donahue, B., Grayson, G., Caplin, G., Smith, D. B., and Reiley, K., ―Lunar Lander Ascent Module Configuration and
Propulsion Studies,‖ IAAA Paper 2009-6406, September 2009.
8Robinson, P. J., Veith, E. M., Linne, D. L., and Robinson, J. W., ―Design and Development of a 5,500-lbf LOX/LCH4 Ascent
Main Engine,‖ 57th JANNAF Propulsion Meeting, May, 2010.
9Stiegemeier, B. R., Williams, G. J., Melcher, J. C., and Robinson, J. W., ―Altitude Testing of an Ascent Stage LOX/Methane
Main Engine,‖ 57th JANNAF Propulsion Meeting, May, 2010.
10Williams, G. J., and Stiegemeier, B. R., ―Performance Modeling of a Pressure-fed LOX-Methane 5500-lbf Engine,‖ JANNAF
Propulsion Meeting, May, 2010.
11Smith, T. A., et al., ―Comparison of Theoretical and Experimental Thrust Performance of a 1030:1 Area Ratio Rocket Nozzle at
a Chamber Pressure of 2413 kN/m2 (350 psia),‖ AIAA Paper 87-2069 (NASA TP-2725), August 1987.
12Pavli, A. J., Kacynski, K. J., and Smith, T. A., ―Experimental Thrust Performance of a High-Area-Ratio Rocket Nozzle,‖
NASA TP-2720, 1987.
13Miyajima, H., and Nakahashi, K., ―Performance of a Low Thrust LO2/LH2 Engine with a 300:1 Area Ratio Nozzle,‖ AIAA
Paper 83-1313, 1983.
14Jankovsky, R. S., Smith, T. D., and Pavli, A. J., ―High-Area-Ratio Rocket Nozzle at High Combustion Chamber Pressure—
Experimental and Analytical Validation,‖ NASA TP-1999-208522, June, 1999.
15Nickerson, G. R., et al., ―Two-Dimensional Kinetics (TDK) Nozzle Performance Computer Program, Vols I-III, User Manual,
NAS8-39048, March, 1993.
16Viscous Interaction Performance Evaluation Routine for Two-Phase Nozzle Flows with Finite Rate Chemistry,‖ Viper 3.6
User’s Guide, Software and Engineering Associates, Inc., 2004.
17JANNAF Rocket Engine Performance Prediction and Evaluation Manual, CPIA-PUBL-246, Chemical Propulsion Information
Agency, 1975.
18 SCAP: Spray Combustion Analysis Program, Software and Engineering Associates, Inc., March, 2005.
19Priem, R. J., and Heidmann, M. F., ―Propellant vaporization as a Design Criterion for Rocket engine Combustion Chambers,‖
NASA TR R-67, 1960.
20Westley, Francis, ―Table of Recommended Rate Constants for Chemical Reactions Occurring in Combustion,‖ National Bureau
of Standards, April, 1980.
21. Neill, T., Judd, D., Veith, E., and Rousar, D., ―Practical Uses of Liquid Methane in Rocket Engine Applications,‖ IAC Paper
06-C4.1.01, October, 2006.
American Institute of Aeronautics and Astronautics
12
Table 1 Nominal Characteristics of the Aerojet thrusters modeled.
RCE AME
Configuration Sea-level Altitude Sea-level Altitude
Nominal Thrust, lbf 85 100 4800 5500
Expansion Ratio 3 45 1.9 128
Chamber pressure, psi 175 250
MR Range 1.80 – 3.25 2.00 – 4.25
Table 2 A Comparison of Predicted (VIPER) and Measured3 Sea-Level RCE Performance.
MR L-prime,
in
Inlet conditions Thrust, lbf , lbm/s C*, ft/s
Tox-inj
deg R
Tf-inj
deg R po*
psia Measured VIPER Measured VIPER Measured VIPER
2.00 2.5 185 (204) 185 85.5 88.0 0.328 0.348 5420 5350
2.40 2.5 175 185 186 86.0 88.0 0.322 0.350 5370 5330
2.50 2.5 (189) (204) 189 88.8 89.0 0.339 0.354 5360 5270
2.65 2.5 214 240 191 89.4 91.0 0.343 0.340 5305 5350
2.80 2.5 189 204 189 88.7 91.0 0.340 0.360 5370 5180
3.13 2.5 189 204 189 88.7 91.0 0.340 0.363 5370 5180
MR Specific Impulse, s C* Isp
Measured VIPER Measured VIPER Measured VIPER
2.00 260 260.. 0.929 0.932 0.929 0.945
2.40 257 259. 0.895 0.899 0.886 0.906
2.50 262 262. 0.890 0.874 .898 0.898
2.65 261 260. 0.885 0.884 0.890 0.887
2.80 261 258. 0.885 0.855 0.888 0.881
3.13 260 257. 0.885 0.855 0.892 0.875
Table 3 A Comparison of Predicted (VIPER) and Measured4 Altitude RCE Performance.
MR
Inlet conditions Thrust, lbf , lbm/s C*, ft/s
Tox-inj
deg R
Tf-inj
deg R po*
psia Measured
VIPE
R Measured VIPER Measured VIPER
1.80 233 222 172 94.4 105 0.308 0.350 5480 5330
2.00 222 215 187 103 105 0.332 0.348 5400 5350
2.40 217 217 190 105 106 0.344 0.350 5450 5330
2.55 219 218 189 105 110 0.329 0.354 5280 5370
2.60 219 218 189 105 105 0.345 0.340 5300 5350
2.80 227 220 181 101 100 0.350 0.360 5320 5180
MR Specific Impulse, s C* Isp
Measured VIPER Measured VIPER Measured VIPER
1.80 308 299 0.988 0.962 0.972 0.944
2.00 310 300 0.939 0.945 0.916 0.910
2.40 307 312 0.909 0.899 0.880 0.881
2.55 300 309 0.874 0.874 0.843 0.875
2.60 308 310 0.876 0.884 0.862 0.863
2.80 296 310 0.877 0.860 0.817 0.854
American Institute of Aeronautics and Astronautics
13
Table 4 Comparison of measured8 and predicted (VIPER) sea-level performance of the AME engine.
MR Pc, psia Thrust, lbf , lbm/s C*, ft/s
At Injector po* Measured VIPER Measured VIPER Measured VIPER
2.15 259.3 242.5 3882 3887 15.68 15.74 5644 5624
2.29 267.5 252.2 4042 4046 16.17 16.25 5694 5664
2.54 269.7 254.4 4080 4082 16.23 16.34 5722 5683
2.68 271.3 255.4 4102 4100 16.50 16.43 5650 5675
2.84 259.4 243.3 3911 3906 15.69 15.73 5660 5647
2.90 245.5 229.7 3694 3684 14.83 14.88 5653 5634
2.94 268.0 251.8 4049 4044 16.31 16.29 5635 5640
3.00 253.9 238.3 3833 3826 15.58 15.46 5582 5626
3.01 261.1 245.2 3945 3938 15.86 15.93 5643 5617
3.08 275.2 259.1 4170 4162 16.84 16.86 5617 5609
3.14 249.7 234.3 3771 3763 16.28 15.28 5254 5595
MR Specific Impulse, s C* Isp
Measured VIPER Measured VIPER Measured VIPER
2.15 247.6 247.0 0.954 0.951 0.935 0.933
2.29 248.7 248.9 0.950 0.945 0.925 0.926
2.54 251.5 249.8 0.943 0.937 0.922 0.915
2.68 248.6 249.5 0.929 0.933 0.907 0.911
2.84 249.2 248.4 0.931 0.929 0.909 0.906
2.90 249.0 247.5 0.931 0.928 0.908 0.903
2.94 248.3 248.2 0.929 0.930 0.906 0.906
3.00 246.0 247.6 0.922 0.929 0.899 0.904
3.01 248.7 247.2 0.932 0.928 0.908 0.903
3.08 247.7 246.9 0.930 0.928 0.906 0.903
3.14 231.8 246.2 0.872 0.928 0.850 0.903
Table 5 Comparison of measured9 and predicted (VIPER) altitude performance of the AME engine.
MR A*, in2 Pc, psia Thrust, lbf , lbm/s C*, ft/s
At Injector po* Measured VIPER Measured VIPER Measured VIPER
2.45 11.60 256.8 241.4 5428 5376 16.05 15.80 5649 5766
2.56 11.48 256.5 241.1 5402 5285 15.95 15.58 5676 5722
2.63 11.59 260.8 245.2 5539 5440 16.25 15.92 5676 5746
2.85 11.56 261.0 245.3 5568 5461 16.29 15.93 5690 5731
2.86 11.42 252.0 236.9 5197 5212 15.47 15.27 5649 5704
2.94 11.51 254.0 243.8 5415 5424 15.83 15.85 5677 5700
3.02 11.45 256.5 241.1 5461 5341 15.93 15.59 5650 5701
3.06 11.54 254.0 238.8 5448 5334 15.87 15.56 5676 5700
3.25 11.57 260.8 245.2 5616 5499 16.37 16.03 5649 5697
MR Specific Impulse, s C* Isp
Measured VIPER Measured VIPER Measured VIPER
2.45 340.3 340.2 0.939 0.936 0.934 0.933
2.56 340.6 339.3 0.930 0.943 0.923 0.927
2.63 343.0 341.8 0.939 0.933 0.923 0.923
2.85 343.8 342.9 0.939 0.933 0.910 0.913
2.86 341.9 341.3 0.936 0.944 0.904 0.911
2.94 344.2 342.1 0.931 0.937 0.905 0.909
3.02 344.8 342.5 0.938 0.937 0.903 0.906
3.06 344.6 342.7 0.935 0.935 0.901 0.903
3.25 345.3 343.0 0.939 0.938 0.898 0.900
American Institute of Aeronautics and Astronautics
14
265
285
305
325
345
365
385
1.75 2.00 2.25 2.50 2.75 3.00 3.25
Sp
ecif
ic I
mp
uls
e, s
Mixture Ratio
ODE
ODF
TDK-PI
Measured
a. Sea-level at Aerojet b. Altitude at NASA GRC.
Figure 1 Images of RCE testing.
a. Sea-level at Aerojet b. Altitude at NASA WSTF.
Figure 2 Images of AME testing.
a. Sea-level b. Altitude.
c. Sea-level d. Altitude
Figure 3 Comparison of specific impulse trends for the RCE (a-b) and the AME (c-d).
210
220
230
240
250
260
270
280
2.0 2.5 3.0 3.5 4.0 4.5
Sp
ecif
ic I
mp
uls
e, s
Mixture Ratio
ODE
TDK-PI
ODF
Data
SCAP
300
320
340
360
380
400
2.0 2.5 3.0 3.5 4.0 4.5
Sp
ecif
ic I
mp
uls
e, s
Mixture Ratio
ODE
TDK-PI
ODF
Data
SCAP
225
235
245
255
265
275
285
295
1.75 2.00 2.25 2.50 2.75 3.00 3.25
Sp
ecif
ic I
mp
uls
e, s
Mixture Ratio
ODE
TDK-PI
ODF
Measured

American Institute of Aeronautics and Astronautics
15
a. Vaporization curves. The “shortened” and “extended” curves arbitrarily increase or decrease the rate of
vaporization respectively
b. VIPER-SCAP calculated vaporization profiles.
.
c. C* efficiency as a function of MR for the AME. The upper curve reflects adjustment to the curve in 4a for
LOX-limited vaporization. The lower curve adds the C* deficit associated with the best-estimate of MR
variation across the face of the injector.
Figure 4 Correlation of performance with axial mixing (via vaporization) and radial mixing.
0.5
0.6
0.7
0.8
0.9
1.0
0.0 0.5 1.0 1.5 2.0 2.5 3.0 3.5 4.0
Fra
cti
on
of
Va
pro
iza
tio
n
Axial Position, X/R
Shortened
Nominal
Extended
0.75
0.80
0.85
0.90
0.95
1.00
0.0 0.5 1.0 1.5 2.0 2.5 3.0 3.5 4.0
Fra
ctio
n o
f V
ap
ori
zati
on
Axial Position, X/R
CH4, MR=2.0
CH4, MR=3.5
LOX, MR=3.5
LOX, MR=2.0
0.92
0.93
0.94
0.95
0.96
0.97
0.98
0.99
1.00
2.2 2.3 2.4 2.5 2.6 2.7 2.8 2.9 3.0 3.1 3.2
C-s
tar
Eff
icie
ncy
Mixture Ratio
Nominal Adjusted
Coupled to MR losses
American Institute of Aeronautics and Astronautics
16
a. RCE wall temperature profiles.
b. AME wall temperature profiles
Figure 5 Comparison of wall temperature profiles.
Figure 6 Comparison of predicted and measured3 specific impulse for sea-level
operation of the 100 lbb RCE.
240
245
250
255
260
265
270
1.8 2.0 2.3 2.5 2.8 3.0 3.3
Sp
ec
ific
Im
pu
lse
, s
Mixture Ratio
20 % FFC
30% FFC
VIPER 20% FFC
VIPER: 30% FFC
American Institute of Aeronautics and Astronautics
17
Figure 7 Comparison of predicted and measured3 thrust for sea-level
operation of the 100 lbb RCE. PC was varied to match PC in the data.
Figure 8 Comparison of predicted and measured3 C* efficiency for sea-level operation of the 100 lbb RCE.
Figure 9 Comparison of predicted and measured3 Isp efficiency for sea-level operation of the 100 lbb RCE.
80
82
84
86
88
90
92
94
96
98
100
1.8 2.0 2.3 2.5 2.8 3.0 3.3
Th
rus
t, l
bf
Mixture Ratio
20 % FFC
30% FFC
VIPER 20% FFC
VIPER: 30% FFC
0.70
0.75
0.80
0.85
0.90
0.95
1.00
1.5 2.0 2.5 3.0 3.5
C-s
tar
Eff
icie
ncy
Mixture Ratio
20 % FFC
30% FFC
VIPER: 20% FFC
VIPER: 30% FFC
0.80
0.82
0.84
0.86
0.88
0.90
0.92
0.94
0.96
0.98
1.00
1.75 2.00 2.25 2.50 2.75 3.00 3.25
Isp
Eff
icie
ncy
Mixture Ratio
20 % FFC
30% FFC
VIPER: 20% FFC
VIPER: 30% FFC
American Institute of Aeronautics and Astronautics
18
Figure 10 Comparison of predicted and measured
4 specific impulse for altitude
operation of the 100 lbb RCE. Markers are data for cold to nominal inlet conditions.
Figure 11 Comparison of predicted and measured
4 thrust for altitude
operation of the 100 lbb RCE. Markers are data for cold to nominal inlet conditions.
Figure 12 Comparison of predicted and measured4 C* efficiency for altitude operation of the 100 lbb RCE.
Markers are data for cold to nominal inlet conditions.
280
290
300
310
320
330
1.8 2.0 2.2 2.4 2.6 2.8 3.0
Sp
ecif
ic I
mp
uls
e, s
Mixture Ratio
Measured
VIPER
90
95
100
105
110
115
120
1.8 2.0 2.2 2.4 2.6 2.8 3.0
Th
rust
, lb
f
Mixture Ratio
Measured
VIPER
0.82
0.84
0.86
0.88
0.90
0.92
0.94
0.96
0.98
1.00
1.8 2.0 2.2 2.4 2.6 2.8 3.0
C* E
ffic
ien
cy
Mixture Ratio
Measured
VIPER

American Institute of Aeronautics and Astronautics
19
Figure 13 Comparison of predicted and measured
4 ISP efficiency for altitude operation. Markers are data for
cold to nominal inlet conditions.
Figure 14 Comparison of predicted and measured8 sea-level specific impulse for the 5500 lbf AME.
Figure 15 Comparison of predicted and measured8 thrusts for the sea-level chamber of the 5500 lbf AME. PC
was varied to match PC in the data.
0.75
0.80
0.85
0.90
0.95
1.00
1.8 2 2.2 2.4 2.6 2.8 3
I SP
Eff
icie
ncy
Mixture Ratio
Measured
VIPER
240
242
244
246
248
250
252
254
256
258
260
2.00 2.25 2.50 2.75 3.00 3.25
Sp
ecif
ic I
mp
uls
e, s
Mixture Ratio
Data
VIPER
3500
3600
3700
3800
3900
4000
4100
4200
4300
4400
4500
2.00 2.25 2.50 2.75 3.00 3.25 3.50
Th
rust
, lb
f
Mixture Ratio
Data
VIPER
American Institute of Aeronautics and Astronautics
20
Figure 16 Comparison of predicted and measured8 Isp and C* efficiencies at sea-level for the 5500 lbf AME.
Figure 17 Comparison of predicted and measured9 specific impulse for altitude testing of the 5500 lbf AME.
Figure 18 Comparison of predicted and measured9 thrust for altitude testing of the 5500 lbf AME.
0.88
0.89
0.9
0.91
0.92
0.93
0.94
0.95
0.96
2.00 2.25 2.50 2.75 3.00 3.25 3.50
Eff
icie
ncy
Mixture Ratio
C* eff Measured
C* eff VIPER
Isp eff Measured
Isp effVIPER
5000
5100
5200
5300
5400
5500
5600
5700
5800
5900
6000
2.40 2.50 2.60 2.70 2.80 2.90 3.00 3.10 3.20 3.30 3.40
Th
rust
, lb
f
Mixture Ratio
Measured
VIPER
330
332
334
336
338
340
342
344
346
348
350
2.40 2.50 2.60 2.70 2.80 2.90 3.00 3.10 3.20 3.30 3.40
Sp
ecif
ic I
mp
uls
e, s
Mixture Ratio
Measured
VIPER
American Institute of Aeronautics and Astronautics
21
Figure 19 Comparison of predicted and measured9 Isp and C* efficiencies of the 5500 lbf AME.
0.88
0.89
0.90
0.91
0.92
0.93
0.94
0.95
2.40 2.50 2.60 2.70 2.80 2.90 3.00 3.10 3.20 3.30 3.40
Eff
icie
ncy
Mixture Ratio
C* eff Measured
C* eff TDK
Isp eff Measured
Isp eff TDK