Vanguard’s economic & market outlook - CFA Institute Outlook... · Vanguard global dashboard of...
40
FOR FINANCIAL ADVISORS ONLY. NOT FOR PUBLIC DISTRIBUTION. Vanguard’s economic & market outlook Vanguard Investment Strategy Group
Transcript of Vanguard’s economic & market outlook - CFA Institute Outlook... · Vanguard global dashboard of...

FOR FINANCIAL ADVISORS ONLY. NOT FOR PUBLIC DISTRIBUTION.
Vanguard’s economic & market outlook Vanguard Investment Strategy Group
2 FOR FINANCIAL ADVISORS ONLY. NOT FOR PUBLIC DISTRIBUTION.
• In this presentation, Vanguard presents our perspectives on the future of growth, inflation, interest rates, and the returns on stocks, bonds, and other asset classes
• The asset-return distributions shown here represent Vanguard’s view on the potential range of risk premiums that may occur over the next ten years; such long-term projections are not intended to be extrapolated into a short-term view of the next year
• Vanguard firmly believes that the principles of portfolio construction remain unchanged given our expected outlook for stocks and bonds
• For further details not addressed in this presentation, please refer to the full Vanguard research paper (cover shown here)
Vanguard’s distinct approach to the economic and investment outlook
Vanguard’s distinct approach to forecasting
To treat the future with the deference it deserves, Vanguard believes
that market forecasts are best viewed in a probabilistic framework.
This publication’s primary objectives are to describe the projected
long-term return distributions that contribute to strategic asset
allocation decisions and to present the rationale for the ranges and
probabilities of potential outcomes. This analysis discusses our
global outlook from the perspective of a U.S. investor with a dollar-
denominated portfolio.
Vanguard Research December 2015
3 FOR FINANCIAL ADVISORS ONLY. NOT FOR PUBLIC DISTRIBUTION.
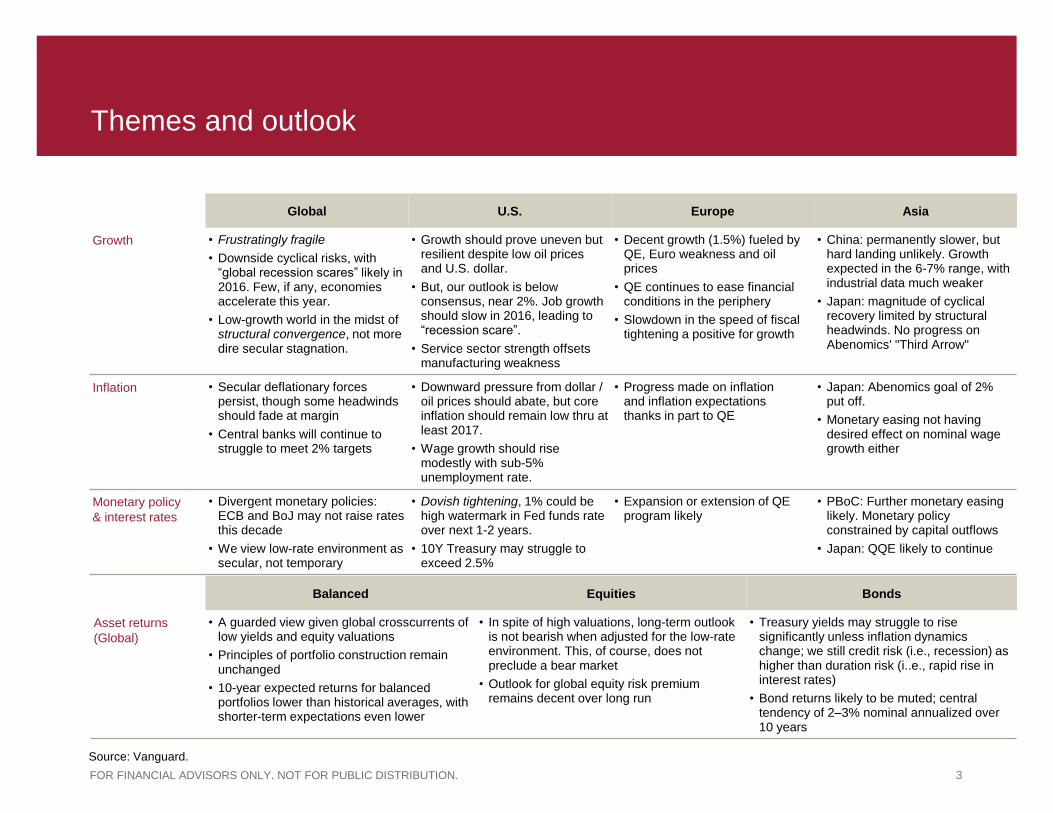
Themes and outlook
Global U.S. Europe Asia
Growth • Frustratingly fragile
• Downside cyclical risks, with “global recession scares” likely in 2016. Few, if any, economies accelerate this year.
• Low-growth world in the midst of structural convergence, not more dire secular stagnation.
• Growth should prove uneven but resilient despite low oil prices and U.S. dollar.
• But, our outlook is below consensus, near 2%. Job growth should slow in 2016, leading to “recession scare”.
• Service sector strength offsets manufacturing weakness
• Decent growth (1.5%) fueled by QE, Euro weakness and oil prices
• QE continues to ease financial conditions in the periphery
• Slowdown in the speed of fiscal tightening a positive for growth
• China: permanently slower, but hard landing unlikely. Growth expected in the 6-7% range, with industrial data much weaker
• Japan: magnitude of cyclical recovery limited by structural headwinds. No progress on Abenomics' "Third Arrow"
Inflation • Secular deflationary forces persist, though some headwinds should fade at margin
• Central banks will continue to struggle to meet 2% targets
• Downward pressure from dollar / oil prices should abate, but core inflation should remain low thru at least 2017.
• Wage growth should rise modestly with sub-5% unemployment rate.
• Progress made on inflation and inflation expectations thanks in part to QE
• Japan: Abenomics goal of 2% put off.
• Monetary easing not having desired effect on nominal wage growth either
Monetary policy
& interest rates
• Divergent monetary policies: ECB and BoJ may not raise rates this decade
• We view low-rate environment as secular, not temporary
• Dovish tightening, 1% could be high watermark in Fed funds rate over next 1-2 years.
• 10Y Treasury may struggle to exceed 2.5%
• Expansion or extension of QE program likely
• PBoC: Further monetary easing likely. Monetary policy constrained by capital outflows
• Japan: QQE likely to continue
Balanced Equities Bonds
Asset returns
(Global)
• A guarded view given global crosscurrents of low yields and equity valuations
• Principles of portfolio construction remain unchanged
• 10-year expected returns for balanced portfolios lower than historical averages, with shorter-term expectations even lower
• In spite of high valuations, long-term outlook is not bearish when adjusted for the low-rate environment. This, of course, does not preclude a bear market
• Outlook for global equity risk premium remains decent over long run
• Treasury yields may struggle to rise significantly unless inflation dynamics change; we still credit risk (i.e., recession) as higher than duration risk (i..e., rapid rise in interest rates)
• Bond returns likely to be muted; central tendency of 2–3% nominal annualized over 10 years
Source: Vanguard.
4 FOR FINANCIAL ADVISORS ONLY. NOT FOR PUBLIC DISTRIBUTION.
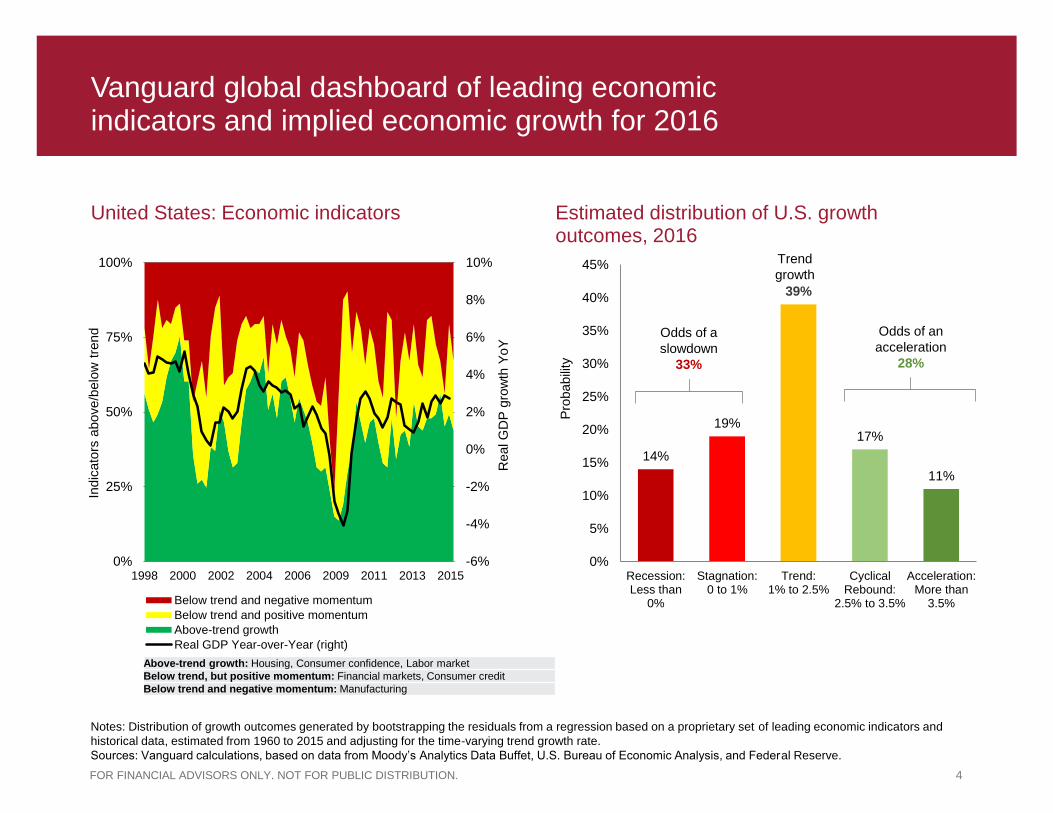
14%
19%
39%
17%
11%
0%
5%
10%
15%
20%
25%
30%
35%
40%
45%
Recession:Less than
0%
Stagnation:0 to 1%
Trend:1% to 2.5%
CyclicalRebound:
2.5% to 3.5%
Acceleration:More than
3.5%
Pro
babili
ty
Odds of a
slowdown
33%
Trend
growth
Odds of an
acceleration
28%
Vanguard global dashboard of leading economic indicators and implied economic growth for 2016
United States: Economic indicators Estimated distribution of U.S. growth outcomes, 2016
-6%
-4%
-2%
0%
2%
4%
6%
8%
10%
0%
25%
50%
75%
100%
1998 2000 2002 2004 2006 2009 2011 2013 2015
Real G
DP
gro
wth
YoY
Indic
ato
rs a
bove/b
elo
w t
rend
Below trend and negative momentum
Below trend and positive momentum
Above-trend growth
Real GDP Year-over-Year (right)
Above-trend growth: Housing, Consumer confidence, Labor market
Below trend, but positive momentum: Financial markets, Consumer credit
Below trend and negative momentum: Manufacturing
Notes: Distribution of growth outcomes generated by bootstrapping the residuals from a regression based on a proprietary set of leading economic indicators and
historical data, estimated from 1960 to 2015 and adjusting for the time-varying trend growth rate.
Sources: Vanguard calculations, based on data from Moody’s Analytics Data Buffet, U.S. Bureau of Economic Analysis, and Federal Reserve.

5 FOR FINANCIAL ADVISORS ONLY. NOT FOR PUBLIC DISTRIBUTION.
0%
1%
2%
3%
4%
5%
6%
7%
2000-2015 2016-2020
Annualiz
ed G
DP
gro
wth
Emerging markets
Developed markets
Convergence
Structural deceleration = growth convergence
Demographic headwinds Narrowing growth gap
0.35%
0.45%
0.55%
0.65%
0.75%
1.0%
1.5%
2.0%
2.5%
3.0%
1980-2000 2000-2015 2015-2020
Pe
rio
d a
ve
rag
e g
row
th r
ate
(a
nn
ua
l %
)
Peri
od a
vera
ge g
row
th r
ate
(annua
l)
Emerging markets (left axis)
Developed markets (right axis)
Notes: Population growth and potential GDP data and projections based on IMF estimates of output gap and real GDP growth by country. Developed and emerging market
group totals estimated as GDP-weighted average of individual countries. Groupings follow IMF designation.
Sources: Vanguard, based on data from International Monetary Fund—World Economic Outlook, October 2015.
6 FOR FINANCIAL ADVISORS ONLY. NOT FOR PUBLIC DISTRIBUTION.
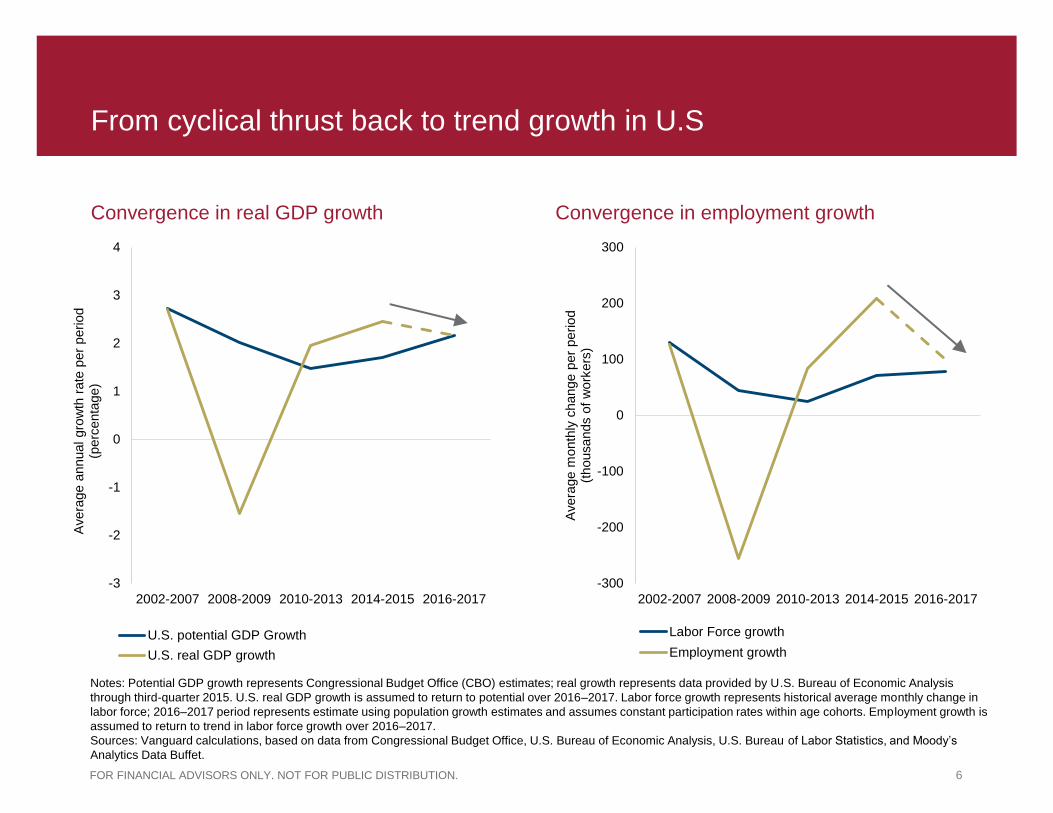
From cyclical thrust back to trend growth in U.S
Convergence in real GDP growth Convergence in employment growth
-3
-2
-1
0
1
2
3
4
2002-2007 2008-2009 2010-2013 2014-2015 2016-2017
Avera
ge a
nnual gro
wth
rate
per
period
(p
erc
enta
ge)
U.S. potential GDP Growth
U.S. real GDP growth
-300
-200
-100
0
100
200
300
2002-2007 2008-2009 2010-2013 2014-2015 2016-2017
Avera
ge m
onth
ly c
hange p
er
period
(t
housands o
f w
ork
ers
)
Labor Force growth
Employment growth
Notes: Potential GDP growth represents Congressional Budget Office (CBO) estimates; real growth represents data provided by U.S. Bureau of Economic Analysis
through third-quarter 2015. U.S. real GDP growth is assumed to return to potential over 2016–2017. Labor force growth represents historical average monthly change in
labor force; 2016–2017 period represents estimate using population growth estimates and assumes constant participation rates within age cohorts. Employment growth is
assumed to return to trend in labor force growth over 2016–2017.
Sources: Vanguard calculations, based on data from Congressional Budget Office, U.S. Bureau of Economic Analysis, U.S. Bureau of Labor Statistics, and Moody’s
Analytics Data Buffet.
7 FOR FINANCIAL ADVISORS ONLY. NOT FOR PUBLIC DISTRIBUTION.
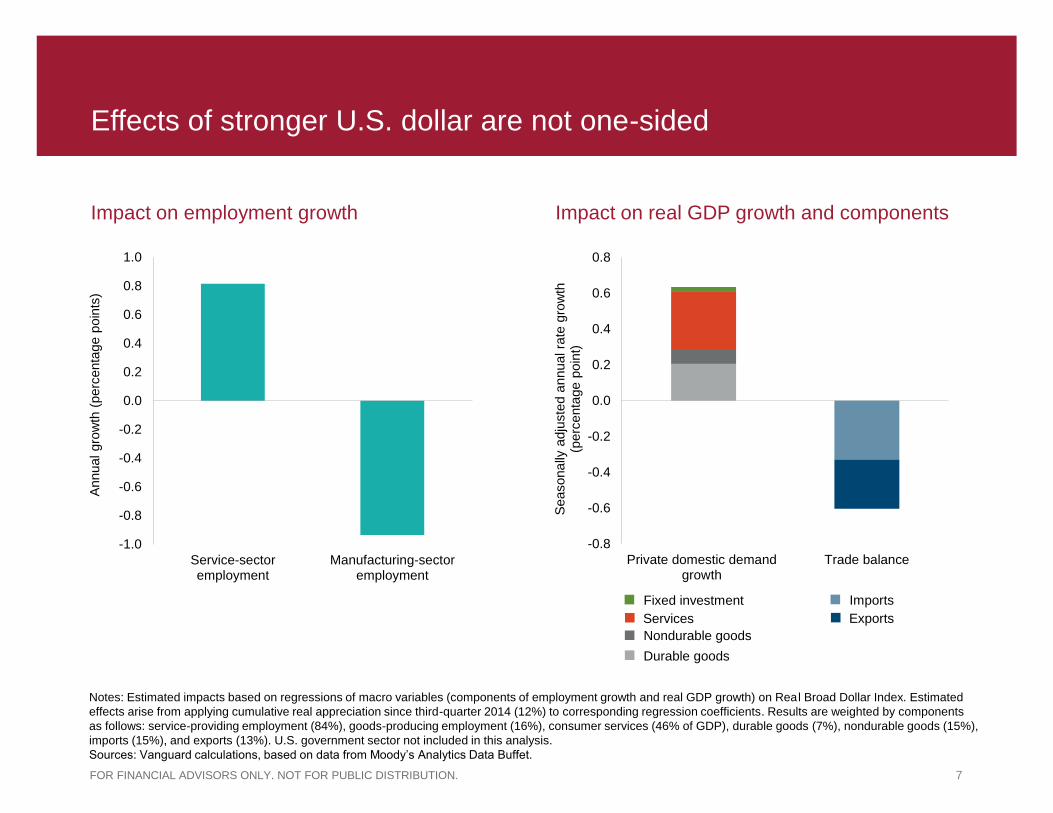
Effects of stronger U.S. dollar are not one-sided
Impact on employment growth Impact on real GDP growth and components
-1.0
-0.8
-0.6
-0.4
-0.2
0.0
0.2
0.4
0.6
0.8
1.0
Service-sectoremployment
Manufacturing-sectoremployment
Annual gro
wth
(perc
enta
ge p
oin
ts)
-0.8
-0.6
-0.4
-0.2
0.0
0.2
0.4
0.6
0.8
Private domestic demandgrowth
Trade balanceS
easonally
adju
ste
d a
nnual ra
te g
row
th
(perc
enta
ge p
oin
t)
Notes: Estimated impacts based on regressions of macro variables (components of employment growth and real GDP growth) on Real Broad Dollar Index. Estimated
effects arise from applying cumulative real appreciation since third-quarter 2014 (12%) to corresponding regression coefficients. Results are weighted by components
as follows: service-providing employment (84%), goods-producing employment (16%), consumer services (46% of GDP), durable goods (7%), nondurable goods (15%),
imports (15%), and exports (13%). U.S. government sector not included in this analysis.
Sources: Vanguard calculations, based on data from Moody’s Analytics Data Buffet.
Fixed investment
Services
Nondurable goods
Durable goods
Imports
Exports
8 FOR FINANCIAL ADVISORS ONLY. NOT FOR PUBLIC DISTRIBUTION.
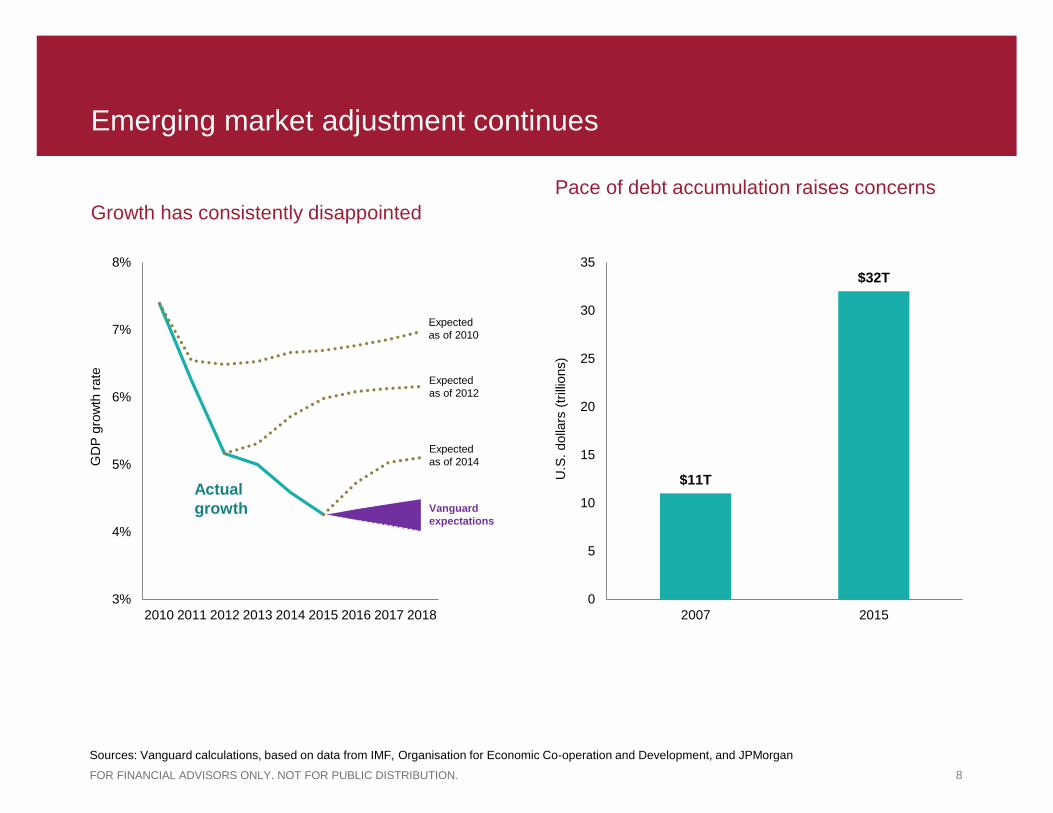
Emerging market adjustment continues
Growth has consistently disappointed
Pace of debt accumulation raises concerns
3%
4%
5%
6%
7%
8%
2010 2011 2012 2013 2014 2015 2016 2017 2018
$11T
$32T
0
5
10
15
20
25
30
35
2007 2015
U.S
. dolla
rs (
trill
ions)
Sources: Vanguard calculations, based on data from IMF, Organisation for Economic Co-operation and Development, and JPMorgan
Expected
as of 2010
Expected
as of 2012
Expected
as of 2014
Vanguard
expectations
GD
P g
row
th r
ate
Actual
growth
9 FOR FINANCIAL ADVISORS ONLY. NOT FOR PUBLIC DISTRIBUTION.
0%
2%
4%
6%
8%
10%
12%
5,000 10,000 15,000 20,000 25,000 30,000
Annual re
al G
DP
gro
wth
GDP per capita (USD)
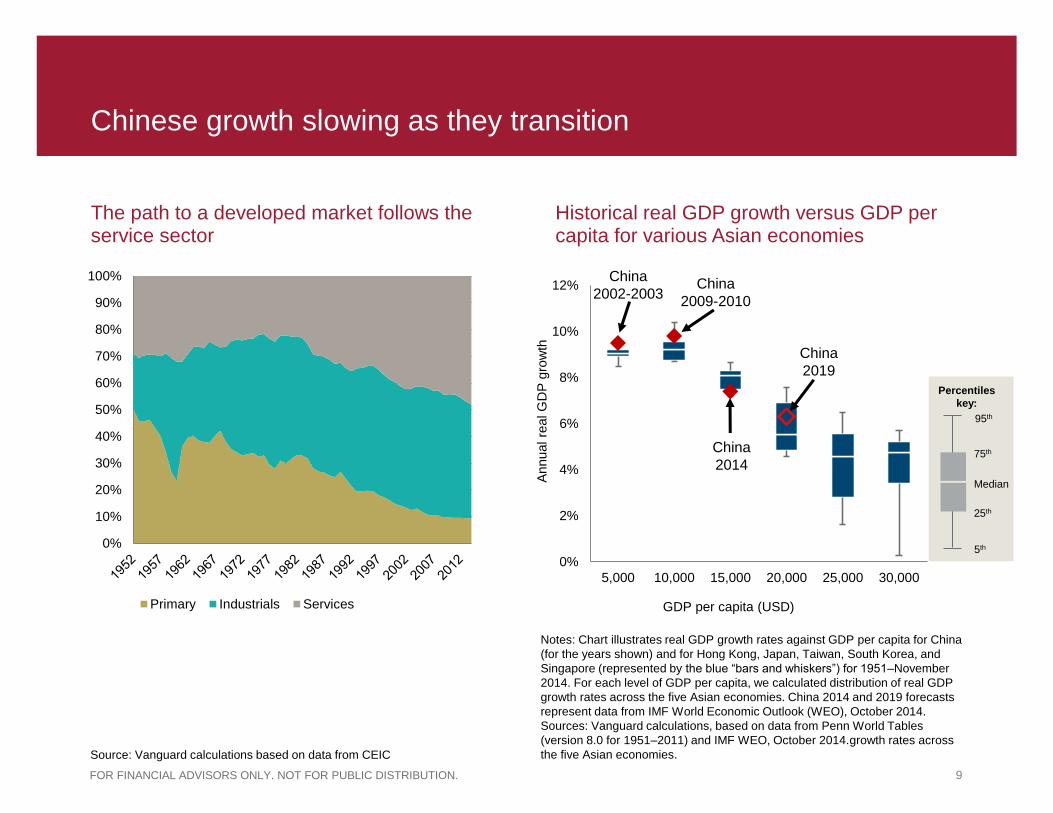
Chinese growth slowing as they transition
The path to a developed market follows the service sector
Historical real GDP growth versus GDP per capita for various Asian economies
China
2002-2003 China
2009-2010
China
2014
China
2019
Notes: Chart illustrates real GDP growth rates against GDP per capita for China
(for the years shown) and for Hong Kong, Japan, Taiwan, South Korea, and
Singapore (represented by the blue “bars and whiskers”) for 1951–November
2014. For each level of GDP per capita, we calculated distribution of real GDP
growth rates across the five Asian economies. China 2014 and 2019 forecasts
represent data from IMF World Economic Outlook (WEO), October 2014.
Sources: Vanguard calculations, based on data from Penn World Tables
(version 8.0 for 1951–2011) and IMF WEO, October 2014.growth rates across
the five Asian economies.
Percentiles
key:
95th
25th
75th
5th
Median
Source: Vanguard calculations based on data from CEIC
0%
10%
20%
30%
40%
50%
60%
70%
80%
90%
100%
Primary Industrials Services
10 FOR FINANCIAL ADVISORS ONLY. NOT FOR PUBLIC DISTRIBUTION.
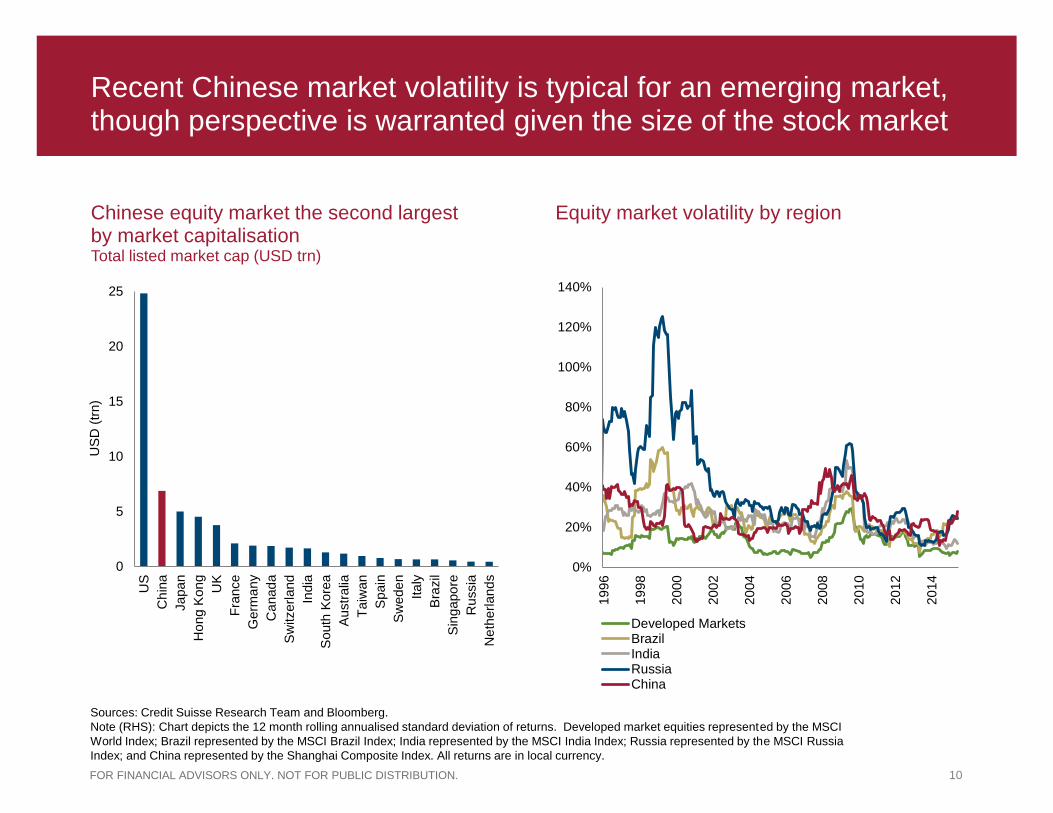
Sources: Credit Suisse Research Team and Bloomberg.
Note (RHS): Chart depicts the 12 month rolling annualised standard deviation of returns. Developed market equities represented by the MSCI
World Index; Brazil represented by the MSCI Brazil Index; India represented by the MSCI India Index; Russia represented by the MSCI Russia
Index; and China represented by the Shanghai Composite Index. All returns are in local currency.
0
5
10
15
20
25
US
Ch
ina
Japa
n
Ho
ng K
on
g
UK
Fra
nce
Germ
any
Ca
nad
a
Sw
itzerl
and
India
South
Kore
a
Austr
alia
Taiw
an
Spain
Sw
ede
n
Ita
ly
Bra
zil
Sin
gapo
re
Ru
ssia
Ne
therl
and
s
US
D (
trn)
0%
20%
40%
60%
80%
100%
120%
140%
19
96
19
98
20
00
20
02
20
04
20
06
20
08
20
10
20
12
20
14
Developed MarketsBrazilIndiaRussiaChina
Recent Chinese market volatility is typical for an emerging market, though perspective is warranted given the size of the stock market
Chinese equity market the second largest by market capitalisation Total listed market cap (USD trn)
Equity market volatility by region
11 FOR FINANCIAL ADVISORS ONLY. NOT FOR PUBLIC DISTRIBUTION.
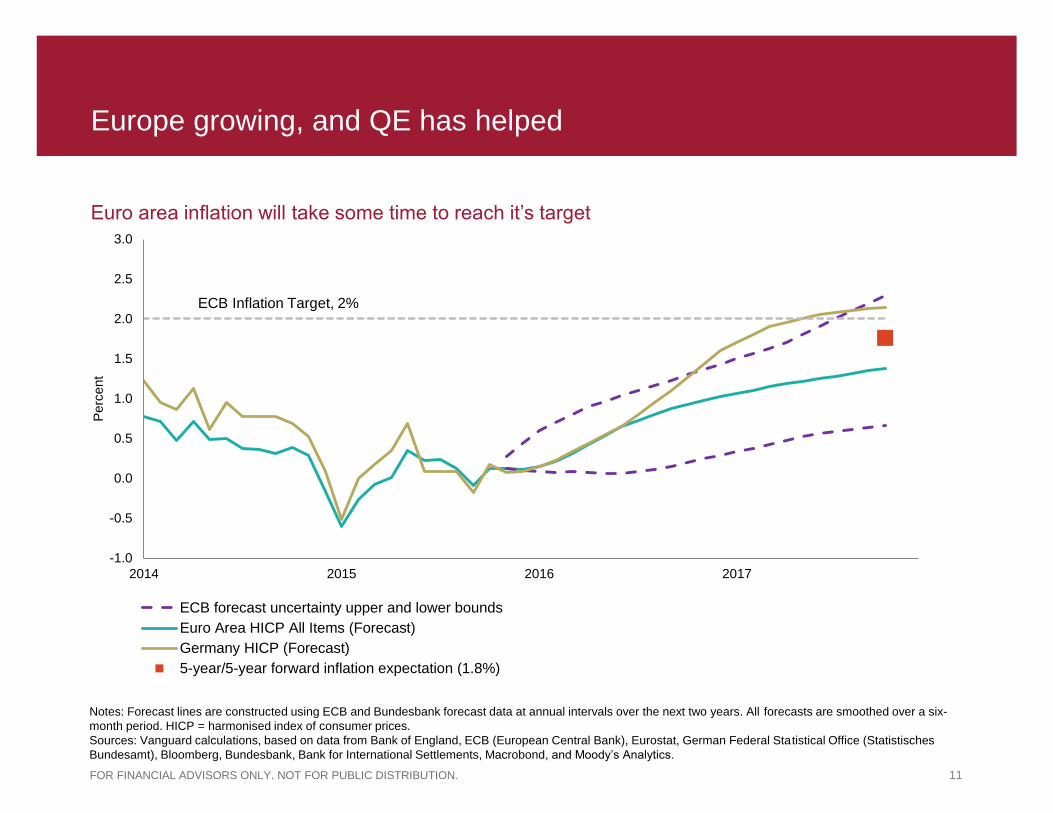
Europe growing, and QE has helped
Euro area inflation will take some time to reach it’s target
-1.0
-0.5
0.0
0.5
1.0
1.5
2.0
2.5
3.0
2014 2015 2016 2017
Perc
ent
ECB forecast uncertainty upper and lower bounds
Euro Area HICP All Items (Forecast)
Germany HICP (Forecast)
5-year/5-year forward inflation expectation (1.8%)
Notes: Forecast lines are constructed using ECB and Bundesbank forecast data at annual intervals over the next two years. All forecasts are smoothed over a six-
month period. HICP = harmonised index of consumer prices.
Sources: Vanguard calculations, based on data from Bank of England, ECB (European Central Bank), Eurostat, German Federal Statistical Office (Statistisches
Bundesamt), Bloomberg, Bundesbank, Bank for International Settlements, Macrobond, and Moody’s Analytics.
ECB Inflation Target, 2%
12 FOR FINANCIAL ADVISORS ONLY. NOT FOR PUBLIC DISTRIBUTION.
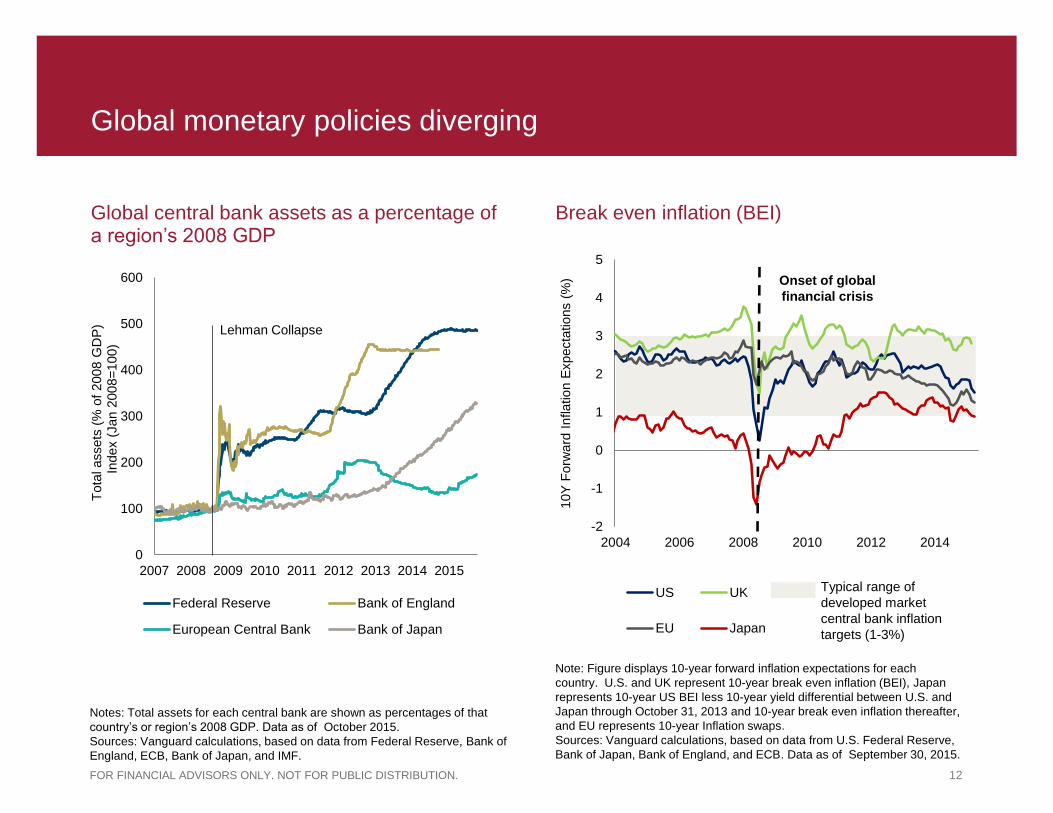
Global monetary policies diverging
Global central bank assets as a percentage of a region’s 2008 GDP
Break even inflation (BEI)
Note: Figure displays 10-year forward inflation expectations for each
country. U.S. and UK represent 10-year break even inflation (BEI), Japan
represents 10-year US BEI less 10-year yield differential between U.S. and
Japan through October 31, 2013 and 10-year break even inflation thereafter,
and EU represents 10-year Inflation swaps.
Sources: Vanguard calculations, based on data from U.S. Federal Reserve,
Bank of Japan, Bank of England, and ECB. Data as of September 30, 2015.
Notes: Total assets for each central bank are shown as percentages of that
country’s or region’s 2008 GDP. Data as of October 2015.
Sources: Vanguard calculations, based on data from Federal Reserve, Bank of
England, ECB, Bank of Japan, and IMF.
0
100
200
300
400
500
600
2007 2008 2009 2010 2011 2012 2013 2014 2015
Tota
l assets
(%
of
2008 G
DP
)
In
dex (
Jan 2
008=
100)
Federal Reserve Bank of England
European Central Bank Bank of Japan
Lehman Collapse
-2
-1
0
1
2
3
4
5
2004 2006 2008 2010 2012 2014
10Y
Forw
ard
Inflation E
xpecta
tions (
%)
US UK
EU Japan
Typical range of
developed market
central bank inflation
targets (1-3%)
Onset of global
financial crisis
13 FOR FINANCIAL ADVISORS ONLY. NOT FOR PUBLIC DISTRIBUTION.
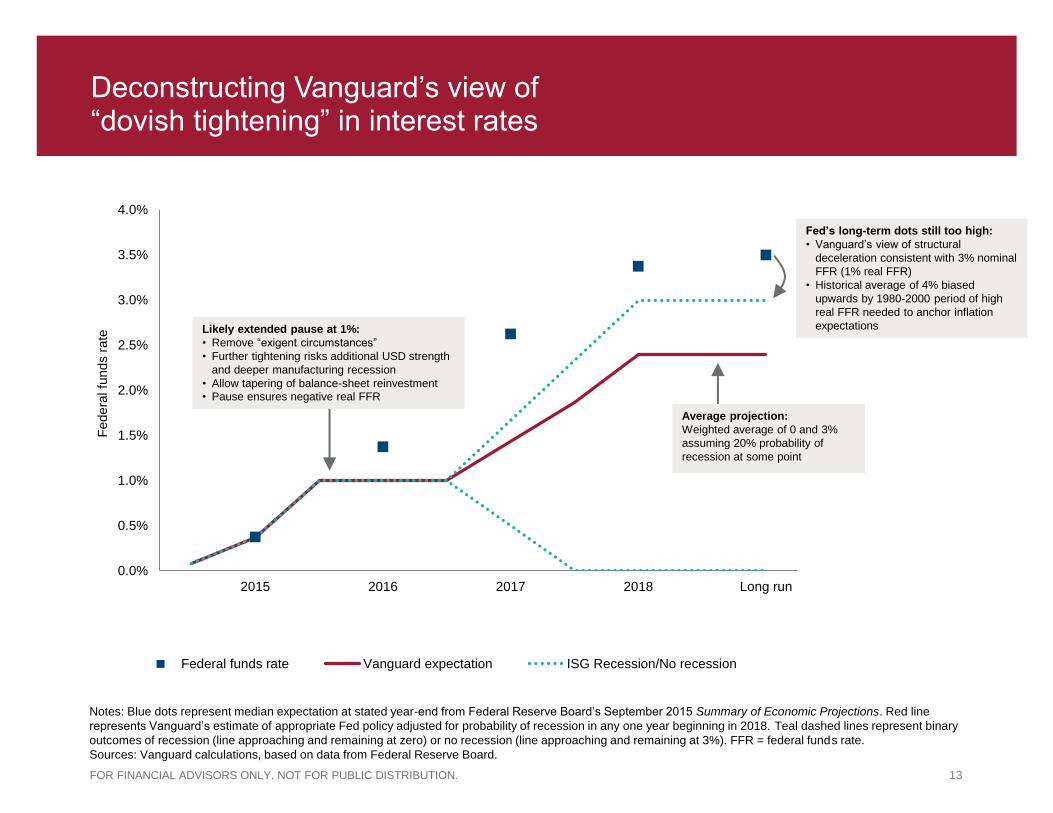
Deconstructing Vanguard’s view of “dovish tightening” in interest rates
0.0%
0.5%
1.0%
1.5%
2.0%
2.5%
3.0%
3.5%
4.0%
2015 2016 2017 2018 Long run
Federa
l fu
nds r
ate
Federal funds rate Vanguard expectation ISG Recession/No recession
Average projection:
Weighted average of 0 and 3%
assuming 20% probability of
recession at some point
Likely extended pause at 1%:
• Remove “exigent circumstances”
• Further tightening risks additional USD strength
and deeper manufacturing recession
• Allow tapering of balance-sheet reinvestment • Pause ensures negative real FFR
Notes: Blue dots represent median expectation at stated year-end from Federal Reserve Board’s September 2015 Summary of Economic Projections. Red line
represents Vanguard’s estimate of appropriate Fed policy adjusted for probability of recession in any one year beginning in 2018. Teal dashed lines represent binary
outcomes of recession (line approaching and remaining at zero) or no recession (line approaching and remaining at 3%). FFR = federal funds rate.
Sources: Vanguard calculations, based on data from Federal Reserve Board.
Fed’s long-term dots still too high:
• Vanguard’s view of structural
deceleration consistent with 3% nominal
FFR (1% real FFR)
• Historical average of 4% biased
upwards by 1980-2000 period of high
real FFR needed to anchor inflation
expectations
14 FOR FINANCIAL ADVISORS ONLY. NOT FOR PUBLIC DISTRIBUTION.
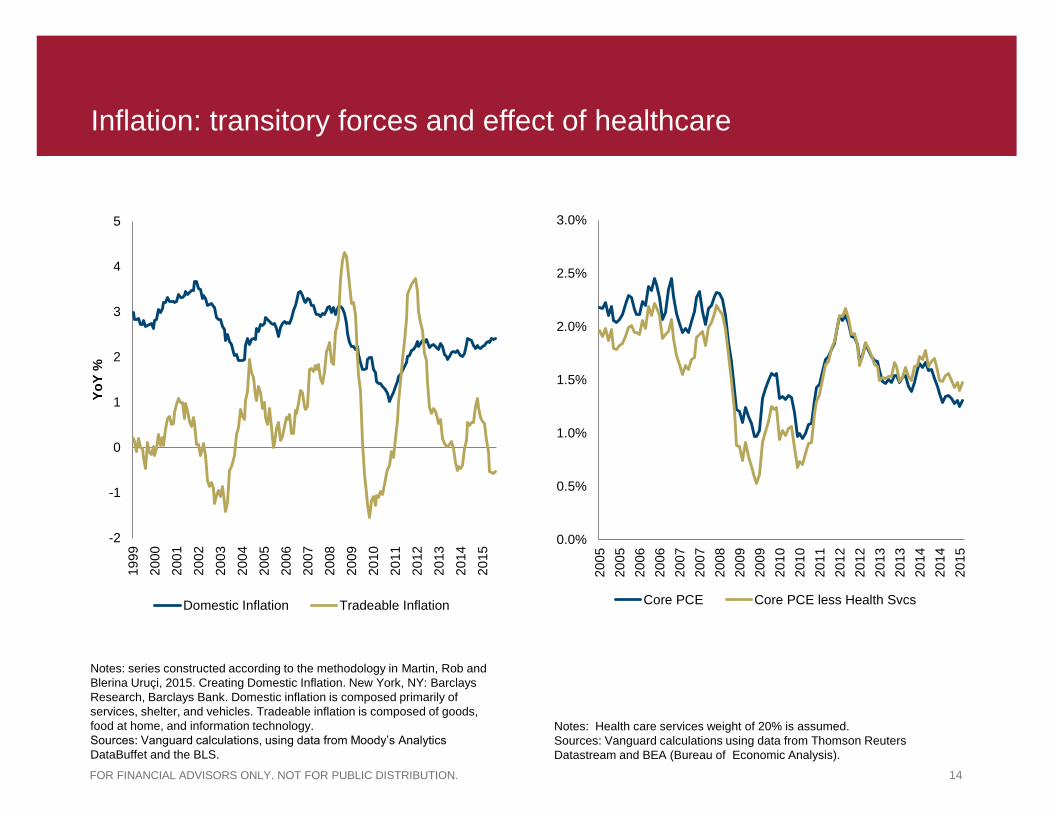
Inflation: transitory forces and effect of healthcare
0.0%
0.5%
1.0%
1.5%
2.0%
2.5%
3.0%
20
05
20
05
20
06
20
06
20
07
20
07
20
08
20
09
20
09
20
10
20
10
20
11
20
12
20
12
20
13
20
13
20
14
20
14
20
15
Core PCE Core PCE less Health Svcs
-2
-1
0
1
2
3
4
5
19
99
20
00
20
01
20
02
20
03
20
04
20
05
20
06
20
07
20
08
20
09
20
10
20
11
20
12
20
13
20
14
20
15
Yo
Y %
Domestic Inflation Tradeable Inflation
Notes: series constructed according to the methodology in Martin, Rob and
Blerina Uruçi, 2015. Creating Domestic Inflation. New York, NY: Barclays
Research, Barclays Bank. Domestic inflation is composed primarily of
services, shelter, and vehicles. Tradeable inflation is composed of goods,
food at home, and information technology.
Sources: Vanguard calculations, using data from Moody’s Analytics
DataBuffet and the BLS.
Notes: Health care services weight of 20% is assumed.
Sources: Vanguard calculations using data from Thomson Reuters
Datastream and BEA (Bureau of Economic Analysis).

15 FOR FINANCIAL ADVISORS ONLY. NOT FOR PUBLIC DISTRIBUTION.
U.S. inflation outlook is near 2%
U.S. inflation outlook
0%
1%
2%
3%
4%
5%
US Inflation: 5 year outlook US Inflation: 10 year outlook
Breakeven inflation rates
Survey of Professional Forecasters
Core CPI average (1960-2015)
75th
Median
25th
Percentiles key
MPORTANT: The projections or other information generated by the Vanguard Capital Markets Model® (VCMM) regarding the likelihood of various investment outcomes are
hypothetical in nature, do not reflect actual investment results, and are not guarantees of future results. Forecast corresponds to distribution of 10,000 VCMM simulations for five-
and ten-year annualized inflation projections as of September 2015. Results from the model may vary with each use and over time. For more information, please see the Important
information slide. Red dots on box-plot represent latest values (October 2015) of Federal Reserve’s five-year and ten-year breakeven inflation indexes. Yellow dots represent latest
(Q4 2015) median values of five-year and ten-year annualized CPI inflation forecasts in Federal Reserve Bank of Philadelphia’s Survey of Professional Forecasters.
Sources: Vanguard calculations, based on data from U.S. Bureau of Labor Statistics, Board of Governors of the Federal Reserve System, Thomson Reuters Datastream, Moody’s
Analytics, Bloomberg, and Barclays.
Annualiz
ed inflation
16 FOR FINANCIAL ADVISORS ONLY. NOT FOR PUBLIC DISTRIBUTION.
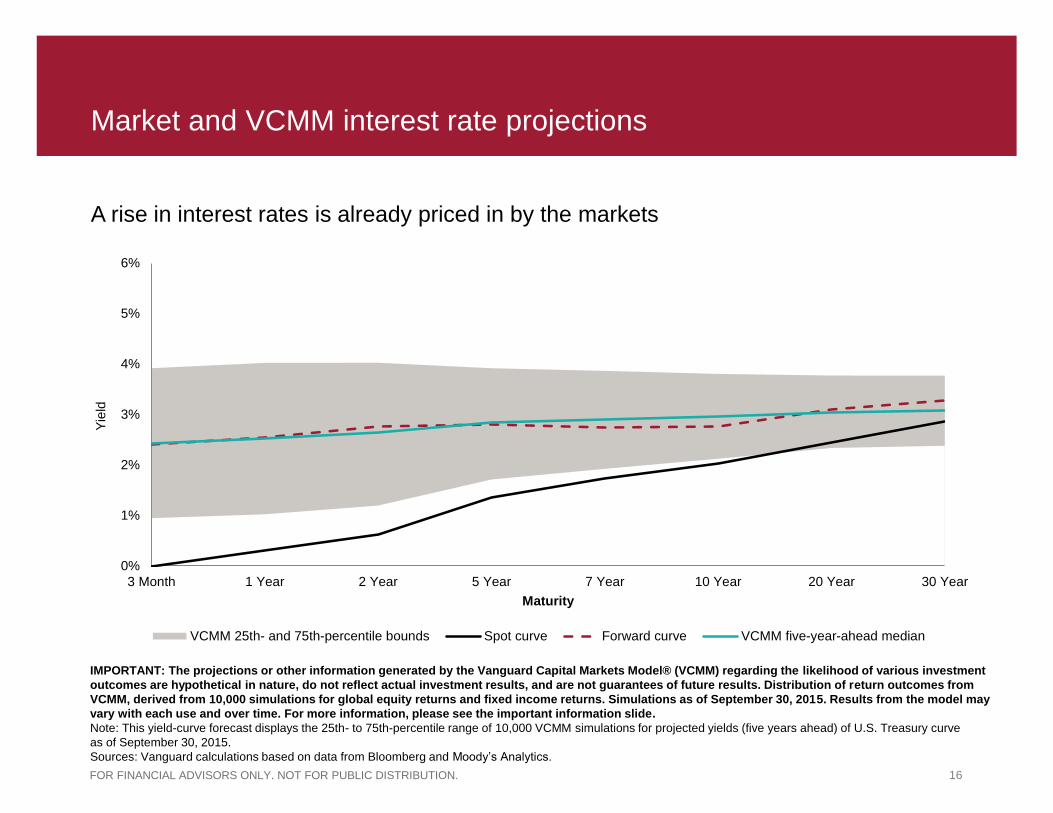
A rise in interest rates is already priced in by the markets
Market and VCMM interest rate projections
IMPORTANT: The projections or other information generated by the Vanguard Capital Markets Model® (VCMM) regarding the likelihood of various investment
outcomes are hypothetical in nature, do not reflect actual investment results, and are not guarantees of future results. Distribution of return outcomes from
VCMM, derived from 10,000 simulations for global equity returns and fixed income returns. Simulations as of September 30, 2015. Results from the model may
vary with each use and over time. For more information, please see the important information slide.
Note: This yield-curve forecast displays the 25th- to 75th-percentile range of 10,000 VCMM simulations for projected yields (five years ahead) of U.S. Treasury curve
as of September 30, 2015.
Sources: Vanguard calculations based on data from Bloomberg and Moody’s Analytics.
0%
1%
2%
3%
4%
5%
6%
3 Month 1 Year 2 Year 5 Year 7 Year 10 Year 20 Year 30 Year
Yie
ld
Maturity
VCMM 25th- and 75th-percentile bounds Spot curve Forward curve VCMM five-year-ahead median

17 FOR FINANCIAL ADVISORS ONLY. NOT FOR PUBLIC DISTRIBUTION.
Projected global fixed income ten-year outlook
VCMM-simulated distribution of expected average annualized nominal return of total fixed income market as of September 2015 and June 2010
0%
5%
10%
15%
20%
25%
30%
Less than 1% 1 to 1.5% 1.5 to 2% 2 to 2.5% 2.5 to 3.0% 3.0 to 3.5% 3.5 to 4.0% 4.0 to 4.5% More than4.5%
Pro
babili
ty
10-year annualized return
10-year outlook Outlook as of June 2010
IMPORTANT: The projections or other information generated by the VCMM regarding the likelihood of various investment outcomes are hypothetical in nature,
do not reflect actual investment results, and are not guarantees of future results. Distribution of return outcomes from the VCMM are derived from 10,000
simulations for global fixed income returns in USD. Simulations are as of September 30, 2015. Results from the model may vary with each use and over time.
Notes: Figure displays projected range of potential returns for portfolios of 70% U.S. bonds/30% ex-U.S. bonds, rebalanced quarterly.
For details, see Vanguard’s economic and investment outlook (Davis, Aliaga-Diaz, Westaway, Wang, Patterson, and Ahluwalia 2015).
Source: Vanguard.
Global bond returns
1926-2015 5.4%
1926 - 1969 3.1%
1970 - 2015 7.7%
2000 - 2015 5.2%
18 FOR FINANCIAL ADVISORS ONLY. NOT FOR PUBLIC DISTRIBUTION.
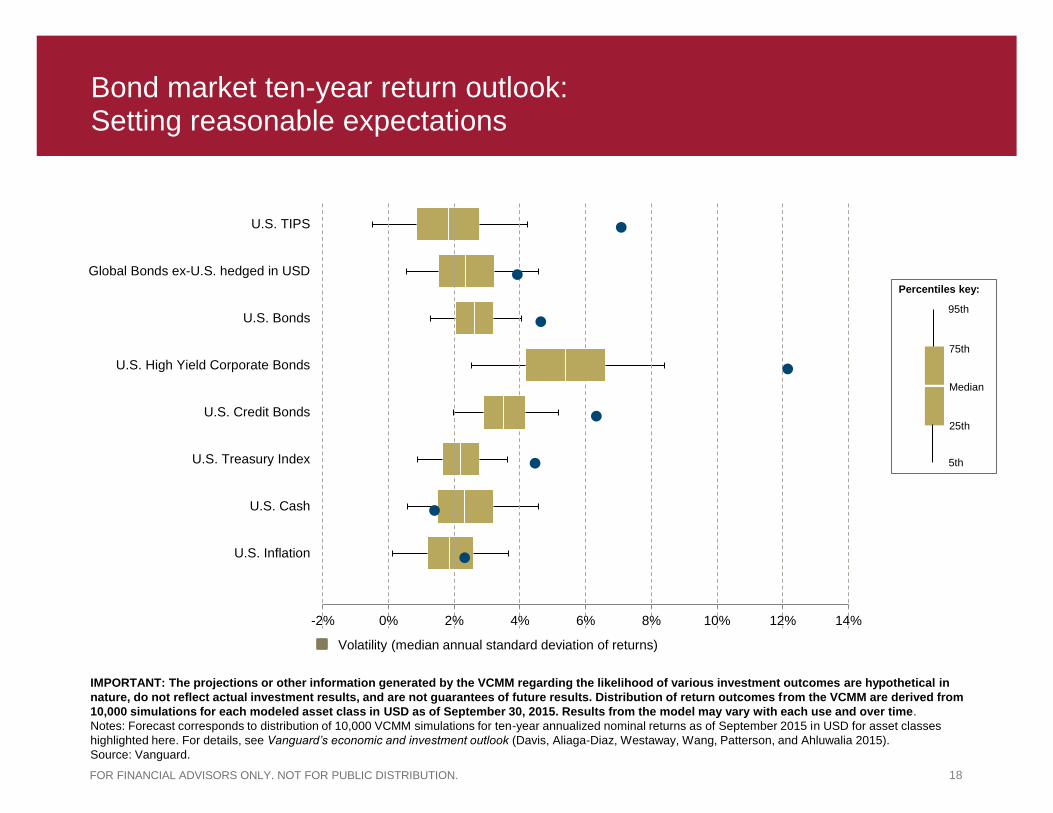
U.S. Inflation
U.S. Cash
U.S. Treasury Index
U.S. Credit Bonds
U.S. High Yield Corporate Bonds
U.S. Bonds
Global Bonds ex-U.S. hedged in USD
U.S. TIPS
-2% 0% 2% 4% 6% 8% 10% 12% 14%
Bond market ten-year return outlook: Setting reasonable expectations
Volatility (median annual standard deviation of returns)
95th
75th
Median
25th
5th
Percentiles key:
IMPORTANT: The projections or other information generated by the VCMM regarding the likelihood of various investment outcomes are hypothetical in
nature, do not reflect actual investment results, and are not guarantees of future results. Distribution of return outcomes from the VCMM are derived from
10,000 simulations for each modeled asset class in USD as of September 30, 2015. Results from the model may vary with each use and over time.
Notes: Forecast corresponds to distribution of 10,000 VCMM simulations for ten-year annualized nominal returns as of September 2015 in USD for asset classes
highlighted here. For details, see Vanguard’s economic and investment outlook (Davis, Aliaga-Diaz, Westaway, Wang, Patterson, and Ahluwalia 2015).
Source: Vanguard.
19 FOR FINANCIAL ADVISORS ONLY. NOT FOR PUBLIC DISTRIBUTION.
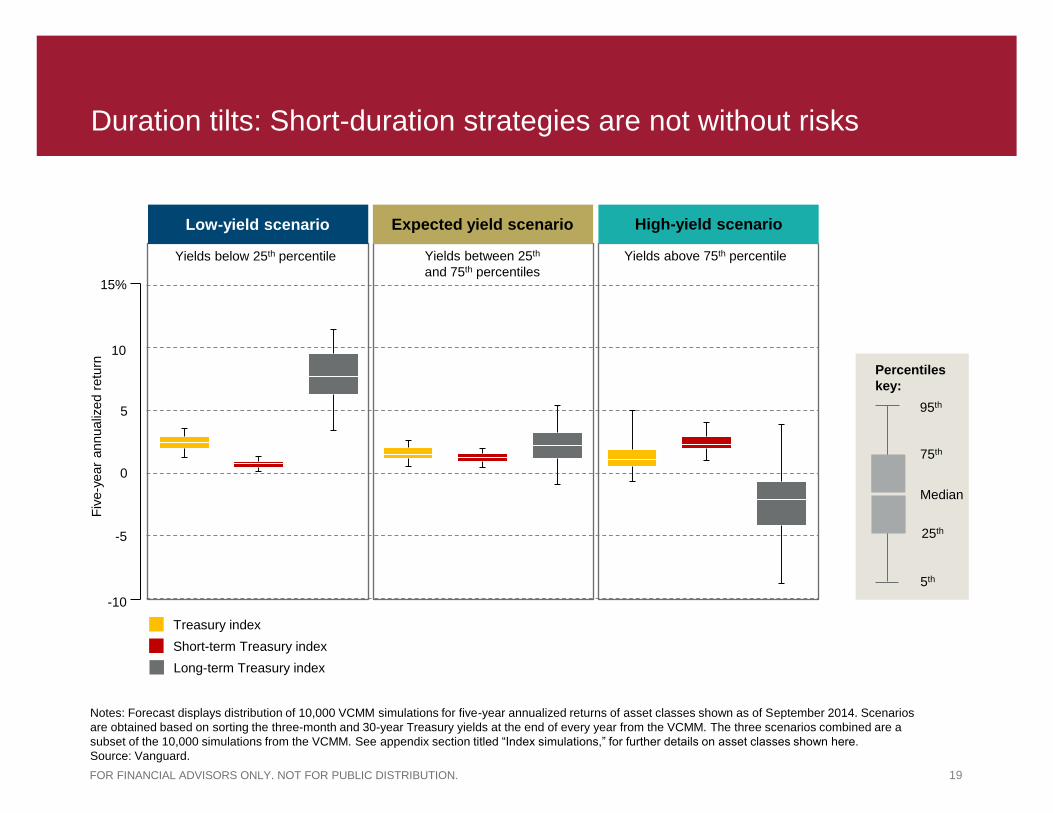
Duration tilts: Short-duration strategies are not without risks
Notes: Forecast displays distribution of 10,000 VCMM simulations for five-year annualized returns of asset classes shown as of September 2014. Scenarios
are obtained based on sorting the three-month and 30-year Treasury yields at the end of every year from the VCMM. The three scenarios combined are a
subset of the 10,000 simulations from the VCMM. See appendix section titled “Index simulations,” for further details on asset classes shown here.
Source: Vanguard.
Fiv
e-y
ear
annualiz
ed r
etu
rn
15%
10
5
0
-5
-10
Expected yield scenario High-yield scenario
Yields below 25th percentile Yields between 25th
and 75th percentiles
Yields above 75th percentile
Low-yield scenario
Treasury index
Short-term Treasury index
Long-term Treasury index
Percentiles
key:
95th
25th
75th
5th
Median

20 FOR FINANCIAL ADVISORS ONLY. NOT FOR PUBLIC DISTRIBUTION.
Bonds can provide ballast in an equity bear market
Median return of various asset classes during the worst decile of monthly equity returns, 1988–2015
Notes: U.S. stocks, U.S. bonds, and international bonds represented by indexes listed on page 4. Emerging market stocks represented by FTSE Emerging Index
and emerging market bonds by Barclays Emerging Markets Tradable USD Sovereign Bond Index. REITs represented by FTSE NAREIT Equity REIT Index,
dividend stocks by Dow Jones U.S. Select Dividend Total Return Index, commodities by S&P GSCI Commodity Index, high-yield bonds by Barclays U.S.
Corporate High Yield Index, hedge funds by median hedge fund-of-funds return as identified by Morningstar, Inc., corporate bonds by Barclays U.S. Corporate
Investment Grade Index, and Treasury bonds by Barclays U.S. Treasury Index.
Sources: Vanguard calculations, based on data from S&P, Citigroup, Barclays, Dow Jones, MSCI, CRSP, and FTSE. Data as of December 31, 2015.
-10%
-8%
-6%
-4%
-2%
0%
2%
U.S. stocks Emergingmarket stocks
REITs Dividendstocks
Commodities High-yieldbonds
Emergingmarket bonds
Hedge funds Corporatebonds
Treasurybonds
Int'l bonds(unhedged)
Int'l bonds(hedged)
Media
n r
etu
rn

21 FOR FINANCIAL ADVISORS ONLY. NOT FOR PUBLIC DISTRIBUTION.
Projected global equity ten-year return outlook
VCMM-simulated distribution of expected average annualized nominal return of global equity market, estimated as of September 2015 and June 2010
0%
5%
10%
15%
20%
25%
Less than 0% 0 to 4% 4 to 8% 8 to 12% 12 to 16% 16 to 20% More than 20%
Pro
babili
ty
10-year annualized return
10-year outlook Outlook as of June 2010
IMPORTANT: The projections or other information generated by the VCMM regarding the likelihood of various investment outcomes are hypothetical in nature, do
not reflect actual investment results, and are not guarantees of future results. Distribution of return outcomes from the VCMM are derived from 10,000 simulations
for global equity returns in USD. Simulations are as of September 30, 2015. Results from the model may vary with each use and over time.
Notes: Figure displays projected range of potential returns for portfolios of 60% U.S./40% ex-U.S. equities, rebalanced quarterly. For details, see Vanguard’s economic and
investment outlook (Davis, Aliaga-Diaz, Westaway, Wang, Patterson, and Ahluwalia 2015).
Source: Vanguard.
Global equity returns
1926-2015 10.0%
1926 - 1969 9.7%
1970 - 2015 10.2%
2000 - 2015 4.0%
22 FOR FINANCIAL ADVISORS ONLY. NOT FOR PUBLIC DISTRIBUTION.
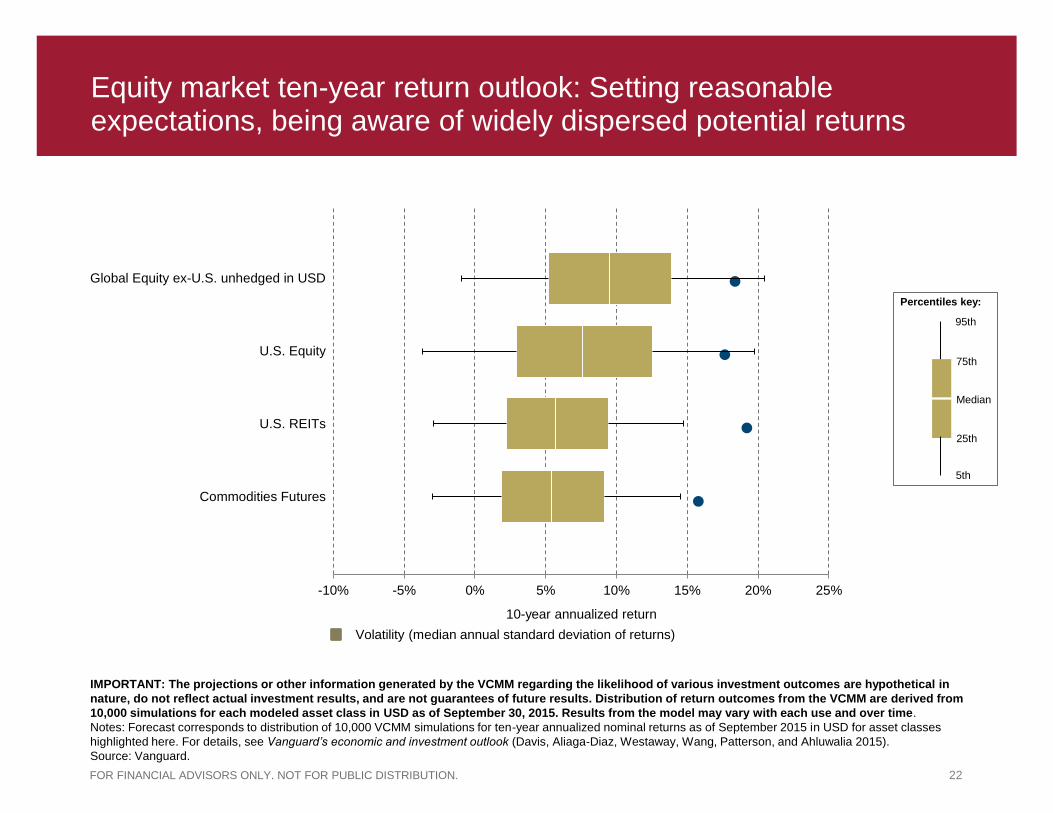
-10% -5% 0% 5% 10% 15% 20% 25%
Commodities Futures
U.S. REITs
U.S. Equity
Global Equity ex-U.S. unhedged in USD
Equity market ten-year return outlook: Setting reasonable expectations, being aware of widely dispersed potential returns
10-year annualized return
Volatility (median annual standard deviation of returns)
IMPORTANT: The projections or other information generated by the VCMM regarding the likelihood of various investment outcomes are hypothetical in
nature, do not reflect actual investment results, and are not guarantees of future results. Distribution of return outcomes from the VCMM are derived from
10,000 simulations for each modeled asset class in USD as of September 30, 2015. Results from the model may vary with each use and over time.
Notes: Forecast corresponds to distribution of 10,000 VCMM simulations for ten-year annualized nominal returns as of September 2015 in USD for asset classes
highlighted here. For details, see Vanguard’s economic and investment outlook (Davis, Aliaga-Diaz, Westaway, Wang, Patterson, and Ahluwalia 2015).
Source: Vanguard.
95th
75th
Median
25th
5th
Percentiles key:

23 FOR FINANCIAL ADVISORS ONLY. NOT FOR PUBLIC DISTRIBUTION.
Valuations stretched in the U.S. and developed markets
Valuation for global equity indexes Price over 36-month trailing earnings
Long-term valuation for U.S. equities, Selected valuation metrics
Notes: Figure displays valuation metrics standardized to have a long-term average of 0.0 and a
standard deviation of 1.0. Broad market price/earnings displays the market value of domestic
corporations from the Federal Reserve Flow of Funds database relative to the trailing four-quarter
average of after-tax corporate profits from the BEA’s national accounts. Broad market price/sales
displays the market value of domestic corporations from the Flow of Funds database relative to the
Gross Value Added of Corporate Business from the BEA’s national accounts. Broad market
price/book displays the market value of domestic corporations relative to the net worth at historical
cost of Nonfinancial Corporate Business, both from the Flow of Funds database. Shiller CAPE (10-
year) is the 10-year cyclically adjusted price/earnings ratio as defined in Shiller (2000). Shiller CAPE
(3-year) is Shiller’s measure, adjusted to smooth earnings over a trailing 36-month period.
Sources: Vanguard calculations, based on data from Federal Reserve, U.S. Bureau of Economic
Analysis, and Robert Shiller’s website, aida.wss.yale.edu/~shiller/data.htm.
Data as of September 30, 2015.
-2
-1
0
1
2
3
4
1925 1935 1945 1955 1965 1975 1985 1995 2005 2015S
tandard
devia
tion f
rom
long-t
erm
mean
Broad Market Price to Earnings
Broad Market Price to Sales
Broad Market Price to Book
Shiller CAPE (10-year)
Shiller CAPE (3y)
Notes: Figure displays the price/earnings ratio with 36-month trailing average
earnings. United States is defined as the MSCI United States Index,
developed markets ex-U.S. are defined as the MSCI All-World US Index,
and emerging markets are defined as the MSCI Emerging Markets Index.
Sources: Vanguard calculations, based on data from MSCI.
Data as of December 31, 2015.
0
5
10
15
20
25
30
35
40
45
1998 2000 2002 2004 2006 2008 2010 2012 2014
United States
Developed International
Emerging Markets

24 FOR FINANCIAL ADVISORS ONLY. NOT FOR PUBLIC DISTRIBUTION.
The benefits of long-term perspective, balance and diversification
A balanced, diversified investor has fared relatively well
Source: S&P 500 Index and Barclays U.S. Aggregate Bond Index (rebalanced monthly). Data provided by FactSet, as of December 31, 2015. Past performance is no guarantee of future returns.
40
60
80
100
120
140
160
Oct07 Apr08 Oct08 Apr09 Oct09 Apr10 Oct10 Apr11 Oct11 Apr12 Oct12 Apr13 Oct13 Apr14 Oct14 Apr15 Oct15
Bala
nced p
ort
folio
valu
e
(indexed t
o 1
00 a
s o
f m
ark
et peak)
100% Stock 50% Stock / 50% Bond 30% Stock / 70% Bond
Peak to trough return
–55.25
–24.03
–11.55
+56.17%
+50.79% +54.04%
Peak through
December 31, 2015
25 FOR FINANCIAL ADVISORS ONLY. NOT FOR PUBLIC DISTRIBUTION.
20%/80% 60%/40% 80%/20%
History 1926-2015
History 2000-2015
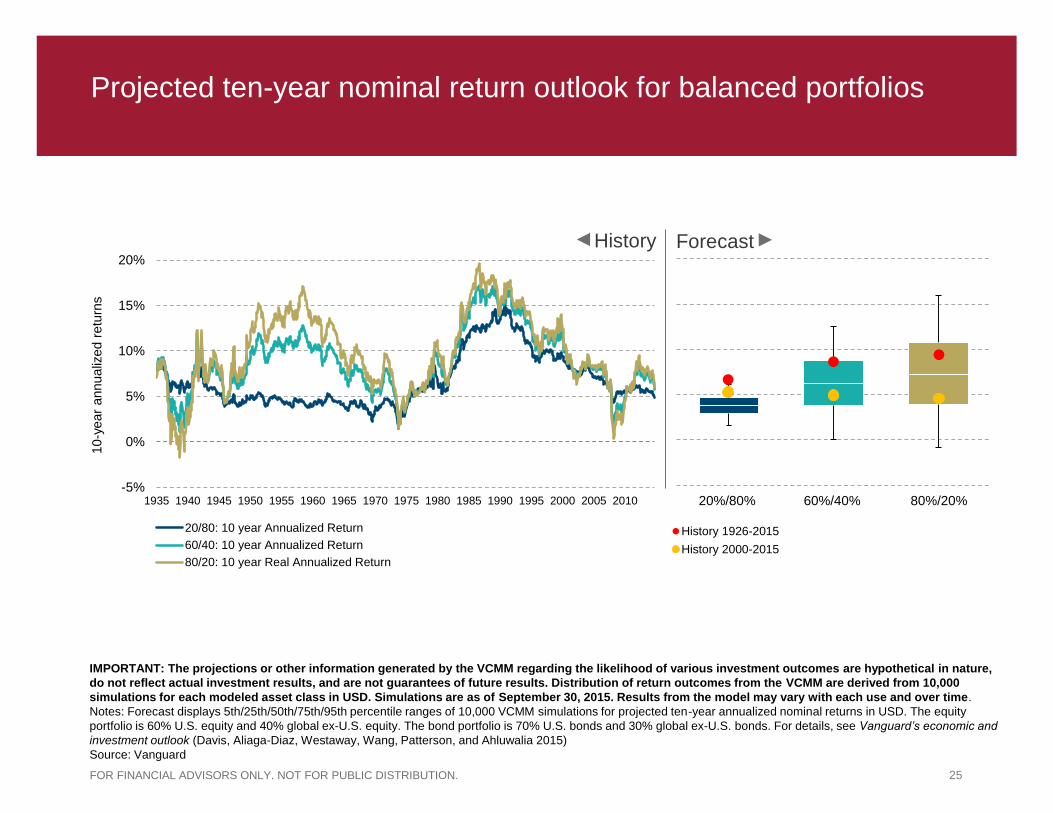
Projected ten-year nominal return outlook for balanced portfolios
-5%
0%
5%
10%
15%
20%
1935 1940 1945 1950 1955 1960 1965 1970 1975 1980 1985 1990 1995 2000 2005 2010
20/80: 10 year Annualized Return
60/40: 10 year Annualized Return
80/20: 10 year Real Annualized Return
IMPORTANT: The projections or other information generated by the VCMM regarding the likelihood of various investment outcomes are hypothetical in nature,
do not reflect actual investment results, and are not guarantees of future results. Distribution of return outcomes from the VCMM are derived from 10,000
simulations for each modeled asset class in USD. Simulations are as of September 30, 2015. Results from the model may vary with each use and over time.
Notes: Forecast displays 5th/25th/50th/75th/95th percentile ranges of 10,000 VCMM simulations for projected ten-year annualized nominal returns in USD. The equity
portfolio is 60% U.S. equity and 40% global ex-U.S. equity. The bond portfolio is 70% U.S. bonds and 30% global ex-U.S. bonds. For details, see Vanguard’s economic and
investment outlook (Davis, Aliaga-Diaz, Westaway, Wang, Patterson, and Ahluwalia 2015)
Source: Vanguard
History Forecast
10-y
ear
annualiz
ed r
etu
rns
26 FOR FINANCIAL ADVISORS ONLY. NOT FOR PUBLIC DISTRIBUTION.
Important information
IMPORTANT: The projections or other information generated by the Vanguard Capital Markets Model® (VCMM) regarding the likelihood of various investment outcomes are hypothetical in nature, do not reflect actual investment results, and are not guarantees of future results. VCMM results will vary with each use and over time.
The VCMM projections are based on a statistical analysis of historical data. Future returns may behave differently from the historical patterns captured in the VCMM. More importantly, the VCMM may be underestimating extreme negative scenarios unobserved in the historical period on which the model estimation is based.
The Vanguard Capital Markets Model® is a proprietary financial simulation tool developed and maintained by Vanguard’s primary investment research and advice teams. The model forecasts distributions of future returns for a wide array of broad asset classes. Those asset classes include U.S. and international equity markets, several maturities of the U.S. Treasury and corporate fixed income markets, international fixed income markets, U.S. money markets, commodities, and certain alternative investment strategies. The theoretical and empirical foundation for the Vanguard Capital Markets Model is that the returns of various asset classes reflect the compensation investors require for bearing different types of systematic risk (beta). At the core of the model are estimates of the dynamic statistical relationship between risk factors and asset returns, obtained from statistical analysis based on available monthly financial and economic data from as early as 1960. Using a system of estimated equations, the model then applies a Monte Carlo simulation method to project the estimated interrelationships among risk factors and asset classes as well as uncertainty and randomness over time. The model generates a large set of simulated outcomes for each asset class over several time horizons. Forecasts are obtained by computing measures of central tendency in these simulations. Results produced by the tool will vary with each use and over time.
All investing is subject to risk, including the possible loss of money you invest. Diversification does not ensure a profit or protect against a loss. Prices of mid- and small-cap stocks often fluctuate more than those of large-company stocks. Investments in stocks or bonds issued by non-U.S. companies are subject to risks including country/regional risk and currency risk. These risks are especially high in emerging markets. Investments in bonds are subject to the risk that an issuer will fail to make payments on time, and that bond prices will decline because of rising interest rates or negative perceptions of an issuer’s ability to make payments.
27 FOR FINANCIAL ADVISORS ONLY. NOT FOR PUBLIC DISTRIBUTION.
Important information
For more information about Vanguard funds or ETF Shares, contact your financial advisor to obtain a prospectus or, if available, a summary prospectus. Investment objectives, risks, charges, expenses, and other important information are contained in the prospectus; read and consider it carefully before investing.
An investment in a money market fund is not insured or guaranteed by the Federal Deposit Insurance Corporation or any other government agency. Although a money market fund seeks to preserve the value of your investment at $1 per share, it is possible to lose money by investing in such a fund.
Vanguard ETF Shares are not redeemable with the issuing Fund other than in very large aggregations worth millions of dollars. Instead, investors must buy and sell Vanguard ETF Shares in the secondary market and hold those shares in a brokerage account. In doing so, the investor may incur brokerage commissions and may pay more than net asset value when buying and receive less than net asset value when selling.
Vanguard provides its services to the Vanguard funds and ETFs at cost.
Mutual funds and all investments are subject to risk, which may result in loss of principal. Prices of mid- and small-cap stocks often fluctuate more than those of large-company stocks. Investments in stocks or bonds issued by non-U.S. companies are subject to risks including country/regional risk and currency risk. These risks are especially high in emerging markets. Funds that concentrate on a relatively narrow sector face the risk of higher share-price volatility. It is possible that tax-managed funds will not meet their objective of being tax-efficient. Because company stock funds concentrate on a single stock they are considered riskier than diversified stock funds.
Investments in bond funds are subject to the risk that an issuer will fail to make payments on time, and that bond prices will decline because of rising interest rates or negative perceptions of an issuer's ability to make payments. High-yield bonds generally have medium- and lower-range credit quality ratings and are therefore subject to a higher level of credit risk than bonds with higher credit quality ratings. Although the income from a municipal bond fund is exempt from federal tax, you may owe taxes on any capital gains realized through the fund's trading or through your own redemption of shares. For some investors, a portion of the fund's income may be subject to state and local taxes, as well as to the federal Alternative Minimum Tax. Diversification does not ensure a profit or protect against a loss.
Investments in Target Retirement Funds are subject to the risks of their underlying funds. The year in the Fund name refers to the approximate year (the target date) when an investor in the Fund would retire and leave the work force. The Fund will gradually shift its emphasis from more aggressive investments to more conservative ones based on its target date. An investment in the Target Retirement Fund is not guaranteed at any time, including on or after the target date.
The information contained herein does not constitute tax advice, and cannot be used by any person to avoid tax penalties that may be imposed under the Internal Revenue Code. Each person should consult an independent tax advisor about his/her individual situation before investing in any fund or ETF.
Apple®, iPhone®, and iPad® are trademarks of Apple Inc., registered in the U.S. and other countries. App Store is a service mark of Apple Inc. Android is a trademark of Google Inc.

28 FOR FINANCIAL ADVISORS ONLY. NOT FOR PUBLIC DISTRIBUTION.
Important information
“Dividend Achievers” Is a trademark of The NASDAQ OMX Group, Inc. (collectively, with its affiliates, “NASDAQ OMX”) and has been licensed for use by The Vanguard Group, Inc. Vanguard mutual funds are not sponsored, endorsed, sold, or promoted by NASDAQ OMX and NASDAQ OMX makes no representation regarding the advisability of investing in the funds. NASDAQ OMX MAKES NO WARRANTIES AND BEARS NO LIABILITY WITH RESPECT TO THE VANGUARD MUTUAL FUNDS.
S&P® and S&P 500® are registered trademarks of Standard & Poor’s Financial Services LLC (“S&P”) and have been licensed for use by S&P Dow Jones Indices LLC and its affiliates and sublicensed for certain purposes by Vanguard. The S&P Index is a product of S&P Dow Jones Indices LLC and has been licensed for use by Vanguard. The Vanguard Fund(s) is not sponsored, endorsed, sold or promoted by S&P Dow Jones Indices LLC, Dow Jones, S&P or their respective affiliates, and none of S&P Dow Jones Indices LLC, Dow Jones, S&P nor their respective affiliates makes any representation regarding the advisability of investing in such product(s).
London Stock Exchange Group companies includes FTSE International Limited (“FTSE”), Frank Russell Company (“Russell”), MTS Next Limited (“MTS”), and FTSE TMX Global Debt Capital Markets Inc (“FTSE TMX”). All rights reserved. “FTSE®”, “Russell®”, “MTS®”, “FTSE TMX®” and “FTSE Russell” and other service marks and trademarks related to the FTSE or Russell indexes are trade marks of the London Stock Exchange Group companies and are used by FTSE, MTS, FTSE TMX and Russell under licence. All information is provided for information purposes only. No responsibility or liability can be accepted by the London Stock Exchange Group companies nor its licensors for any errors or for any loss from use of this publication. Neither the London Stock Exchange Group companies nor any of their licensors make any claim, prediction, warranty or representation whatsoever, expressly or impliedly, either as to the results to be obtained from the use of the FTSE or the fitness or suitability of the Index for any particular purpose to which it might be put.
The Russell Indexes and Russell® are registered trademarks of Russell Investments and have been licensed for use by The Vanguard Group. The products are not sponsored, endorsed, sold or promoted by Russell Investments and Russell Investments makes no representation regarding the advisability of investing in the products.
The funds or securities referred to herein are not sponsored, endorsed, or promoted by MSCI, and MSCI bears no liability with respect to any such funds or securities. The prospectus or the Statement of Additional Information contains a more detailed description of the limited relationship MSCI has with Vanguard and any related funds.
The Vanguard ETFs are not sponsored, endorsed, sold or promoted by Barclays Capital Inc. or its affiliates (“Barclays”). Barclays does not make any representation regarding the advisability of Vanguard ETFs or the advisability of investing in securities generally. Barclays' only relationship with Vanguard is the licensing of the Index which is determined, composed and calculated by Barclays without regard to Vanguard or the Vanguard ETFs. Barclays has no obligation to take the needs of Vanguard or the owners of the Vanguard ETFs into consideration in determining, composing or calculating the Index. Barclays has no obligation or liability in connection with administration, marketing or trading of the Vanguard ETFs.
© 2016 Morningstar, Inc. All Rights Reserved. The information contained herein: (1) is proprietary to Morningstar and/or its content providers; (2) may not be copied or distributed; (3) does not constitute investment advice offered by Morningstar; and (4) is not warranted to be accurate, complete or timely. Neither Morningstar nor its content providers are responsible for any damages or losses arising from any use of this information. Past Performance is no guarantee of future results.
© 2016 The Vanguard Group, Inc. All rights reserved. U.S. Patent Nos. 6,879,964; 7,337,138; 7,720,749; 7,925,573; 8,090,646; 8,417,623. Vanguard Marketing Corporation, Distributor of the Vanguard Funds.
Investment Products: Not FDIC Insured • No Bank Guarantee • May Lose Value IPRES-2016-01-21-1309_DOLU5/31/2016

FOR FINANCIAL ADVISORS ONLY. NOT FOR PUBLIC DISTRIBUTION.
Appendix

30 FOR FINANCIAL ADVISORS ONLY. NOT FOR PUBLIC DISTRIBUTION.
Sector dashboard of the U.S. economy
Source: Vanguard Investment Strategy Group. Data as of November 30, 2015.
Housing
Financial
markets
Sentiment /
confidence
Manufacturing
and trade
Labor market
Consumer/
lending
and credit
2007 2008 2009 2010 2011 2012 2013 2014 2015

31 FOR FINANCIAL ADVISORS ONLY. NOT FOR PUBLIC DISTRIBUTION.
A scorecard for growth convergence
United
States
Euro
Area China Japan
United
Kingdom Canada Australia
Percentage of world GNP 22.4% 17.1% 13.3% 6.2% 3.7% 2.3% 1.9%
Estimated trend growth rates (%)
Pre-recession average (1990-2007) 3.0 2.0 10.0 1.4 2.9 2.5 3.4
Projected future (2016-2020) 2.1 1.1 6.3 1.5 2.1 2.0 2.8
Growth headwinds
Slowing growth of labor force Slower population growth and aging of population
Private sector debt deleveraging Debt-deleveraging cycle, constraining willingness to spend
Sluggish capital investment Falling cost of technology and demographic effects on businesses’ growth plans
Fiscal sustainability and committed austerity Unsustainable debt dynamics may result in suboptimal policies and uncertainty
Commodity exports dependency Weak commodity price outlook
Currency strength Tighter financial conditions, weaker manufacturing and exports
Rising income inequality Falling purchasing power of consumers with highest propensity to spend
Notes: Slowing growth of labor force: Birth rates minus mortality rates (slope of the trend line, 1960–present); Private-sector debt deleveraging: Percentage increase
in household debt (% of GDP) from 2008 to December 2015; Sluggish capital investment: Difference between average fixed capital formation as percentage of GDP, 2000–
2007 and 2008–latest; Fiscal sustainability and committed fiscal austerity: Fiscal space estimates based on Moody’s Economy.com model, as of February 2015 and
difference in structural government budget balance over next two years (2016–2017); Commodity exports dependency: Qualitative assessment of commodity export
dependence; Currency strength: Level of real effective exchange rate as of September 2015 (>100, overvalued/<100, undervalued); Rising income inequality: Average
percentage point change in the income share of top 1% of income (1980–2010). Also, for China, we factor local government debt into our debt deleveraging rating.
Sources: Vanguard calculations, based on data from International Monetary Fund (IMF)—World Economic Outlook, Organisation for Economic Co-operation and
Development ,United Nations, U.S. Bureau of Economic Analysis, U.S. Federal Reserve System, Moody’s Analytics, and Thomson Reuters Datastream.
Highly significant factor Factor not present Moderately significant factor

32 FOR FINANCIAL ADVISORS ONLY. NOT FOR PUBLIC DISTRIBUTION.
Emerging markets’ financial system are much different today
Crisis Years External debt stocks
(% of GDP)
Total reserves
(% of total external debt)
External debt service
(% exports)
Total reserves/
Current account deficit
Currency peg in
place (yes or no)
Brazil 2002 48 16 71 5 No
Hungary 1997 52 36 33 Less than 1 Yes
Malaysia 1997 36 44 7 4 Yes
Mexico 1994 34 5 27 Less than 1 Yes
South Africa 1997 20 16 17 2 No
Turkey 1997 32 22 22 7 No
Argentina 2001 57 10 49 4 Yes
Indonesia 1997 52 12 30 3 Yes
Russia 1998 65 6 29 56 Yes
South Korea 1997 32 13 — 8 Yes
Today
Brazil 21 74 29 4 No
Hungary 147 24 97 8 No
Malaysia 68 63 4 4 No
Mexico 35 40 10 7 No
South Africa 38 32 8 2 No
Turkey 47 29 29 2 No
Argentina 22 21 14 6 No
Indonesia 30 37 19 3 No
Russia 35 70 32 15 No
South Korea 32 83 — 53 No
Notes: Data for external debt service as percentage of exports for Hungary and Russia begin in 2005. Data for total reserves as percentage of exports for
Hungary begin in 2000.
Sources: Vanguard calculations, based on data from World Bank, IMF, Oxford Economics, Bank of Korea, Korea Customs Service, Central Bank of the Russian
Federation, Department of Statistics Malaysia, CEIC, Central Bank of Hungary, and The Country Chronologies and Background Material to Exchange Rate
Arrangements into the 21st Century: Will the Anchor Currency Hold? (Ilzetzki, Reinhart, and Rogoff, 2011).
33 FOR FINANCIAL ADVISORS ONLY. NOT FOR PUBLIC DISTRIBUTION.
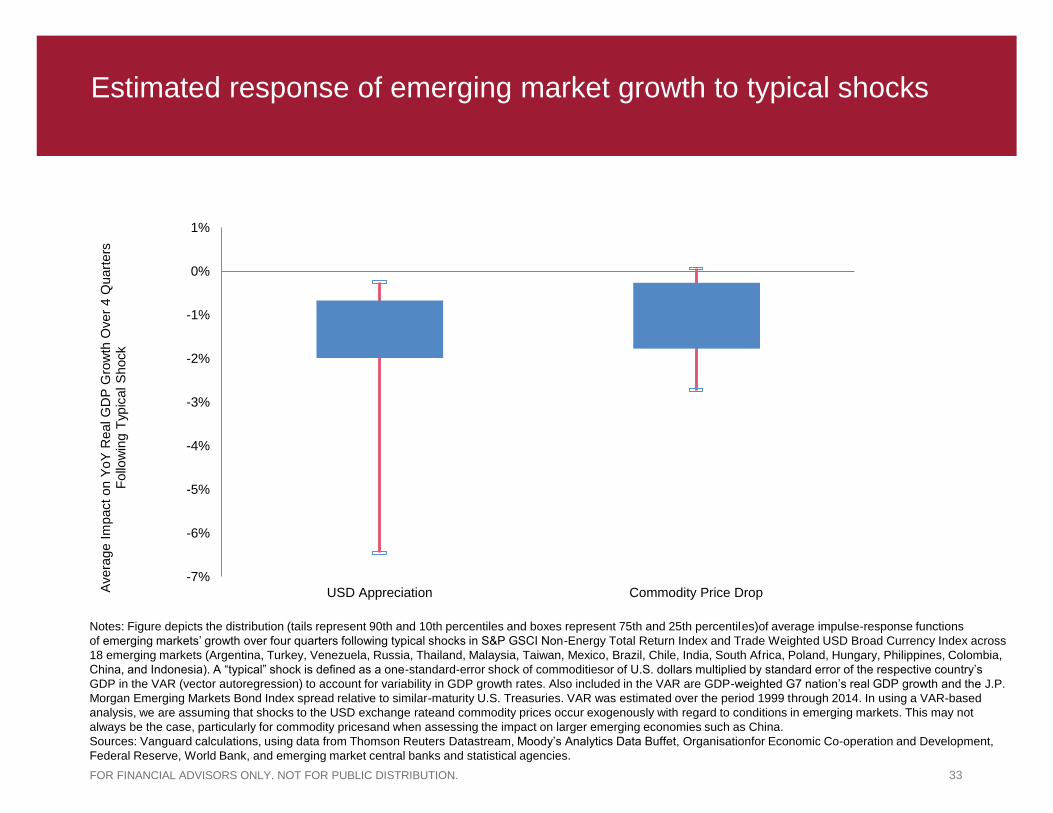
Estimated response of emerging market growth to typical shocks
-7%
-6%
-5%
-4%
-3%
-2%
-1%
0%
1%
USD Appreciation Commodity Price DropAvera
ge I
mpact on Y
oY
Real G
DP
Gro
wth
Over
4 Q
uart
ers
F
ollo
win
g T
ypic
al S
hock
Notes: Figure depicts the distribution (tails represent 90th and 10th percentiles and boxes represent 75th and 25th percentiles)of average impulse-response functions
of emerging markets’ growth over four quarters following typical shocks in S&P GSCI Non-Energy Total Return Index and Trade Weighted USD Broad Currency Index across
18 emerging markets (Argentina, Turkey, Venezuela, Russia, Thailand, Malaysia, Taiwan, Mexico, Brazil, Chile, India, South Africa, Poland, Hungary, Philippines, Colombia,
China, and Indonesia). A “typical” shock is defined as a one-standard-error shock of commoditiesor of U.S. dollars multiplied by standard error of the respective country’s
GDP in the VAR (vector autoregression) to account for variability in GDP growth rates. Also included in the VAR are GDP-weighted G7 nation’s real GDP growth and the J.P.
Morgan Emerging Markets Bond Index spread relative to similar-maturity U.S. Treasuries. VAR was estimated over the period 1999 through 2014. In using a VAR-based
analysis, we are assuming that shocks to the USD exchange rateand commodity prices occur exogenously with regard to conditions in emerging markets. This may not
always be the case, particularly for commodity pricesand when assessing the impact on larger emerging economies such as China.
Sources: Vanguard calculations, using data from Thomson Reuters Datastream, Moody’s Analytics Data Buffet, Organisationfor Economic Co-operation and Development,
Federal Reserve, World Bank, and emerging market central banks and statistical agencies.
34 FOR FINANCIAL ADVISORS ONLY. NOT FOR PUBLIC DISTRIBUTION.
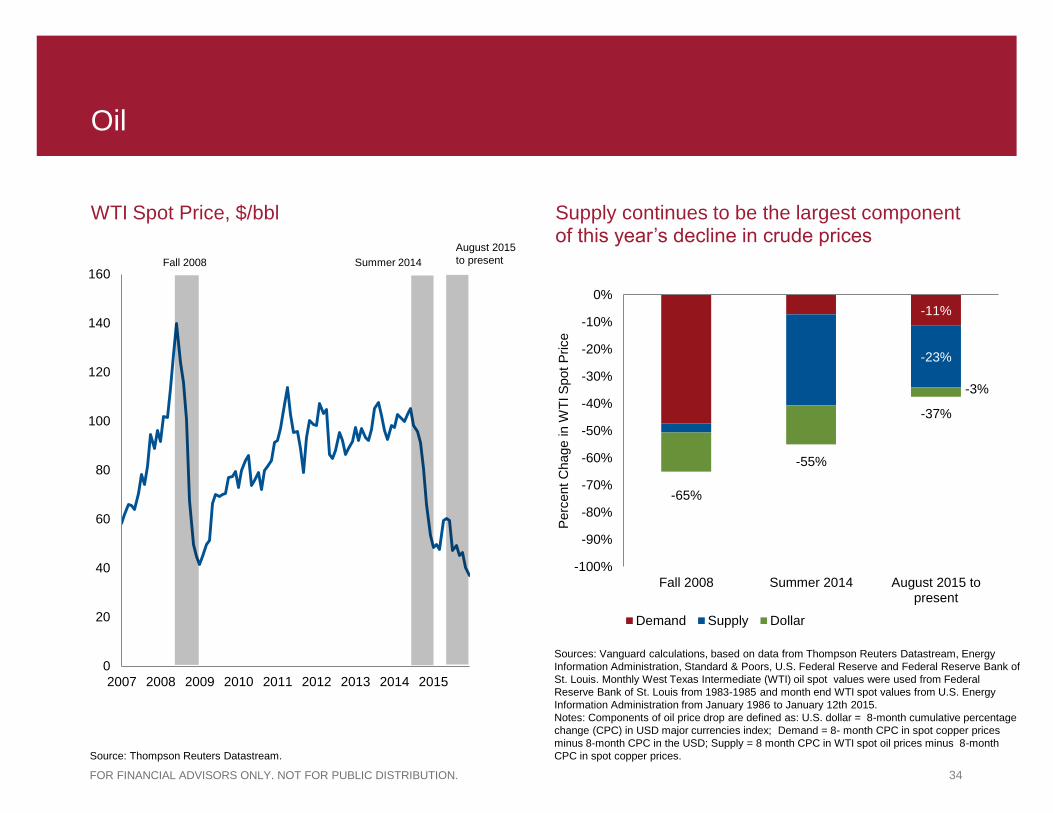
Oil
WTI Spot Price, $/bbl Supply continues to be the largest component of this year’s decline in crude prices
0
20
40
60
80
100
120
140
160
2007 2008 2009 2010 2011 2012 2013 2014 2015
-11%
-23%
-3%
-65%
-55%
-37%
-100%
-90%
-80%
-70%
-60%
-50%
-40%
-30%
-20%
-10%
0%
Fall 2008 Summer 2014 August 2015 topresent
Perc
ent
Chage in W
TI S
pot
Price
Demand Supply Dollar
Sources: Vanguard calculations, based on data from Thompson Reuters Datastream, Energy
Information Administration, Standard & Poors, U.S. Federal Reserve and Federal Reserve Bank of
St. Louis. Monthly West Texas Intermediate (WTI) oil spot values were used from Federal
Reserve Bank of St. Louis from 1983-1985 and month end WTI spot values from U.S. Energy
Information Administration from January 1986 to January 12th 2015.
Notes: Components of oil price drop are defined as: U.S. dollar = 8-month cumulative percentage
change (CPC) in USD major currencies index; Demand = 8- month CPC in spot copper prices
minus 8-month CPC in the USD; Supply = 8 month CPC in WTI spot oil prices minus 8-month
CPC in spot copper prices.
Source: Thompson Reuters Datastream.
Fall 2008 Summer 2014
August 2015
to present

35 FOR FINANCIAL ADVISORS ONLY. NOT FOR PUBLIC DISTRIBUTION.
Mixed success for Abenomics thus far P
erc
enta
ge o
f y
ear-
over-
year
gro
wth
Abenomics' 2% target for real growth and inflation
Sources: Vanguard calculations, based on data from Japan Ministry of Finance and J.P.Morgan.
-2%
-1%
0%
1%
2%
3%
4%
Bank Lending M2 Real GDP Nominal Wages Scheduled Earnings Core Core CPI ex VAT
Pre-Abenomics (2000 - 2012Q3)
Post-Abenomics (2012Q4 - 2015Q2)

36 FOR FINANCIAL ADVISORS ONLY. NOT FOR PUBLIC DISTRIBUTION.
Economic growth and equity returns: Be wary of the allure of high economic growth
Real GDP growth and real stock returns 1970–2015
Notes: Figures display each country’s average annualized real GDP growth rate along with that country’s average annualized real stock return. We include all members
of the FTSE All World Index (except the United Arab Emirates, for a lack of return history). The period covered begins in 1970, with the starting point for each country
depending on the availability of both returns and GDP data (most developed markets have data from 1970 onward, and most emerging markets have data from 1988
onward). Real growth rates are computed using data from the IMF’s World Economic Outlook database (for data prior to 1980, we use the April 2004 database;
otherwise we use the April 2013 database). Return data are based on MSCI country indexes spliced with FTSE indexes once the latter are available. Both growth and
return data are in real local terms, with the index returns deflated using the GDP deflator from the IMF databases. The 95% confidence interval for the cross-sectional
regression slope of returns on GDP growth is –0.51 to 0.61, with an R-squared of 0.00. Source: Vanguard, based on data from the IMF, MSCI, and FTSE.
Avera
ge a
nnual re
al equity m
ark
et re
turn
Mexico
Chile Brazil
Russia
India China
South Africa
Germany
R² = 0.03 U.K U.S
-15%
-10%
-5%
0%
5%
10%
15%
0% 1% 2% 3% 4% 5% 6% 7% 8% 9% 10%
Emerging PIGS BRICS Europe Core Developed
37 FOR FINANCIAL ADVISORS ONLY. NOT FOR PUBLIC DISTRIBUTION.
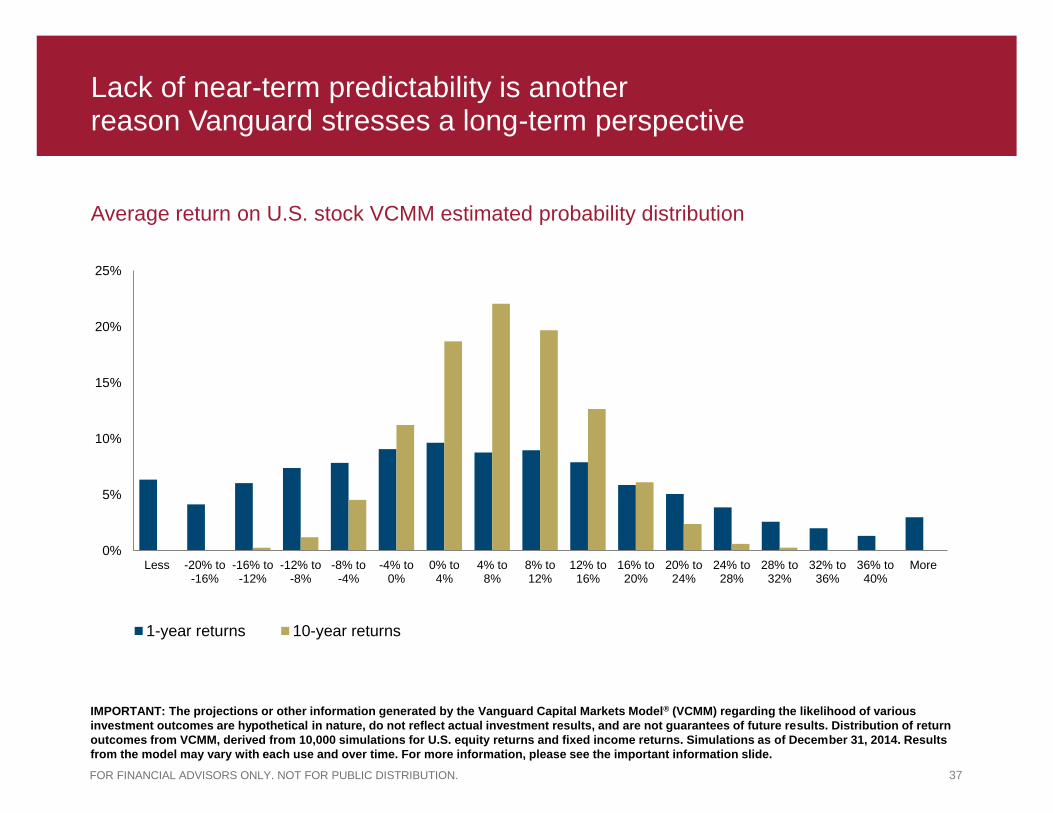
Lack of near-term predictability is another reason Vanguard stresses a long-term perspective
Average return on U.S. stock VCMM estimated probability distribution
IMPORTANT: The projections or other information generated by the Vanguard Capital Markets Model® (VCMM) regarding the likelihood of various
investment outcomes are hypothetical in nature, do not reflect actual investment results, and are not guarantees of future results. Distribution of return
outcomes from VCMM, derived from 10,000 simulations for U.S. equity returns and fixed income returns. Simulations as of December 31, 2014. Results
from the model may vary with each use and over time. For more information, please see the important information slide.
0%
5%
10%
15%
20%
25%
Less -20% to-16%
-16% to-12%
-12% to-8%
-8% to-4%
-4% to0%
0% to4%
4% to8%
8% to12%
12% to16%
16% to20%
20% to24%
24% to28%
28% to32%
32% to36%
36% to40%
More
1-year returns 10-year returns
38 FOR FINANCIAL ADVISORS ONLY. NOT FOR PUBLIC DISTRIBUTION.
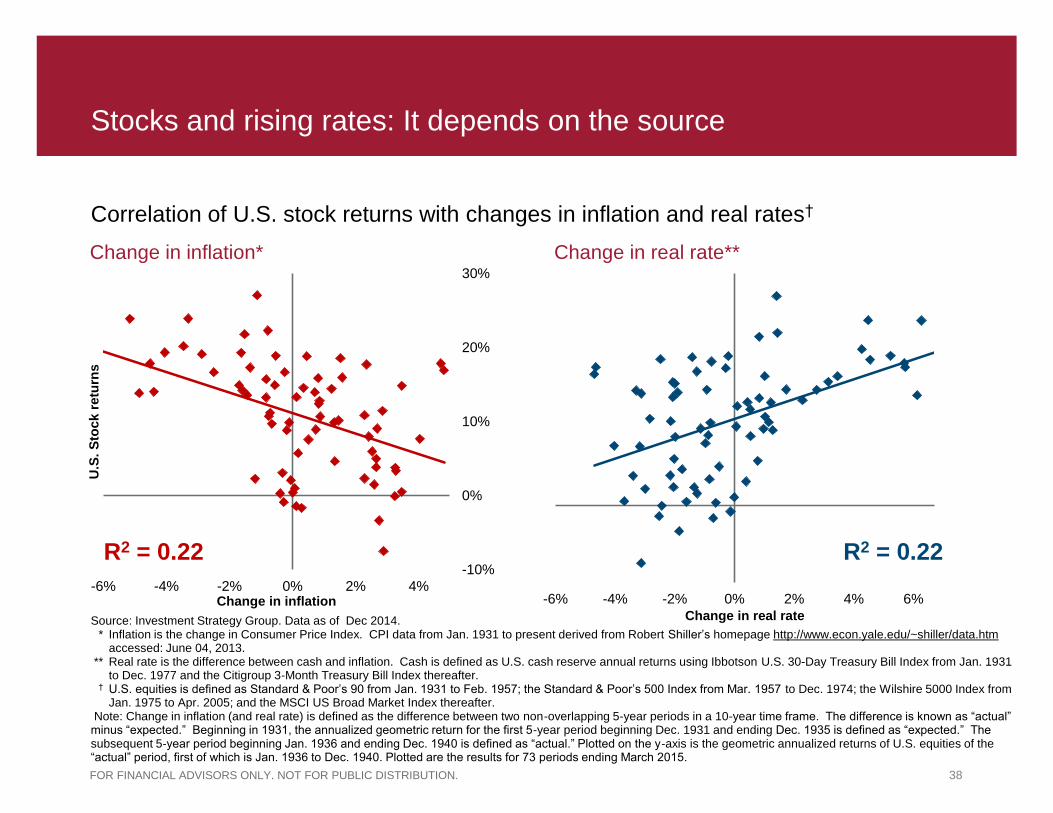
Stocks and rising rates: It depends on the source
Correlation of U.S. stock returns with changes in inflation and real rates†
Source: Investment Strategy Group. Data as of Dec 2014. * Inflation is the change in Consumer Price Index. CPI data from Jan. 1931 to present derived from Robert Shiller’s homepage http://www.econ.yale.edu/~shiller/data.htm
accessed: June 04, 2013. ** Real rate is the difference between cash and inflation. Cash is defined as U.S. cash reserve annual returns using Ibbotson U.S. 30-Day Treasury Bill Index from Jan. 1931
to Dec. 1977 and the Citigroup 3-Month Treasury Bill Index thereafter. † U.S. equities is defined as Standard & Poor’s 90 from Jan. 1931 to Feb. 1957; the Standard & Poor’s 500 Index from Mar. 1957 to Dec. 1974; the Wilshire 5000 Index from
Jan. 1975 to Apr. 2005; and the MSCI US Broad Market Index thereafter. Note: Change in inflation (and real rate) is defined as the difference between two non-overlapping 5-year periods in a 10-year time frame. The difference is known as “actual” minus “expected.” Beginning in 1931, the annualized geometric return for the first 5-year period beginning Dec. 1931 and ending Dec. 1935 is defined as “expected.” The subsequent 5-year period beginning Jan. 1936 and ending Dec. 1940 is defined as “actual.” Plotted on the y-axis is the geometric annualized returns of U.S. equities of the “actual” period, first of which is Jan. 1936 to Dec. 1940. Plotted are the results for 73 periods ending March 2015.
Change in inflation* Change in real rate**
-10%
0%
10%
20%
30%
-6% -4% -2% 0% 2% 4%
U.S
. S
tock r
etu
rns
Change in inflation
-10%
0%
10%
20%
30%
-6% -4% -2% 0% 2% 4% 6%
Change in real rate
R2 = 0.22 R2 = 0.22

39 FOR FINANCIAL ADVISORS ONLY. NOT FOR PUBLIC DISTRIBUTION.
0
5
10
15
20
25
30
35
40
45
50
1950 1955 1960 1965 1970 1975 1980 1985 1990 1995 2000 2005 2010 2015
Price/e
arn
ings r
atio
Plus/minus 1 standard error range
Shiller CAPE
Fair-value CAPE
Equity market does not appear grossly “overvalued” when adjusted for low rates
Shiller CAPE versus estimated fair-value CAPE
Notes: Fair-value CAPE (cyclically adjusted price/earnings) is based on a statistical model that corrects CAPE measures for the level of inflation expectations and for
interest rates. The statistical model specification is a three-variable vector error correction (VEC), including equity earnings-yield (S&P 500 Index), U.S. ten-year trailing
inflation, and 10-year U.S. Treasury yield estimated over the period January 1940–September 2015.
Sources: Vanguard calculations, based on data from Robert Shiller website, at aida.wss.yale.edu/~shiller/data.htm; U.S. Bureau of Labor Statistics; and Federal
Reserve Board.
Valuation difference is
explained by low interest
rates and inflation
Long-term average CAPE (1926-September 2015)
40 FOR FINANCIAL ADVISORS ONLY. NOT FOR PUBLIC DISTRIBUTION.
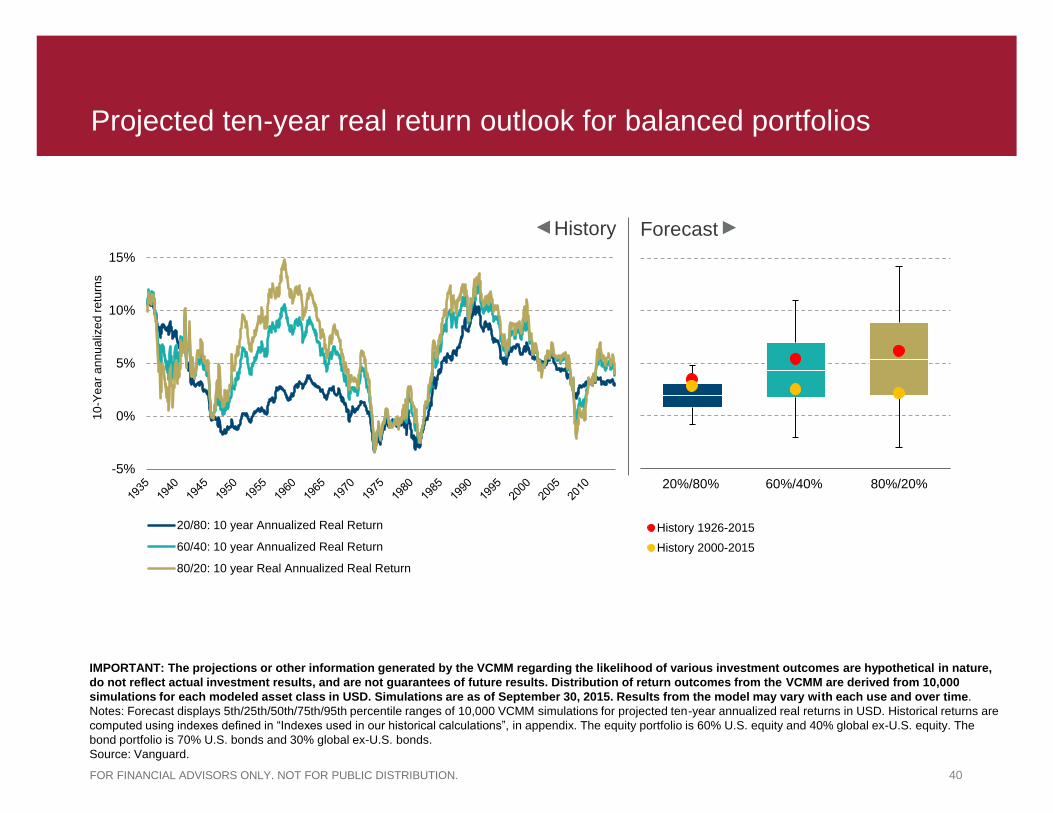
20%/80% 60%/40% 80%/20%
History 1926-2015
History 2000-2015
Projected ten-year real return outlook for balanced portfolios
-5%
0%
5%
10%
15%
20/80: 10 year Annualized Real Return
60/40: 10 year Annualized Real Return
80/20: 10 year Real Annualized Real Return
IMPORTANT: The projections or other information generated by the VCMM regarding the likelihood of various investment outcomes are hypothetical in nature,
do not reflect actual investment results, and are not guarantees of future results. Distribution of return outcomes from the VCMM are derived from 10,000
simulations for each modeled asset class in USD. Simulations are as of September 30, 2015. Results from the model may vary with each use and over time.
Notes: Forecast displays 5th/25th/50th/75th/95th percentile ranges of 10,000 VCMM simulations for projected ten-year annualized real returns in USD. Historical returns are
computed using indexes defined in “Indexes used in our historical calculations”, in appendix. The equity portfolio is 60% U.S. equity and 40% global ex-U.S. equity. The
bond portfolio is 70% U.S. bonds and 30% global ex-U.S. bonds.
Source: Vanguard.
History Forecast
10
-Ye
ar
an
nu
aliz
ed
re
turn
s