Vanguard Money Market Funds · Federal Money Market Fund ... the Federal Reserve raised the federal...
65
Vanguard Money Market Funds Vanguard Prime Money Market Fund Vanguard Federal Money Market Fund Vanguard Treasury Money Market Fund Annual Report | August 31, 2017
Transcript of Vanguard Money Market Funds · Federal Money Market Fund ... the Federal Reserve raised the federal...
Vanguard Money Market Funds
Vanguard Prime Money Market Fund
Vanguard Federal Money Market Fund
Vanguard Treasury Money Market Fund
Annual Report | August 31, 2017
Contents
Please note: The opinions expressed in this report are just that—informed opinions. They should not be considered promisesor advice. Also, please keep in mind that the information and opinions cover the period through the date on the front of thisreport. Of course, the risks of investing in your fund are spelled out in the prospectus.
See the Glossary for definitions of investment terms used in this report.About the cover: Nautical images have been part of Vanguard’s rich heritage since its start in 1975. For anincoming ship, a lighthouse offers a beacon and safe path to shore. You can similarly depend on Vanguard to putyou first––and light the way––as you strive to meet your financial goals. Our client focus and low costs,stemming from our unique ownership structure, assure that your interests are paramount.
Vanguard’s Principles for Investing Success
We want to give you the best chance of investment success. Theseprinciples, grounded in Vanguard’s research and experience, can put you onthe right path.
Goals. Create clear, appropriate investment goals.
Balance. Develop a suitable asset allocation using broadly diversified funds.
Cost. Minimize cost.
Discipline. Maintain perspective and long-term discipline.
A single theme unites these principles: Focus on the things you can control.We believe there is no wiser course for any investor.
Your Fund’s Performance at a Glance. . . . . . . . . . . . . . . . . . 1
Chairman’s Perspective. . . . . . . . . . . . . . . . . . . . . . . . . . . . . 3
Advisor’s Report. . . . . . . . . . . . . . . . . . . . . . . . . . . . . . . . . . . 7
Prime Money Market Fund. . . . . . . . . . . . . . . . . . . . . . . . . .10
Federal Money Market Fund. . . . . . . . . . . . . . . . . . . . . . . . 29
Treasury Money Market Fund. . . . . . . . . . . . . . . . . . . . . . . 43
About Your Fund’s Expenses. . . . . . . . . . . . . . . . . . . . . . . . 55
Trustees Approve Advisory Arrangements. . . . . . . . . . . . . .57
Glossary. . . . . . . . . . . . . . . . . . . . . . . . . . . . . . . . . . . . . . . . 59
Your Fund’s Performance at a Glance
1
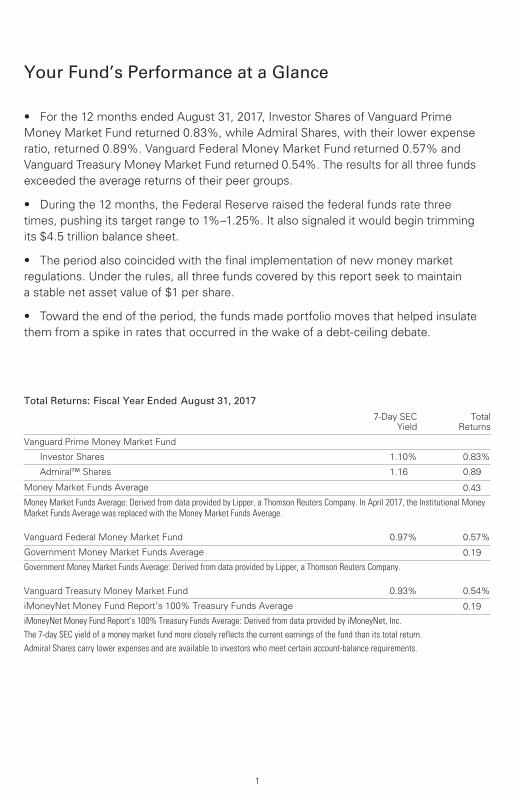
Total Returns: Fiscal Year Ended August 31, 2017
7-Day SEC Yield
TotalReturns
Vanguard Prime Money Market Fund
Investor Shares 1.10% 0.83%
Admiral™ Shares 1.16 0.89
Money Market Funds Average 0.43
Money Market Funds Average: Derived from data provided by Lipper, a Thomson Reuters Company. In April 2017, the Institutional MoneyMarket Funds Average was replaced with the Money Market Funds Average.
Vanguard Federal Money Market Fund 0.97% 0.57%
Government Money Market Funds Average 0.19
Government Money Market Funds Average: Derived from data provided by Lipper, a Thomson Reuters Company.
Vanguard Treasury Money Market Fund 0.93% 0.54%
iMoneyNet Money Fund Report’s 100% Treasury Funds Average 0.19
iMoneyNet Money Fund Report’s 100% Treasury Funds Average: Derived from data provided by iMoneyNet, Inc.The 7-day SEC yield of a money market fund more closely reflects the current earnings of the fund than its total return.Admiral Shares carry lower expenses and are available to investors who meet certain account-balance requirements.
• For the 12 months ended August 31, 2017, Investor Shares of Vanguard Prime Money Market Fund returned 0.83%, while Admiral Shares, with their lower expense ratio, returned 0.89%. Vanguard Federal Money Market Fund returned 0.57% and Vanguard Treasury Money Market Fund returned 0.54%. The results for all three funds exceeded the average returns of their peer groups.
• During the 12 months, the Federal Reserve raised the federal funds rate three times, pushing its target range to 1%–1.25%. It also signaled it would begin trimming its $4.5 trillion balance sheet.
• The period also coincided with the final implementation of new money market regulations. Under the rules, all three funds covered by this report seek to maintain a stable net asset value of $1 per share.
• Toward the end of the period, the funds made portfolio moves that helped insulate them from a spike in rates that occurred in the wake of a debt-ceiling debate.
2
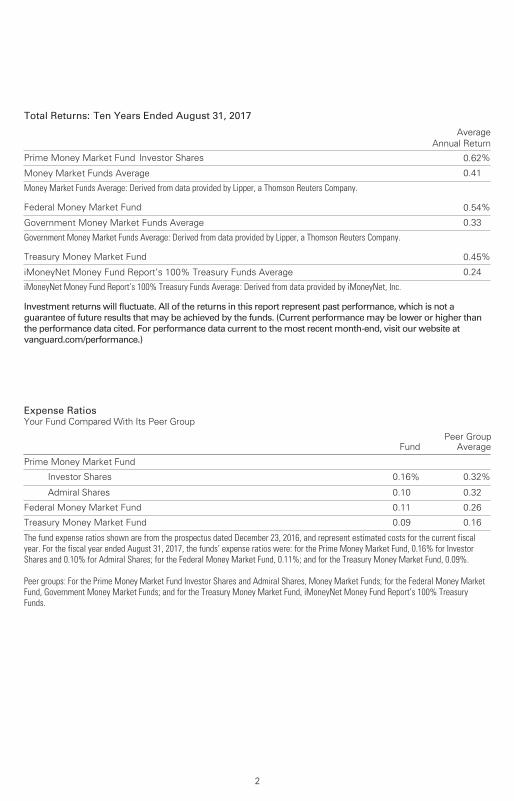
Total Returns: Ten Years Ended August 31, 2017
AverageAnnual Return
Prime Money Market Fund Investor Shares 0.62%
Money Market Funds Average 0.41
Money Market Funds Average: Derived from data provided by Lipper, a Thomson Reuters Company.
Federal Money Market Fund 0.54%
Government Money Market Funds Average 0.33
Government Money Market Funds Average: Derived from data provided by Lipper, a Thomson Reuters Company.
Treasury Money Market Fund 0.45%
iMoneyNet Money Fund Report’s 100% Treasury Funds Average 0.24
iMoneyNet Money Fund Report’s 100% Treasury Funds Average: Derived from data provided by iMoneyNet, Inc.
Investment returns will fluctuate. All of the returns in this report represent past performance, which is not a guarantee of future results that may be achieved by the funds. (Current performance may be lower or higher than the performance data cited. For performance data current to the most recent month-end, visit our website at vanguard.com/performance.)
Expense RatiosYour Fund Compared With Its Peer Group
FundPeer Group
Average
Prime Money Market Fund
Investor Shares 0.16% 0.32%
Admiral Shares 0.10 0.32
Federal Money Market Fund 0.11 0.26
Treasury Money Market Fund 0.09 0.16
The fund expense ratios shown are from the prospectus dated December 23, 2016, and represent estimated costs for the current fiscalyear. For the fiscal year ended August 31, 2017, the funds’ expense ratios were: for the Prime Money Market Fund, 0.16% for InvestorShares and 0.10% for Admiral Shares; for the Federal Money Market Fund, 0.11%; and for the Treasury Money Market Fund, 0.09%.
Peer groups: For the Prime Money Market Fund Investor Shares and Admiral Shares, Money Market Funds; for the Federal Money MarketFund, Government Money Market Funds; and for the Treasury Money Market Fund, iMoneyNet Money Fund Report’s 100% TreasuryFunds.

Dear Shareholder,
Since mid-August we’ve been reaching
out to you about the proposals put forth
by the Vanguard funds that, if approved,
will enable us to manage the funds more
efficiently and effectively. As the November
deadline for voting approaches, I’d like to
offer some perspective on a few of the
proposals that I believe are important to
the way Vanguard operates and manages
your investments. I hope you consider this
information and promptly cast your ballot.
Your biggest advocateThe main driver for this proxy solicitation
is to ask all our fund shareholders to elect
a full slate of trustees who oversee each
U.S.-based Vanguard mutual fund. These
trustees serve an important role, making
sure your funds are managed in your
best interests. This includes monitoring
fund performance, approving advisory
agreements, and ensuring that we’re
keeping your investment costs as low
as possible. Simply put, they are your
biggest advocate.
Each trustee brings a variety of skills and
professional experiences that contribute
to the board’s strength and diversity.
Of the 12 nominees, nine currently
serve on the board, and three are new.
If elected, the new board would include
ten independent members, meaning they
have no affiliation with Vanguard or the
funds apart from any investments they
may choose to make as private individuals.
Chairman’s Perspective
Bill McNabbChairman and Chief Executive Officer
3
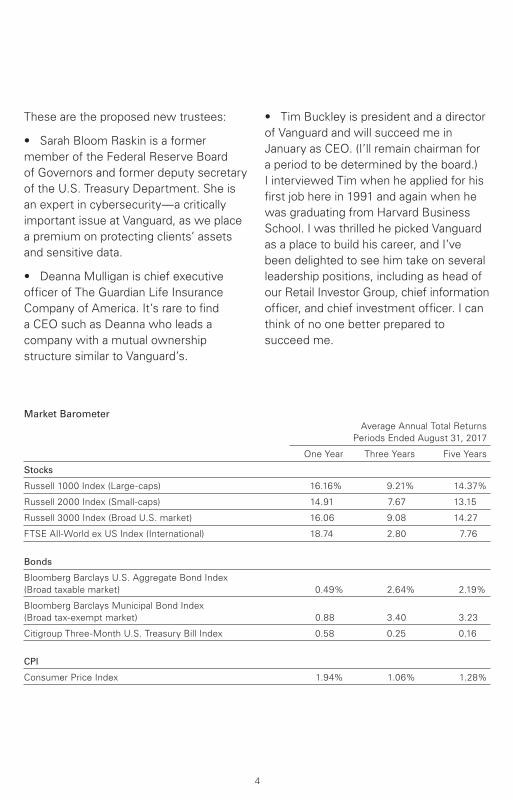
These are the proposed new trustees:
• Sarah Bloom Raskin is a former
member of the Federal Reserve Board
of Governors and former deputy secretary
of the U.S. Treasury Department. She is
an expert in cybersecurity—a critically
important issue at Vanguard, as we place
a premium on protecting clients’ assets
and sensitive data.
• Deanna Mulligan is chief executive
officer of The Guardian Life Insurance
Company of America. It’s rare to find
a CEO such as Deanna who leads a
company with a mutual ownership
structure similar to Vanguard’s.
• Tim Buckley is president and a director
of Vanguard and will succeed me in
January as CEO. (I’ll remain chairman for
a period to be determined by the board.)
I interviewed Tim when he applied for his
first job here in 1991 and again when he
was graduating from Harvard Business
School. I was thrilled he picked Vanguard
as a place to build his career, and I’ve
been delighted to see him take on several
leadership positions, including as head of
our Retail Investor Group, chief information
officer, and chief investment officer. I can
think of no one better prepared to
succeed me.
Market Barometer Average Annual Total Returns
Periods Ended August 31, 2017
One Year Three Years Five Years
Stocks
Russell 1000 Index (Large-caps) 16.16% 9.21% 14.37%
Russell 2000 Index (Small-caps) 14.91 7.67 13.15
Russell 3000 Index (Broad U.S. market) 16.06 9.08 14.27
FTSE All-World ex US Index (International) 18.74 2.80 7.76
Bonds
Bloomberg Barclays U.S. Aggregate Bond Index
(Broad taxable market) 0.49% 2.64% 2.19%
Bloomberg Barclays Municipal Bond Index
(Broad tax-exempt market) 0.88 3.40 3.23
Citigroup Three-Month U.S. Treasury Bill Index 0.58 0.25 0.16
CPI
Consumer Price Index 1.94% 1.06% 1.28%
4
Vanguard believes that diversity of
thought, background, and experience, as
well as diversity of personal characteristics,
meaningfully contributes to the board’s
ability to effectively serve shareholders.
If Sarah and Deanna are elected, women
will account for 40% of the board’s
independent trustees.
I should note that even as Vanguard is
nominating three new board members,
we’re saying goodbye to trustee Rajiv
Gupta. Rajiv was a legendary CEO of
Rohm and Haas Co., and Vanguard
and our clients have benefited greatly
from his expertise. I wish him a happy
retirement.
Summarizing the proposalsAmong the trustees’ leading responsibilities
is overseeing the funds’ internal and
external investment advisory agreements.
The trustees, in consultation with our
Global Investment Committee and our
Portfolio Review Department, choose the
investment advisors that manage client
assets. Over decades, we have built a
strong track record of picking advisors
whose portfolio management strategies
have served clients well.
Two proposals in the proxy focus on this
oversight responsibility. Shareholders of
48 Vanguard funds have already voted to
allow the board to make external advisor
changes without obtaining prior shareholder
approval. The new proposals would extend
that policy across our entire U.S.-based
fund lineup and expand it to include
internal advisory agreements with
Vanguard subsidiaries. Eliminating the
need for shareholder approval removes
a step that is costly and time-consuming
if done frequently or on an individual fund
basis. Although there are no current plans
to employ the policy on any Vanguard-
managed funds, standardizing it enables
the trustees to retain an advisory firm
to diversify a fund’s management team
or ensure management continuity should
a contingency arise.
I also encourage shareholders of several
specific Vanguard index funds to read the
proxy proposals that affect those funds.
One proposal would change the investment
objective of Vanguard REIT Index Fund
and Vanguard Variable Insurance Fund
REIT Index Portfolio to include real estate-
related securities, aligning the funds with
updated industry-sector classification
methodology. Another proposal seeks
to change the diversification status of
the REIT Index Fund to enable it to better
track its benchmark. Finally, we seek your
approval of the Funds’ Service Agreement
for Vanguard Institutional Index Fund and
Vanguard Institutional Total Stock Market
Index Fund. If approved, this arrangement
would then be standardized across
Vanguard’s entire publicly available U.S.
mutual fund lineup. It should also reduce
costs and minimum initial investment
requirements in select share classes.
5

At the ballot boxWe hope you’ll make it a priority to cast your ballot. We want to avoid the added time and cost of soliciting sufficient votes should we not obtain a quorum by the shareholder meeting on November 15, when voting concludes. Ultimately, we believe the proposals I’ve discussed are in your best interest as Vanguard fund shareholders, and the trustees recommend that you vote in favor of them. For more information, visit vanguard.com and enter the search term “proxy.”
As always, thank you for investing with Vanguard.
Sincerely,
F. William McNabb III Chairman and Chief Executive Officer September 14, 2017
6
Advisor’s Report
7
For the 12 months ended August 31, 2017, Investor Shares of Vanguard Prime Money Market Fund returned 0.83%, while Admiral Shares, with their lower expense ratio, returned 0.89%. Vanguard Federal Money Market Fund returned 0.57% and Vanguard Treasury Money Market Fund 0.54%. The results for all three funds exceeded the average returns of their peer groups.
The investment environmentThe period began with a wave of optimism, as investor attention turned from disappointing economic results in early 2016 to stronger-than-expected third-quarter GDP. That enthusiasm gained momentum in the wake of the U.S. presidential election as investors anticipated benefits from the new administration’s policy initiatives focused on tax reform, infrastructure spending, and greater deregulation. That fueled a shift to riskier assets, propelling many bellwether stock indexes to record highs in early 2017.
The Federal Reserve also acknowledged the economy’s strength. In December, it raised the federal funds target rate by a quarter percentage point—only the second increase in a decade. Although 2017 got off to a slow start, it picked up in the spring as consumers opened their wallets and the unemployment rate continued to grind lower. Those develop-ments most likely played a large part in the Fed’s further raising of rates in March and June, which pushed its target range to 1%–1.25%. Those moves, along with the establishment of a framework for trimming
its $4.5 trillion balance sheet, took the Fed closer to normalizing monetary policy after its emergency intervention in the wake of the Great Recession.
Inflation measures, on the other hand, disappointed. Annualized core inflation, which had been running at or above 2%, softened a little. In response, the Fed scaled back its 2017 inflation forecast but still expected inflation to move closer to its 2% target over the medium term. Further tightening in the labor market should help, although wage gains have been modest. Continued weakness in the dollar also could eventually feed through to higher prices.
Abroad, many major central banks including the Bank of Japan, the Bank of England, and the European Central Bank remained in accommodative policy mode as they struggled to balance growth and inflation concerns. Even with a weaker U.S. dollar, comparatively low yields across many developed markets kept U.S. bonds attractive to international investors.
The period concluded on an uncertain note, with investors fretting about a possible U.S. government shutdown over a debt-ceiling debate. Because the Fed’s rate moves were telegraphed in advance, the market responded with a measured increase in short-term rates. But the unexpected rhetoric around the debt-ceiling debate led to a sell-off in short-term bonds, causing their yields to spike as your fund’s fiscal year came to a close.
8
The yield of the 3-month U.S. Treasury note increased 66 basis points over the period, to 0.99%. The 2-year yield jumped 52 bps to 1.33%. On the longer end of the curve, the 10-year yield rose 54 bps to 2.12% and the 30-year yield rose 50 bps to 2.73%.
Management of the fundsThe start of the fiscal year coincided with final implementation of new money market regulations. In the run-up to the final compliance deadline in October 2016, more than $1 trillion in assets industrywide moved to government money market funds from prime money market funds; that led spreads to widen between short-term government securities and bank certificates of deposit.
In the weeks before the compliance deadline, we took steps to prepare for the volatility, including maintaining the funds’ liquidity in excess of U.S. Securities and Exchange Commission targets and shortening the weighted average maturity. These measures allowed us to provide maximum safety and liquidity. The volatility associated with final implementation has since dissipated.
Throughout the period, we added to the Prime Money Market Fund’s exposure to floating-rate securities. These debt instruments reset, typically every month, at prevailing interest rates. They performed well as the Fed raised rates, generating a large portion of the fund’s returns. We continued to purchase high-quality bonds, such as short-term corporate and bank
debt. Some of those bonds were from non-U.S. companies, enhancing the fund’s diversification.
We followed a similar strategy with the Federal Money Market Fund, increasing its exposure to floating-rate agency securities, and with the Treasury Money Market Fund, adding to its floating-rate Treasury securities; these moves allowed us to generate incremental yield while maintaining the funds’ short maturity profiles. We also continued to add to the Federal Money Market Fund’s Treasury exposure.
Across all three funds, as the debt-ceiling debate heated up, we sold Treasuries that were vulnerable to related market volatility. We reallocated those proceeds to other Treasury securities. We are closely monitoring any debt-ceiling developments that may occur later this year that could affect the markets.
A look aheadAbsent any external shocks, the U.S. economy is set to continue on its trajectory of modest but steady growth, with real GDP expanding by about 2% in 2017. The pace could pick up a little next year depending on the timing and size of any fiscal stimulus the government may enact.
We agree with the Fed’s assessment that the recent disinflation is transitory and that we will see consumer prices gradually rise through 2019. The Fed is likely to remain patient and cautious,
9
however, in carrying out monetary tightening. Some Fed officials have indicated they would favor waiting for inflation to reach or even modestly exceed 2% for some time before moving to raise rates more quickly. That could mean we won’t see another rate hike until the second half of 2018, especially if the Fed begins reducing its balance sheet later this year.
David R. Glocke, Principal
Vanguard Fixed Income Group
September 18, 2017
Prime Money Market Fund
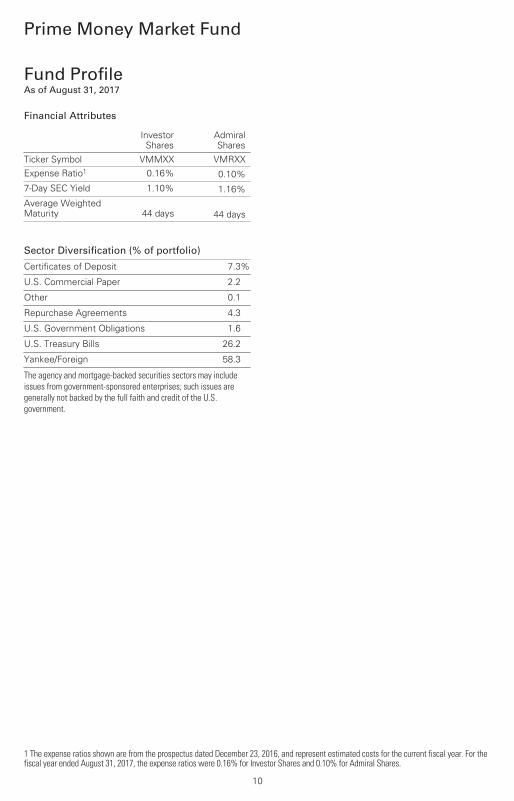
Fund ProfileAs of August 31, 2017
1 The expense ratios shown are from the prospectus dated December 23, 2016, and represent estimated costs for the current fiscal year. For the fiscal year ended August 31, 2017, the expense ratios were 0.16% for Investor Shares and 0.10% for Admiral Shares.
10
Financial Attributes
InvestorShares
AdmiralShares
Ticker Symbol VMMXX VMRXXExpense Ratio1 0.16% 0.10%7-Day SEC Yield 1.10% 1.16%Average WeightedMaturity 44 days 44 days
Sector Diversification (% of portfolio)
Certificates of Deposit 7.3%
U.S. Commercial Paper 2.2
Other 0.1
Repurchase Agreements 4.3
U.S. Government Obligations 1.6
U.S. Treasury Bills 26.2
Yankee/Foreign 58.3
The agency and mortgage-backed securities sectors may include issues from government-sponsored enterprises; such issues are generally not backed by the full faith and credit of the U.S. government.
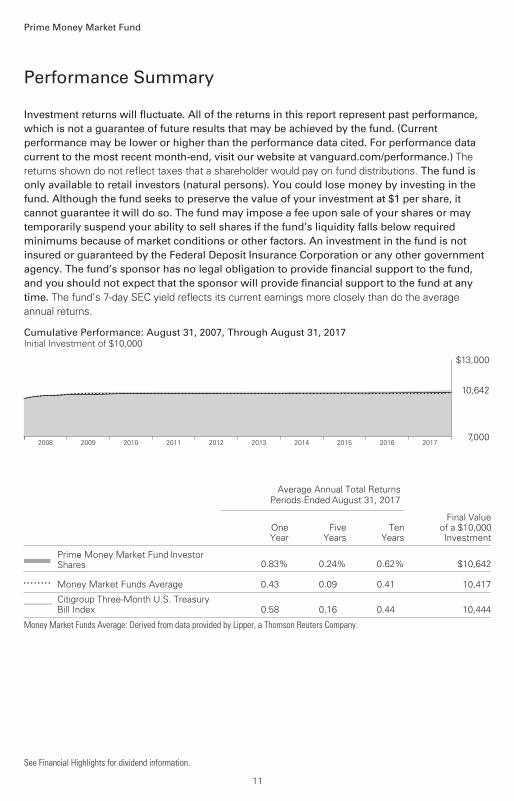
Performance Summary
Prime Money Market Fund
See Financial Highlights for dividend information.
Investment returns will fluctuate. All of the returns in this report represent past performance, which is not a guarantee of future results that may be achieved by the fund. (Current performance may be lower or higher than the performance data cited. For performance data current to the most recent month-end, visit our website at vanguard.com/performance.) The returns shown do not reflect taxes that a shareholder would pay on fund distributions. The fund is only available to retail investors (natural persons). You could lose money by investing in the fund. Although the fund seeks to preserve the value of your investment at $1 per share, it cannot guarantee it will do so. The fund may impose a fee upon sale of your shares or may temporarily suspend your ability to sell shares if the fund’s liquidity falls below required minimums because of market conditions or other factors. An investment in the fund is not insured or guaranteed by the Federal Deposit Insurance Corporation or any other government agency. The fund’s sponsor has no legal obligation to provide financial support to the fund, and you should not expect that the sponsor will provide financial support to the fund at any time. The fund’s 7-day SEC yield reflects its current earnings more closely than do the average annual returns.
11
Cumulative Performance: August 31, 2007, Through August 31, 2017Initial Investment of $10,000
2017201620152014201320122011201020092008
$13,000
7,000
10,642
Average Annual Total ReturnsPeriods Ended August 31, 2017
OneYear
FiveYears
TenYears
Final Valueof a $10,000Investment
Prime Money Market Fund InvestorShares 0.83% 0.24% 0.62% $10,642
• • • • • • • • Money Market Funds Average 0.43 0.09 0.41 10,417
________ Citigroup Three-Month U.S. TreasuryBill Index 0.58 0.16 0.44 10,444
Money Market Funds Average: Derived from data provided by Lipper, a Thomson Reuters Company.
Prime Money Market Fund
12
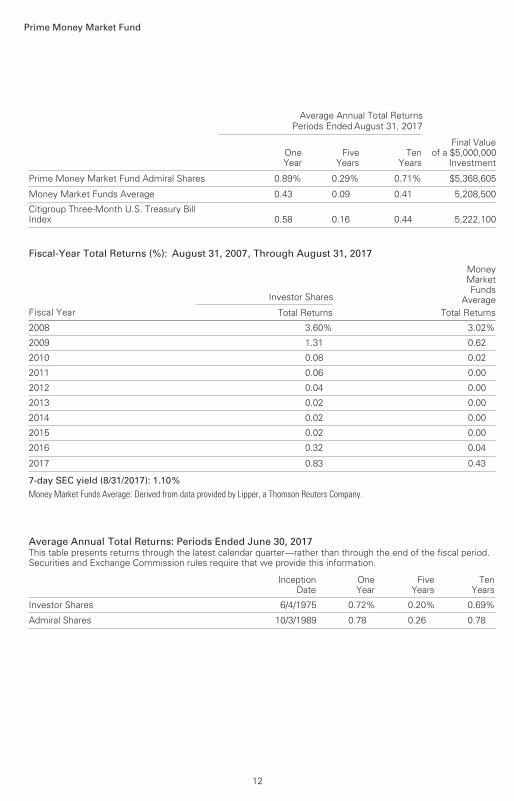
Average Annual Total ReturnsPeriods Ended August 31, 2017
OneYear
FiveYears
TenYears
Final Valueof a $5,000,000
Investment
Prime Money Market Fund Admiral Shares 0.89% 0.29% 0.71% $5,368,605
Money Market Funds Average 0.43 0.09 0.41 5,208,500
Citigroup Three-Month U.S. Treasury Bill Index 0.58 0.16 0.44 5,222,100
Fiscal-Year Total Returns (%): August 31, 2007, Through August 31, 2017
Investor Shares
MoneyMarketFunds
AverageFiscal Year Total Returns Total Returns
2008 3.60% 3.02%
2009 1.31 0.62
2010 0.08 0.02
2011 0.06 0.00
2012 0.04 0.00
2013 0.02 0.00
2014 0.02 0.00
2015 0.02 0.00
2016 0.32 0.04
2017 0.83 0.43
7-day SEC yield (8/31/2017): 1.10%Money Market Funds Average: Derived from data provided by Lipper, a Thomson Reuters Company.
Average Annual Total Returns: Periods Ended June 30, 2017This table presents returns through the latest calendar quarter—rather than through the end of the fiscal period.Securities and Exchange Commission rules require that we provide this information.
InceptionDate
OneYear
FiveYears
TenYears
Investor Shares 6/4/1975 0.72% 0.20% 0.69%
Admiral Shares 10/3/1989 0.78 0.26 0.78
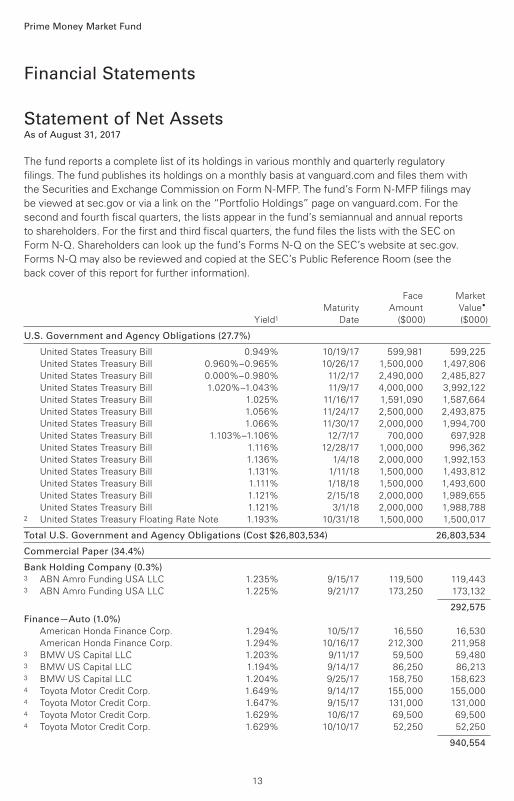
Financial Statements
Statement of Net AssetsAs of August 31, 2017
Prime Money Market Fund
U.S. Government and Agency Obligations (27.7%)
United States Treasury Bill 0.949% 10/19/17 599,981 599,225
United States Treasury Bill 0.960%–0.965% 10/26/17 1,500,000 1,497,806
United States Treasury Bill 0.000%–0.980% 11/2/17 2,490,000 2,485,827
United States Treasury Bill 1.020%–1.043% 11/9/17 4,000,000 3,992,122
United States Treasury Bill 1.025% 11/16/17 1,591,090 1,587,664
United States Treasury Bill 1.056% 11/24/17 2,500,000 2,493,875
United States Treasury Bill 1.066% 11/30/17 2,000,000 1,994,700
United States Treasury Bill 1.103%–1.106% 12/7/17 700,000 697,928
United States Treasury Bill 1.116% 12/28/17 1,000,000 996,362
United States Treasury Bill 1.136% 1/4/18 2,000,000 1,992,153
United States Treasury Bill 1.131% 1/11/18 1,500,000 1,493,812
United States Treasury Bill 1.111% 1/18/18 1,500,000 1,493,600
United States Treasury Bill 1.121% 2/15/18 2,000,000 1,989,655
United States Treasury Bill 1.121% 3/1/18 2,000,000 1,988,7882 United States Treasury Floating Rate Note 1.193% 10/31/18 1,500,000 1,500,017
Total U.S. Government and Agency Obligations (Cost $26,803,534) 26,803,534
Commercial Paper (34.4%)
Bank Holding Company (0.3%) 3 ABN Amro Funding USA LLC 1.235% 9/15/17 119,500 119,4433 ABN Amro Funding USA LLC 1.225% 9/21/17 173,250 173,132
292,575
Finance—Auto (1.0%)
American Honda Finance Corp. 1.294% 10/5/17 16,550 16,530
American Honda Finance Corp. 1.294% 10/16/17 212,300 211,9583 BMW US Capital LLC 1.203% 9/11/17 59,500 59,4803 BMW US Capital LLC 1.194% 9/14/17 86,250 86,2133 BMW US Capital LLC 1.204% 9/25/17 158,750 158,6234 Toyota Motor Credit Corp. 1.649% 9/14/17 155,000 155,0004 Toyota Motor Credit Corp. 1.647% 9/15/17 131,000 131,0004 Toyota Motor Credit Corp. 1.629% 10/6/17 69,500 69,5004 Toyota Motor Credit Corp. 1.629% 10/10/17 52,250 52,250
940,554
Face Market
Maturity Amount Value•
Yield1 Date ($000) ($000)
The fund reports a complete list of its holdings in various monthly and quarterly regulatory
filings. The fund publishes its holdings on a monthly basis at vanguard.com and files them with
the Securities and Exchange Commission on Form N-MFP. The fund’s Form N-MFP filings may
be viewed at sec.gov or via a link on the “Portfolio Holdings” page on vanguard.com. For the
second and fourth fiscal quarters, the lists appear in the fund’s semiannual and annual reports
to shareholders. For the first and third fiscal quarters, the fund files the lists with the SEC on
Form N-Q. Shareholders can look up the fund’s Forms N-Q on the SEC’s website at sec.gov.
Forms N-Q may also be reviewed and copied at the SEC’s Public Reference Room (see the
back cover of this report for further information).
13
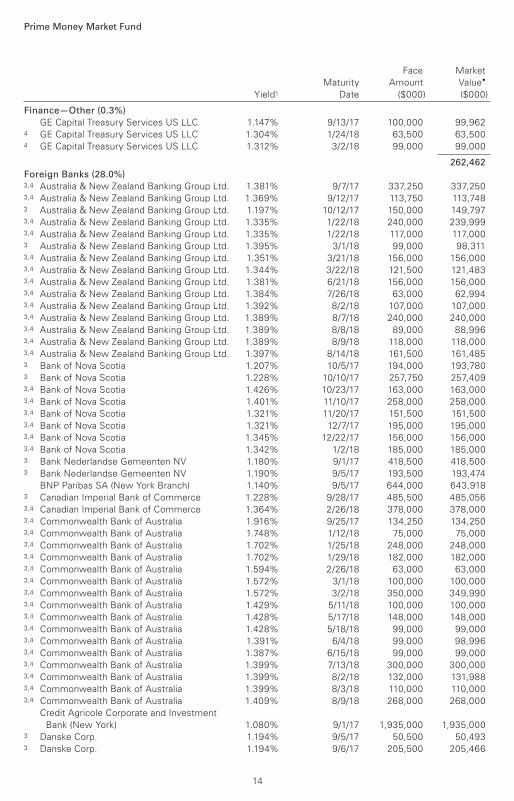
Prime Money Market Fund
Finance—Other (0.3%)
GE Capital Treasury Services US LLC 1.147% 9/13/17 100,000 99,9624 GE Capital Treasury Services US LLC 1.304% 1/24/18 63,500 63,5004 GE Capital Treasury Services US LLC 1.312% 3/2/18 99,000 99,000
262,462
Foreign Banks (28.0%) 3,4 Australia & New Zealand Banking Group Ltd. 1.381% 9/7/17 337,250 337,2503,4 Australia & New Zealand Banking Group Ltd. 1.369% 9/12/17 113,750 113,7483 Australia & New Zealand Banking Group Ltd. 1.197% 10/12/17 150,000 149,7973,4 Australia & New Zealand Banking Group Ltd. 1.335% 1/22/18 240,000 239,9993,4 Australia & New Zealand Banking Group Ltd. 1.335% 1/22/18 117,000 117,0003 Australia & New Zealand Banking Group Ltd. 1.395% 3/1/18 99,000 98,3113,4 Australia & New Zealand Banking Group Ltd. 1.351% 3/21/18 156,000 156,0003,4 Australia & New Zealand Banking Group Ltd. 1.344% 3/22/18 121,500 121,4833,4 Australia & New Zealand Banking Group Ltd. 1.381% 6/21/18 156,000 156,0003,4 Australia & New Zealand Banking Group Ltd. 1.384% 7/26/18 63,000 62,9943,4 Australia & New Zealand Banking Group Ltd. 1.392% 8/2/18 107,000 107,0003,4 Australia & New Zealand Banking Group Ltd. 1.389% 8/7/18 240,000 240,0003,4 Australia & New Zealand Banking Group Ltd. 1.389% 8/8/18 89,000 88,9963,4 Australia & New Zealand Banking Group Ltd. 1.389% 8/9/18 118,000 118,0003,4 Australia & New Zealand Banking Group Ltd. 1.397% 8/14/18 161,500 161,4853 Bank of Nova Scotia 1.207% 10/5/17 194,000 193,7803 Bank of Nova Scotia 1.228% 10/10/17 257,750 257,4093,4 Bank of Nova Scotia 1.426% 10/23/17 163,000 163,0003,4 Bank of Nova Scotia 1.401% 11/10/17 258,000 258,0003,4 Bank of Nova Scotia 1.321% 11/20/17 151,500 151,5003,4 Bank of Nova Scotia 1.321% 12/7/17 195,000 195,0003,4 Bank of Nova Scotia 1.345% 12/22/17 156,000 156,0003,4 Bank of Nova Scotia 1.342% 1/2/18 185,000 185,0003 Bank Nederlandse Gemeenten NV 1.180% 9/1/17 418,500 418,5003 Bank Nederlandse Gemeenten NV 1.190% 9/5/17 193,500 193,474
BNP Paribas SA (New York Branch) 1.140% 9/5/17 644,000 643,9183 Canadian Imperial Bank of Commerce 1.228% 9/28/17 485,500 485,0563,4 Canadian Imperial Bank of Commerce 1.364% 2/26/18 378,000 378,0003,4 Commonwealth Bank of Australia 1.916% 9/25/17 134,250 134,2503,4 Commonwealth Bank of Australia 1.748% 1/12/18 75,000 75,0003,4 Commonwealth Bank of Australia 1.702% 1/25/18 248,000 248,0003,4 Commonwealth Bank of Australia 1.702% 1/29/18 182,000 182,0003,4 Commonwealth Bank of Australia 1.594% 2/26/18 63,000 63,0003,4 Commonwealth Bank of Australia 1.572% 3/1/18 100,000 100,0003,4 Commonwealth Bank of Australia 1.572% 3/2/18 350,000 349,9903,4 Commonwealth Bank of Australia 1.429% 5/11/18 100,000 100,0003,4 Commonwealth Bank of Australia 1.428% 5/17/18 148,000 148,0003,4 Commonwealth Bank of Australia 1.428% 5/18/18 99,000 99,0003,4 Commonwealth Bank of Australia 1.391% 6/4/18 99,000 98,9963,4 Commonwealth Bank of Australia 1.387% 6/15/18 99,000 99,0003,4 Commonwealth Bank of Australia 1.399% 7/13/18 300,000 300,0003,4 Commonwealth Bank of Australia 1.399% 8/2/18 132,000 131,9883,4 Commonwealth Bank of Australia 1.399% 8/3/18 110,000 110,0003,4 Commonwealth Bank of Australia 1.409% 8/9/18 268,000 268,000
Credit Agricole Corporate and Investment
Bank (New York) 1.080% 9/1/17 1,935,000 1,935,0003 Danske Corp. 1.194% 9/5/17 50,500 50,4933 Danske Corp. 1.194% 9/6/17 205,500 205,466
Face Market
Maturity Amount Value•
Yield1 Date ($000) ($000)
14
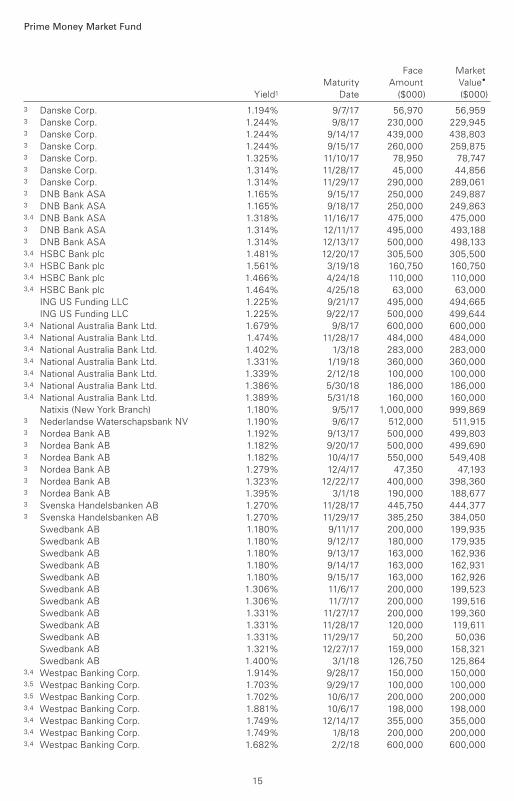
Prime Money Market Fund
3 Danske Corp. 1.194% 9/7/17 56,970 56,9593 Danske Corp. 1.244% 9/8/17 230,000 229,9453 Danske Corp. 1.244% 9/14/17 439,000 438,8033 Danske Corp. 1.244% 9/15/17 260,000 259,8753 Danske Corp. 1.325% 11/10/17 78,950 78,7473 Danske Corp. 1.314% 11/28/17 45,000 44,8563 Danske Corp. 1.314% 11/29/17 290,000 289,0613 DNB Bank ASA 1.165% 9/15/17 250,000 249,8873 DNB Bank ASA 1.165% 9/18/17 250,000 249,8633,4 DNB Bank ASA 1.318% 11/16/17 475,000 475,0003 DNB Bank ASA 1.314% 12/11/17 495,000 493,1883 DNB Bank ASA 1.314% 12/13/17 500,000 498,1333,4 HSBC Bank plc 1.481% 12/20/17 305,500 305,5003,4 HSBC Bank plc 1.561% 3/19/18 160,750 160,7503,4 HSBC Bank plc 1.466% 4/24/18 110,000 110,0003,4 HSBC Bank plc 1.464% 4/25/18 63,000 63,000 ING US Funding LLC 1.225% 9/21/17 495,000 494,665 ING US Funding LLC 1.225% 9/22/17 500,000 499,6443,4 National Australia Bank Ltd. 1.679% 9/8/17 600,000 600,0003,4 National Australia Bank Ltd. 1.474% 11/28/17 484,000 484,0003,4 National Australia Bank Ltd. 1.402% 1/3/18 283,000 283,0003,4 National Australia Bank Ltd. 1.331% 1/19/18 360,000 360,0003,4 National Australia Bank Ltd. 1.339% 2/12/18 100,000 100,0003,4 National Australia Bank Ltd. 1.386% 5/30/18 186,000 186,0003,4 National Australia Bank Ltd. 1.389% 5/31/18 160,000 160,000 Natixis (New York Branch) 1.180% 9/5/17 1,000,000 999,8693 Nederlandse Waterschapsbank NV 1.190% 9/6/17 512,000 511,9153 Nordea Bank AB 1.192% 9/13/17 500,000 499,8033 Nordea Bank AB 1.182% 9/20/17 500,000 499,6903 Nordea Bank AB 1.182% 10/4/17 550,000 549,4083 Nordea Bank AB 1.279% 12/4/17 47,350 47,1933 Nordea Bank AB 1.323% 12/22/17 400,000 398,3603 Nordea Bank AB 1.395% 3/1/18 190,000 188,6773 Svenska Handelsbanken AB 1.270% 11/28/17 445,750 444,3773 Svenska Handelsbanken AB 1.270% 11/29/17 385,250 384,050 Swedbank AB 1.180% 9/11/17 200,000 199,935 Swedbank AB 1.180% 9/12/17 180,000 179,935 Swedbank AB 1.180% 9/13/17 163,000 162,936 Swedbank AB 1.180% 9/14/17 163,000 162,931 Swedbank AB 1.180% 9/15/17 163,000 162,926 Swedbank AB 1.306% 11/6/17 200,000 199,523 Swedbank AB 1.306% 11/7/17 200,000 199,516 Swedbank AB 1.331% 11/27/17 200,000 199,360 Swedbank AB 1.331% 11/28/17 120,000 119,611 Swedbank AB 1.331% 11/29/17 50,200 50,036 Swedbank AB 1.321% 12/27/17 159,000 158,321 Swedbank AB 1.400% 3/1/18 126,750 125,8643,4 Westpac Banking Corp. 1.914% 9/28/17 150,000 150,0003,5 Westpac Banking Corp. 1.703% 9/29/17 100,000 100,0003,5 Westpac Banking Corp. 1.702% 10/6/17 200,000 200,0003,4 Westpac Banking Corp. 1.881% 10/6/17 198,000 198,0003,4 Westpac Banking Corp. 1.749% 12/14/17 355,000 355,0003,4 Westpac Banking Corp. 1.749% 1/8/18 200,000 200,0003,4 Westpac Banking Corp. 1.682% 2/2/18 600,000 600,000
Face Market Maturity Amount Value• Yield1 Date ($000) ($000)
15
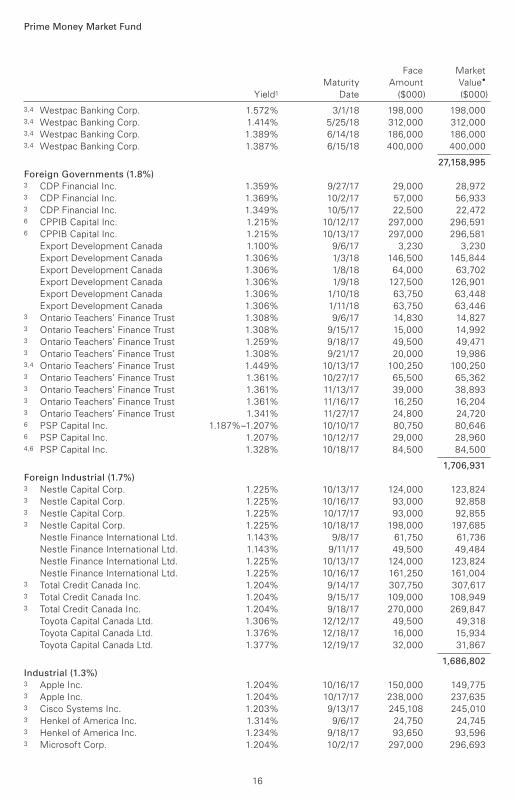
Prime Money Market Fund
3,4 Westpac Banking Corp. 1.572% 3/1/18 198,000 198,0003,4 Westpac Banking Corp. 1.414% 5/25/18 312,000 312,0003,4 Westpac Banking Corp. 1.389% 6/14/18 186,000 186,0003,4 Westpac Banking Corp. 1.387% 6/15/18 400,000 400,000
27,158,995
Foreign Governments (1.8%) 3 CDP Financial Inc. 1.359% 9/27/17 29,000 28,9723 CDP Financial Inc. 1.369% 10/2/17 57,000 56,9333 CDP Financial Inc. 1.349% 10/5/17 22,500 22,4726 CPPIB Capital Inc. 1.215% 10/12/17 297,000 296,5916 CPPIB Capital Inc. 1.215% 10/13/17 297,000 296,581
Export Development Canada 1.100% 9/6/17 3,230 3,230
Export Development Canada 1.306% 1/3/18 146,500 145,844
Export Development Canada 1.306% 1/8/18 64,000 63,702
Export Development Canada 1.306% 1/9/18 127,500 126,901
Export Development Canada 1.306% 1/10/18 63,750 63,448
Export Development Canada 1.306% 1/11/18 63,750 63,4463 Ontario Teachers’ Finance Trust 1.308% 9/6/17 14,830 14,8273 Ontario Teachers’ Finance Trust 1.308% 9/15/17 15,000 14,9923 Ontario Teachers’ Finance Trust 1.259% 9/18/17 49,500 49,4713 Ontario Teachers’ Finance Trust 1.308% 9/21/17 20,000 19,9863,4 Ontario Teachers’ Finance Trust 1.449% 10/13/17 100,250 100,2503 Ontario Teachers’ Finance Trust 1.361% 10/27/17 65,500 65,3623 Ontario Teachers’ Finance Trust 1.361% 11/13/17 39,000 38,8933 Ontario Teachers’ Finance Trust 1.361% 11/16/17 16,250 16,2043 Ontario Teachers’ Finance Trust 1.341% 11/27/17 24,800 24,7206 PSP Capital Inc. 1.187%–1.207% 10/10/17 80,750 80,6466 PSP Capital Inc. 1.207% 10/12/17 29,000 28,9604,6 PSP Capital Inc. 1.328% 10/18/17 84,500 84,500
1,706,931
Foreign Industrial (1.7%) 3 Nestle Capital Corp. 1.225% 10/13/17 124,000 123,8243 Nestle Capital Corp. 1.225% 10/16/17 93,000 92,8583 Nestle Capital Corp. 1.225% 10/17/17 93,000 92,8553 Nestle Capital Corp. 1.225% 10/18/17 198,000 197,685
Nestle Finance International Ltd. 1.143% 9/8/17 61,750 61,736
Nestle Finance International Ltd. 1.143% 9/11/17 49,500 49,484
Nestle Finance International Ltd. 1.225% 10/13/17 124,000 123,824
Nestle Finance International Ltd. 1.225% 10/16/17 161,250 161,0043 Total Credit Canada Inc. 1.204% 9/14/17 307,750 307,6173 Total Credit Canada Inc. 1.204% 9/15/17 109,000 108,9493 Total Credit Canada Inc. 1.204% 9/18/17 270,000 269,847
Toyota Capital Canada Ltd. 1.306% 12/12/17 49,500 49,318
Toyota Capital Canada Ltd. 1.376% 12/18/17 16,000 15,934
Toyota Capital Canada Ltd. 1.377% 12/19/17 32,000 31,867
1,686,802
Industrial (1.3%) 3 Apple Inc. 1.204% 10/16/17 150,000 149,7753 Apple Inc. 1.204% 10/17/17 238,000 237,6353 Cisco Systems Inc. 1.203% 9/13/17 245,108 245,0103 Henkel of America Inc. 1.314% 9/6/17 24,750 24,7453 Henkel of America Inc. 1.234% 9/18/17 93,650 93,5963 Microsoft Corp. 1.204% 10/2/17 297,000 296,693
Face Market
Maturity Amount Value•
Yield1 Date ($000) ($000)
16
Prime Money Market Fund
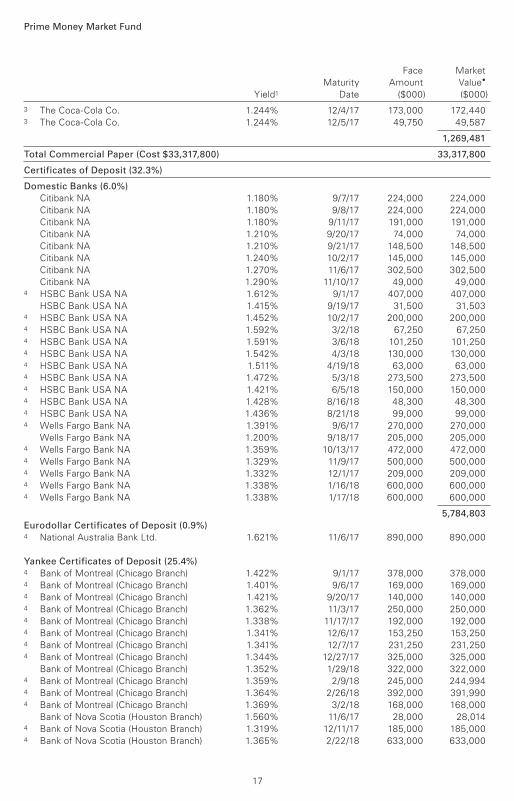
3 The Coca-Cola Co. 1.244% 12/4/17 173,000 172,4403 The Coca-Cola Co. 1.244% 12/5/17 49,750 49,587
1,269,481
Total Commercial Paper (Cost $33,317,800) 33,317,800
Certificates of Deposit (32.3%)
Domestic Banks (6.0%)
Citibank NA 1.180% 9/7/17 224,000 224,000
Citibank NA 1.180% 9/8/17 224,000 224,000
Citibank NA 1.180% 9/11/17 191,000 191,000
Citibank NA 1.210% 9/20/17 74,000 74,000
Citibank NA 1.210% 9/21/17 148,500 148,500
Citibank NA 1.240% 10/2/17 145,000 145,000
Citibank NA 1.270% 11/6/17 302,500 302,500
Citibank NA 1.290% 11/10/17 49,000 49,0004 HSBC Bank USA NA 1.612% 9/1/17 407,000 407,000
HSBC Bank USA NA 1.415% 9/19/17 31,500 31,5034 HSBC Bank USA NA 1.452% 10/2/17 200,000 200,0004 HSBC Bank USA NA 1.592% 3/2/18 67,250 67,2504 HSBC Bank USA NA 1.591% 3/6/18 101,250 101,2504 HSBC Bank USA NA 1.542% 4/3/18 130,000 130,0004 HSBC Bank USA NA 1.511% 4/19/18 63,000 63,0004 HSBC Bank USA NA 1.472% 5/3/18 273,500 273,5004 HSBC Bank USA NA 1.421% 6/5/18 150,000 150,0004 HSBC Bank USA NA 1.428% 8/16/18 48,300 48,3004 HSBC Bank USA NA 1.436% 8/21/18 99,000 99,0004 Wells Fargo Bank NA 1.391% 9/6/17 270,000 270,000
Wells Fargo Bank NA 1.200% 9/18/17 205,000 205,0004 Wells Fargo Bank NA 1.359% 10/13/17 472,000 472,0004 Wells Fargo Bank NA 1.329% 11/9/17 500,000 500,0004 Wells Fargo Bank NA 1.332% 12/1/17 209,000 209,0004 Wells Fargo Bank NA 1.338% 1/16/18 600,000 600,0004 Wells Fargo Bank NA 1.338% 1/17/18 600,000 600,000
5,784,803
Eurodollar Certificates of Deposit (0.9%) 4 National Australia Bank Ltd. 1.621% 11/6/17 890,000 890,000
Yankee Certificates of Deposit (25.4%) 4 Bank of Montreal (Chicago Branch) 1.422% 9/1/17 378,000 378,0004 Bank of Montreal (Chicago Branch) 1.401% 9/6/17 169,000 169,0004 Bank of Montreal (Chicago Branch) 1.421% 9/20/17 140,000 140,0004 Bank of Montreal (Chicago Branch) 1.362% 11/3/17 250,000 250,0004 Bank of Montreal (Chicago Branch) 1.338% 11/17/17 192,000 192,0004 Bank of Montreal (Chicago Branch) 1.341% 12/6/17 153,250 153,2504 Bank of Montreal (Chicago Branch) 1.341% 12/7/17 231,250 231,2504 Bank of Montreal (Chicago Branch) 1.344% 12/27/17 325,000 325,000
Bank of Montreal (Chicago Branch) 1.352% 1/29/18 322,000 322,0004 Bank of Montreal (Chicago Branch) 1.359% 2/9/18 245,000 244,9944 Bank of Montreal (Chicago Branch) 1.364% 2/26/18 392,000 391,9904 Bank of Montreal (Chicago Branch) 1.369% 3/2/18 168,000 168,000
Bank of Nova Scotia (Houston Branch) 1.560% 11/6/17 28,000 28,0144 Bank of Nova Scotia (Houston Branch) 1.319% 12/11/17 185,000 185,0004 Bank of Nova Scotia (Houston Branch) 1.365% 2/22/18 633,000 633,000
Face Market
Maturity Amount Value•
Yield1 Date ($000) ($000)
17
Prime Money Market Fund
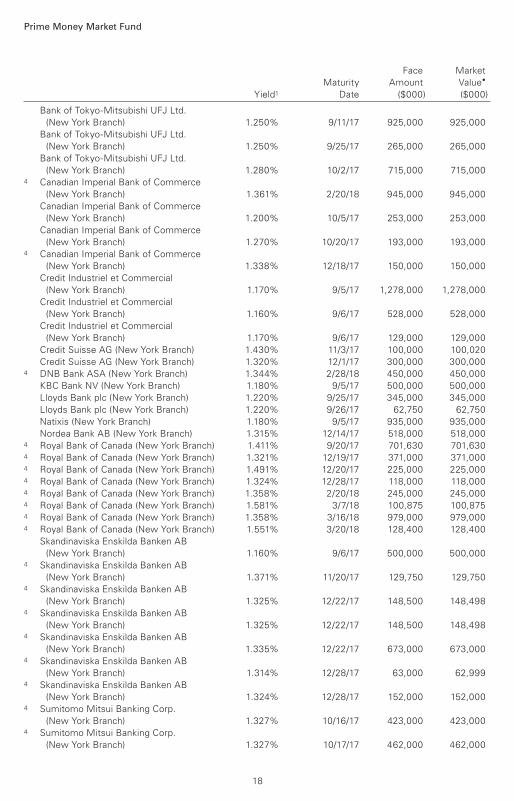
Bank of Tokyo-Mitsubishi UFJ Ltd.
(New York Branch) 1.250% 9/11/17 925,000 925,000
Bank of Tokyo-Mitsubishi UFJ Ltd.
(New York Branch) 1.250% 9/25/17 265,000 265,000
Bank of Tokyo-Mitsubishi UFJ Ltd.
(New York Branch) 1.280% 10/2/17 715,000 715,0004 Canadian Imperial Bank of Commerce
(New York Branch) 1.361% 2/20/18 945,000 945,000
Canadian Imperial Bank of Commerce
(New York Branch) 1.200% 10/5/17 253,000 253,000
Canadian Imperial Bank of Commerce
(New York Branch) 1.270% 10/20/17 193,000 193,0004 Canadian Imperial Bank of Commerce
(New York Branch) 1.338% 12/18/17 150,000 150,000
Credit Industriel et Commercial
(New York Branch) 1.170% 9/5/17 1,278,000 1,278,000
Credit Industriel et Commercial
(New York Branch) 1.160% 9/6/17 528,000 528,000
Credit Industriel et Commercial
(New York Branch) 1.170% 9/6/17 129,000 129,000
Credit Suisse AG (New York Branch) 1.430% 11/3/17 100,000 100,020
Credit Suisse AG (New York Branch) 1.320% 12/1/17 300,000 300,0004 DNB Bank ASA (New York Branch) 1.344% 2/28/18 450,000 450,000
KBC Bank NV (New York Branch) 1.180% 9/5/17 500,000 500,000
Lloyds Bank plc (New York Branch) 1.220% 9/25/17 345,000 345,000
Lloyds Bank plc (New York Branch) 1.220% 9/26/17 62,750 62,750
Natixis (New York Branch) 1.180% 9/5/17 935,000 935,000
Nordea Bank AB (New York Branch) 1.315% 12/14/17 518,000 518,0004 Royal Bank of Canada (New York Branch) 1.411% 9/20/17 701,630 701,6304 Royal Bank of Canada (New York Branch) 1.321% 12/19/17 371,000 371,0004 Royal Bank of Canada (New York Branch) 1.491% 12/20/17 225,000 225,0004 Royal Bank of Canada (New York Branch) 1.324% 12/28/17 118,000 118,0004 Royal Bank of Canada (New York Branch) 1.358% 2/20/18 245,000 245,0004 Royal Bank of Canada (New York Branch) 1.581% 3/7/18 100,875 100,8754 Royal Bank of Canada (New York Branch) 1.358% 3/16/18 979,000 979,0004 Royal Bank of Canada (New York Branch) 1.551% 3/20/18 128,400 128,400
Skandinaviska Enskilda Banken AB
(New York Branch) 1.160% 9/6/17 500,000 500,0004 Skandinaviska Enskilda Banken AB
(New York Branch) 1.371% 11/20/17 129,750 129,7504 Skandinaviska Enskilda Banken AB
(New York Branch) 1.325% 12/22/17 148,500 148,4984 Skandinaviska Enskilda Banken AB
(New York Branch) 1.325% 12/22/17 148,500 148,4984 Skandinaviska Enskilda Banken AB
(New York Branch) 1.335% 12/22/17 673,000 673,0004 Skandinaviska Enskilda Banken AB
(New York Branch) 1.314% 12/28/17 63,000 62,9994 Skandinaviska Enskilda Banken AB
(New York Branch) 1.324% 12/28/17 152,000 152,0004 Sumitomo Mitsui Banking Corp.
(New York Branch) 1.327% 10/16/17 423,000 423,0004 Sumitomo Mitsui Banking Corp.
(New York Branch) 1.327% 10/17/17 462,000 462,000
Face Market
Maturity Amount Value•
Yield1 Date ($000) ($000)
18
Prime Money Market Fund
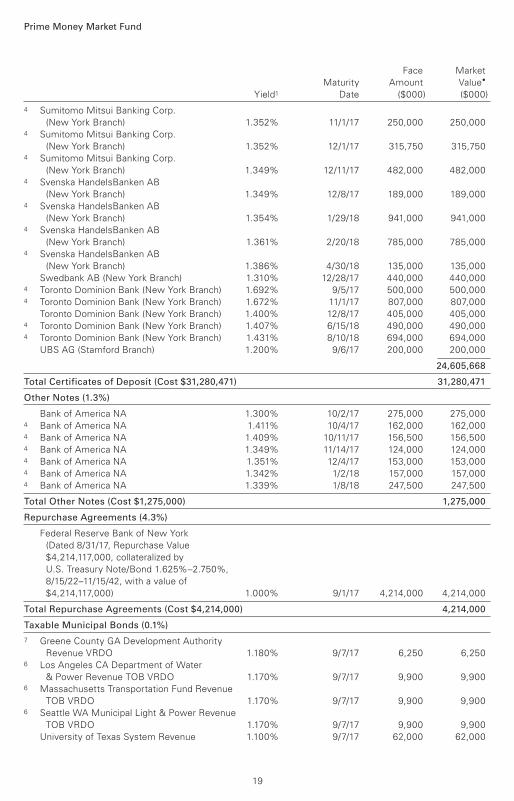
4 Sumitomo Mitsui Banking Corp.
(New York Branch) 1.352% 11/1/17 250,000 250,0004 Sumitomo Mitsui Banking Corp.
(New York Branch) 1.352% 12/1/17 315,750 315,7504 Sumitomo Mitsui Banking Corp.
(New York Branch) 1.349% 12/11/17 482,000 482,0004 Svenska HandelsBanken AB
(New York Branch) 1.349% 12/8/17 189,000 189,0004 Svenska HandelsBanken AB
(New York Branch) 1.354% 1/29/18 941,000 941,0004 Svenska HandelsBanken AB
(New York Branch) 1.361% 2/20/18 785,000 785,0004 Svenska HandelsBanken AB
(New York Branch) 1.386% 4/30/18 135,000 135,000
Swedbank AB (New York Branch) 1.310% 12/28/17 440,000 440,0004 Toronto Dominion Bank (New York Branch) 1.692% 9/5/17 500,000 500,0004 Toronto Dominion Bank (New York Branch) 1.672% 11/1/17 807,000 807,000
Toronto Dominion Bank (New York Branch) 1.400% 12/8/17 405,000 405,0004 Toronto Dominion Bank (New York Branch) 1.407% 6/15/18 490,000 490,0004 Toronto Dominion Bank (New York Branch) 1.431% 8/10/18 694,000 694,000
UBS AG (Stamford Branch) 1.200% 9/6/17 200,000 200,000
24,605,668
Total Certificates of Deposit (Cost $31,280,471) 31,280,471
Other Notes (1.3%)
Bank of America NA 1.300% 10/2/17 275,000 275,0004 Bank of America NA 1.411% 10/4/17 162,000 162,0004 Bank of America NA 1.409% 10/11/17 156,500 156,5004 Bank of America NA 1.349% 11/14/17 124,000 124,0004 Bank of America NA 1.351% 12/4/17 153,000 153,0004 Bank of America NA 1.342% 1/2/18 157,000 157,0004 Bank of America NA 1.339% 1/8/18 247,500 247,500
Total Other Notes (Cost $1,275,000) 1,275,000
Repurchase Agreements (4.3%)
Federal Reserve Bank of New York
(Dated 8/31/17, Repurchase Value
$4,214,117,000, collateralized by
U.S. Treasury Note/Bond 1.625%–2.750%,
8/15/22–11/15/42, with a value of
$4,214,117,000) 1.000% 9/1/17 4,214,000 4,214,000
Total Repurchase Agreements (Cost $4,214,000) 4,214,000
Taxable Municipal Bonds (0.1%)
7 Greene County GA Development Authority
Revenue VRDO 1.180% 9/7/17 6,250 6,2506 Los Angeles CA Department of Water
& Power Revenue TOB VRDO 1.170% 9/7/17 9,900 9,9006 Massachusetts Transportation Fund Revenue
TOB VRDO 1.170% 9/7/17 9,900 9,9006 Seattle WA Municipal Light & Power Revenue
TOB VRDO 1.170% 9/7/17 9,900 9,900
University of Texas System Revenue 1.100% 9/7/17 62,000 62,000
Face Market
Maturity Amount Value•
Yield1 Date ($000) ($000)
19
Prime Money Market Fund
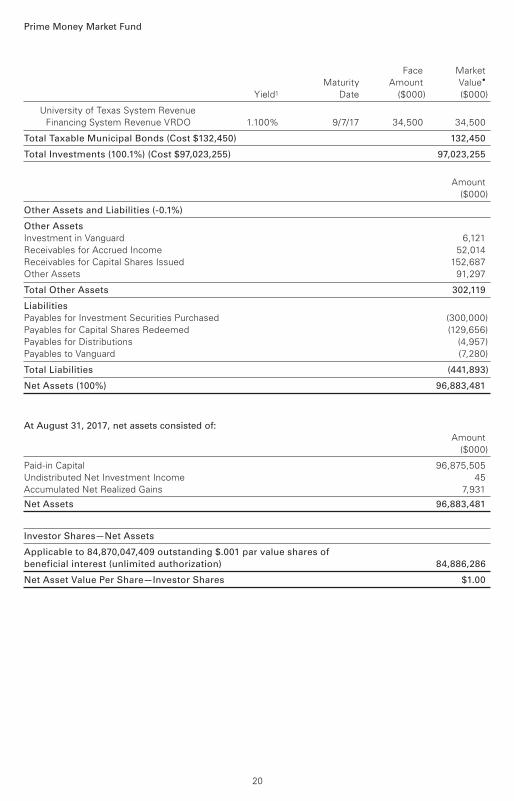
University of Texas System Revenue
Financing System Revenue VRDO 1.100% 9/7/17 34,500 34,500
Total Taxable Municipal Bonds (Cost $132,450) 132,450
Total Investments (100.1%) (Cost $97,023,255) 97,023,255
Amount
($000)
Other Assets and Liabilities (-0.1%)
Other Assets
Investment in Vanguard 6,121
Receivables for Accrued Income 52,014
Receivables for Capital Shares Issued 152,687
Other Assets 91,297
Total Other Assets 302,119
Liabilities
Payables for Investment Securities Purchased (300,000)
Payables for Capital Shares Redeemed (129,656)
Payables for Distributions (4,957)
Payables to Vanguard (7,280)
Total Liabilities (441,893)
Net Assets (100%) 96,883,481
At August 31, 2017, net assets consisted of:
Amount
($000)
Paid-in Capital 96,875,505
Undistributed Net Investment Income 45
Accumulated Net Realized Gains 7,931
Net Assets 96,883,481
Investor Shares—Net Assets
Applicable to 84,870,047,409 outstanding $.001 par value shares of
beneficial interest (unlimited authorization) 84,886,286
Net Asset Value Per Share—Investor Shares $1.00
Face Market
Maturity Amount Value•
Yield1 Date ($000) ($000)
20
Prime Money Market Fund
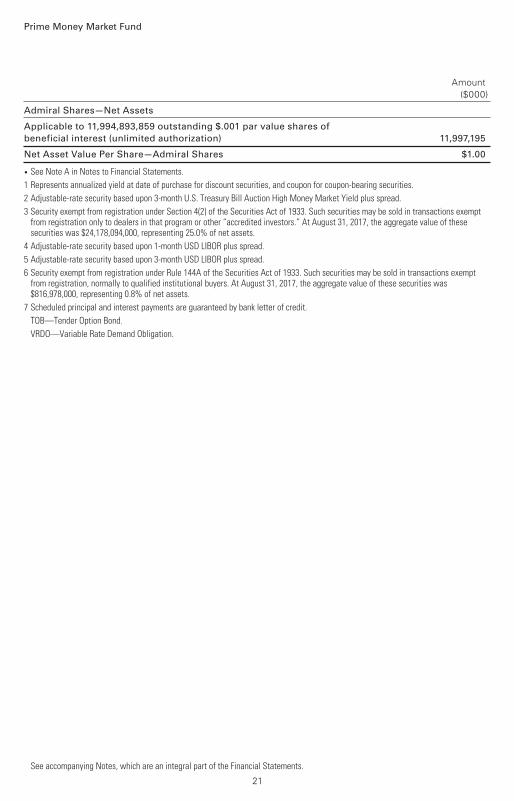
Admiral Shares—Net Assets
Applicable to 11,994,893,859 outstanding $.001 par value shares of
beneficial interest (unlimited authorization) 11,997,195
Net Asset Value Per Share—Admiral Shares $1.00
• See Note A in Notes to Financial Statements.
1 Represents annualized yield at date of purchase for discount securities, and coupon for coupon-bearing securities.
2 Adjustable-rate security based upon 3-month U.S. Treasury Bill Auction High Money Market Yield plus spread.
3 Security exempt from registration under Section 4(2) of the Securities Act of 1933. Such securities may be sold in transactions exempt from registration only to dealers in that program or other “accredited investors.” At August 31, 2017, the aggregate value of these securities was $24,178,094,000, representing 25.0% of net assets.
4 Adjustable-rate security based upon 1-month USD LIBOR plus spread.
5 Adjustable-rate security based upon 3-month USD LIBOR plus spread.
6 Security exempt from registration under Rule 144A of the Securities Act of 1933. Such securities may be sold in transactions exempt from registration, normally to qualified institutional buyers. At August 31, 2017, the aggregate value of these securities was $816,978,000, representing 0.8% of net assets.
7 Scheduled principal and interest payments are guaranteed by bank letter of credit.
TOB—Tender Option Bond.
VRDO—Variable Rate Demand Obligation.
Amount ($000)
See accompanying Notes, which are an integral part of the Financial Statements.
21
Year Ended
August 31, 2017
($000)
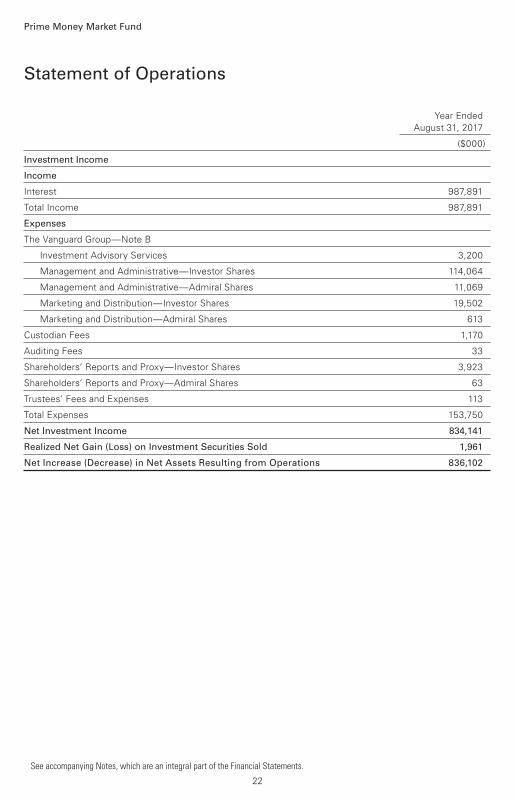
Investment Income
Income
Interest 987,891
Total Income 987,891
Expenses
The Vanguard Group—Note B
Investment Advisory Services 3,200
Management and Administrative—Investor Shares 114,064
Management and Administrative—Admiral Shares 11,069
Marketing and Distribution—Investor Shares 19,502
Marketing and Distribution—Admiral Shares 613
Custodian Fees 1,170
Auditing Fees 33
Shareholders’ Reports and Proxy—Investor Shares 3,923
Shareholders’ Reports and Proxy—Admiral Shares 63
Trustees’ Fees and Expenses 113
Total Expenses 153,750
Net Investment Income 834,141
Realized Net Gain (Loss) on Investment Securities Sold 1,961
Net Increase (Decrease) in Net Assets Resulting from Operations 836,102
Statement of Operations
Prime Money Market Fund
See accompanying Notes, which are an integral part of the Financial Statements.
22
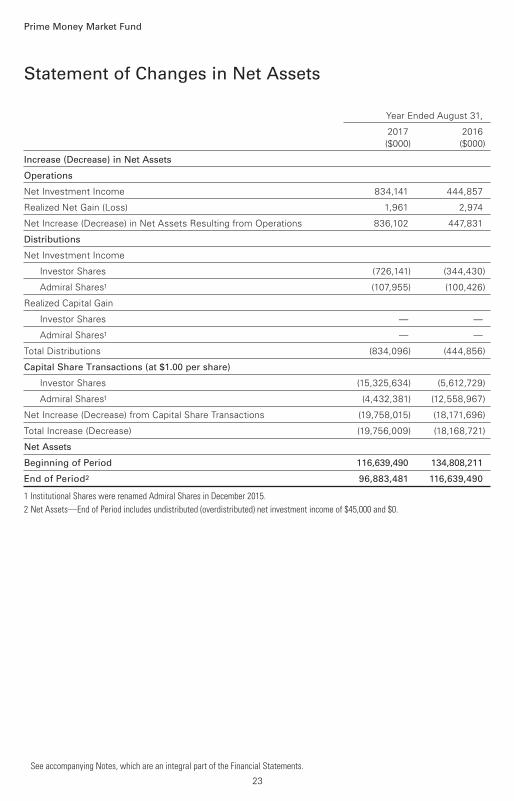
Statement of Changes in Net Assets
Prime Money Market Fund
See accompanying Notes, which are an integral part of the Financial Statements.
Year Ended August 31,
2017 2016
($000) ($000)
Increase (Decrease) in Net Assets
Operations
Net Investment Income 834,141 444,857
Realized Net Gain (Loss) 1,961 2,974
Net Increase (Decrease) in Net Assets Resulting from Operations 836,102 447,831
Distributions
Net Investment Income
Investor Shares (726,141) (344,430)
Admiral Shares1 (107,955) (100,426)
Realized Capital Gain
Investor Shares — —
Admiral Shares1 — —
Total Distributions (834,096) (444,856)
Capital Share Transactions (at $1.00 per share)
Investor Shares (15,325,634) (5,612,729)
Admiral Shares1 (4,432,381) (12,558,967)
Net Increase (Decrease) from Capital Share Transactions (19,758,015) (18,171,696)
Total Increase (Decrease) (19,756,009) (18,168,721)
Net Assets
Beginning of Period 116,639,490 134,808,211
End of Period2 96,883,481 116,639,490
1 Institutional Shares were renamed Admiral Shares in December 2015.
2 Net Assets—End of Period includes undistributed (overdistributed) net investment income of $45,000 and $0.
23
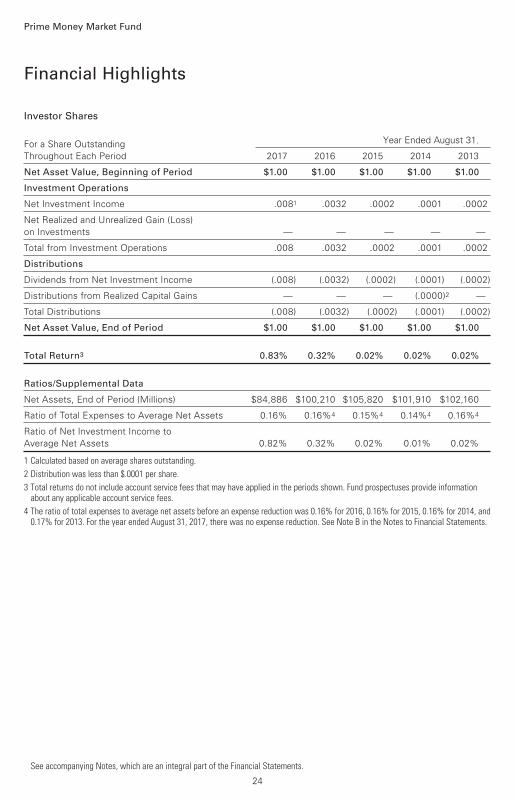
Investor Shares
For a Share Outstanding Year Ended August 31,
Throughout Each Period 2017 2016 2015 2014 2013
Net Asset Value, Beginning of Period $1.00 $1.00 $1.00 $1.00 $1.00
Investment Operations
Net Investment Income .0081 .0032 .0002 .0001 .0002
Net Realized and Unrealized Gain (Loss)
on Investments — — — — —
Total from Investment Operations .008 .0032 .0002 .0001 .0002
Distributions
Dividends from Net Investment Income (.008) (.0032) (.0002) (.0001) (.0002)
Distributions from Realized Capital Gains — — — (.0000)2 —
Total Distributions (.008) (.0032) (.0002) (.0001) (.0002)
Net Asset Value, End of Period $1.00 $1.00 $1.00 $1.00 $1.00
Total Return3 0.83% 0.32% 0.02% 0.02% 0.02%
Ratios/Supplemental Data
Net Assets, End of Period (Millions) $84,886 $100,210 $105,820 $101,910 $102,160
Ratio of Total Expenses to Average Net Assets 0.16% 0.16%4 0.15%4 0.14%4 0.16%4
Ratio of Net Investment Income to
Average Net Assets 0.82% 0.32% 0.02% 0.01% 0.02%
1 Calculated based on average shares outstanding.
2 Distribution was less than $.0001 per share.
3 Total returns do not include account service fees that may have applied in the periods shown. Fund prospectuses provide information about any applicable account service fees.
4 The ratio of total expenses to average net assets before an expense reduction was 0.16% for 2016, 0.16% for 2015, 0.16% for 2014, and 0.17% for 2013. For the year ended August 31, 2017, there was no expense reduction. See Note B in the Notes to Financial Statements.
Financial Highlights
See accompanying Notes, which are an integral part of the Financial Statements.
Prime Money Market Fund
24
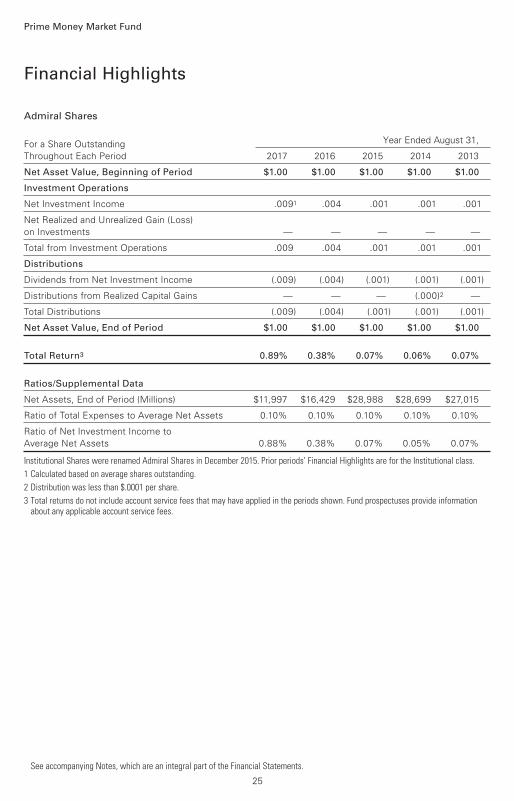
Admiral Shares
For a Share Outstanding Year Ended August 31,
Throughout Each Period 2017 2016 2015 2014 2013
Net Asset Value, Beginning of Period $1.00 $1.00 $1.00 $1.00 $1.00
Investment Operations
Net Investment Income .0091 .004 .001 .001 .001
Net Realized and Unrealized Gain (Loss)
on Investments — — — — —
Total from Investment Operations .009 .004 .001 .001 .001
Distributions
Dividends from Net Investment Income (.009) (.004) (.001) (.001) (.001)
Distributions from Realized Capital Gains — — — (.000)2 —
Total Distributions (.009) (.004) (.001) (.001) (.001)
Net Asset Value, End of Period $1.00 $1.00 $1.00 $1.00 $1.00
Total Return3 0.89% 0.38% 0.07% 0.06% 0.07%
Ratios/Supplemental Data
Net Assets, End of Period (Millions) $11,997 $16,429 $28,988 $28,699 $27,015
Ratio of Total Expenses to Average Net Assets 0.10% 0.10% 0.10% 0.10% 0.10%
Ratio of Net Investment Income to
Average Net Assets 0.88% 0.38% 0.07% 0.05% 0.07%
Institutional Shares were renamed Admiral Shares in December 2015. Prior periods’ Financial Highlights are for the Institutional class.
1 Calculated based on average shares outstanding.
2 Distribution was less than $.0001 per share.
3 Total returns do not include account service fees that may have applied in the periods shown. Fund prospectuses provide information about any applicable account service fees.
Financial Highlights
See accompanying Notes, which are an integral part of the Financial Statements.
Prime Money Market Fund
25
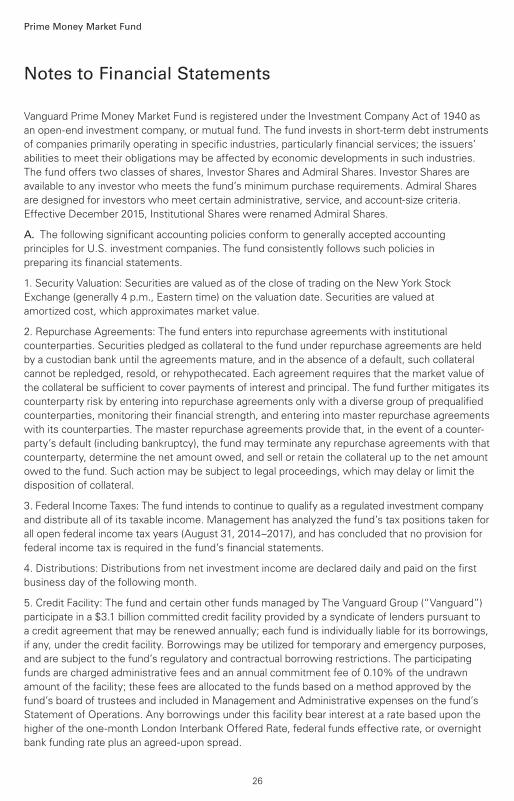
Notes to Financial Statements
Prime Money Market Fund
Vanguard Prime Money Market Fund is registered under the Investment Company Act of 1940 as
an open-end investment company, or mutual fund. The fund invests in short-term debt instruments
of companies primarily operating in specific industries, particularly financial services; the issuers’
abilities to meet their obligations may be affected by economic developments in such industries.
The fund offers two classes of shares, Investor Shares and Admiral Shares. Investor Shares are
available to any investor who meets the fund’s minimum purchase requirements. Admiral Shares
are designed for investors who meet certain administrative, service, and account-size criteria.
Effective December 2015, Institutional Shares were renamed Admiral Shares.
A. The following significant accounting policies conform to generally accepted accounting
principles for U.S. investment companies. The fund consistently follows such policies in
preparing its financial statements.
1. Security Valuation: Securities are valued as of the close of trading on the New York Stock
Exchange (generally 4 p.m., Eastern time) on the valuation date. Securities are valued at
amortized cost, which approximates market value.
2. Repurchase Agreements: The fund enters into repurchase agreements with institutional
counterparties. Securities pledged as collateral to the fund under repurchase agreements are held
by a custodian bank until the agreements mature, and in the absence of a default, such collateral
cannot be repledged, resold, or rehypothecated. Each agreement requires that the market value of
the collateral be sufficient to cover payments of interest and principal. The fund further mitigates its
counterparty risk by entering into repurchase agreements only with a diverse group of prequalified
counterparties, monitoring their financial strength, and entering into master repurchase agreements
with its counterparties. The master repurchase agreements provide that, in the event of a counter-
party’s default (including bankruptcy), the fund may terminate any repurchase agreements with that
counterparty, determine the net amount owed, and sell or retain the collateral up to the net amount
owed to the fund. Such action may be subject to legal proceedings, which may delay or limit the
disposition of collateral.
3. Federal Income Taxes: The fund intends to continue to qualify as a regulated investment company
and distribute all of its taxable income. Management has analyzed the fund’s tax positions taken for
all open federal income tax years (August 31, 2014–2017), and has concluded that no provision for
federal income tax is required in the fund’s financial statements.
4. Distributions: Distributions from net investment income are declared daily and paid on the first
business day of the following month.
5. Credit Facility: The fund and certain other funds managed by The Vanguard Group (“Vanguard”)
participate in a $3.1 billion committed credit facility provided by a syndicate of lenders pursuant to
a credit agreement that may be renewed annually; each fund is individually liable for its borrowings,
if any, under the credit facility. Borrowings may be utilized for temporary and emergency purposes,
and are subject to the fund’s regulatory and contractual borrowing restrictions. The participating
funds are charged administrative fees and an annual commitment fee of 0.10% of the undrawn
amount of the facility; these fees are allocated to the funds based on a method approved by the
fund’s board of trustees and included in Management and Administrative expenses on the fund’s
Statement of Operations. Any borrowings under this facility bear interest at a rate based upon the
higher of the one-month London Interbank Offered Rate, federal funds effective rate, or overnight
bank funding rate plus an agreed-upon spread.
26
Prime Money Market Fund
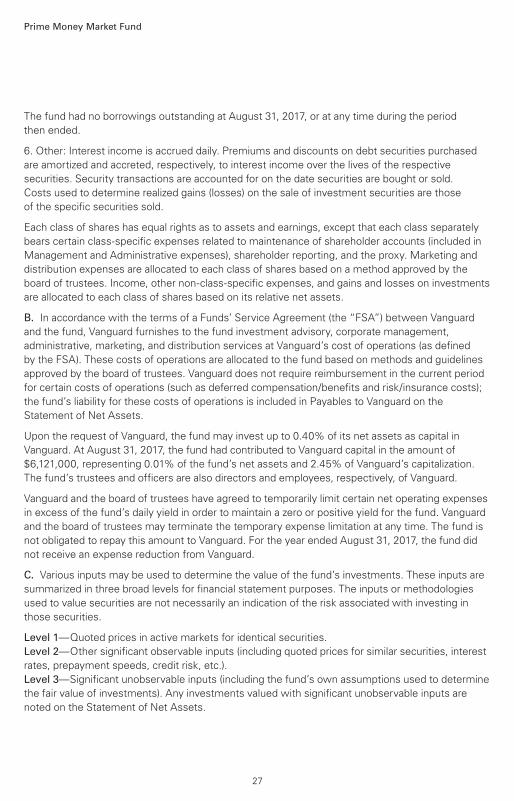
The fund had no borrowings outstanding at August 31, 2017, or at any time during the period
then ended.
6. Other: Interest income is accrued daily. Premiums and discounts on debt securities purchased
are amortized and accreted, respectively, to interest income over the lives of the respective
securities. Security transactions are accounted for on the date securities are bought or sold.
Costs used to determine realized gains (losses) on the sale of investment securities are those
of the specific securities sold.
Each class of shares has equal rights as to assets and earnings, except that each class separately
bears certain class-specific expenses related to maintenance of shareholder accounts (included in
Management and Administrative expenses), shareholder reporting, and the proxy. Marketing and
distribution expenses are allocated to each class of shares based on a method approved by the
board of trustees. Income, other non-class-specific expenses, and gains and losses on investments
are allocated to each class of shares based on its relative net assets.
B. In accordance with the terms of a Funds’ Service Agreement (the “FSA”) between Vanguard
and the fund, Vanguard furnishes to the fund investment advisory, corporate management,
administrative, marketing, and distribution services at Vanguard’s cost of operations (as defined
by the FSA). These costs of operations are allocated to the fund based on methods and guidelines
approved by the board of trustees. Vanguard does not require reimbursement in the current period
for certain costs of operations (such as deferred compensation/benefits and risk/insurance costs);
the fund’s liability for these costs of operations is included in Payables to Vanguard on the
Statement of Net Assets.
Upon the request of Vanguard, the fund may invest up to 0.40% of its net assets as capital in
Vanguard. At August 31, 2017, the fund had contributed to Vanguard capital in the amount of
$6,121,000, representing 0.01% of the fund’s net assets and 2.45% of Vanguard’s capitalization.
The fund’s trustees and officers are also directors and employees, respectively, of Vanguard.
Vanguard and the board of trustees have agreed to temporarily limit certain net operating expenses
in excess of the fund’s daily yield in order to maintain a zero or positive yield for the fund. Vanguard
and the board of trustees may terminate the temporary expense limitation at any time. The fund is
not obligated to repay this amount to Vanguard. For the year ended August 31, 2017, the fund did
not receive an expense reduction from Vanguard.
C. Various inputs may be used to determine the value of the fund’s investments. These inputs are
summarized in three broad levels for financial statement purposes. The inputs or methodologies
used to value securities are not necessarily an indication of the risk associated with investing in
those securities.
Level 1—Quoted prices in active markets for identical securities.
Level 2—Other significant observable inputs (including quoted prices for similar securities, interest
rates, prepayment speeds, credit risk, etc.).
Level 3—Significant unobservable inputs (including the fund’s own assumptions used to determine
the fair value of investments). Any investments valued with significant unobservable inputs are
noted on the Statement of Net Assets.
27

Prime Money Market Fund
At August 31, 2017, 100% of the market value of the fund’s investments was determined using amortized cost, in accordance with rules under the Investment Company Act of 1940. Amortized cost approximates the current fair value of a security, but since the value is not obtained from a quoted price in an active market, securities valued at amortized cost are considered to be valued using Level 2 inputs.
D. Capital share transactions for each class of shares were:
Year Ended August 31,
2017 2016
Amount Shares Amount Shares ($000) (000) ($000) (000)
Investor Shares
Issued 64,128,512 64,127,620 101,526,451 101,527,243
Issued in Lieu of Cash Distributions 680,319 680,319 335,584 335,584
Redeemed (80,134,465) (80,134,468) (107,474,764) (107,474,762)
Net Increase (Decrease)—Investor Shares (15,325,634) (15,326,529) (5,612,729) (5,611,935)
Admiral Shares1
Issued 8,144,434 8,145,324 17,763,247 17,762,458
Issued in Lieu of Cash Distributions 102,733 102,733 96,589 96,589
Redeemed (12,679,548) (12,679,548) (30,418,803) (30,418,803)
Net Increase (Decrease)—Admiral Shares (4,432,381) (4,431,491) (12,558,967) (12,559,756)
1 Institutional Shares were renamed Admiral Shares in December 2015.
E. Management has determined that no material events or transactions occurred subsequent to August 31, 2017, that would require recognition or disclosure in these financial statements.
28
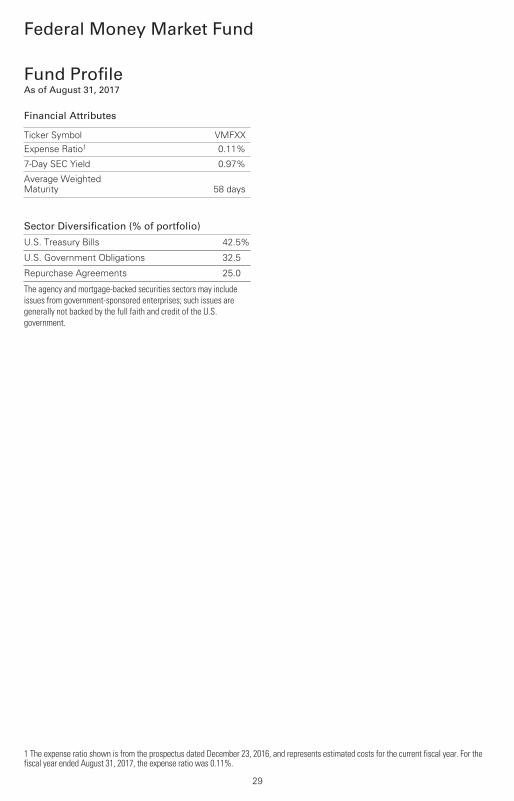
Federal Money Market Fund
Fund ProfileAs of August 31, 2017
1 The expense ratio shown is from the prospectus dated December 23, 2016, and represents estimated costs for the current fiscal year. For the fiscal year ended August 31, 2017, the expense ratio was 0.11%.
29
Financial Attributes
Ticker Symbol VMFXXExpense Ratio1 0.11%
7-Day SEC Yield 0.97%
Average WeightedMaturity 58 days
Sector Diversification (% of portfolio)
U.S. Treasury Bills 42.5%
U.S. Government Obligations 32.5
Repurchase Agreements 25.0
The agency and mortgage-backed securities sectors may include issues from government-sponsored enterprises; such issues are generally not backed by the full faith and credit of the U.S. government.
Performance Summary
Federal Money Market Fund
See Financial Highlights for dividend information.
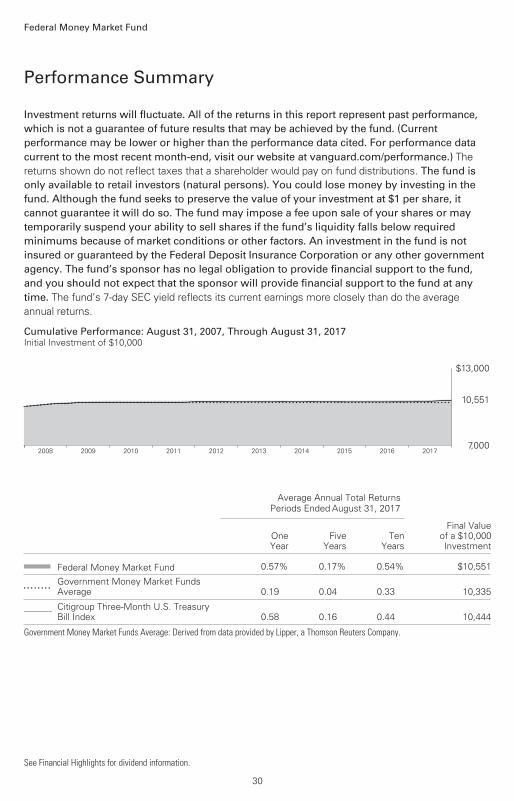
Investment returns will fluctuate. All of the returns in this report represent past performance, which is not a guarantee of future results that may be achieved by the fund. (Current performance may be lower or higher than the performance data cited. For performance data current to the most recent month-end, visit our website at vanguard.com/performance.) The returns shown do not reflect taxes that a shareholder would pay on fund distributions. The fund is only available to retail investors (natural persons). You could lose money by investing in the fund. Although the fund seeks to preserve the value of your investment at $1 per share, it cannot guarantee it will do so. The fund may impose a fee upon sale of your shares or may temporarily suspend your ability to sell shares if the fund’s liquidity falls below required minimums because of market conditions or other factors. An investment in the fund is not insured or guaranteed by the Federal Deposit Insurance Corporation or any other government agency. The fund’s sponsor has no legal obligation to provide financial support to the fund, and you should not expect that the sponsor will provide financial support to the fund at any time. The fund’s 7-day SEC yield reflects its current earnings more closely than do the average annual returns.
30
Cumulative Performance: August 31, 2007, Through August 31, 2017Initial Investment of $10,000
2017201620152014201320122011201020092008
$13,000
7,000
10,551
Average Annual Total ReturnsPeriods Ended August 31, 2017
OneYear
FiveYears
TenYears
Final Valueof a $10,000Investment
Federal Money Market Fund 0.57% 0.17% 0.54% $10,551
• • • • • • • •Government Money Market FundsAverage 0.19 0.04 0.33 10,335
________ Citigroup Three-Month U.S. TreasuryBill Index 0.58 0.16 0.44 10,444
Government Money Market Funds Average: Derived from data provided by Lipper, a Thomson Reuters Company.
Federal Money Market Fund
31
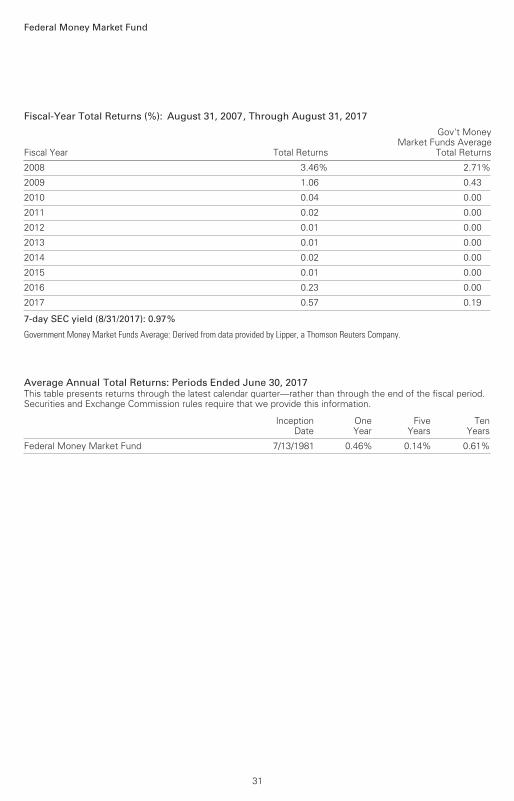
Fiscal-Year Total Returns (%): August 31, 2007, Through August 31, 2017
Fiscal Year Total Returns
Gov't MoneyMarket Funds Average
Total Returns
2008 3.46% 2.71%
2009 1.06 0.43
2010 0.04 0.00
2011 0.02 0.00
2012 0.01 0.00
2013 0.01 0.00
2014 0.02 0.00
2015 0.01 0.00
2016 0.23 0.00
2017 0.57 0.19
7-day SEC yield (8/31/2017): 0.97%
Government Money Market Funds Average: Derived from data provided by Lipper, a Thomson Reuters Company.
Average Annual Total Returns: Periods Ended June 30, 2017This table presents returns through the latest calendar quarter—rather than through the end of the fiscal period.Securities and Exchange Commission rules require that we provide this information.
InceptionDate
OneYear
FiveYears
TenYears
Federal Money Market Fund 7/13/1981 0.46% 0.14% 0.61%
Financial Statements
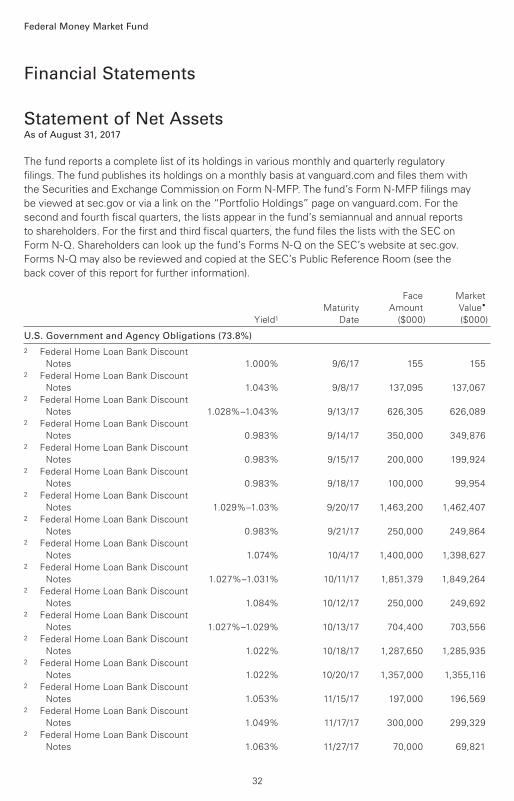
Statement of Net AssetsAs of August 31, 2017
Federal Money Market Fund
U.S. Government and Agency Obligations (73.8%)
2 Federal Home Loan Bank Discount
Notes 1.000% 9/6/17 155 1552 Federal Home Loan Bank Discount
Notes 1.043% 9/8/17 137,095 137,0672 Federal Home Loan Bank Discount
Notes 1.028%–1.043% 9/13/17 626,305 626,0892 Federal Home Loan Bank Discount
Notes 0.983% 9/14/17 350,000 349,8762 Federal Home Loan Bank Discount
Notes 0.983% 9/15/17 200,000 199,9242 Federal Home Loan Bank Discount
Notes 0.983% 9/18/17 100,000 99,9542 Federal Home Loan Bank Discount
Notes 1.029%–1.03% 9/20/17 1,463,200 1,462,4072 Federal Home Loan Bank Discount
Notes 0.983% 9/21/17 250,000 249,8642 Federal Home Loan Bank Discount
Notes 1.074% 10/4/17 1,400,000 1,398,6272 Federal Home Loan Bank Discount
Notes 1.027%–1.031% 10/11/17 1,851,379 1,849,2642 Federal Home Loan Bank Discount
Notes 1.084% 10/12/17 250,000 249,6922 Federal Home Loan Bank Discount
Notes 1.027%–1.029% 10/13/17 704,400 703,5562 Federal Home Loan Bank Discount
Notes 1.022% 10/18/17 1,287,650 1,285,9352 Federal Home Loan Bank Discount
Notes 1.022% 10/20/17 1,357,000 1,355,1162 Federal Home Loan Bank Discount
Notes 1.053% 11/15/17 197,000 196,5692 Federal Home Loan Bank Discount
Notes 1.049% 11/17/17 300,000 299,3292 Federal Home Loan Bank Discount
Notes 1.063% 11/27/17 70,000 69,821
Face Market
Maturity Amount Value•
Yield1 Date ($000) ($000)
The fund reports a complete list of its holdings in various monthly and quarterly regulatory
filings. The fund publishes its holdings on a monthly basis at vanguard.com and files them with
the Securities and Exchange Commission on Form N-MFP. The fund’s Form N-MFP filings may
be viewed at sec.gov or via a link on the “Portfolio Holdings” page on vanguard.com. For the
second and fourth fiscal quarters, the lists appear in the fund’s semiannual and annual reports
to shareholders. For the first and third fiscal quarters, the fund files the lists with the SEC on
Form N-Q. Shareholders can look up the fund’s Forms N-Q on the SEC’s website at sec.gov.
Forms N-Q may also be reviewed and copied at the SEC’s Public Reference Room (see the
back cover of this report for further information).
32
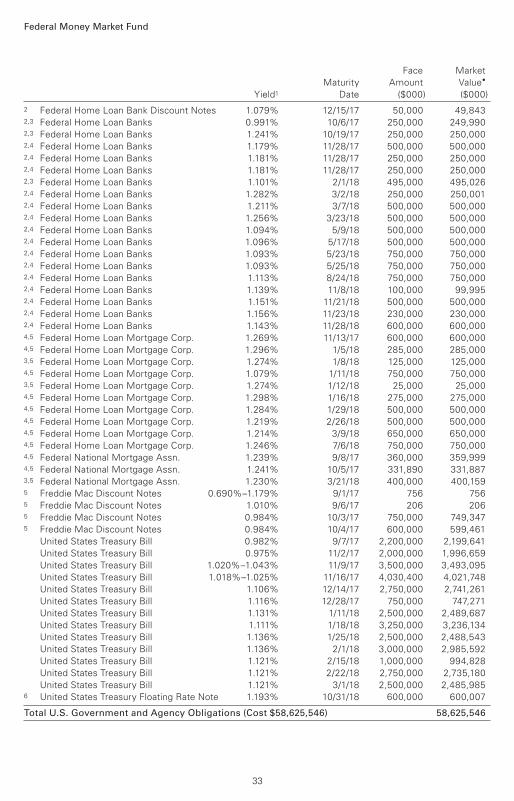
Federal Money Market Fund
2 Federal Home Loan Bank Discount Notes 1.079% 12/15/17 50,000 49,8432,3 Federal Home Loan Banks 0.991% 10/6/17 250,000 249,9902,3 Federal Home Loan Banks 1.241% 10/19/17 250,000 250,0002,4 Federal Home Loan Banks 1.179% 11/28/17 500,000 500,0002,4 Federal Home Loan Banks 1.181% 11/28/17 250,000 250,0002,4 Federal Home Loan Banks 1.181% 11/28/17 250,000 250,0002,3 Federal Home Loan Banks 1.101% 2/1/18 495,000 495,0262,4 Federal Home Loan Banks 1.282% 3/2/18 250,000 250,0012,4 Federal Home Loan Banks 1.211% 3/7/18 500,000 500,0002,4 Federal Home Loan Banks 1.256% 3/23/18 500,000 500,0002,4 Federal Home Loan Banks 1.094% 5/9/18 500,000 500,0002,4 Federal Home Loan Banks 1.096% 5/17/18 500,000 500,0002,4 Federal Home Loan Banks 1.093% 5/23/18 750,000 750,0002,4 Federal Home Loan Banks 1.093% 5/25/18 750,000 750,0002,4 Federal Home Loan Banks 1.113% 8/24/18 750,000 750,0002,4 Federal Home Loan Banks 1.139% 11/8/18 100,000 99,9952,4 Federal Home Loan Banks 1.151% 11/21/18 500,000 500,0002,4 Federal Home Loan Banks 1.156% 11/23/18 230,000 230,0002,4 Federal Home Loan Banks 1.143% 11/28/18 600,000 600,0004,5 Federal Home Loan Mortgage Corp. 1.269% 11/13/17 600,000 600,0004,5 Federal Home Loan Mortgage Corp. 1.296% 1/5/18 285,000 285,0003,5 Federal Home Loan Mortgage Corp. 1.274% 1/8/18 125,000 125,0004,5 Federal Home Loan Mortgage Corp. 1.079% 1/11/18 750,000 750,0003,5 Federal Home Loan Mortgage Corp. 1.274% 1/12/18 25,000 25,0004,5 Federal Home Loan Mortgage Corp. 1.298% 1/16/18 275,000 275,0004,5 Federal Home Loan Mortgage Corp. 1.284% 1/29/18 500,000 500,0004,5 Federal Home Loan Mortgage Corp. 1.219% 2/26/18 500,000 500,0004,5 Federal Home Loan Mortgage Corp. 1.214% 3/9/18 650,000 650,0004,5 Federal Home Loan Mortgage Corp. 1.246% 7/6/18 750,000 750,0004,5 Federal National Mortgage Assn. 1.239% 9/8/17 360,000 359,9994,5 Federal National Mortgage Assn. 1.241% 10/5/17 331,890 331,8873,5 Federal National Mortgage Assn. 1.230% 3/21/18 400,000 400,1595 Freddie Mac Discount Notes 0.690%–1.179% 9/1/17 756 7565 Freddie Mac Discount Notes 1.010% 9/6/17 206 2065 Freddie Mac Discount Notes 0.984% 10/3/17 750,000 749,3475 Freddie Mac Discount Notes 0.984% 10/4/17 600,000 599,461
United States Treasury Bill 0.982% 9/7/17 2,200,000 2,199,641
United States Treasury Bill 0.975% 11/2/17 2,000,000 1,996,659
United States Treasury Bill 1.020%–1.043% 11/9/17 3,500,000 3,493,095
United States Treasury Bill 1.018%–1.025% 11/16/17 4,030,400 4,021,748
United States Treasury Bill 1.106% 12/14/17 2,750,000 2,741,261
United States Treasury Bill 1.116% 12/28/17 750,000 747,271
United States Treasury Bill 1.131% 1/11/18 2,500,000 2,489,687
United States Treasury Bill 1.111% 1/18/18 3,250,000 3,236,134
United States Treasury Bill 1.136% 1/25/18 2,500,000 2,488,543
United States Treasury Bill 1.136% 2/1/18 3,000,000 2,985,592
United States Treasury Bill 1.121% 2/15/18 1,000,000 994,828
United States Treasury Bill 1.121% 2/22/18 2,750,000 2,735,180
United States Treasury Bill 1.121% 3/1/18 2,500,000 2,485,9856 United States Treasury Floating Rate Note 1.193% 10/31/18 600,000 600,007
Total U.S. Government and Agency Obligations (Cost $58,625,546) 58,625,546
Face Market
Maturity Amount Value•
Yield1 Date ($000) ($000)
33
Federal Money Market Fund
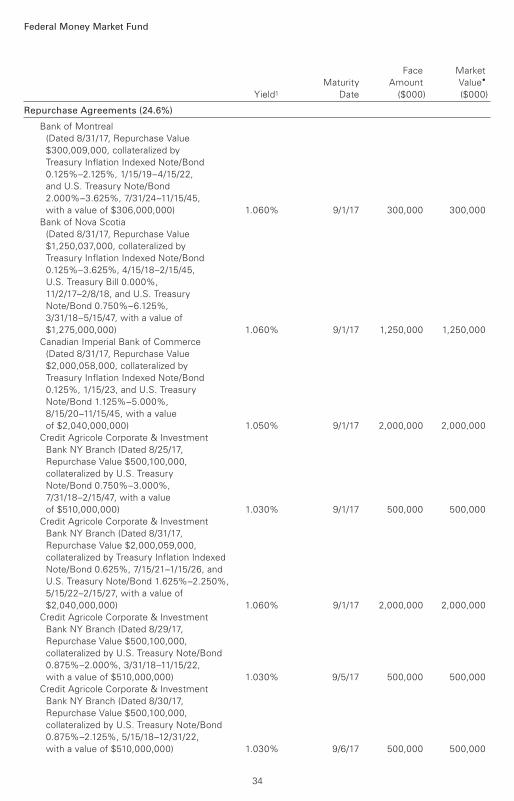
Repurchase Agreements (24.6%)
Bank of Montreal
(Dated 8/31/17, Repurchase Value
$300,009,000, collateralized by
Treasury Inflation Indexed Note/Bond
0.125%–2.125%, 1/15/19–4/15/22,
and U.S. Treasury Note/Bond
2.000%–3.625%, 7/31/24–11/15/45,
with a value of $306,000,000) 1.060% 9/1/17 300,000 300,000
Bank of Nova Scotia
(Dated 8/31/17, Repurchase Value
$1,250,037,000, collateralized by
Treasury Inflation Indexed Note/Bond
0.125%–3.625%, 4/15/18–2/15/45,
U.S. Treasury Bill 0.000%,
11/2/17–2/8/18, and U.S. Treasury
Note/Bond 0.750%–6.125%,
3/31/18–5/15/47, with a value of
$1,275,000,000) 1.060% 9/1/17 1,250,000 1,250,000
Canadian Imperial Bank of Commerce
(Dated 8/31/17, Repurchase Value
$2,000,058,000, collateralized by
Treasury Inflation Indexed Note/Bond
0.125%, 1/15/23, and U.S. Treasury
Note/Bond 1.125%–5.000%,
8/15/20–11/15/45, with a value
of $2,040,000,000) 1.050% 9/1/17 2,000,000 2,000,000
Credit Agricole Corporate & Investment
Bank NY Branch (Dated 8/25/17,
Repurchase Value $500,100,000,
collateralized by U.S. Treasury
Note/Bond 0.750%–3.000%,
7/31/18–2/15/47, with a value
of $510,000,000) 1.030% 9/1/17 500,000 500,000
Credit Agricole Corporate & Investment
Bank NY Branch (Dated 8/31/17,
Repurchase Value $2,000,059,000,
collateralized by Treasury Inflation Indexed
Note/Bond 0.625%, 7/15/21–1/15/26, and
U.S. Treasury Note/Bond 1.625%–2.250%,
5/15/22–2/15/27, with a value of
$2,040,000,000) 1.060% 9/1/17 2,000,000 2,000,000
Credit Agricole Corporate & Investment
Bank NY Branch (Dated 8/29/17,
Repurchase Value $500,100,000,
collateralized by U.S. Treasury Note/Bond
0.875%–2.000%, 3/31/18–11/15/22,
with a value of $510,000,000) 1.030% 9/5/17 500,000 500,000
Credit Agricole Corporate & Investment
Bank NY Branch (Dated 8/30/17,
Repurchase Value $500,100,000,
collateralized by U.S. Treasury Note/Bond
0.875%–2.125%, 5/15/18–12/31/22,
with a value of $510,000,000) 1.030% 9/6/17 500,000 500,000
Face Market
Maturity Amount Value•
Yield1 Date ($000) ($000)
34
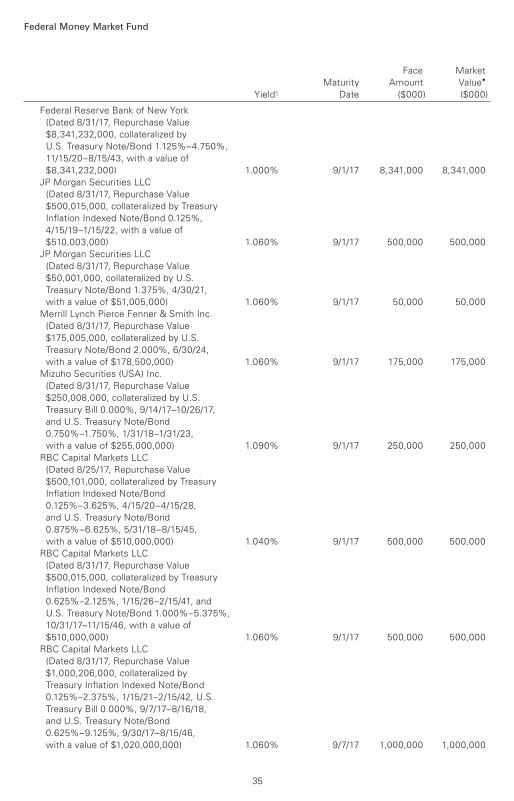
Federal Money Market Fund
Federal Reserve Bank of New York
(Dated 8/31/17, Repurchase Value
$8,341,232,000, collateralized by
U.S. Treasury Note/Bond 1.125%–4.750%,
11/15/20–8/15/43, with a value of
$8,341,232,000) 1.000% 9/1/17 8,341,000 8,341,000
JP Morgan Securities LLC
(Dated 8/31/17, Repurchase Value
$500,015,000, collateralized by Treasury
Inflation Indexed Note/Bond 0.125%,
4/15/19–1/15/22, with a value of
$510,003,000) 1.060% 9/1/17 500,000 500,000
JP Morgan Securities LLC
(Dated 8/31/17, Repurchase Value
$50,001,000, collateralized by U.S.
Treasury Note/Bond 1.375%, 4/30/21,
with a value of $51,005,000) 1.060% 9/1/17 50,000 50,000
Merrill Lynch Pierce Fenner & Smith Inc.
(Dated 8/31/17, Repurchase Value
$175,005,000, collateralized by U.S.
Treasury Note/Bond 2.000%, 6/30/24,
with a value of $178,500,000) 1.060% 9/1/17 175,000 175,000
Mizuho Securities (USA) Inc.
(Dated 8/31/17, Repurchase Value
$250,008,000, collateralized by U.S.
Treasury Bill 0.000%, 9/14/17–10/26/17,
and U.S. Treasury Note/Bond
0.750%–1.750%, 1/31/18–1/31/23,
with a value of $255,000,000) 1.090% 9/1/17 250,000 250,000
RBC Capital Markets LLC
(Dated 8/25/17, Repurchase Value
$500,101,000, collateralized by Treasury
Inflation Indexed Note/Bond
0.125%–3.625%, 4/15/20–4/15/28,
and U.S. Treasury Note/Bond
0.875%–6.625%, 5/31/18–8/15/45,
with a value of $510,000,000) 1.040% 9/1/17 500,000 500,000
RBC Capital Markets LLC
(Dated 8/31/17, Repurchase Value
$500,015,000, collateralized by Treasury
Inflation Indexed Note/Bond
0.625%–2.125%, 1/15/26–2/15/41, and
U.S. Treasury Note/Bond 1.000%–5.375%,
10/31/17–11/15/46, with a value of
$510,000,000) 1.060% 9/1/17 500,000 500,000
RBC Capital Markets LLC
(Dated 8/31/17, Repurchase Value
$1,000,206,000, collateralized by
Treasury Inflation Indexed Note/Bond
0.125%–2.375%, 1/15/21–2/15/42, U.S.
Treasury Bill 0.000%, 9/7/17–8/16/18,
and U.S. Treasury Note/Bond
0.625%–9.125%, 9/30/17–8/15/46,
with a value of $1,020,000,000) 1.060% 9/7/17 1,000,000 1,000,000
Face Market
Maturity Amount Value•
Yield1 Date ($000) ($000)
35
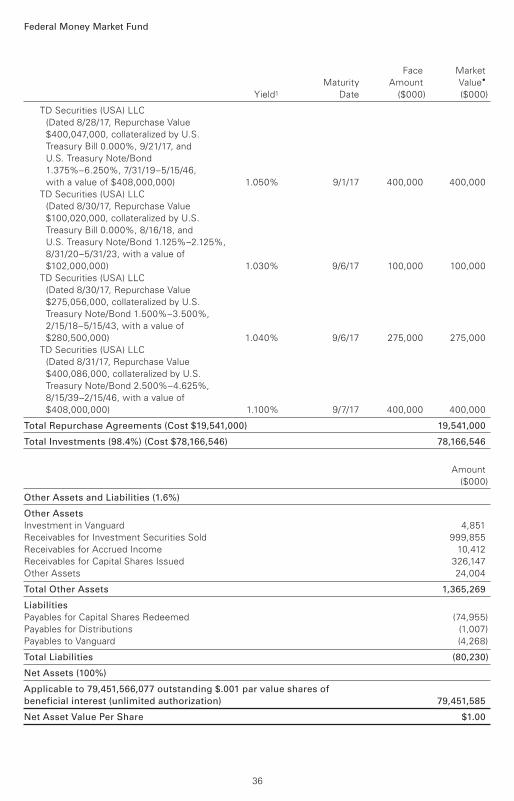
Federal Money Market Fund
TD Securities (USA) LLC
(Dated 8/28/17, Repurchase Value
$400,047,000, collateralized by U.S.
Treasury Bill 0.000%, 9/21/17, and
U.S. Treasury Note/Bond
1.375%–6.250%, 7/31/19–5/15/46,
with a value of $408,000,000) 1.050% 9/1/17 400,000 400,000
TD Securities (USA) LLC
(Dated 8/30/17, Repurchase Value
$100,020,000, collateralized by U.S.
Treasury Bill 0.000%, 8/16/18, and
U.S. Treasury Note/Bond 1.125%–2.125%,
8/31/20–5/31/23, with a value of
$102,000,000) 1.030% 9/6/17 100,000 100,000
TD Securities (USA) LLC
(Dated 8/30/17, Repurchase Value
$275,056,000, collateralized by U.S.
Treasury Note/Bond 1.500%–3.500%,
2/15/18–5/15/43, with a value of
$280,500,000) 1.040% 9/6/17 275,000 275,000
TD Securities (USA) LLC
(Dated 8/31/17, Repurchase Value
$400,086,000, collateralized by U.S.
Treasury Note/Bond 2.500%–4.625%,
8/15/39–2/15/46, with a value of
$408,000,000) 1.100% 9/7/17 400,000 400,000
Total Repurchase Agreements (Cost $19,541,000) 19,541,000
Total Investments (98.4%) (Cost $78,166,546) 78,166,546
Amount
($000)
Other Assets and Liabilities (1.6%)
Other Assets
Investment in Vanguard 4,851
Receivables for Investment Securities Sold 999,855
Receivables for Accrued Income 10,412
Receivables for Capital Shares Issued 326,147
Other Assets 24,004
Total Other Assets 1,365,269
Liabilities
Payables for Capital Shares Redeemed (74,955)
Payables for Distributions (1,007)
Payables to Vanguard (4,268)
Total Liabilities (80,230)
Net Assets (100%)
Applicable to 79,451,566,077 outstanding $.001 par value shares of
beneficial interest (unlimited authorization) 79,451,585
Net Asset Value Per Share $1.00
Face Market
Maturity Amount Value•
Yield1 Date ($000) ($000)
36
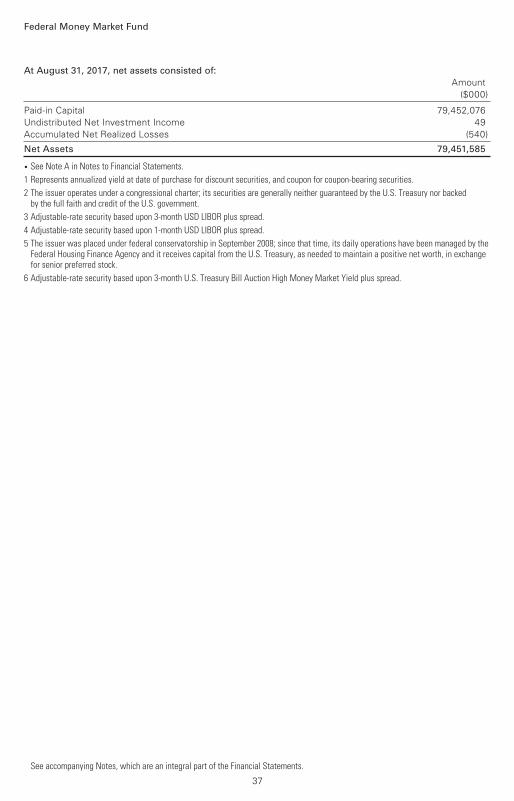
Federal Money Market Fund
Paid-in Capital 79,452,076Undistributed Net Investment Income 49Accumulated Net Realized Losses (540)
Net Assets 79,451,585
• See Note A in Notes to Financial Statements.
1 Represents annualized yield at date of purchase for discount securities, and coupon for coupon-bearing securities.
2 The issuer operates under a congressional charter; its securities are generally neither guaranteed by the U.S. Treasury nor backed by the full faith and credit of the U.S. government.
3 Adjustable-rate security based upon 3-month USD LIBOR plus spread.
4 Adjustable-rate security based upon 1-month USD LIBOR plus spread.
5 The issuer was placed under federal conservatorship in September 2008; since that time, its daily operations have been managed by the Federal Housing Finance Agency and it receives capital from the U.S. Treasury, as needed to maintain a positive net worth, in exchange for senior preferred stock.
6 Adjustable-rate security based upon 3-month U.S. Treasury Bill Auction High Money Market Yield plus spread.
At August 31, 2017, net assets consisted of:
Amount ($000)
See accompanying Notes, which are an integral part of the Financial Statements.
37
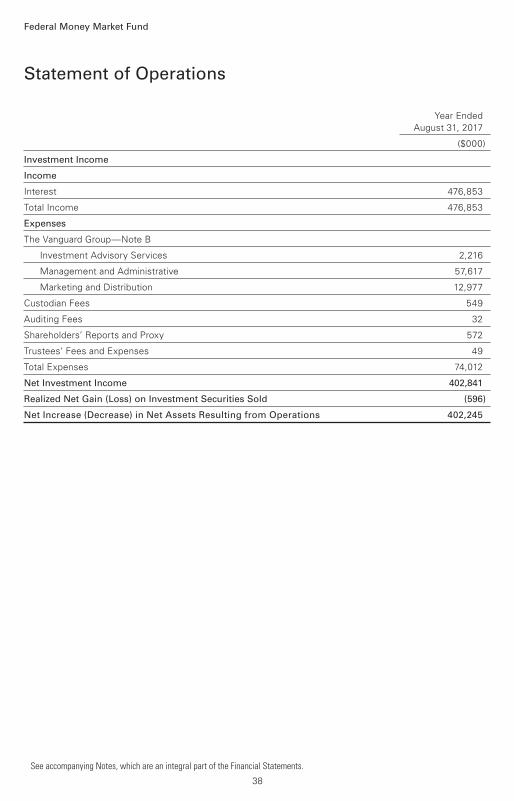
Year Ended
August 31, 2017
($000)
Investment Income
Income
Interest 476,853
Total Income 476,853
Expenses
The Vanguard Group—Note B
Investment Advisory Services 2,216
Management and Administrative 57,617
Marketing and Distribution 12,977
Custodian Fees 549
Auditing Fees 32
Shareholders’ Reports and Proxy 572
Trustees’ Fees and Expenses 49
Total Expenses 74,012
Net Investment Income 402,841
Realized Net Gain (Loss) on Investment Securities Sold (596)
Net Increase (Decrease) in Net Assets Resulting from Operations 402,245
Statement of Operations
Federal Money Market Fund
See accompanying Notes, which are an integral part of the Financial Statements.
38
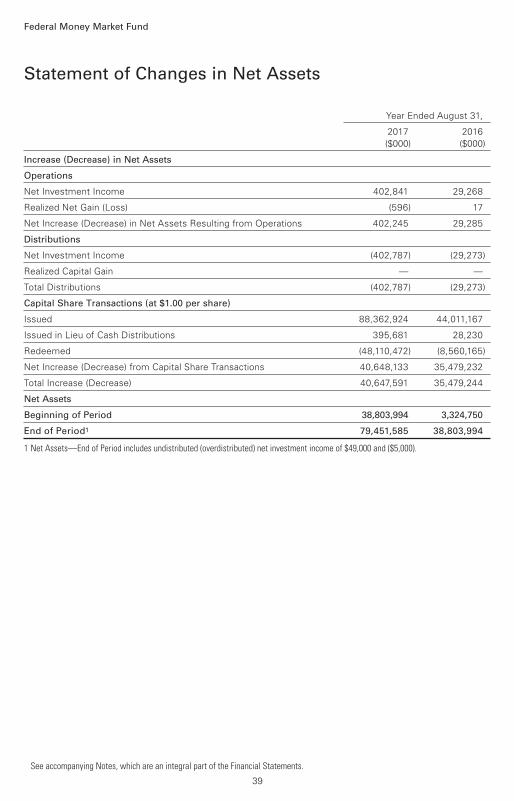
Statement of Changes in Net Assets
Federal Money Market Fund
See accompanying Notes, which are an integral part of the Financial Statements.
Year Ended August 31,
2017 2016
($000) ($000)
Increase (Decrease) in Net Assets
Operations
Net Investment Income 402,841 29,268
Realized Net Gain (Loss) (596) 17
Net Increase (Decrease) in Net Assets Resulting from Operations 402,245 29,285
Distributions
Net Investment Income (402,787) (29,273)
Realized Capital Gain — —
Total Distributions (402,787) (29,273)
Capital Share Transactions (at $1.00 per share)
Issued 88,362,924 44,011,167
Issued in Lieu of Cash Distributions 395,681 28,230
Redeemed (48,110,472) (8,560,165)
Net Increase (Decrease) from Capital Share Transactions 40,648,133 35,479,232
Total Increase (Decrease) 40,647,591 35,479,244
Net Assets
Beginning of Period 38,803,994 3,324,750
End of Period1 79,451,585 38,803,994
1 Net Assets—End of Period includes undistributed (overdistributed) net investment income of $49,000 and ($5,000).
39
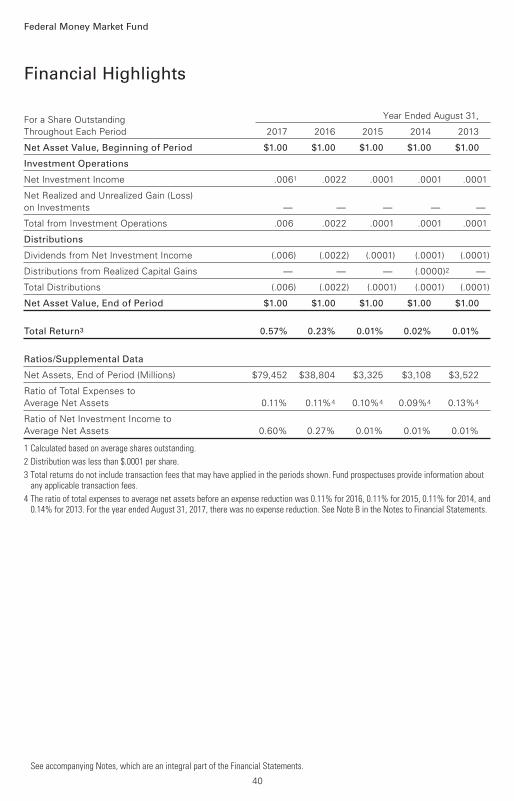
For a Share Outstanding Year Ended August 31,
Throughout Each Period 2017 2016 2015 2014 2013
Net Asset Value, Beginning of Period $1.00 $1.00 $1.00 $1.00 $1.00
Investment Operations
Net Investment Income .0061 .0022 .0001 .0001 .0001
Net Realized and Unrealized Gain (Loss)
on Investments — — — — —
Total from Investment Operations .006 .0022 .0001 .0001 .0001
Distributions
Dividends from Net Investment Income (.006) (.0022) (.0001) (.0001) (.0001)
Distributions from Realized Capital Gains — — — (.0000)2 —
Total Distributions (.006) (.0022) (.0001) (.0001) (.0001)
Net Asset Value, End of Period $1.00 $1.00 $1.00 $1.00 $1.00
Total Return3 0.57% 0.23% 0.01% 0.02% 0.01%
Ratios/Supplemental Data
Net Assets, End of Period (Millions) $79,452 $38,804 $3,325 $3,108 $3,522
Ratio of Total Expenses to
Average Net Assets 0.11% 0.11%4 0.10%4 0.09%4 0.13%4
Ratio of Net Investment Income to
Average Net Assets 0.60% 0.27% 0.01% 0.01% 0.01%
1 Calculated based on average shares outstanding.
2 Distribution was less than $.0001 per share.
3 Total returns do not include transaction fees that may have applied in the periods shown. Fund prospectuses provide information about any applicable transaction fees.
4 The ratio of total expenses to average net assets before an expense reduction was 0.11% for 2016, 0.11% for 2015, 0.11% for 2014, and 0.14% for 2013. For the year ended August 31, 2017, there was no expense reduction. See Note B in the Notes to Financial Statements.
Financial Highlights
See accompanying Notes, which are an integral part of the Financial Statements.
Federal Money Market Fund
40
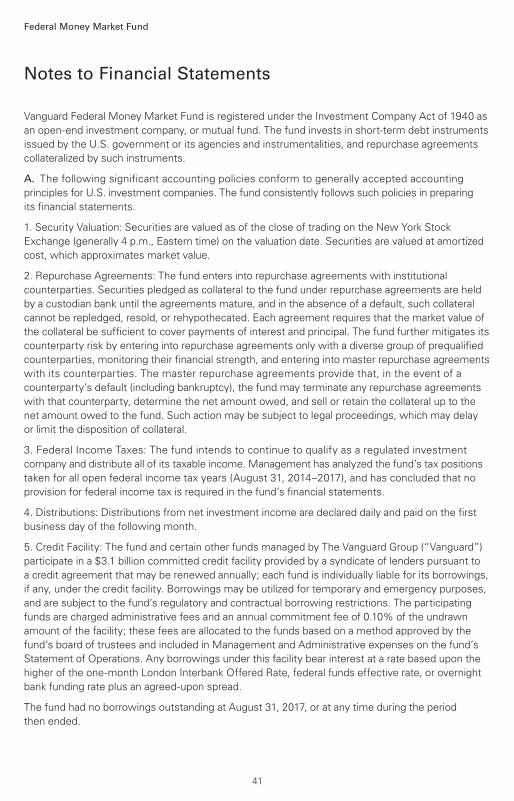
Notes to Financial Statements
Federal Money Market Fund
Vanguard Federal Money Market Fund is registered under the Investment Company Act of 1940 as
an open-end investment company, or mutual fund. The fund invests in short-term debt instruments
issued by the U.S. government or its agencies and instrumentalities, and repurchase agreements
collateralized by such instruments.
A. The following significant accounting policies conform to generally accepted accounting
principles for U.S. investment companies. The fund consistently follows such policies in preparing
its financial statements.
1. Security Valuation: Securities are valued as of the close of trading on the New York Stock
Exchange (generally 4 p.m., Eastern time) on the valuation date. Securities are valued at amortized
cost, which approximates market value.
2. Repurchase Agreements: The fund enters into repurchase agreements with institutional
counterparties. Securities pledged as collateral to the fund under repurchase agreements are held
by a custodian bank until the agreements mature, and in the absence of a default, such collateral
cannot be repledged, resold, or rehypothecated. Each agreement requires that the market value of
the collateral be sufficient to cover payments of interest and principal. The fund further mitigates its
counterparty risk by entering into repurchase agreements only with a diverse group of prequalified
counterparties, monitoring their financial strength, and entering into master repurchase agreements
with its counterparties. The master repurchase agreements provide that, in the event of a
counterparty’s default (including bankruptcy), the fund may terminate any repurchase agreements
with that counterparty, determine the net amount owed, and sell or retain the collateral up to the
net amount owed to the fund. Such action may be subject to legal proceedings, which may delay
or limit the disposition of collateral.
3. Federal Income Taxes: The fund intends to continue to qualify as a regulated investment
company and distribute all of its taxable income. Management has analyzed the fund’s tax positions
taken for all open federal income tax years (August 31, 2014–2017), and has concluded that no
provision for federal income tax is required in the fund’s financial statements.
4. Distributions: Distributions from net investment income are declared daily and paid on the first
business day of the following month.
5. Credit Facility: The fund and certain other funds managed by The Vanguard Group (“Vanguard”)
participate in a $3.1 billion committed credit facility provided by a syndicate of lenders pursuant to
a credit agreement that may be renewed annually; each fund is individually liable for its borrowings,
if any, under the credit facility. Borrowings may be utilized for temporary and emergency purposes,
and are subject to the fund’s regulatory and contractual borrowing restrictions. The participating
funds are charged administrative fees and an annual commitment fee of 0.10% of the undrawn
amount of the facility; these fees are allocated to the funds based on a method approved by the
fund’s board of trustees and included in Management and Administrative expenses on the fund’s
Statement of Operations. Any borrowings under this facility bear interest at a rate based upon the
higher of the one-month London Interbank Offered Rate, federal funds effective rate, or overnight
bank funding rate plus an agreed-upon spread.
The fund had no borrowings outstanding at August 31, 2017, or at any time during the period
then ended.
41
Federal Money Market Fund
6. Other: Interest income is accrued daily. Premiums and discounts on debt securities purchased
are amortized and accreted, respectively, to interest income over the lives of the respective
securities. Security transactions are accounted for on the date securities are bought or sold. Costs
used to determine realized gains (losses) on the sale of investment securities are those of the
specific securities sold.
B. In accordance with the terms of a Funds’ Service Agreement (the “FSA”) between Vanguard
and the fund, Vanguard furnishes to the fund investment advisory, corporate management,
administrative, marketing, and distribution services at Vanguard’s cost of operations (as defined
by the FSA). These costs of operations are allocated to the fund based on methods and guidelines
approved by the board of trustees. Vanguard does not require reimbursement in the current period
for certain costs of operations (such as deferred compensation/benefits and risk/insurance costs);
the fund’s liability for these costs of operations is included in Payables to Vanguard on the
Statement of Net Assets.
Upon the request of Vanguard, the fund may invest up to 0.40% of its net assets as capital in
Vanguard. At August 31, 2017, the fund had contributed to Vanguard capital in the amount of
$4,851,000, representing 0.01% of the fund’s net assets and 1.94% of Vanguard’s capitalization.
The fund’s trustees and officers are also directors and employees, respectively, of Vanguard.
C. Various inputs may be used to determine the value of the fund’s investments. These inputs
are summarized in three broad levels for financial statement purposes. The inputs or methodologies
used to value securities are not necessarily an indication of the risk associated with investing
in those securities.
Level 1—Quoted prices in active markets for identical securities.
Level 2—Other significant observable inputs (including quoted prices for similar securities, interest
rates, prepayment speeds, credit risk, etc.).
Level 3—Significant unobservable inputs (including the fund’s own assumptions used to determine
the fair value of investments). Any investments valued with significant unobservable inputs are
noted on the Statement of Net Assets.
At August 31, 2017, 100% of the market value of the fund’s investments was determined using
amortized cost, in accordance with rules under the Investment Company Act of 1940. Amortized
cost approximates the current fair value of a security, but since the value is not obtained from a
quoted price in an active market, securities valued at amortized cost are considered to be valued
using Level 2 inputs.
D. Management has determined that no material events or transactions occurred subsequent
to August 31, 2017, that would require recognition or disclosure in these financial statements.
42
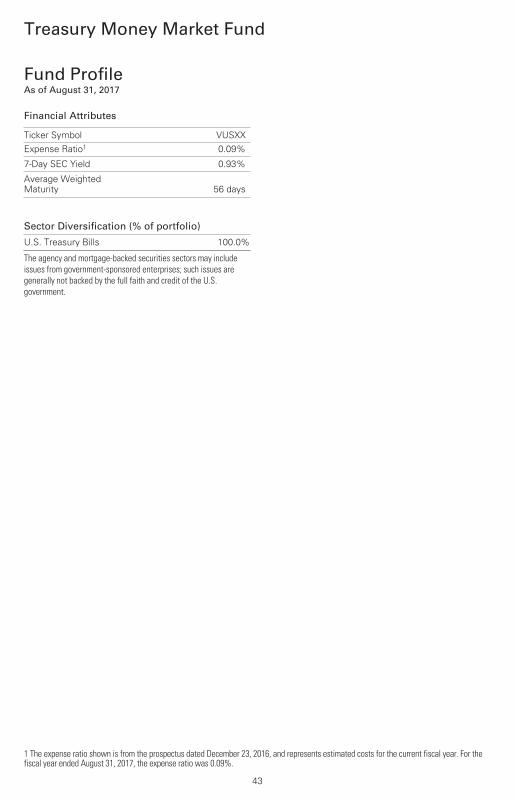
Treasury Money Market Fund
Fund ProfileAs of August 31, 2017
1 The expense ratio shown is from the prospectus dated December 23, 2016, and represents estimated costs for the current fiscal year. For the fiscal year ended August 31, 2017, the expense ratio was 0.09%.
43
Financial Attributes
Ticker Symbol VUSXXExpense Ratio1 0.09%
7-Day SEC Yield 0.93%
Average WeightedMaturity 56 days
Sector Diversification (% of portfolio)
U.S. Treasury Bills 100.0%
The agency and mortgage-backed securities sectors may include issues from government-sponsored enterprises; such issues are generally not backed by the full faith and credit of the U.S. government.
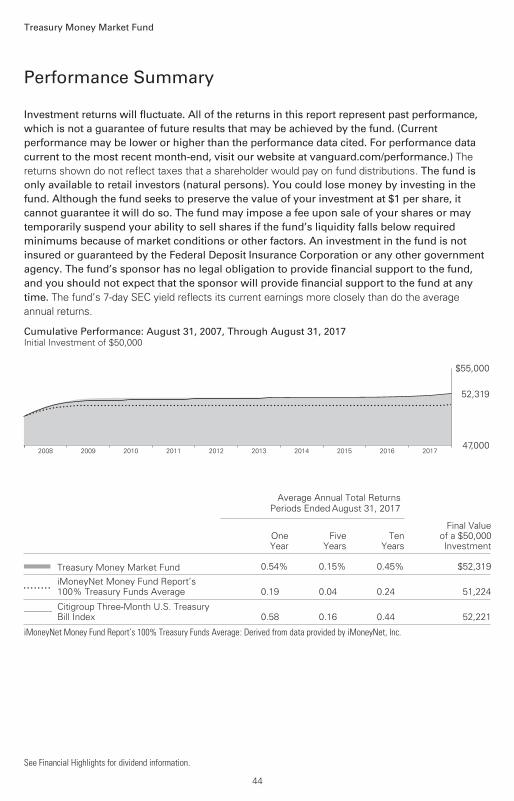
Performance Summary
Treasury Money Market Fund
See Financial Highlights for dividend information.
Investment returns will fluctuate. All of the returns in this report represent past performance, which is not a guarantee of future results that may be achieved by the fund. (Current performance may be lower or higher than the performance data cited. For performance data current to the most recent month-end, visit our website at vanguard.com/performance.) The returns shown do not reflect taxes that a shareholder would pay on fund distributions. The fund is only available to retail investors (natural persons). You could lose money by investing in the fund. Although the fund seeks to preserve the value of your investment at $1 per share, it cannot guarantee it will do so. The fund may impose a fee upon sale of your shares or may temporarily suspend your ability to sell shares if the fund’s liquidity falls below required minimums because of market conditions or other factors. An investment in the fund is not insured or guaranteed by the Federal Deposit Insurance Corporation or any other government agency. The fund’s sponsor has no legal obligation to provide financial support to the fund, and you should not expect that the sponsor will provide financial support to the fund at any time. The fund’s 7-day SEC yield reflects its current earnings more closely than do the average annual returns.
44
Cumulative Performance: August 31, 2007, Through August 31, 2017Initial Investment of $50,000
2017201620152014201320122011201020092008
$55,000
47,000
52,319
Average Annual Total ReturnsPeriods Ended August 31, 2017
OneYear
FiveYears
TenYears
Final Valueof a $50,000Investment
Treasury Money Market Fund 0.54% 0.15% 0.45% $52,319
• • • • • • • •iMoneyNet Money Fund Report’s100% Treasury Funds Average 0.19 0.04 0.24 51,224
________ Citigroup Three-Month U.S. TreasuryBill Index 0.58 0.16 0.44 52,221
iMoneyNet Money Fund Report’s 100% Treasury Funds Average: Derived from data provided by iMoneyNet, Inc.
Treasury Money Market Fund
45
Fiscal-Year Total Returns (%): August 31, 2007, Through August 31, 2017
Fiscal Year Total Returns
iMoneyNetAverage
Total Returns
2008 3.08% 2.08%
2009 0.70 0.17
2010 0.03 0.00
2011 0.02 0.00
2012 0.01 0.00
2013 0.02 0.00
2014 0.01 0.00
2015 0.01 0.00
2016 0.17 0.00
2017 0.54 0.19
7-day SEC yield (8/31/2017): 0.93%
iMoneyNet Money Fund Report’s 100% Treasury Funds Average: Derived from data provided by iMoneyNet, Inc.
Average Annual Total Returns: Periods Ended June 30, 2017This table presents returns through the latest calendar quarter—rather than through the end of the fiscal period.Securities and Exchange Commission rules require that we provide this information.
InceptionDate
OneYear
FiveYears
TenYears
Treasury Money Market Fund 12/14/1992 0.43% 0.12% 0.52%
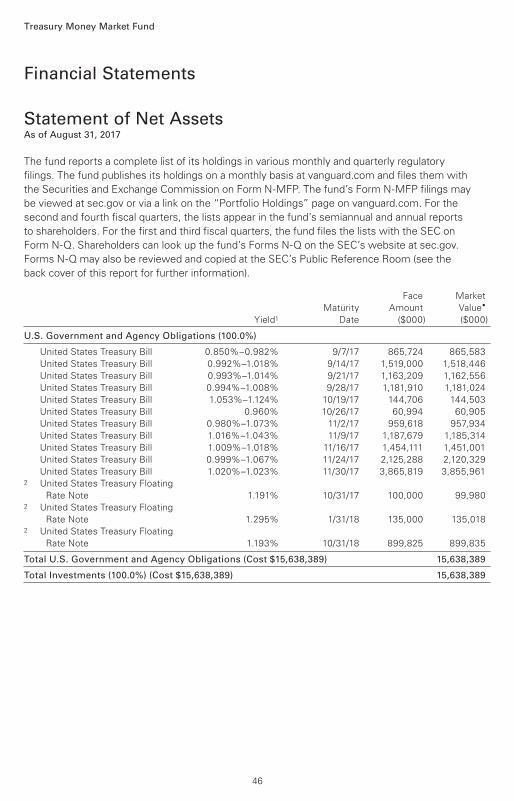
Financial Statements
Statement of Net AssetsAs of August 31, 2017
Treasury Money Market Fund
U.S. Government and Agency Obligations (100.0%)
United States Treasury Bill 0.850%–0.982% 9/7/17 865,724 865,583
United States Treasury Bill 0.992%–1.018% 9/14/17 1,519,000 1,518,446
United States Treasury Bill 0.993%–1.014% 9/21/17 1,163,209 1,162,556
United States Treasury Bill 0.994%–1.008% 9/28/17 1,181,910 1,181,024
United States Treasury Bill 1.053%–1.124% 10/19/17 144,706 144,503
United States Treasury Bill 0.960% 10/26/17 60,994 60,905
United States Treasury Bill 0.980%–1.073% 11/2/17 959,618 957,934
United States Treasury Bill 1.016%–1.043% 11/9/17 1,187,679 1,185,314
United States Treasury Bill 1.009%–1.018% 11/16/17 1,454,111 1,451,001
United States Treasury Bill 0.999%–1.067% 11/24/17 2,125,288 2,120,329
United States Treasury Bill 1.020%–1.023% 11/30/17 3,865,819 3,855,9612 United States Treasury Floating
Rate Note 1.191% 10/31/17 100,000 99,9802 United States Treasury Floating
Rate Note 1.295% 1/31/18 135,000 135,0182 United States Treasury Floating
Rate Note 1.193% 10/31/18 899,825 899,835
Total U.S. Government and Agency Obligations (Cost $15,638,389) 15,638,389
Total Investments (100.0%) (Cost $15,638,389) 15,638,389
Face Market
Maturity Amount Value•
Yield1 Date ($000) ($000)
The fund reports a complete list of its holdings in various monthly and quarterly regulatory
filings. The fund publishes its holdings on a monthly basis at vanguard.com and files them with
the Securities and Exchange Commission on Form N-MFP. The fund’s Form N-MFP filings may
be viewed at sec.gov or via a link on the “Portfolio Holdings” page on vanguard.com. For the
second and fourth fiscal quarters, the lists appear in the fund’s semiannual and annual reports
to shareholders. For the first and third fiscal quarters, the fund files the lists with the SEC on
Form N-Q. Shareholders can look up the fund’s Forms N-Q on the SEC’s website at sec.gov.
Forms N-Q may also be reviewed and copied at the SEC’s Public Reference Room (see the
back cover of this report for further information).
46
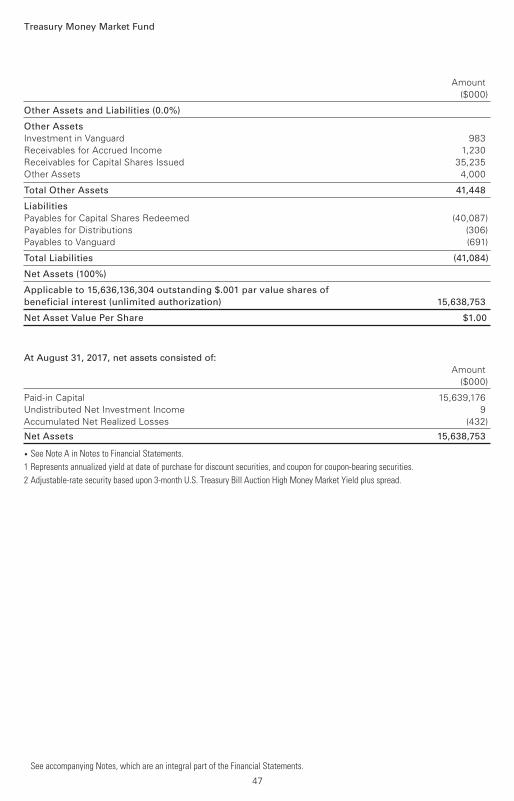
Treasury Money Market Fund
Other Assets and Liabilities (0.0%)
Other Assets
Investment in Vanguard 983Receivables for Accrued Income 1,230Receivables for Capital Shares Issued 35,235Other Assets 4,000
Total Other Assets 41,448
Liabilities
Payables for Capital Shares Redeemed (40,087)Payables for Distributions (306)Payables to Vanguard (691)
Total Liabilities (41,084)
Net Assets (100%)
Applicable to 15,636,136,304 outstanding $.001 par value shares of
beneficial interest (unlimited authorization) 15,638,753
Net Asset Value Per Share $1.00
At August 31, 2017, net assets consisted of:
Amount ($000)
Paid-in Capital 15,639,176Undistributed Net Investment Income 9Accumulated Net Realized Losses (432)
Net Assets 15,638,753
• See Note A in Notes to Financial Statements.
1 Represents annualized yield at date of purchase for discount securities, and coupon for coupon-bearing securities.
2 Adjustable-rate security based upon 3-month U.S. Treasury Bill Auction High Money Market Yield plus spread.
Amount ($000)
See accompanying Notes, which are an integral part of the Financial Statements.
47
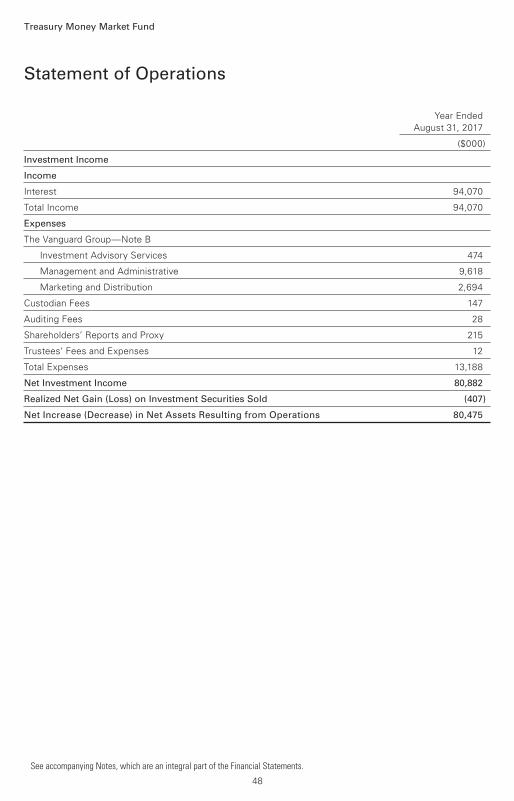
Year Ended
August 31, 2017
($000)
Investment Income
Income
Interest 94,070
Total Income 94,070
Expenses
The Vanguard Group—Note B
Investment Advisory Services 474
Management and Administrative 9,618
Marketing and Distribution 2,694
Custodian Fees 147
Auditing Fees 28
Shareholders’ Reports and Proxy 215
Trustees’ Fees and Expenses 12
Total Expenses 13,188
Net Investment Income 80,882
Realized Net Gain (Loss) on Investment Securities Sold (407)
Net Increase (Decrease) in Net Assets Resulting from Operations 80,475
Statement of Operations
Treasury Money Market Fund
See accompanying Notes, which are an integral part of the Financial Statements.
48
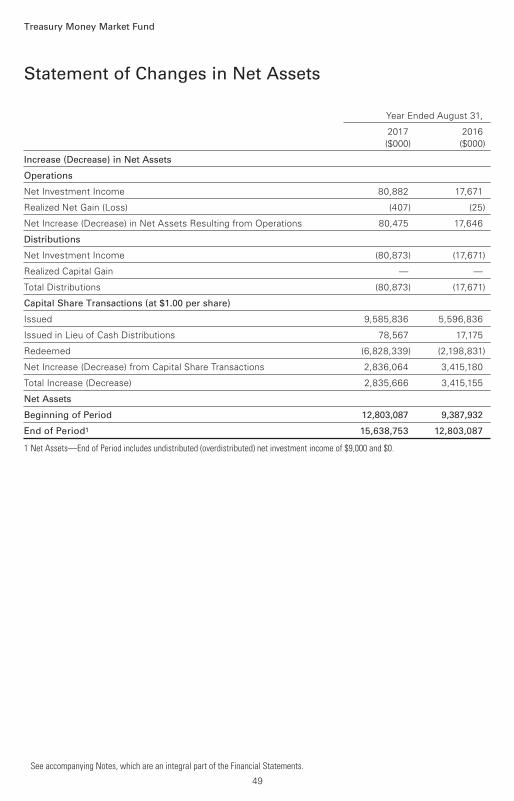
Statement of Changes in Net Assets
Treasury Money Market Fund
See accompanying Notes, which are an integral part of the Financial Statements.
Year Ended August 31,
2017 2016
($000) ($000)
Increase (Decrease) in Net Assets
Operations
Net Investment Income 80,882 17,671
Realized Net Gain (Loss) (407) (25)
Net Increase (Decrease) in Net Assets Resulting from Operations 80,475 17,646
Distributions
Net Investment Income (80,873) (17,671)
Realized Capital Gain — —
Total Distributions (80,873) (17,671)
Capital Share Transactions (at $1.00 per share)
Issued 9,585,836 5,596,836
Issued in Lieu of Cash Distributions 78,567 17,175
Redeemed (6,828,339) (2,198,831)
Net Increase (Decrease) from Capital Share Transactions 2,836,064 3,415,180
Total Increase (Decrease) 2,835,666 3,415,155
Net Assets
Beginning of Period 12,803,087 9,387,932
End of Period1 15,638,753 12,803,087
1 Net Assets—End of Period includes undistributed (overdistributed) net investment income of $9,000 and $0.
49
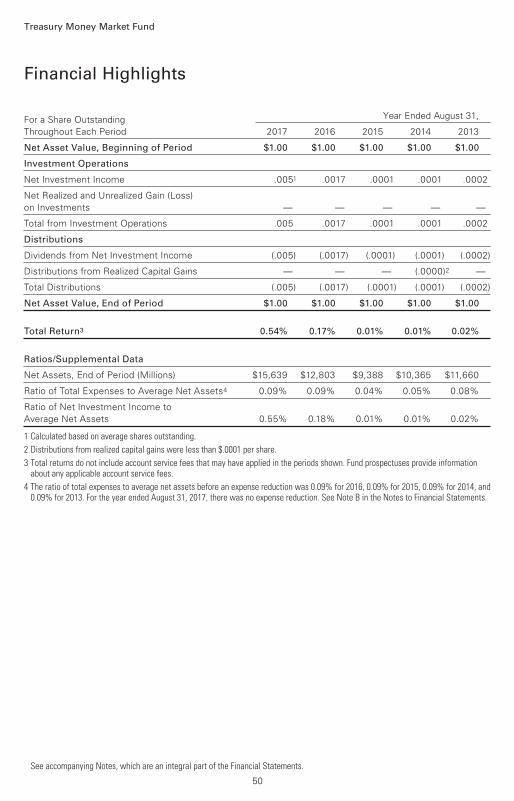
For a Share Outstanding Year Ended August 31,
Throughout Each Period 2017 2016 2015 2014 2013
Net Asset Value, Beginning of Period $1.00 $1.00 $1.00 $1.00 $1.00
Investment Operations
Net Investment Income .0051 .0017 .0001 .0001 .0002
Net Realized and Unrealized Gain (Loss)
on Investments — — — — —
Total from Investment Operations .005 .0017 .0001 .0001 .0002
Distributions
Dividends from Net Investment Income (.005) (.0017) (.0001) (.0001) (.0002)
Distributions from Realized Capital Gains — — — (.0000)2 —
Total Distributions (.005) (.0017) (.0001) (.0001) (.0002)
Net Asset Value, End of Period $1.00 $1.00 $1.00 $1.00 $1.00
Total Return3 0.54% 0.17% 0.01% 0.01% 0.02%
Ratios/Supplemental Data
Net Assets, End of Period (Millions) $15,639 $12,803 $9,388 $10,365 $11,660
Ratio of Total Expenses to Average Net Assets4 0.09% 0.09% 0.04% 0.05% 0.08%
Ratio of Net Investment Income to
Average Net Assets 0.55% 0.18% 0.01% 0.01% 0.02%
1 Calculated based on average shares outstanding.
2 Distributions from realized capital gains were less than $.0001 per share.
3 Total returns do not include account service fees that may have applied in the periods shown. Fund prospectuses provide information about any applicable account service fees.
4 The ratio of total expenses to average net assets before an expense reduction was 0.09% for 2016, 0.09% for 2015, 0.09% for 2014, and 0.09% for 2013. For the year ended August 31, 2017, there was no expense reduction. See Note B in the Notes to Financial Statements.
Financial Highlights
See accompanying Notes, which are an integral part of the Financial Statements.
Treasury Money Market Fund
50
Notes to Financial Statements
Treasury Money Market Fund
Vanguard Treasury Money Market Fund is registered under the Investment Company Act
of 1940 as an open-end investment company, or mutual fund. The fund invests in short-term
debt instruments backed by the full faith and credit of the U.S. government.
A. The following significant accounting policies conform to generally accepted accounting
principles for U.S. investment companies. The fund consistently follows such policies in
preparing its financial statements.
1. Security Valuation: Securities are valued as of the close of trading on the New York Stock
Exchange (generally 4 p.m., Eastern time) on the valuation date. Securities are valued at
amortized cost, which approximates market value.
2. Federal Income Taxes: The fund intends to continue to qualify as a regulated investment
company and distribute all of its taxable income. Management has analyzed the fund’s tax
positions taken for all open federal income tax years (August 31, 2014–2017), and has concluded
that no provision for federal income tax is required in the fund’s financial statements.
3. Distributions: Distributions from net investment income are declared daily and paid on the first
business day of the following month.
4. Credit Facility: The fund and certain other funds managed by The Vanguard Group (“Vanguard”)
participate in a $3.1 billion committed credit facility provided by a syndicate of lenders pursuant to
a credit agreement that may be renewed annually; each fund is individually liable for its borrowings,
if any, under the credit facility. Borrowings may be utilized for temporary and emergency purposes,
and are subject to the fund’s regulatory and contractual borrowing restrictions. The participating
funds are charged administrative fees and an annual commitment fee of 0.10% of the undrawn
amount of the facility; these fees are allocated to the funds based on a method approved by the
fund’s board of trustees and included in Management and Administrative expenses on the fund’s
Statement of Operations. Any borrowings under this facility bear interest at a rate based upon the
higher of the one-month London Interbank Offered Rate, federal funds effective rate, or overnight
bank funding rate plus an agreed-upon spread.
The fund had no borrowings outstanding at August 31, 2017, or at any time during the period
then ended.
5. Other: Interest income is accrued daily. Premiums and discounts on debt securities purchased are
amortized and accreted, respectively, to interest income over the lives of the respective securities.
Security transactions are accounted for on the date securities are bought or sold. Costs used to
determine realized gains (losses) on the sale of investment securities are those of the specific
securities sold.
B. In accordance with the terms of a Funds’ Service Agreement (the “FSA”) between Vanguard
and the fund, Vanguard furnishes to the fund investment advisory, corporate management,
administrative, marketing, and distribution services at Vanguard’s cost of operations (as defined
by the FSA). These costs of operations are allocated to the fund based on methods and guidelines
approved by the board of trustees. Vanguard does not require reimbursement in the current period
for certain costs of operations (such as deferred compensation/benefits and risk/insurance costs);
the fund’s liability for these costs of operations is included in Payables to Vanguard on the
Statement of Net Assets.
51
Treasury Money Market Fund
Upon the request of Vanguard, the fund may invest up to 0.40% of its net assets as capital in
Vanguard. At August 31, 2017, the fund had contributed to Vanguard capital in the amount of
$983,000, representing 0.01% of the fund’s net assets and 0.39% of Vanguard’s capitalization.
The fund’s trustees and officers are also directors and employees, respectively, of Vanguard.
Vanguard and the board of trustees have agreed to temporarily limit certain net operating expenses
in excess of the fund’s daily yield in order to maintain a zero or positive yield for the fund. Vanguard
and the board of trustees may terminate the temporary expense limitation at any time. The fund is
not obligated to repay this amount to Vanguard. For the year ended August 31, 2017, the fund did
not receive an expense reduction from Vanguard.
C. Various inputs may be used to determine the value of the fund’s investments. These inputs are
summarized in three broad levels for financial statement purposes. The inputs or methodologies
used to value securities are not necessarily an indication of the risk associated with investing in
those securities.
Level 1—Quoted prices in active markets for identical securities.
Level 2—Other significant observable inputs (including quoted prices for similar securities, interest
rates, prepayment speeds, credit risk, etc.).
Level 3—Significant unobservable inputs (including the fund’s own assumptions used to determine
the fair value of investments). Any investments valued with significant unobservable inputs are
noted on the Statement of Net Assets.
At August 31, 2017, 100% of the market value of the fund’s investments was determined using
amortized cost, in accordance with rules under the Investment Company Act of 1940. Amortized
cost approximates the current fair value of a security, but since the value is not obtained from a
quoted price in an active market, securities valued at amortized cost are considered to be valued
using Level 2 inputs.
D. Management has determined that no material events or transactions occurred subsequent
to August 31, 2017, that would require recognition or disclosure in these financial statements.
52
To the Board of Trustees of Vanguard Money Market Reserves and Vanguard Admiral Funds and
the Shareholders of Vanguard Prime Money Market Fund, Vanguard Federal Money Market Fund
and Vanguard Treasury Money Market Fund:
In our opinion, the accompanying statements of net assets and the related statements of
operations and of changes in net assets and the financial highlights present fairly, in all material
respects, the financial position of Vanguard Prime Money Market Fund and Vanguard Federal
Money Market Fund (constituting separate portfolios of Vanguard Money Market Reserves) and
Vanguard Treasury Money Market Fund (constituting a separate portfolio of Vanguard Admiral
Funds) (hereafter referred to as the “Funds”) as of August 31, 2017, the results of each of their
operations for the year then ended, the changes in each of their net assets for each of the two
years in the period then ended and the financial highlights for each of the five years in the period
then ended, in conformity with accounting principles generally accepted in the United States of
America. These financial statements and financial highlights (hereafter referred to as “financial
statements”) are the responsibility of the Funds’ management. Our responsibility is to express
an opinion on these financial statements based on our audits. We conducted our audits of these
financial statements in accordance with the standards of the Public Company Accounting
Oversight Board (United States). Those standards require that we plan and perform the audit
to obtain reasonable assurance about whether the financial statements are free of material
misstatement. An audit includes examining, on a test basis, evidence supporting the amounts
and disclosures in the financial statements, assessing the accounting principles used and
significant estimates made by management, and evaluating the overall financial statement
presentation. We believe that our audits, which included confirmation of securities as of
August 31, 2017 by correspondence with the custodian and brokers, provide a reasonable
basis for our opinion.
/s/PricewaterhouseCoopers LLP
Philadelphia, Pennsylvania
October 13, 2017
Report of Independent Registered Public Accounting Firm
53
Special 2017 tax information (unaudited) for Vanguard Prime Money Market Fund
This information for the fiscal year ended August 31, 2017, is included pursuant to provisions
of the Internal Revenue Code.
For nonresident alien shareholders, 69.5% of income dividends are interest-related dividends.
Special 2017 tax information (unaudited) for Vanguard Federal Money Market Fund
This information for the fiscal year ended August 31, 2017, is included pursuant to provisions
of the Internal Revenue Code.
For nonresident alien shareholders, 100% of income dividends are interest-related dividends.
Special 2017 tax information (unaudited) for Vanguard Treasury Money Market Fund
This information for the fiscal year ended August 31, 2017, is included pursuant to provisions
of the Internal Revenue Code.
For nonresident alien shareholders, 100% of income dividends are interest-related dividends.
54
About Your Fund’s Expenses
55
As a shareholder of the fund, you incur ongoing costs, which include costs for portfolio management, administrative services, and shareholder reports (like this one), among others. Operating expenses, which are deducted from a fund’s gross income, directly reduce the investment return of the fund.
A fund’s expenses are expressed as a percentage of its average net assets. This figure is known as the expense ratio. The following examples are intended to help you understand the ongoing costs (in dollars) of investing in your fund and to compare these costs with those of other mutual funds. The examples are based on an investment of $1,000 made at the beginning of the period shown and held for the entire period.
The accompanying table illustrates your fund’s costs in two ways:
• Based on actual fund return. This section helps you to estimate the actual expenses that you paid over the period. The ”Ending Account Value“ shown is derived from the fund‘s actual return, and the third column shows the dollar amount that would have been paid by an investor who started with $1,000 in the fund. You may use the information here, together with the amount you invested, to estimate the expenses that you paid over the period.
To do so, simply divide your account value by $1,000 (for example, an $8,600 account value divided by $1,000 = 8.6), then multiply the result by the number given for your fund under the heading ”Expenses Paid During Period.“
• Based on hypothetical 5% yearly return. This section is intended to help you compare your fund‘s costs with those of other mutual funds. It assumes that the fund had a yearly return of 5% before expenses, but that the expense ratio is unchanged. In this case—because the return used is not the fund’s actual return—the results do not apply to your investment. The example is useful in making comparisons because the Securities and Exchange Commission requires all mutual funds to calculate expenses based on a 5% return. You can assess your fund’s costs by comparing this hypothetical example with the hypothetical examples that appear in shareholder reports of other funds.
Note that the expenses shown in the table are meant to highlight and help you compare ongoingcosts only and do not reflect transaction costs incurred by the fund for buying and sellingsecurities. Further, the expenses do not include any purchase, redemption, or account servicefees described in the fund prospectus. If such fees were applied to your account, your costswould be higher. Your fund does not carry a “sales load.”
The calculations assume no shares were bought or sold during the period. Your actual costs mayhave been higher or lower, depending on the amount of your investment and the timing of anypurchases or redemptions.
You can find more information about the fund’s expenses, including annual expense ratios, in theFinancial Statements section of this report. For additional information on operating expenses andother shareholder costs, please refer to your fund’s current prospectus.
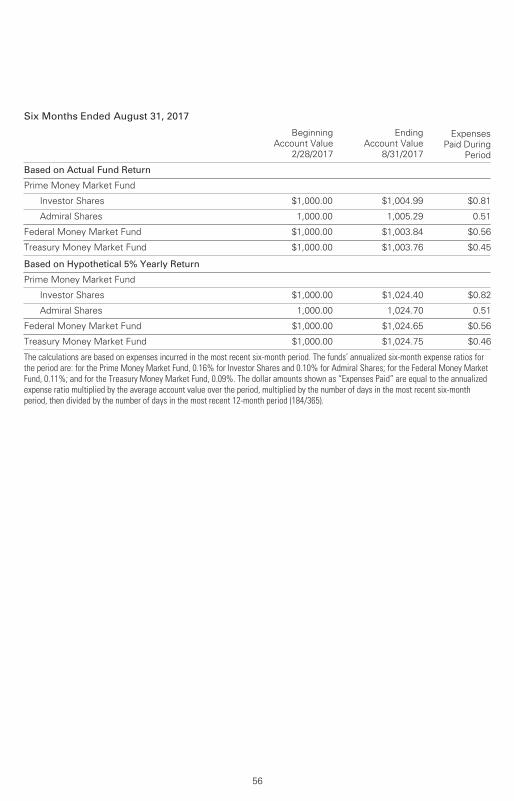
56
Six Months Ended August 31, 2017
BeginningAccount Value
2/28/2017
EndingAccount Value
8/31/2017
ExpensesPaid During
Period
Based on Actual Fund Return
Prime Money Market Fund
Investor Shares $1,000.00 $1,004.99 $0.81
Admiral Shares 1,000.00 1,005.29 0.51
Federal Money Market Fund $1,000.00 $1,003.84 $0.56
Treasury Money Market Fund $1,000.00 $1,003.76 $0.45
Based on Hypothetical 5% Yearly Return
Prime Money Market Fund
Investor Shares $1,000.00 $1,024.40 $0.82
Admiral Shares 1,000.00 1,024.70 0.51
Federal Money Market Fund $1,000.00 $1,024.65 $0.56
Treasury Money Market Fund $1,000.00 $1,024.75 $0.46
The calculations are based on expenses incurred in the most recent six-month period. The funds’ annualized six-month expense ratios forthe period are: for the Prime Money Market Fund, 0.16% for Investor Shares and 0.10% for Admiral Shares; for the Federal Money MarketFund, 0.11%; and for the Treasury Money Market Fund, 0.09%. The dollar amounts shown as “Expenses Paid” are equal to the annualizedexpense ratio multiplied by the average account value over the period, multiplied by the number of days in the most recent six-monthperiod, then divided by the number of days in the most recent 12-month period (184/365).
The board of trustees of Vanguard Prime Money Market Fund, Vanguard Federal Money Market
Fund, and Vanguard Treasury Money Market Fund has renewed each fund’s investment advisory
arrangement with The Vanguard Group, Inc. (Vanguard), through its Fixed Income Group. The board
determined that continuing each fund’s internalized management structure was in the best
interests of the fund and its shareholders.
The board based its decision upon an evaluation of the advisor’s investment staff, portfolio
management process, and performance. This evaluation included information provided to the board
by Vanguard’s Portfolio Review Department, which is responsible for fund and advisor oversight
and product management. The Portfolio Review Department met regularly with the advisor and
made monthly presentations to the board during the fiscal year that directed the board’s focus
to relevant information and topics.
The board, or an investment committee made up of board members, also received information
throughout the year through advisor presentations. For each advisor presentation, the board was
provided with letters and reports that included information about, among other things, the advisory
firm and the advisor’s assessment of the investment environment, portfolio performance, and
portfolio characteristics.
In addition, the board received monthly reports, which included a Market and Economic Report,
a Fund Dashboard Monthly Summary, and a Fund Performance Report.
Prior to their meeting, the trustees were provided with a memo and materials that summarized
the information they had received over the course of the year. They also considered the factors
discussed below, among others. However, no single factor determined whether the board
approved the arrangements. Rather, it was the totality of the circumstances that drove the board’s
decision.
Nature, extent, and quality of services
The board reviewed the quality of each fund’s investment management services over both the
short and long term and took into account the organizational depth and stability of the advisor.
The board considered that Vanguard has been managing investments for more than three decades.
The Fixed Income Group adheres to a sound, disciplined investment management process; the
team has considerable experience, stability, and depth.
The board concluded that Vanguard’s experience, stability, depth, and performance, among other
factors, warranted continuation of each advisory arrangement.
Investment performance
The board considered the short- and long-term performance of each fund, including any periods
of outperformance or underperformance compared with a relevant benchmark index and peer
group. The board concluded that the performance was such that each advisory arrangement
should continue. Information about each fund’s most recent performance can be found on the
Performance Summary pages of this report.
Trustees Approve Advisory Arrangements
57
Cost
The board concluded that each fund’s expense ratio was well below the average expense ratio
charged by funds in its peer group and that each fund’s advisory expenses were also well below
its peer-group average. Information about the funds’ expenses appears in the About Your Fund’s
Expenses section of this report as well as in the Financial Statements sections.
The board does not conduct a profitability analysis of Vanguard because of Vanguard’s unique
“at-cost” structure. Unlike most other mutual fund management companies, Vanguard is owned
by the funds it oversees and produces “profits” only in the form of reduced expenses for fund
shareholders.
The benefit of economies of scale
The board concluded that each fund’s at-cost arrangement with Vanguard ensures that the funds
will realize economies of scale as they grow, with the cost to shareholders declining as fund
assets increase.
The board will consider whether to renew the advisory arrangements again after a one-year period.
58
Glossary
59
SEC Yields. A money market fund’s 7-day SEC yield is calculated by annualizing its incomedistributions for the previous seven days, as required by the U.S. Securities and ExchangeCommission.
Average Weighted Maturity. The average length of time until fixed income securities held by afund reach maturity and are repaid. The figure reflects the proportion of fund assets representedby each security.
Expense Ratio. A fund’s total annual operating expenses expressed as a percentage of the fund’saverage net assets. The expense ratio includes management and administrative expenses, butdoes not include the transaction costs of buying and selling portfolio securities.
Inception Date. The date on which the assets of a fund (or one of its share classes) are firstinvested in accordance with the fund’s investment objective. For funds with a subscription period,the inception date is the day after that period ends. Investment performance is measured fromthe inception date.
The People Who Govern Your Fund
The trustees of your mutual fund are there to see that the fund is operated and managed in your
best interests since, as a shareholder, you are a part owner of the fund. Your fund’s trustees also
serve on the board of directors of The Vanguard Group, Inc., which is owned by the Vanguard
funds and provides services to them on an at-cost basis.
A majority of Vanguard’s board members are independent, meaning that they have no affiliation
with Vanguard or the funds they oversee, apart from the sizable personal investments they have
made as private individuals. The independent board members have distinguished backgrounds
in business, academia, and public service. Each of the trustees and executive officers oversees
195 Vanguard funds.
Information for each trustee and executive officer of the fund appears below. The mailing address
of the trustees and officers is P.O. Box 876, Valley Forge, PA 19482. More information about the
trustees is in the Statement of Additional Information, which can be obtained, without charge,
by contacting Vanguard at 800-662-7447, or online at vanguard.com.
Interested Trustee1
F. William McNabb III
Born 1957. Trustee Since July 2009. Chairman
of the Board. Principal Occupation(s) During the
Past Five Years and Other Experience: Chairman
of the Board of The Vanguard Group, Inc., and
of each of the investment companies served by
The Vanguard Group, since January 2010; Chief
Executive Officer and Director of The Vanguard
Group and President and Chief Executive Officer
of each of the investment companies served by
The Vanguard Group, since 2008; Director of
Vanguard Marketing Corporation; President of
The Vanguard Group (2008–2017); Managing
Director of The Vanguard Group (1995–2008).
Independent Trustees
Emerson U. Fullwood
Born 1948. Trustee Since January 2008. Principal
Occupation(s) During the Past Five Years and Other
Experience: Executive Chief Staff and Marketing
Officer for North America and Corporate Vice
President (retired 2008) of Xerox Corporation
(document manage ment products and services);
Executive in Residence and 2009–2010
Distinguished Minett Professor at the Rochester
Institute of Technology; Lead Director of SPX
FLOW, Inc. (multi-industry manufacturing);
Director of the United Way of Rochester, the
University of Rochester Medical Center, Monroe
Community College Foundation, North Carolina
A&T University, and Roberts Wesleyan College;
Trustee of the University of Rochester.
Rajiv L. Gupta
Born 1945. Trustee Since December 2001.2
Principal Occupation(s) During the Past Five
Years and Other Experience: Chairman and
Chief Executive Officer (retired 2009) and
President (2006–2008) of Rohm and Haas Co.
(chemicals); Director of Arconic Inc. (diversified
manufacturer), HP Inc. (printer and personal
computer manufacturing), and Delphi Automotive
plc (automotive components); Senior Advisor at
New Mountain Capital.
Amy Gutmann
Born 1949. Trustee Since June 2006. Principal
Occupation(s) During the Past Five Years and
Other Experience: President of the University
of Pennsylvania; Christopher H. Browne
1 Mr. McNabb is considered an “interested person,” as defined in the Investment Company Act of 1940, because he is an officer of the Vanguard funds.
2 December 2002 for Vanguard Equity Income Fund, the Vanguard Municipal Bond Funds, and the Vanguard State Tax-Exempt Funds.
Distinguished Professor of Political Science,
School of Arts and Sciences, and Professor
of Communication, Annenberg School for
Communication, with secondary faculty appoint-
ments in the Department of Philosophy, School
of Arts and Sciences, and at the Graduate School
of Education, University of Pennsylvania; Trustee
of the National Constitution Center.
JoAnn Heffernan Heisen
Born 1950. Trustee Since July 1998. Principal
Occupation(s) During the Past Five Years and
Other Experience: Corporate Vice President
and Member of the Executive Committee
(1997–2008), Chief Global Diversity Officer
(retired 2008), Vice President and Chief
Information Officer (1997–2006), Controller
(1995–1997), Treasurer (1991–1995), and
Assistant Treasurer (1989–1991) of Johnson
& Johnson (pharmaceuticals/medical devices/
consumer products); Director of Skytop Lodge
Corporation (hotels) and the Robert Wood
Johnson Foundation; Member of the Advisory
Board of the Institute for Women’s Leadership
at Rutgers University.
F. Joseph Loughrey
Born 1949. Trustee Since October 2009.
Principal Occupation(s) During the Past Five
Years and Other Experience: President and Chief
Operating Officer (retired 2009) of Cummins Inc.
(industrial machinery); Chairman of the Board of
Hillenbrand, Inc. (specialized consumer services),
Oxfam America, and the Lumina Foundation for
Education; Director of the V Foundation for
Cancer Research; Member of the Advisory
Council for the College of Arts and Letters
and Chair of the Advisory Board to the Kellogg
Institute for International Studies, both at the
University of Notre Dame.
Mark Loughridge
Born 1953. Trustee Since March 2012. Principal
Occupation(s) During the Past Five Years and
Other Experience: Senior Vice President and
Chief Financial Officer (retired 2013) at IBM
(information technology services); Fiduciary
Member of IBM’s Retirement Plan Committee
(2004–2013); Director of the Dow Chemical
Company; Member of the Council on
Chicago Booth.
Scott C. Malpass
Born 1962. Trustee Since March 2012. Principal
Occupation(s) During the Past Five Years and
Other Experience: Chief Investment Officer and
Vice President at the University of Notre Dame;
Assistant Professor of Finance at the Mendoza
College of Business at Notre Dame; Member of
the Notre Dame 403(b) Investment Committee,
the Board of Advisors for Spruceview Capital
Partners, the Board of Catholic Investment
Services, Inc. (investment advisor), and the
Board of Superintendence of the Institute for
the Works of Religion; Chairman of the Board of
TIFF Advisory Services, Inc. (investment advisor).
André F. Perold
Born 1952. Trustee Since December 2004.
Principal Occupation(s) During the Past Five Years
and Other Experience: George Gund Professor of
Finance and Banking, Emeritus at the Harvard
Business School (retired 2011); Chief Investment
Officer and Co-Managing Partner of HighVista
Strategies LLC (private investment firm);
Overseer of the Museum of Fine Arts Boston.
Peter F. Volanakis
Born 1955. Trustee Since July 2009. Principal
Occupation(s) During the Past Five Years and
Other Experience: President and Chief Operating
Officer (retired 2010) of Corning Incorporated
(communications equipment); Chairman of the
Board of Trustees of Colby-Sawyer College;
Member of the Board of Hypertherm, Inc.
(industrial cutting systems, software, and
consumables).
Executive Officers
Glenn Booraem
Born 1967. Investment Stewardship Officer Since
February 2017. Principal Occupation(s) During the
Past Five Years and Other Experience: Principal of
The Vanguard Group, Inc.; Treasurer (2015–2017),
Controller (2010–2015), and Assistant Controller
(2001–2010) of each of the investment companies
served by The Vanguard Group.
Thomas J. Higgins
Born 1957. Chief Financial Officer Since
September 2008. Principal Occupation(s) During
the Past Five Years and Other Experience: Principal
of The Vanguard Group, Inc.; Chief Financial Officer
of each of the investment companies served by
The Vanguard Group; Treasurer of each of the
investment companies served by The Vanguard
Group (1998–2008).
Peter Mahoney
Born 1974. Controller Since May 2015. Principal
Occupation(s) During the Past Five Years and
Other Experience: Principal of The Vanguard
Group, Inc.; Controller of each of the investment
companies served by The Vanguard Group; Head
of International Fund Services at The Vanguard
Group (2008–2014).
Anne E. Robinson
Born 1970. Secretary Since September 2016.
Principal Occupation(s) During the Past Five Years
and Other Experience: Managing Director of The
Vanguard Group, Inc.; General Counsel of The
Vanguard Group; Secretary of The Vanguard Group
and of each of the investment companies served
by The Vanguard Group; Director and Senior Vice
President of Vanguard Marketing Corporation;
Managing Director and General Counsel of Global
Cards and Consumer Services at Citigroup
(2014–2016); Counsel at American Express
(2003–2014).
Michael Rollings
Born 1963. Treasurer Since February 2017.
Principal Occupation(s) During the Past Five
Years and Other Experience: Managing Director
of The Vanguard Group, Inc.; Treasurer of each
of the investment companies served by The
Vanguard Group; Director of Vanguard Marketing
Corporation; Executive Vice President and Chief
Financial Officer of MassMutual Financial Group
(2006–2016).
Vanguard Senior Management Team
Mortimer J. Buckley Chris D. McIsaac
Gregory Davis James M. Norris
John James Thomas M. Rampulla
Martha G. King Karin A. Risi
John T. Marcante
Chairman Emeritus and Senior Advisor
John J. Brennan
Chairman, 1996–2009
Chief Executive Officer and President, 1996–2008
Founder
John C. Bogle
Chairman and Chief Executive Officer, 1974–1996
P.O. Box 2600Valley Forge, PA 19482-2600
Connect with Vanguard® > vanguard.com
Fund Information > 800-662-7447
Direct Investor Account Services > 800-662-2739
Institutional Investor Services > 800-523-1036
Text Telephone for PeopleWho Are Deaf or Hard of Hearing > 800-749-7273
This material may be used in conjunctionwith the offering of shares of any Vanguardfund only if preceded or accompanied bythe fund’s current prospectus.
All comparative mutual fund data are from Lipper, aThomson Reuters Company, or Morningstar, Inc., unlessotherwise noted.
You can obtain a free copy of Vanguard’s proxy votingguidelines by visiting vanguard.com/proxyreporting or bycalling Vanguard at 800-662-2739. The guidelines arealso available from the SEC’s website, sec.gov. Inaddition, you may obtain a free report on how your fundvoted the proxies for securities it owned during the 12months ended June 30. To get the report, visit eithervanguard.com/proxyreporting or sec.gov.
You can review and copy information about your fund atthe SEC’s Public Reference Room in Washington, D.C. Tofind out more about this public service, call the SEC at202-551-8090. Information about your fund is alsoavailable on the SEC’s website, and you can receivecopies of this information, for a fee, by sending arequest in either of two ways: via email addressed [email protected] or via regular mail addressed to thePublic Reference Section, Securities and ExchangeCommission, Washington, DC 20549-1520.
© 2017 The Vanguard Group, Inc.All rights reserved.Vanguard Marketing Corporation, Distributor.
Q300 102017