Vanguard Equity Income Fund
40
Annual Report | September 30, 2021 Vanguard Equity Income Fund
Transcript of Vanguard Equity Income Fund

Annual Report | September 30, 2021
Vanguard Equity Income Fund

Contents
Your Fund’s Performance at a Glance . . . . . . . . . . . . . . . . 1
Advisors’ Report . . . . . . . . . . . . . . . . . . . . . . . . . . . . . . . . . . . . . 2
About Your Fund’s Expenses. . . . . . . . . . . . . . . . . . . . . . . . . 6
Performance Summary . . . . . . . . . . . . . . . . . . . . . . . . . . . . . . 8
Financial Statements . . . . . . . . . . . . . . . . . . . . . . . . . . . . . . . .10
Please note: The opinions expressed in this report are just that—informed opinions. They should not be considered promisesor advice. Also, please keep in mind that the information and opinions cover the period through the date on the front of thisreport. Of course, the risks of investing in your fund are spelled out in the prospectus.

• For the 12 months ended September 30, Vanguard Equity Income Fund returned30.66% for Investor Shares and 30.77% for Admiral Shares. The fund underperformedits benchmark, which returned 31.58%.
• The global economy rebounded faster than many had expected after thepandemic-induced contraction in the spring of 2020. Swift and extensive fiscal andmonetary support from policymakers has been one of the keys to the rebound. Stockreturns were excellent for the 12-month period, reflecting the recovery following thesharp downturn at the start of the pandemic.
• The fund’s two advisors focus on investing in large-capitalization value companieswith higher yields, and they emphasize dividends. That focus helped the fund’sperformance during the period, as value stocks generally outperformed their growthcounterparts.
• By sector, industrials and information technology contributed most to relativereturns. Energy and financials were the biggest detractors.
Market Barometer
Average Annual Total ReturnsPeriods Ended September 30, 2021
One Year Three Years Five Years
Stocks
Russell 1000 Index (Large-caps) 30.96% 16.43% 17.11%
Russell 2000 Index (Small-caps) 47.68 10.54 13.45
Russell 3000 Index (Broad U.S. market) 31.88 16.00 16.85
FTSE All-World ex US Index (International) 24.73 8.49 9.28
Bonds
Bloomberg U.S. Aggregate Bond Index(Broad taxable market) -0.90% 5.36% 2.94%
Bloomberg Municipal Bond Index(Broad tax-exempt market) 2.63 5.06 3.26
FTSE Three-Month U.S. Treasury Bill Index 0.06 1.14 1.13
CPI
Consumer Price Index 5.39% 2.81% 2.59%
Your Fund’s Performance at a Glance
1

For the fiscal year ended September 30,2021, Vanguard Equity Income Fundreturned 30.66% for Investor Shares and30.77% for Admiral Shares,underperforming its benchmark, whichreturned 31.58%. Your fund is managed byWellington Management Company LLP
and Vanguard Quantitative Equity Group.The use of two investment advisorsprovides exposure to distinct yetcomplementary investment approaches,enhancing the diversification of your fund.It is not uncommon for different advisorsto have different views about individualsecurities or the broader investmentenvironment.
The table on page 5 presents thepercentage and amount of the fund’sassets that each advisor manages, as wellas brief descriptions of their investmentstrategies. The advisors have alsoprepared a discussion of the investmentenvironment that existed during the fiscalyear and of how their portfolio positioningreflects this assessment. Thesecomments were prepared on October 14,2021.
Wellington Management Company LLP
Portfolio Manager:
W. Michael Reckmeyer, III, CFA,Senior Managing Directorand Equity Portfolio Manager
In the first half of 2021, U.S. equitiesgained amid a backdrop of improvingvaccination rates, accelerating economicgrowth, and a broader reopening of theeconomy. Inflation rose sharply, as robustdemand for goods and services, along
with significant global supply-chaindisruptions, drove consumer and producerprices sharply higher.
The Federal Reserve was steadfast in itsview that elevated price pressures shouldprove transitory, but the Fed rattledmarkets by considerably raising itsinflation forecast for 2021 and signalingthe potential for two interest rate hikes in2023. This hawkish shift in expectationstriggered a rotation from value andcyclically sensitive stocks to growthstocks toward the end of the secondquarter.
U.S. equities continued to climb in thethird quarter against a backdrop ofaccommodative monetary policy, robustcorporate earnings, and strong demandfor goods and services. Risk sentimentwas pressured by anxiety about risinginflation, imminent policy normalization,moderating economic growth, anduncertainty about fiscal stimulus and thefederal debt ceiling.
Growth stocks outperformed their valuecounterparts for the third quarter;however, surging Treasury yields sparkeda sharp sell-off in shares of largetechnology companies at the end ofSeptember, triggering a powerful rotationinto value stocks. The spread of theCOVID-19 Delta variant weighed onconsumer confidence and dampenedreopening momentum.
The Fed trimmed its 2021 GDP growthforecast to 5.9%, from 7%, and delivereda clearer signal that it will begin to taperasset purchases later this year should
Advisors’ Report
2

economic conditions hold up. There wasalso a marked shift in its projections forfuture interest rate hikes, with moremembers of the Fed anticipating thatrates will begin to rise in 2022 amidforecasts for stronger inflation andemployment.
Our overweight to real estate andunderweight to communication servicescontributed to performance, while anunderweight to energy and overweight tohealth care detracted. Security selectionwas beneficial to relative results inindustrials, health care, and informationtechnology. Selection in real estate,financials, and energy held back results.
The largest contributors to relativeperformance were our out-of-benchmarkposition in Blackstone, a U.S.-basedmultinational financial services firmspecializing in alternative investments; notholding Amgen, a developer andmanufacturer of therapeutics worldwide;and our overweight to Morgan Stanley, adiversified financial services company.
The largest relative detractors were notholding benchmark constituents ExxonMobil, a U.S.-based globally integrated oiland gas company, and Wells Fargo, adiversified financial services company, aswell as our overweight position inMondelez, a U.S.-based global snack foodand beverage company.
Notable new purchases during the periodincluded Pioneer Natural Resources,Kimberly-Clark, and Becton Dickinson.Pioneer is an exploration and productioncompany with primary exposure to the
Permian basin in Texas. We reallocated ourChevron position to Pioneer because ithad a better risk/reward profile.Kimberly-Clark is a personal care companyprimarily focused on paper-basedconsumer products. The company has astrong balance sheet, a well-supporteddividend, and a new management teammaking positive strategic investments tobenefit long-term growth. BectonDickinson is a quality medical devicecompany; it is trading at a significantdiscount and provides an opportunity todeliver a durable growth profile through itsinvestments in innovation in recent years.
Notable eliminations from our portfolioincluded holdings in Deere, Blackstone,and ADP. We decided to eliminate thesepositions because of strong stock priceappreciation and the opportunity to usethe proceeds for better risk-adjustedopportunities elsewhere.
As always, we remain focused on findinginvestment opportunities in qualitydividend-paying companies with attractivetotal-return potential at discountedvaluations.
Vanguard Quantitative Equity Group
Portfolio Managers:
Sharon Hill
Binbin Guo, Principal, Head of AlphaEquity Investments
The world economy’s recovery from the2020 pandemic-induced contraction wasquicker many had expected. Countriesthat have been better at containing the
3

virus have generally been more successfuleconomically. Quick, far-reaching supportfrom policymakers has also been vital tothe rebound. Because the 12 monthsunder review reflect the recovery instocks following the sharp downturn atthe start of the pandemic, results wereexcellent. The Russell 3000 Index, thebenchmark for the entire U.S. stockmarket, returned 31.88% for the period.
Although it’s important to understand howoverall performance is affected by suchmacro factors, our approach to investingfocuses on specific fundamentals. Webelieve that attractive stocks exhibitseveral key characteristics: high quality, orhealthy balance sheets and steadycash-flow generation; effectivemanagement decisions, or soundinvestment policies that favor internal overexternal funding; consistent earningsgrowth, or the ability to grow earningsyear after year; strong market sentiment,or market confirmation of our view; andreasonable valuation, or shares that arenot overpriced. During the period, weadded a sixth criterion, a defensive modelthat evaluates heavily shorted stocks, asthis can signal concerns about futurecompany prospects.
Using these six themes, we generate adaily composite stock ranking. We then
monitor our portfolio based on thoserankings and adjust when appropriate tomaximize expected returns whileminimizing exposure to risks that ourresearch indicates don’t improve returns(such as industry selection and other risksrelative to our benchmark).
Over the 12 months ended September 30,2021, our valuation model contributed themost to our relative performance. Ourstrongest sector results were in materials,utilities, and financials. Stock selection inconsumer staples detracted the most, inlarge part because of our selection in foodand household products companies.Other detractors included industrials andenergy.
At the stock level, top contributorsincluded overweight positions in financialcompanies Fifth Third Bancorp, RegionsFinancial, and MetLife; an underweight toa health care company, Amgen; and anoverweight to an energy company, DevonEnergy. Underweight positions inConocoPhillips and Exxon Mobil in energydetracted, as did overweights toLockheed Martin in industrials, CampbellSoup in consumer staples, and Merck inhealth care.
We thank you for your investment andlook forward to the coming fiscal year.
4

Vanguard Equity Income Fund Investment Advisors
Fund Assets Managed
Investment Advisor % $ Million Investment Strategy
Wellington ManagementCompany LLP
64 31,153 A fundamental approach to seeking desirablestocks. Our selections typically offer above-averagedividend yields, below-average valuations, and thepotential for dividend increases in the future.
Vanguard Quantitative EquityGroup
34 16,678 Employs a quantitative fundamental managementapproach, using models that assess valuation,growth prospects, management decisions, marketsentiment, and earnings and balance-sheet qualityof companies as compared with their peers.
Cash Investments 2 876 These short-term reserves are invested byVanguard in equity index products to simulateinvestment in stocks. Each advisor may alsomaintain a modest cash position.
5
As a shareholder of the fund, you incur ongoing costs, which include costs for portfoliomanagement, administrative services, and shareholder reports (like this one), among others.Operating expenses, which are deducted from a fund’s gross income, directly reduce theinvestment return of the fund.
A fund’s expenses are expressed as a percentage of its average net assets. This figure is knownas the expense ratio. The following examples are intended to help you understand the ongoingcosts (in dollars) of investing in your fund and to compare these costs with those of other mutualfunds. The examples are based on an investment of $1,000 made at the beginning of the periodshown and held for the entire period.
The accompanying table illustrates your fund’s costs in two ways:
• Based on actual fund return. This section helps you to estimate the actual expenses that youpaid over the period. The ”Ending Account Value“ shown is derived from the fund‘s actual return,and the third column shows the dollar amount that would have been paid by an investor whostarted with $1,000 in the fund. You may use the information here, together with the amount youinvested, to estimate the expenses that you paid over the period.
To do so, simply divide your account value by $1,000 (for example, an $8,600 account valuedivided by $1,000 = 8.6), then multiply the result by the number given for your fund under theheading ”Expenses Paid During Period.“
• Based on hypothetical 5% yearly return. This section is intended to help you compare yourfund‘s costs with those of other mutual funds. It assumes that the fund had a yearly return of 5%before expenses, but that the expense ratio is unchanged. In this case—because the return usedis not the fund’s actual return—the results do not apply to your investment. The example is usefulin making comparisons because the Securities and Exchange Commission requires all mutualfunds to calculate expenses based on a 5% return. You can assess your fund’s costs by comparingthis hypothetical example with the hypothetical examples that appear in shareholder reports ofother funds.
Note that the expenses shown in the table are meant to highlight and help you compare ongoingcosts only and do not reflect transaction costs incurred by the fund for buying and sellingsecurities. Further, the expenses do not include any purchase, redemption, or account service feesdescribed in the fund prospectus. If such fees were applied to your account, your costs would behigher. Your fund does not carry a “sales load.”
The calculations assume no shares were bought or sold during the period. Your actual costs mayhave been higher or lower, depending on the amount of your investment and the timing of anypurchases or redemptions.
You can find more information about the fund’s expenses, including annual expense ratios, in theFinancial Statements section of this report. For additional information on operating expenses andother shareholder costs, please refer to your fund’s current prospectus.
About Your Fund’s Expenses
6

Six Months Ended September 30, 2021Beginning
Account Value3/31/2021
EndingAccount Value
9/30/2021
ExpensesPaid During
Period
Based on Actual Fund Return
Equity Income Fund
Investor Shares $1,000.00 $1,049.60 $ 1.44
Admiral™ Shares 1,000.00 1,050.10 0.98
Based on Hypothetical 5% Yearly Return
Equity Income Fund
Investor Shares $1,000.00 $1,023.67 $ 1.42
Admiral Shares 1,000.00 1,024.12 0.96
The calculations are based on expenses incurred in the most recent six-month period. The fund’s annualized six-month expense ratios forthat period are 0.28% for Investor Shares and 0.19% for Admiral Shares. The dollar amounts shown as “Expenses Paid” are equal to theannualized expense ratio multiplied by the average account value over the period, multiplied by the number of days in the most recentsix-month period, then divided by the number of days in the most recent 12-month period (183/365).
7

All of the returns in this report represent past performance, which is not a guarantee of
future results that may be achieved by the fund. (Current performance may be lower or
higher than the performance data cited. For performance data current to the most recent
month-end, visit our website at vanguard.com/performance.) Note, too, that both
investment returns and principal value can fluctuate widely, so an investor’s shares, when
sold, could be worth more or less than their original cost. The returns shown do not reflecttaxes that a shareholder would pay on fund distributions or on the sale of fund shares.
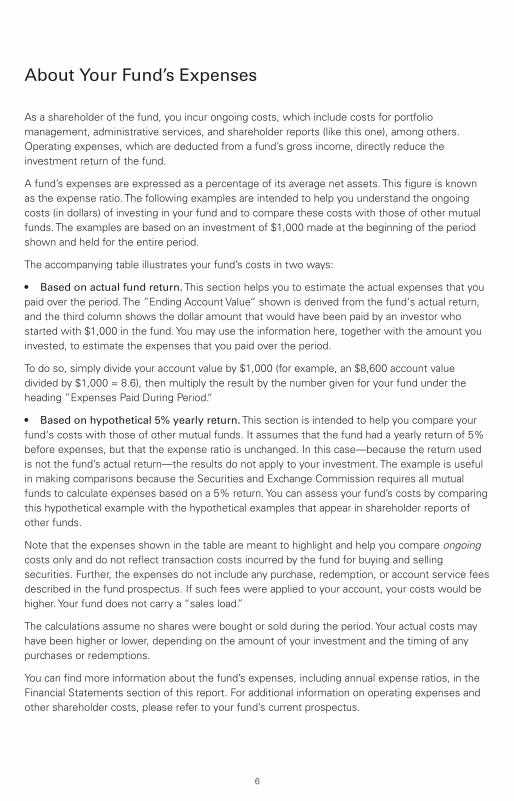
Cumulative Performance: September 30, 2011, Through September 30, 2021
Initial Investment of $10,000$48,000
7,000
35,930
2021202020192018201720162015201420132012
Average Annual Total ReturnsPeriods Ended September 30, 2021
OneYear
FiveYears
TenYears
Final Valueof a $10,000Investment
Equity Income Fund Investor Shares 30.66% 11.75% 13.64% $35,930 FTSE High Dividend Yield Index 31.58 10.97 13.42 35,218
Dow Jones U.S. Total Stock Market FloatAdjusted Index 32.13 16.82 16.56 46,280
OneYear
FiveYears
TenYears
Final Valueof a $50,000
Investment
Equity Income Fund Admiral Shares 30.77% 11.85% 13.74% $181,255
FTSE High Dividend Yield Index 31.58 10.97 13.42 176,088
Dow Jones U.S. Total Stock Market Float AdjustedIndex 32.13 16.82 16.56 231,402
Equity Income Fund
Performance Summary
See Financial Highlights for dividend and capital gains information.
8

Communication Services 4.9%
Consumer Discretionary 5.4
Consumer Staples 14.4
Energy 6.2
Financials 21.7
Health Care 16.5
Industrials 10.1
Information Technology 8.8
Materials 4.4
Real Estate 0.6
Utilities 7.0
The table reflects the fund’s investments, except for short-terminvestments and derivatives. Sector categories are based on theGlobal Industry Classification Standard (“GICS”), except for the“Other” category (if applicable), which includes securities thathave not been provided a GICS classification as of the effectivereporting period.
Global Industry Classification Standard (“GICS”) was developed by and is the exclusive property and a service mark ofMSCI Inc. (“MSCI”) and Standard and Poor’s, a division of McGraw-Hill Companies, Inc. (“S&P”), and is licensed for useby Vanguard. Neither MSCI, S&P nor any third party involved in making or compiling the GICS or any GICS classificationmakes any express or implied warranties or representations with respect to such standard or classification (or the resultsto be obtained by the use thereof), and all such parties hereby expressly disclaim all warranties of originality, accuracy,completeness, merchantability or fitness for a particular purpose with respect to any such standard or classification.Without limiting any of the foregoing, in no event shall MSCI, S&P, any of its affiliates or any third party involved inmaking or compiling the GICS or any GICS classification have any liability for any direct, indirect, special, punitive,consequential or any other damages (including lost profits) even if notified of the possibility of such damages.
Equity Income Fund
Fund AllocationAs of September 30, 2021
9

The fund files its complete schedule of portfolio holdings with the Securities and ExchangeCommission (SEC) for the first and third quarters of each fiscal year as an exhibit to its reports onForm N-PORT. The fund’s Form N-PORT reports are available on the SEC’s website atwww.sec.gov.
Shares
MarketValue•
($000)
Common Stocks (97.7%)
Communication Services (4.8%) Comcast Corp. Class A 20,223,813 1,131,118 Verizon Communications
Inc. 13,888,929 750,141 AT&T Inc. 7,088,317 191,456 Omnicom Group Inc. 1,299,200 94,140 Interpublic Group of Cos.
Inc. 2,144,237 78,629 Lumen Technologies Inc. 5,656,593 70,085
2,315,569Consumer Discretionary (5.2%) Home Depot Inc. 2,404,704 789,368 Lowe's Cos. Inc. 2,652,137 538,012 McDonald's Corp. 2,221,479 535,621 TJX Cos. Inc. 3,001,075 198,011 Target Corp. 580,615 132,827 Best Buy Co. Inc. 939,399 99,304 H&R Block Inc. 3,930,040 98,251 Polaris Inc. 448,170 53,628 Whirlpool Corp. 196,586 40,076 Foot Locker Inc. 662,739 30,261 Big Lots Inc. 466,591 20,231 Newell Brands Inc. 609,021 13,484 Williams-Sonoma Inc. 53,664 9,516
2,558,590Consumer Staples (14.0%) Procter & Gamble Co. 9,590,841 1,340,800 Philip Morris
International Inc. 8,925,538 846,052 Mondelez International
Inc. Class A 11,702,563 680,855 PepsiCo Inc. 4,161,129 625,875 Coca-Cola Co. 9,871,039 517,933 Kimberly-Clark Corp. 3,347,689 443,368 Archer-Daniels-Midland
Co. 7,117,531 427,123 Walmart Inc. 2,457,059 342,465 Unilever plc ADR 6,088,003 330,092 Nestle SA ADR 2,103,351 252,844 Kellogg Co. 3,629,693 232,010 Altria Group Inc. 4,131,730 188,076 Tyson Foods Inc. Class A 1,513,850 119,503 Colgate-Palmolive Co. 1,450,138 109,601 General Mills Inc. 1,463,244 87,531 Hershey Co. 383,119 64,843 Walgreens Boots
Alliance Inc. 1,236,913 58,197
Shares
MarketValue•
($000)
Conagra Brands Inc. 1,352,646 45,814 Campbell Soup Co. 829,981 34,702 Coca-Cola Europacific
Partners plc 590,332 32,640 Nu Skin Enterprises Inc.
Class A 519,115 21,009 Medifast Inc. 62,626 12,064 Bunge Ltd. 109,854 8,933 Kraft Heinz Co. 238,383 8,777
6,831,107Energy (6.0%) Pioneer Natural
Resources Co. 4,150,536 691,106 ConocoPhillips 9,407,823 637,5681 TC Energy Corp. 7,103,993 341,907 Chevron Corp. 2,510,089 254,648 Exxon Mobil Corp. 3,888,706 228,734 Phillips 66 1,890,095 132,363 Kinder Morgan Inc. 7,474,048 125,041 Schlumberger NV 3,907,137 115,807 Halliburton Co. 3,546,212 76,669 EOG Resources Inc. 869,850 69,823 Targa Resources Corp. 1,361,484 66,999 Williams Cos. Inc. 2,508,637 65,074 Devon Energy Corp. 1,328,561 47,177 Cimarex Energy Co. 482,235 42,051 APA Corp. 972,830 20,848 Marathon Petroleum
Corp. 159,219 9,841 DTE Midstream LLC 115,152 5,325
2,930,981Financials (21.2%) JPMorgan Chase & Co. 11,857,151 1,940,897 Bank of America Corp. 34,445,147 1,462,196 Morgan Stanley 9,865,263 959,989 MetLife Inc. 13,726,547 847,340 Chubb Ltd. 3,979,332 690,334 BlackRock Inc. 697,901 585,302 Truist Financial Corp. 8,795,539 515,858 PNC Financial Services
Group Inc. 2,266,051 443,330 Progressive Corp. 4,763,404 430,564 Citigroup Inc. 3,860,918 270,959 M&T Bank Corp. 1,784,900 266,557 Wells Fargo & Co. 5,561,166 258,094 Fifth Third Bancorp 3,106,203 131,827 Aflac Inc. 2,453,381 127,895 Synchrony Financial 2,471,192 120,792 Regions Financial Corp. 5,541,208 118,083
Equity Income Fund
Financial Statements
Schedule of InvestmentsAs of September 30, 2021
10

Shares
MarketValue•
($000)
Ally Financial Inc. 2,152,214 109,870 Citizens Financial Group
Inc. 2,307,063 108,386 Jefferies Financial Group
Inc. 2,667,608 99,048 First American Financial
Corp. 1,264,096 84,758 KeyCorp. 3,455,589 74,710 Unum Group 2,966,880 74,350 First Horizon Corp. 4,262,410 69,435 Discover Financial
Services 539,832 66,318 U.S. Bancorp 1,031,245 61,297 Hartford Financial
Services Group Inc. 858,543 60,313 Prudential Financial Inc. 510,824 53,739 PacWest Bancorp 1,102,050 49,945 OneMain Holdings Inc. 806,610 44,630 Fidelity National
Financial Inc. 819,925 37,175 T Rowe Price Group Inc. 172,018 33,836 Bank of New York Mellon
Corp. 585,141 30,334 Virtu Financial Inc.
Class A 1,187,376 29,007 New York Community
Bancorp Inc. 1,772,003 22,806 Equitable Holdings Inc. 666,802 19,764 Comerica Inc. 236,102 19,006 Invesco Ltd. 729,770 17,595 CME Group Inc. 40,339 7,801
10,344,140Health Care (16.2%) Johnson & Johnson 10,873,070 1,756,001 Pfizer Inc. 21,524,238 925,757 Eli Lilly & Co. 3,963,297 915,720 Merck & Co. Inc. 11,341,208 851,838 UnitedHealth Group Inc. 1,249,674 488,298 Becton Dickinson and
Co. 1,621,176 398,517 AstraZeneca plc ADR 6,517,351 391,432 Baxter International Inc. 3,848,828 309,561 Anthem Inc. 812,172 302,778 Medtronic plc 2,353,776 295,046 Roche Holding AG 650,656 237,470 Bristol-Myers Squibb Co. 3,378,937 199,932 Gilead Sciences Inc. 2,834,090 197,961 Novartis AG (Registered) 2,321,646 190,373 AbbVie Inc. 1,424,413 153,651 Cardinal Health Inc. 1,817,102 89,874 CVS Health Corp. 964,858 81,878 Amgen Inc. 353,129 75,093 Organon & Co. 241,813 7,929
7,869,109Industrials (9.9%) Lockheed Martin Corp. 1,849,168 638,148 Johnson Controls
International plc 7,974,077 542,875 Eaton Corp. plc 3,543,648 529,102 Raytheon Technologies
Corp. 5,985,063 514,476 General Dynamics Corp. 2,501,457 490,361 Caterpillar Inc. 2,289,356 439,488 L3Harris Technologies
Inc. 1,384,500 304,922 Union Pacific Corp. 1,265,203 247,992
Shares
MarketValue•
($000)
Honeywell InternationalInc. 893,115 189,591
United Parcel ServiceInc. Class B 1,026,695 186,961
Illinois Tool Works Inc. 783,711 161,938 3M Co. 828,919 145,409 Cummins Inc. 553,218 124,231 Nielsen Holdings plc 4,014,850 77,045 Watsco Inc. 199,094 52,684 nVent Electric plc 1,109,614 35,874 Triton International Ltd. 571,760 29,754 PACCAR Inc. 345,986 27,305 Fastenal Co. 523,617 27,024 ABM Industries Inc. 372,093 16,748 ManpowerGroup Inc. 123,654 13,389 Timken Co. 175,203 11,462 Snap-on Inc. 38,321 8,007
4,814,786Information Technology (8.6%) Cisco Systems Inc. 22,763,435 1,239,014 Analog Devices Inc. 2,823,277 472,842 TE Connectivity Ltd. 3,313,010 454,611 Corning Inc. 10,328,805 376,898 Texas Instruments Inc. 1,487,637 285,939 Intel Corp. 5,155,528 274,686 International Business
Machines Corp. 1,759,976 244,513 QUALCOMM Inc. 1,726,149 222,639 Broadcom Inc. 294,038 142,588 HP Inc. 4,666,633 127,679 Seagate Technology
Holdings plc 1,235,856 101,983 Fidelity National
Information ServicesInc. 765,800 93,183
KLA Corp. 198,227 66,309 Western Union Co. 2,273,326 45,967 Automatic Data
Processing Inc. 213,116 42,606
4,191,457Materials (4.3%) Celanese Corp. Class A 3,138,410 472,770 PPG Industries Inc. 3,055,643 436,988 LyondellBasell Industries
NV Class A 3,518,625 330,2231 Rio Tinto plc ADR 2,070,596 138,357 Dow Inc. 2,027,134 116,682 Nucor Corp. 1,137,359 112,019 International Paper Co. 1,960,103 109,609 Linde plc 361,487 106,053 Reliance Steel &
Aluminum Co. 602,880 85,862 Steel Dynamics Inc. 1,036,602 60,620 CF Industries Holdings
Inc. 1,004,156 56,052 Packaging Corp. of
America 178,568 24,542 Huntsman Corp. 675,178 19,979 Westrock Co. 359,746 17,926 Greif Inc. Class A 199,602 12,894
2,100,576Real Estate (0.6%) Crown Castle
International Corp. 1,658,041 287,372
Equity Income Fund
11

Shares
MarketValue•
($000)
Utilities (6.9%) Dominion Energy Inc. 6,651,271 485,676 Sempra Energy 3,658,896 462,850 Duke Energy Corp. 4,315,509 421,151 Exelon Corp. 7,675,068 371,013 American Electric Power
Co. Inc. 4,475,599 363,329 DTE Energy Co. 1,985,929 221,848 Entergy Corp. 2,068,827 205,455 Southern Co. 2,099,815 130,126 UGI Corp. 2,370,089 101,013 NextEra Energy Inc. 1,277,489 100,308 AES Corp. 4,350,935 99,332 Evergy Inc. 1,563,737 97,264 PPL Corp. 2,778,690 77,470 WEC Energy Group Inc. 474,031 41,810 FirstEnergy Corp. 1,166,347 41,545 Public Service Enterprise
Group Inc. 565,899 34,463 IDACORP Inc. 333,022 34,428 CMS Energy Corp. 473,173 28,263 NRG Energy Inc. 567,416 23,168 CenterPoint Energy Inc. 456,156 11,221
3,351,733
Total Common Stocks(Cost $34,619,464) 47,595,420
Temporary Cash Investments (3.1%)
Money Market Fund (2.4%)2,3 Vanguard Market
Liquidity Fund,0.068% 11,871,417 1,187,142
FaceAmount
($000)
Repurchase Agreements (0.7%) Goldman Sachs & Co.
0.050%, 10/1/21(Dated 9/30/2021,Repurchase Value$113,900,000,collateralized byFederal Farm CreditBank 3.500%,12/20/23, FederalHome Loan MortgageCorp.2.000%–6.500%,4/1/23–9/1/51, FederalNational MortgageAssn.1.500%–7.500%,4/1/24–11/1/59,Government NationalMortgage Assn.2.500%–5.500%,1/20/24–9/15/56, andU.S. TreasuryNote/Bond 1.875%,6/30/26, with a valueof $116,178,000) 113,900 113,900
FaceAmount
($000)
MarketValue•
($000)
Nomura International plc0.050%, 10/1/21(Dated 9/30/2021,Repurchase Value$101,000,000,collateralized byFederal Home LoanMortgage Corp.0.000%,9/15/29–3/15/31, andU.S.TreasuryNote/Bond1.375%–2.000%,12/31/21–6/30/23,with a value of$103,020,000) 101,000 101,000
RBS Securities Inc.0.050%, 10/1/21(Dated 9/30/2021,Repurchase Value$97,300,000,collateralized byU.S. TreasuryNote/Bond0.750%–8.000%,11/15/21–2/15/50, witha value of$99,246,000) 97,300 97,300
312,200
Total Temporary Cash Investments(Cost $1,499,158) 1,499,342
Total Investments (100.8%)(Cost $36,118,622) 49,094,762
Other Assets andLiabilities—Net (-0.8%) (387,891)
Net Assets (100%) 48,706,871
Cost is in $000. • See Note A in Notes to Financial Statements.1 Includes partial security positions on loan to broker-dealers. The
total value of securities on loan is $335,180,000.2 Affiliated money market fund available only to Vanguard funds
and certain trusts and accounts managed by Vanguard. Rateshown is the 7-day yield.
3 Collateral of $353,226,000 was received for securities on loan,of which $335,593,000 is held in Vanguard Market LiquidityFund and $17,633,000 is held in cash.ADR—American Depositary Receipt.
Equity Income Fund
12

Derivative Financial Instruments Outstanding as of Period End
Futures Contracts
($000)
Expiration
Number ofLong (Short)
ContractsNotionalAmount
Value andUnrealized
Appreciation(Depreciation)
Long Futures Contracts
E-mini S&P 500 Index December 2021 4,261 915,636 (31,833)
See accompanying Notes, which are an integral part of the Financial Statements.
Equity Income Fund
13

($000s, except shares and per-share amounts) Amount
Assets
Investments in Securities, at Value
Unaffiliated Issuers (Cost $34,931,664) 47,907,620
Affiliated Issuers (Cost $1,186,958) 1,187,142
Total Investments in Securities 49,094,762
Investment in Vanguard 1,664
Cash 43,121
Cash Collateral Pledged—Futures Contracts 48,879
Receivables for Accrued Income 82,007
Receivables for Capital Shares Issued 41,201
Total Assets 49,311,634
Liabilities
Foreign Currency Due to Custodian, at Value (Proceeds $945) 938
Payables for Investment Securities Purchased 194,364
Collateral for Securities on Loan 353,226
Payables to Investment Advisor 10,755
Payables for Capital Shares Redeemed 32,193
Payables to Vanguard 2,228
Variation Margin Payable—Futures Contracts 11,059
Total Liabilities 604,763
Net Assets 48,706,871
At September 30, 2021, net assets consisted of:
Paid-in Capital 33,295,199
Total Distributable Earnings (Loss) 15,411,672
Net Assets 48,706,871
Investor Shares—Net Assets
Applicable to 123,058,523 outstanding $.001 par value shares ofbeneficial interest (unlimited authorization) 5,285,352
Net Asset Value Per Share—Investor Shares $42.95
Admiral Shares—Net Assets
Applicable to 482,424,321 outstanding $.001 par value shares ofbeneficial interest (unlimited authorization) 43,421,519
Net Asset Value Per Share—Admiral Shares $90.01
See accompanying Notes, which are an integral part of the Financial Statements.
Equity Income Fund
Statement of Assets and LiabilitiesAs of September 30, 2021
14

Year EndedSeptember 30, 2021
($000)
Investment Income
Income
Dividends1 1,255,573
Interest2 739
Securities Lending—Net 283
Total Income 1,256,595
Expenses
Investment Advisory Fees—Note B
Basic Fee 35,877
Performance Adjustment 5,313
The Vanguard Group—Note C
Management and Administrative—Investor Shares 9,255
Management and Administrative—Admiral Shares 34,448
Marketing and Distribution—Investor Shares 369
Marketing and Distribution—Admiral Shares 1,638
Custodian Fees 232
Auditing Fees 31
Shareholders’ Reports—Investor Shares 89
Shareholders’ Reports—Admiral Shares 405
Trustees’ Fees and Expenses 32
Total Expenses 87,689
Net Investment Income 1,168,906
Realized Net Gain (Loss)
Investment Securities Sold2 2,470,068
Futures Contracts 245,526
Foreign Currencies 61
Realized Net Gain (Loss) 2,715,655
Change in Unrealized Appreciation (Depreciation)
Investment Securities2 7,139,424
Futures Contracts (35,292)
Foreign Currencies (335)
Change in Unrealized Appreciation (Depreciation) 7,103,797
Net Increase (Decrease) in Net Assets Resulting from Operations 10,988,358
1 Dividends are net of foreign withholding taxes of $10,384,000.2 Interest income, realized net gain (loss), and change in unrealized appreciation (depreciation) from an affiliated company of the fund
were $616,000, $45,000, and ($46,000), respectively. Purchases and sales are for temporary cash investment purposes.
See accompanying Notes, which are an integral part of the Financial Statements.
Equity Income Fund
Statement of Operations
15

Year Ended September 30,
2021($000)
2020($000)
Increase (Decrease) in Net Assets
Operations
Net Investment Income 1,168,906 1,056,659
Realized Net Gain (Loss) 2,715,655 9,842
Change in Unrealized Appreciation (Depreciation) 7,103,797 (2,277,728)
Net Increase (Decrease) in Net Assets Resulting from Operations 10,988,358 (1,211,227)
Distributions
Investor Shares (138,888) (244,854)
Admiral Shares (1,066,361) (1,510,435)
Total Distributions (1,205,249) (1,755,289)
Capital Share Transactions
Investor Shares (398,046) (565,450)
Admiral Shares 4,023,566 2,380,683
Net Increase (Decrease) from Capital Share Transactions 3,625,520 1,815,233
Total Increase (Decrease) 13,408,629 (1,151,283)
Net Assets
Beginning of Period 35,298,242 36,449,525
End of Period 48,706,871 35,298,242
See accompanying Notes, which are an integral part of the Financial Statements.
Equity Income Fund
Statement of Changes in Net Assets
16
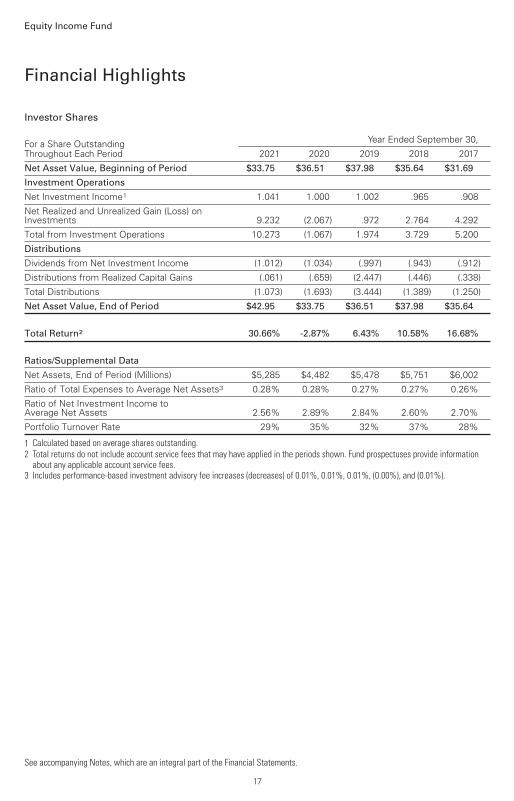
Investor Shares
For a Share OutstandingThroughout Each Period
Year Ended September 30,
2021 2020 2019 2018 2017
Net Asset Value, Beginning of Period $33.75 $36.51 $37.98 $35.64 $31.69
Investment Operations
Net Investment Income1 1.041 1.000 1.002 .965 .908
Net Realized and Unrealized Gain (Loss) onInvestments 9.232 (2.067) .972 2.764 4.292
Total from Investment Operations 10.273 (1.067) 1.974 3.729 5.200
Distributions
Dividends from Net Investment Income (1.012) (1.034) (.997) (.943) (.912)
Distributions from Realized Capital Gains (.061) (.659) (2.447) (.446) (.338)
Total Distributions (1.073) (1.693) (3.444) (1.389) (1.250)
Net Asset Value, End of Period $42.95 $33.75 $36.51 $37.98 $35.64
Total Return2 30.66% -2.87% 6.43% 10.58% 16.68%
Ratios/Supplemental Data
Net Assets, End of Period (Millions) $5,285 $4,482 $5,478 $5,751 $6,002
Ratio of Total Expenses to Average Net Assets3 0.28% 0.28% 0.27% 0.27% 0.26%
Ratio of Net Investment Income toAverage Net Assets 2.56% 2.89% 2.84% 2.60% 2.70%
Portfolio Turnover Rate 29% 35% 32% 37% 28%
1 Calculated based on average shares outstanding.2 Total returns do not include account service fees that may have applied in the periods shown. Fund prospectuses provide information
about any applicable account service fees.3 Includes performance-based investment advisory fee increases (decreases) of 0.01%, 0.01%, 0.01%, (0.00%), and (0.01%).
See accompanying Notes, which are an integral part of the Financial Statements.
Equity Income Fund
Financial Highlights
17

Admiral Shares
For a Share OutstandingThroughout Each Period
Year Ended September 30,
2021 2020 2019 2018 2017
Net Asset Value, Beginning of Period $70.73 $76.52 $79.61 $74.69 $66.43
Investment Operations
Net Investment Income1 2.262 2.159 2.167 2.099 1.968
Net Realized and Unrealized Gain (Loss) onInvestments 19.342 (4.331) 2.028 5.806 8.977
Total from Investment Operations 21.604 (2.172) 4.195 7.905 10.945
Distributions
Dividends from Net Investment Income (2.196) (2.236) (2.156) (2.048) (1.977)
Distributions from Realized Capital Gains (.128) (1.382) (5.129) (.937) (.708)
Total Distributions (2.324) (3.618) (7.285) (2.985) (2.685)
Net Asset Value, End of Period $90.01 $70.73 $76.52 $79.61 $74.69
Total Return2 30.77% -2.77% 6.51% 10.70% 16.75%
Ratios/Supplemental Data
Net Assets, End of Period (Millions) $43,422 $30,816 $30,972 $27,625 $23,373
Ratio of Total Expenses to Average Net Assets3 0.19% 0.19% 0.18% 0.18% 0.17%
Ratio of Net Investment Income toAverage Net Assets 2.64% 2.98% 2.93% 2.69% 2.79%
Portfolio Turnover Rate 29% 35% 32% 37% 28%
1 Calculated based on average shares outstanding.2 Total returns do not include account service fees that may have applied in the periods shown. Fund prospectuses provide information
about any applicable account service fees.3 Includes performance-based investment advisory fee increases (decreases) of 0.01%, 0.01%, 0.01%, (0.00%), and (0.01%).
See accompanying Notes, which are an integral part of the Financial Statements.
Equity Income Fund
Financial Highlights
18
Vanguard Equity Income Fund is registered under the Investment Company Act of 1940 as anopen-end investment company, or mutual fund. The fund offers two classes of shares: InvestorShares and Admiral Shares. Each of the share classes has different eligibility and minimumpurchase requirements, and is designed for different types of investors.
Market disruptions associated with the COVID-19 pandemic have had a global impact, anduncertainty exists as to the long-term implications. Such disruptions can adversely affect assets ofthe fund and thus fund performance.
A. The following significant accounting policies conform to generally accepted accountingprinciples for U.S. investment companies. The fund consistently follows such policies in preparingits financial statements.
1. Security Valuation: Securities are valued as of the close of trading on the New York StockExchange (generally 4 p.m., Eastern time) on the valuation date. Equity securities are valued at thelatest quoted sales prices or official closing prices taken from the primary market in which eachsecurity trades; such securities not traded on the valuation date are valued at the mean of thelatest quoted bid and asked prices. Securities for which market quotations are not readily available,or whose values have been affected by events occurring before the fund’s pricing time but afterthe close of the securities’ primary markets, are valued at their fair values calculated according toprocedures adopted by the board of trustees. These procedures include obtaining quotations froman independent pricing service, monitoring news to identify significant market- or security-specificevents, and evaluating changes in the values of foreign market proxies (for example, ADRs, futurescontracts, or exchange-traded funds), between the time the foreign markets close and the fund’spricing time. When fair-value pricing is employed, the prices of securities used by a fund tocalculate its net asset value may differ from quoted or published prices for the same securities.Investments in Vanguard Market Liquidity Fund are valued at that fund's net asset value.Temporary cash investments are valued using the latest bid prices or using valuations based on amatrix system (which considers such factors as security prices, yields, maturities, and ratings),both as furnished by independent pricing services.
2. Foreign Currency: Securities and other assets and liabilities denominated in foreign currenciesare translated into U.S. dollars using exchange rates obtained from an independent third party asof the fund’s pricing time on the valuation date. Realized gains (losses) and unrealized appreciation(depreciation) on investment securities include the effects of changes in exchange rates since thesecurities were purchased, combined with the effects of changes in security prices. Fluctuations inthe value of other assets and liabilities resulting from changes in exchange rates are recorded asunrealized foreign currency gains (losses) until the assets or liabilities are settled in cash, at whichtime they are recorded as realized foreign currency gains (losses).
3. Futures Contracts: The fund uses index futures contracts to a limited extent, with the objectiveof maintaining full exposure to the stock market while maintaining liquidity. The fund may purchaseor sell futures contracts to achieve a desired level of investment, whether to accommodateportfolio turnover or cash flows from capital share transactions. The primary risks associated withthe use of futures contracts are imperfect correlation between changes in market values of stocksheld by the fund and the prices of futures contracts, and the possibility of an illiquid market.Counterparty risk involving futures is mitigated because a regulated clearinghouse is thecounterparty instead of the clearing broker. To further mitigate counterparty risk, the fund tradesfutures contracts on an exchange, monitors the financial strength of its clearing brokers and
Equity Income Fund
Notes to Financial Statements
19

clearinghouse, and has entered into clearing agreements with its clearing brokers. Theclearinghouse imposes initial margin requirements to secure the fund’s performance and requiresdaily settlement of variation margin representing changes in the market value of each contract. Anysecurities pledged as initial margin for open contracts are noted in the Schedule of Investments.
Futures contracts are valued at their quoted daily settlement prices. The notional amounts of thecontracts are not recorded in the Statement of Assets and Liabilities. Fluctuations in the value ofthe contracts are recorded in the Statement of Assets and Liabilities as an asset (liability) and inthe Statement of Operations as unrealized appreciation (depreciation) until the contracts areclosed, when they are recorded as realized gains (losses) on futures contracts.
During the year ended September 30, 2021, the fund’s average investments in long and shortfutures contracts represented 2% and 0% of net assets, respectively, based on the average of thenotional amounts at each quarter-end during the period.
4. Repurchase Agreements: The fund enters into repurchase agreements with institutionalcounterparties. Securities pledged as collateral to the fund under repurchase agreements are heldby a custodian bank until the agreements mature, and in the absence of a default, such collateralcannot be repledged, resold, or rehypothecated. Each agreement requires that the market value ofthe collateral be sufficient to cover payments of interest and principal. The fund further mitigatesits counterparty risk by entering into repurchase agreements only with a diverse group ofprequalified counterparties, monitoring their financial strength, and entering into masterrepurchase agreements with its counterparties. The master repurchase agreements provide that,in the event of a counterparty's default (including bankruptcy), the fund may terminate anyrepurchase agreements with that counterparty, determine the net amount owed, and sell or retainthe collateral up to the net amount owed to the fund. Such action may be subject to legalproceedings, which may delay or limit the disposition of collateral.
5. Federal Income Taxes: The fund intends to continue to qualify as a regulated investmentcompany and distribute all of its taxable income. The fund’s tax returns are open to examination bythe relevant tax authorities until expiration of the applicable statute of limitations, which isgenerally three years after the filing of the tax return. Management has analyzed the fund’s taxpositions taken for all open federal and state income tax years, and has concluded that noprovision for income tax is required in the fund’s financial statements.
6. Distributions: Distributions to shareholders are recorded on the ex-dividend date. Distributionsare determined on a tax basis at the fiscal year-end and may differ from net investment incomeand realized capital gains for financial reporting purposes.
7. Securities Lending: To earn additional income, the fund lends its securities to qualifiedinstitutional borrowers. Security loans are subject to termination by the fund at any time, and arerequired to be secured at all times by collateral in an amount at least equal to the market value ofsecurities loaned. Daily market fluctuations could cause the value of loaned securities to be moreor less than the value of the collateral received. When this occurs, the collateral is adjusted andsettled before the opening of the market on the next business day. The fund further mitigates itscounterparty risk by entering into securities lending transactions only with a diverse group ofprequalified counterparties, monitoring their financial strength, and entering into master securitieslending agreements with its counterparties. The master securities lending agreements providethat, in the event of a counterparty’s default (including bankruptcy), the fund may terminate anyloans with that borrower, determine the net amount owed, and sell or retain the collateral up to
Equity Income Fund
20

the net amount owed to the fund; however, such actions may be subject to legal proceedings.While collateral mitigates counterparty risk, in the event of a default, the fund may experiencedelays and costs in recovering the securities loaned. The fund invests cash collateral received inVanguard Market Liquidity Fund, and records a liability in the Statement of Assets and Liabilitiesfor the return of the collateral, during the period the securities are on loan. Collateral investmentsin Vanguard Market Liquidity Fund are subject to market appreciation or depreciation. Securitieslending income represents fees charged to borrowers plus income earned on invested cashcollateral, less expenses associated with the loan. During the term of the loan, the fund is entitledto all distributions made on or in respect of the loaned securities.
8. Credit Facilities and Interfund Lending Program: The fund and certain other funds managed byThe Vanguard Group ("Vanguard") participate in a $4.3 billion committed credit facility provided by asyndicate of lenders pursuant to a credit agreement and an uncommitted credit facility provided byVanguard. Both facilities may be renewed annually. Each fund is individually liable for itsborrowings, if any, under the credit facilities. Borrowings may be utilized for temporary oremergency purposes, subject to the fund’s regulatory and contractual borrowing restrictions. Withrespect to the committed credit facility, the participating funds are charged administrative fees andan annual commitment fee of 0.10% of the undrawn committed amount of the facility; these feesare allocated to the funds based on a method approved by the fund’s board of trustees andincluded in Management and Administrative expenses on the fund’s Statement of Operations. Anyborrowings under either facility bear interest at a rate based upon the higher of the one-monthLondon Interbank Offered Rate (or an acceptable alternate rate, if necessary), federal fundseffective rate, or overnight bank funding rate plus an agreed-upon spread, except that borrowingsunder the uncommitted credit facility may bear interest based upon an alternate rate agreed to bythe fund and Vanguard.
In accordance with an exemptive order (the “Order”) from the SEC, the fund may participate in ajoint lending and borrowing program that allows registered open-end Vanguard funds to borrowmoney from and lend money to each other for temporary or emergency purposes (the “InterfundLending Program”), subject to compliance with the terms and conditions of the Order, and to theextent permitted by the fund’s investment objective and investment policies. Interfund loans andborrowings normally extend overnight, but can have a maximum duration of seven days. Loansmay be called on one business day’s notice. The interest rate to be charged is governed by theconditions of the Order and internal procedures adopted by the board of trustees. The board oftrustees is responsible for overseeing the Interfund Lending Program.
For the year ended September 30, 2021, the fund did not utilize the credit facilities or the InterfundLending Program.
9. Other: Dividend income is recorded on the ex-dividend date. Non-cash dividends included inincome, if any, are recorded at the fair value of the securities received. Interest income includesincome distributions received from Vanguard Market Liquidity Fund and is accrued daily. Premiumsand discounts on debt securities are amortized and accreted, respectively, to interest income overthe lives of the respective securities, except for premiums on certain callable debt securities thatare amortized to the earliest call date. Security transactions are accounted for on the datesecurities are bought or sold. Costs used to determine realized gains (losses) on the sale ofinvestment securities are those of the specific securities sold.
Taxes on foreign dividends and capital gains have been provided for in accordance with the fund'sunderstanding of the applicable countries' tax rules and rates. Deferred foreign capital gains tax, if
Equity Income Fund
21

any, is accrued daily based upon net unrealized gains. The fund has filed tax reclaims for previouslywithheld taxes on dividends earned in certain European Union countries. These filings are subjectto various administrative and judicial proceedings within these countries. Such tax reclaimsreceived during the year, if any, are included in dividend income. No other amounts for additionaltax reclaims are reflected in the financial statements due to the uncertainty as to the ultimateresolution of proceedings, the likelihood of receipt of these reclaims, and the potential timing ofpayment.
Each class of shares has equal rights as to assets and earnings, except that each class separatelybears certain class-specific expenses related to maintenance of shareholder accounts (included inManagement and Administrative expenses) and shareholder reporting. Marketing and distributionexpenses are allocated to each class of shares based on a method approved by the board oftrustees. Income, other non-class-specific expenses, and gains and losses on investments areallocated to each class of shares based on its relative net assets.
B. Wellington Management Company LLP provides investment advisory services to a portion ofthe fund for a fee calculated at an annual percentage rate of average net assets managed by theadvisor. The basic fee is subject to quarterly adjustments based on performance relative to theFTSE High Dividend Yield Index for the preceding three years.
Vanguard provides investment advisory services to a portion of the fund as described below; thefund paid Vanguard advisory fees of $1,445,000 for the year ended September 30, 2021.
For the year ended September 30, 2021, the aggregate investment advisory fee paid to alladvisors represented an effective annual basic rate of 0.08% of the fund’s average net assets,before a net increase of $5,313,000 (0.01%) based on performance.
C. In accordance with the terms of a Funds' Service Agreement (the “FSA”) between Vanguardand the fund, Vanguard furnishes to the fund investment advisory, corporate management,administrative, marketing, and distribution services at Vanguard’s cost of operations (as defined bythe FSA). These costs of operations are allocated to the fund based on methods and guidelinesapproved by the board of trustees and are generally settled twice a month.
Upon the request of Vanguard, the fund may invest up to 0.40% of its net assets as capital inVanguard. At September 30, 2021, the fund had contributed to Vanguard capital in the amount of$1,664,000, representing less than 0.01% of the fund’s net assets and 0.67% of Vanguard’scapital received pursuant to the FSA. The fund’s trustees and officers are also directors andemployees, respectively, of Vanguard.
D. Various inputs may be used to determine the value of the fund’s investments and derivatives.These inputs are summarized in three broad levels for financial statement purposes. The inputs ormethodologies used to value securities are not necessarily an indication of the risk associated withinvesting in those securities.
Level 1—Quoted prices in active markets for identical securities.Level 2—Other significant observable inputs (including quoted prices for similar securities, interestrates, prepayment speeds, credit risk, etc.).Level 3—Significant unobservable inputs (including the fund’s own assumptions used todetermine the fair value of investments). Any investments and derivatives valued with significantunobservable inputs are noted on the Schedule of Investments.
Equity Income Fund
22

The following table summarizes the market value of the fund’s investments and derivatives as ofSeptember 30, 2021, based on the inputs used to value them:
Level 1($000)
Level 2($000)
Level 3($000)
Total($000)
Investments
Assets
Common Stocks 47,167,577 427,843 — 47,595,420
Temporary Cash Investments 1,187,142 312,200 — 1,499,342
Total 48,354,719 740,043 — 49,094,762 Derivative Financial Instruments
Liabilities
Futures Contracts1 31,833 — — 31,833 1 Includes cumulative appreciation (depreciation) on futures contracts and centrally cleared swaps, if any, as reported in the Schedule of
Investments. Only current day’s variation margin is reported within the Statement of Assets and Liabilities.
E. Permanent differences between book-basis and tax-basis components of net assets arereclassified among capital accounts in the financial statements to reflect their tax character. Thesereclassifications have no effect on net assets or net asset value per share. As of period end,permanent differences primarily attributable to the accounting for foreign currency transactionsand distributions in connection with fund share redemptions were reclassified between thefollowing accounts:
Amount($000)
Paid-in Capital 156,945
Total Distributable Earnings (Loss) (156,945)
Temporary differences between book-basis and tax-basis components of total distributableearnings (loss) arise when certain items of income, gain, or loss are recognized in different periodsfor financial statement and tax purposes; these differences will reverse at some time in the future.The differences are primarily related to the deferral of losses from wash sales; and the recognitionof unrealized gains or losses from certain derivative contracts. As of period end, the tax-basiscomponents of total distributable earnings (loss) are detailed in the table as follows:
Amount($000)
Undistributed Ordinary Income 289,512
Undistributed Long-Term Gains 2,166,957
Capital Loss Carryforwards —
Qualified Late-Year Losses —
Net Unrealized Gains (Losses) 12,955,203
Equity Income Fund
23

The tax character of distributions paid was as follows: Year Ended September 30,
2021Amount
($000)
2020Amount
($000)
Ordinary Income* 1,141,227 1,097,069
Long-Term Capital Gains 64,022 658,220
Total 1,205,249 1,755,289 * Includes short-term capital gains, if any.
As of September 30, 2021, gross unrealized appreciation and depreciation for investments andderivatives based on cost for U.S. federal income tax purposes were as follows:
Amount($000)
Tax Cost 36,140,052
Gross Unrealized Appreciation 13,566,147
Gross Unrealized Depreciation (611,437)
Net Unrealized Appreciation (Depreciation) 12,954,710
F. During the year ended September 30, 2021, the fund purchased $15,654,757,000 ofinvestment securities and sold $12,474,437,000 of investment securities, other than temporarycash investments.
The fund purchased securities from and sold securities to other funds or accounts managed by itsinvestment advisor(s) or their affiliates, in accordance with procedures adopted by the board oftrustees in compliance with Rule 17a-7 of the Investment Company Act of 1940. For the yearended September 30, 2021, such purchases were $98,754,000 and sales were $27,671,000,resulting in net realized gain (loss) of $14,243,000; these amounts, other than temporary cashinvestments, are included in the purchases and sales of investment securities noted above.
G. Capital share transactions for each class of shares were:
Year Ended September 30,
2021 2020
Amount($000)
Shares(000)
Amount($000)
Shares(000)
Investor Shares
Issued 905,414 22,254 748,125 21,799
Issued in Lieu of Cash Distributions 127,115 3,134 224,894 6,622
Redeemed (1,430,575) (35,121) (1,538,469) (45,669)
Net Increase (Decrease)—Investor Shares (398,046) (9,733) (565,450) (17,248)
Equity Income Fund
24

Year Ended September 30,
2021 2020
Amount($000)
Shares(000)
Amount($000)
Shares(000)
Admiral Shares
Issued 9,053,463 106,583 7,839,439 109,634
Issued in Lieu of Cash Distributions 918,531 10,777 1,305,973 18,414
Redeemed (5,948,428) (70,619) (6,764,729) (97,111)
Net Increase (Decrease)—Admiral Shares 4,023,566 46,741 2,380,683 30,937
H. Management has determined that no events or transactions occurred subsequent toSeptember 30, 2021, that would require recognition or disclosure in these financial statements.
Equity Income Fund
25
To the Board of Trustees of Vanguard Fenway Funds and Shareholders of Vanguard Equity IncomeFund
Opinion on the Financial Statements
We have audited the accompanying statement of assets and liabilities, including the schedule ofinvestments, of Vanguard Equity Income Fund (one of the funds constituting Vanguard FenwayFunds, referred to hereafter as the "Fund") as of September 30, 2021, the related statement ofoperations for the year ended September 30, 2021, the statement of changes in net assets foreach of the two years in the period ended September 30, 2021, including the related notes, andthe financial highlights for each of the five years in the period ended September 30, 2021(collectively referred to as the "financial statements"). In our opinion, the financial statementspresent fairly, in all material respects, the financial position of the Fund as of September 30, 2021,the results of its operations for the year then ended, the changes in its net assets for each of thetwo years in the period ended September 30, 2021 and the financial highlights for each of the fiveyears in the period ended September 30, 2021 in conformity with accounting principles generallyaccepted in the United States of America.
Basis for Opinion
These financial statements are the responsibility of the Fund’s management. Our responsibility isto express an opinion on the Fund’s financial statements based on our audits. We are a publicaccounting firm registered with the Public Company Accounting Oversight Board (United States)("PCAOB") and are required to be independent with respect to the Fund in accordance with theU.S. federal securities laws and the applicable rules and regulations of the Securities and ExchangeCommission and the PCAOB.
We conducted our audits of these financial statements in accordance with the standards of thePCAOB. Those standards require that we plan and perform the audit to obtain reasonableassurance about whether the financial statements are free of material misstatement, whether dueto error or fraud.
Our audits included performing procedures to assess the risks of material misstatement of thefinancial statements, whether due to error or fraud, and performing procedures that respond tothose risks. Such procedures included examining, on a test basis, evidence regarding the amountsand disclosures in the financial statements. Our audits also included evaluating the accountingprinciples used and significant estimates made by management, as well as evaluating the overallpresentation of the financial statements. Our procedures included confirmation of securitiesowned as of September 30, 2021 by correspondence with the custodian, transfer agent andbrokers; when replies were not received from the transfer agent or brokers, we performed otherauditing procedures. We believe that our audits provide a reasonable basis for our opinion.
/s/PricewaterhouseCoopers LLPPhiladelphia, PennsylvaniaNovember 19, 2021
We have served as the auditor of one or more investment companies in The Vanguard Group ofFunds since 1975.
Report of Independent RegisteredPublic Accounting Firm
26

Special 2021 tax information (unaudited) for Vanguard Equity Income Fund
This information for the fiscal year ended September 30, 2021, is included pursuant to provisionsof the Internal Revenue Code.
The fund distributed $205,349,000 as capital gain dividends (20% rate gain distributions) toshareholders during the fiscal year.
For nonresident alien shareholders, 100% of short-term capital gain dividends distributed by thefund are qualified short-term capital gains.
The fund distributed $1,141,227,000 of qualified dividend income to shareholders during the fiscalyear.
For corporate shareholders, 80.0% of investment income (dividend income plus short-term gains,if any) qualifies for the dividends-received deduction.
27

This page intentionally left blank.

This page intentionally left blank.

This page intentionally left blank.

This page intentionally left blank.

This page intentionally left blank.

This page intentionally left blank.

This page intentionally left blank.

The trustees of your mutual fund are there to see that the fund is operated and managed in yourbest interests since, as a shareholder, you are a part owner of the fund. Your fund’s trustees alsoserve on the board of directors of The Vanguard Group, Inc., which is owned by the Vanguard fundsand provides services to them.
A majority of Vanguard’s board members are independent, meaning that they have no affiliationwith Vanguard or the funds they oversee, apart from the sizable personal investments they havemade as private individuals. The independent board members have distinguished backgrounds inbusiness, academia, and public service. Each of the trustees and executive officers oversees 212Vanguard funds.
Information for each trustee and executive officer of the fund appears below. That information, aswell as the Vanguard fund count, is as of the date on the cover of this fund report. The mailingaddress of the trustees and officers is P.O. Box 876, Valley Forge, PA 19482. More informationabout the trustees is in the Statement of Additional Information, which can be obtained, withoutcharge, by contacting Vanguard at 800-662-7447, or online at vanguard.com.
Interested Trustee1
Mortimer J. Buckley
Born in 1969. Trustee since January 2018. Principaloccupation(s) during the past five years and otherexperience: chairman of the board (2019–present) ofVanguard and of each of the investment companiesserved by Vanguard; chief executive officer(2018–present) of Vanguard; chief executive officer,president, and trustee (2018–present) of each of theinvestment companies served by Vanguard; presidentand director (2017–present) of Vanguard; andpresident (2018–present) of Vanguard MarketingCorporation. Chief investment officer (2013–2017),managing director (2002–2017), head of the RetailInvestor Group (2006–2012), and chief informationofficer (2001–2006) of Vanguard. Chairman of theboard (2011–2017) and trustee (2009–2017) of theChildren’s Hospital of Philadelphia; and trustee(2018–present) and vice chair (2019–present) of TheShipley School.
Independent Trustees
Emerson U. Fullwood
Born in 1948. Trustee since January 2008. Principaloccupation(s) during the past five years and otherexperience: executive chief staff and marketingofficer for North America and corporate vice president(retired 2008) of Xerox Corporation (documentmanagement products and services). Formerpresident of the Worldwide Channels Group, Latin
America, and Worldwide Customer Service andexecutive chief staff officer of Developing Markets ofXerox. Executive in residence and 2009–2010Distinguished Minett Professor at the RochesterInstitute of Technology. Director of SPX FLOW, Inc.(multi-industry manufacturing). Director of theUniversity of Rochester Medical Center, the MonroeCommunity College Foundation, the United Way ofRochester, North Carolina A&T University, andRoberts Wesleyan College. Trustee of the Universityof Rochester.
Amy Gutmann
Born in 1949. Trustee since June 2006. Principaloccupation(s) during the past five years and otherexperience: president (2004–present) of theUniversity of Pennsylvania. Christopher H. BrowneDistinguished Professor of Political Science, School ofArts and Sciences, and professor of communication,Annenberg School for Communication, withsecondary faculty appointments in the Department ofPhilosophy, School of Arts and Sciences, and at theGraduate School of Education, University ofPennsylvania.
F. Joseph Loughrey
Born in 1949. Trustee since October 2009. Principaloccupation(s) during the past five years and otherexperience: president and chief operating officer(retired 2009) and vice chairman of the board(2008–2009) of Cummins Inc. (industrial machinery).Chairman of the board of Hillenbrand, Inc. (specializedconsumer services). Director of the V Foundation.
1 Mr. Buckley is considered an “interested person,” as defined in the Investment Company Act of 1940, because he is an officer of the
Vanguard funds.
The People Who Govern Your Fund

Member of the advisory council for the College ofArts and Letters and chair of the advisory board to theKellogg Institute for International Studies, both at theUniversity of Notre Dame. Chairman of the board ofSaint Anselm College.
Mark Loughridge
Born in 1953. Trustee since March 2012. Principaloccupation(s) during the past five years and otherexperience: senior vice president and chief financialofficer (retired 2013) of IBM (information technologyservices). Fiduciary member of IBM’s RetirementPlan Committee (2004–2013), senior vice presidentand general manager (2002–2004) of IBM GlobalFinancing, vice president and controller (1998–2002)of IBM, and a variety of other prior management rolesat IBM. Member of the Council on Chicago Booth.
Scott C. Malpass
Born in 1962. Trustee since March 2012. Principaloccupation(s) during the past five years and otherexperience: chief investment officer (retired June2020) and vice president (retired June 2020) of theUniversity of Notre Dame. Assistant professor (retiredJune 2020) of finance at the Mendoza College ofBusiness, University of Notre Dame, and member ofthe Notre Dame 403(b) Investment Committee.Member of the board of Catholic InvestmentServices, Inc. (investment advisors) and the board ofsuperintendence of the Institute for the Works ofReligion.
Deanna Mulligan
Born in 1963. Trustee since January 2018. Principaloccupation(s) during the past five years and otherexperience: board chair (2020), chief executive officer(2011–2020), and president (2010–2019) of TheGuardian Life Insurance Company of America. Chiefoperating officer (2010–2011) and executive vicepresident (2008–2010) of Individual Life and Disabilityof the Guardian Life Insurance Company of America.Member of the board of the Economic Club of NewYork. Trustee of the Partnership for New York City(business leadership), Chief Executives for CorporatePurpose, NewYork-Presbyterian Hospital, and theBruce Museum (arts and science). Member of theAdvisory Council for the Stanford Graduate School ofBusiness.
André F. Perold
Born in 1952. Trustee since December 2004. Principaloccupation(s) during the past five years and otherexperience: George Gund Professor of Finance andBanking, Emeritus at the Harvard Business School(retired 2011). Chief investment officer andco-managing partner of HighVista Strategies (privateinvestment firm). Member of the board
(2018–present) of RIT Capital Partners (investmentfirm). Member of the investment committee ofPartners Health Care System.
Sarah Bloom Raskin
Born in 1961. Trustee since January 2018. Principaloccupation(s) during the past five years and otherexperience: deputy secretary (2014–2017) of theUnited States Department of the Treasury. Governor(2010–2014) of the Federal Reserve Board.Commissioner (2007–2010) of financial regulation forthe State of Maryland. Professor (2020–present),Distinguished Fellow of the Global Financial MarketsCenter (2020–present), and Rubenstein Fellow(2017–2020) at Duke University. Trustee(2017–present) of Amherst College and member ofAmherst College Investment Committee(2019–present). Member of the Regenerative CrisisResponse Committee (2020–present).
David A. Thomas
Born in 1956. Trustee since July 2021. Principaloccupation(s) during the past five years and otherexperience: president of Morehouse College(2018–present). Professor of business administration,emeritus at Harvard University (2017–2018). Dean(2011–2016) and professor of management(2016–2017) at the Georgetown UniversityMcDonough School of Business. Director of DTEEnergy Company (2013–present). Trustee of CommonFund (2019–present).
Peter F. Volanakis
Born in 1955. Trustee since July 2009. Principaloccupation(s) during the past five years and otherexperience: president and chief operating officer(retired 2010) of Corning Incorporated(communications equipment) and director of CorningIncorporated (2000–2010) and Dow Corning(2001–2010). Director (2012) of SPX Corporation(multi-industry manufacturing). Overseer of the AmosTuck School of Business Administration, DartmouthCollege (2001–2013). Chairman of the board oftrustees of Colby-Sawyer College. Member of theBMW Group Mobility Council.

Executive Officers
John Bendl
Born in 1970. Principal occupation(s) during the pastfive years and other experience: principal ofVanguard. Chief financial officer (2019–present) ofeach of the investment companies served byVanguard. Chief accounting officer, treasurer, andcontroller of Vanguard (2017–present). Partner(2003–2016) at KPMG (audit, tax, and advisoryservices).
Christine M. Buchanan
Born in 1970. Principal occupation(s) during the pastfive years and other experience: principal ofVanguard. Treasurer (2017–present) of each of theinvestment companies served by Vanguard. Partner(2005–2017) at KPMG (audit, tax, and advisoryservices).
David Cermak
Born in 1960. Principal occupation(s) during the pastfive years and other experience: principal ofVanguard. Finance director (2019–present) of each ofthe investment companies served by Vanguard.Managing director and head (2017–present) ofVanguard Investments Singapore. Managing directorand head (2017–2019) of Vanguard Investments HongKong. Representative director and head (2014–2017)of Vanguard Investments Japan.
John Galloway
Born in 1973. Principal occupation(s) during the pastfive years and other experience: principal ofVanguard. Investment stewardship officer (September2020–present) of each of the investment companiesserved by Vanguard. Head of Investor Advocacy(February 2020–present) and head of MarketingStrategy and Planning (2017–2020) at Vanguard.Deputy assistant to the President of theUnited States (2015).
Peter Mahoney
Born in 1974. Principal occupation(s) during the pastfive years and other experience: principal ofVanguard. Controller (2015–present) of each of theinvestment companies served by Vanguard. Head ofInternational Fund Services (2008–2014) at Vanguard.
Anne E. Robinson
Born in 1970. Principal occupation(s) during the pastfive years and other experience: general counsel(2016–present) of Vanguard. Secretary (2016–present)of Vanguard and of each of the investmentcompanies served by Vanguard. Managing director(2016–present) of Vanguard. Managing director andgeneral counsel of Global Cards and ConsumerServices (2014–2016) at Citigroup. Counsel(2003–2014) at American Express.
Michael Rollings
Born in 1963. Principal occupation(s) during the pastfive years and other experience: finance director(2017–present) and treasurer (2017) of each of theinvestment companies served by Vanguard.Managing director (2016–present) of Vanguard. Chieffinancial officer (2016–present) of Vanguard. Director(2016–present) of Vanguard Marketing Corporation.Executive vice president and chief financial officer(2006–2016) of MassMutual Financial Group.
John E. Schadl
Born in 1972. Principal occupation(s) during the pastfive years and other experience: principal ofVanguard. Chief compliance officer (2019–present) ofVanguard and of each of the investment companiesserved by Vanguard. Assistant vice president(2019–present) of Vanguard Marketing Corporation.
Vanguard Senior Management Team
Matthew Benchener Thomas M. Rampulla
Joseph Brennan Karin A. Risi
Mortimer J. Buckley Anne E. Robinson
Gregory Davis Michael Rollings
John James Nitin Tandon
John T. Marcante Lauren Valente
Chris D. Mclsaac

Connect with Vanguard® > vanguard.com
Fund Information > 800-662-7447
Direct Investor Account Services > 800-662-2739
Institutional Investor Services > 800-523-1036
Text Telephone for People Who Are Deaf or Hard
of Hearing > 800-749-7273
This material may be used in conjunctionwith the offering of shares of any Vanguardfund only if preceded or accompanied bythe fund’s current prospectus.
All comparative mutual fund data are from Morningstar,Inc., unless otherwise noted.
You can obtain a free copy of Vanguard’s proxy votingguidelines by visiting vanguard.com/proxyreporting or bycalling Vanguard at 800-662-2739. The guidelines arealso available from the SEC’s website, www.sec.gov. Inaddition, you may obtain a free report on how your fundvoted the proxies for securities it owned during the 12months ended June 30. To get the report, visit eithervanguard.com/proxyreporting or www.sec.gov.
You can review information about your fund on the SEC’swebsite, and you can receive copies of this information,for a fee, by sending a request via email addressed [email protected].
Source for Bloomberg indexes: Bloomberg IndexServices Limited. Copyright 2021, Bloomberg. All rightsreserved.
CFA® is a registered trademark owned by CFA Institute.
© 2021 The Vanguard Group, Inc.All rights reserved.Vanguard Marketing Corporation, Distributor.
Q650 112021