VANET Topology Characteristics under Realistic Mobility...
6
VANET Topology Characteristics under Realistic Mobility and Channel Models Nabeel Akhtar * , Oznur Ozkasap * & Sinem Coleri Ergen † * Department of Computer Engineering † Department of Electrical and Electronics Engineering Koc University, Turkey [email protected], [email protected], [email protected] Abstract—Developing real-time safety and non-safety applica- tions for vehicular ad hoc networks (VANET) requires under- standing the dynamics of the network topology characteristics since these dynamics determine both the performance of routing protocols and the feasibility of an application over VANET. Using various key metrics of interest including node degree, number of clusters, link duration and link quality, we provide a realistic analysis of the VANET topology characteristics. In this analysis, we integrate real-world road topology and real-time data extracted from Freeway Performance Measurement System database into the microscopic mobility model in order to generate realistic traffic flows along the highway. Moreover, we use more realistic, recently proposed, obstacle-based channel model and compare the performance of this sophisticated model to the most commonly used more simplistic channel models including unit disc and log-normal shadowing model. Our investigation on the key system metrics reveal that largely used unit disc model fails to realistically model communication channel, while parameters of simplistic models like log normal can be adjusted to match the corresponding system metrics of more complex and hard to implement obstacle based model. I. I NTRODUCTION Vehicular Ad-Hoc Network (VANET) is a promising Intelli- gent Transportation System (ITS) technology that offers many applications such as safety message dissemination [1], [2], [3], dynamic route planning [4], content distribution, gaming and entertainment [5]. Majority of the VANET research effort on protocol design has relied on simulations due to the prohibitive cost of employing real world test-beds. Building a realistic simulation environment for VANET is therefore essential in judging the performance of the protocols proposed at various layers. A realistic simulation environment requires an accuracte representation of both the vehicular mobility and signal propa- gation among the vehicles. Different vehicle mobility and sig- nal propagation models should be compared through various metrics including node degree, number of clusters, link dura- tion and quality [6], [7], [8], [9]. Recent studies on the analysis of VANET topology characteristics have incorporated large- scale mobility models based on either statistics performed by the urban planning and traffic engineering communities [10] or mobility traces gathered through various measurement campaigns [11], [12]. However, none of these studies analyze VANET topology characteristics on a large-scale highway considering real data based traffic demand of vehicles using microscopic mobility model. Realistic representation of the signal propagation can be achieved by sophisticated methods like ray-tracing model [13], [14]. However, such models are impractical since they require a detailed description of site-specific propagation environment. Stochastic models on the other hand determine the physical parameters of the vehicular channel in a completely stochastic manner without presuming any underlying geometry [15]. Most of the channel modeling activities try to take average of the additional attenuation due to obstacles, resulting in a log-normal distribution around the mean received signal power [16], [17]. Although some of these models estimate different variations of the large-scale fading distribution at low and high traffic densities [17], mechanisms for taking into account the effect of vehicles and static obstacles on the received signal power have been recently proposed in [18] and [19] respectively. Finally, for small-scale fading models, various distributions have been proposed, including Rice [20], Nakagami [16] and Weibull [21], [17] distributions. Although signal propagation has great impact on the per- formance of the communication protocols, most of the recent work on the analysis of VANET topology characteristics either use unit disc as the signal propagation model [6], [7], [10], [9], [22] or use more sophisticated stochastic signal propa- gation models including both large-scale fading [9], [23] and small-scale fading [24], [23]. However, none of these models incorporate the effect of vehicles on the signal propagation. The goal of this study is to analyze the evolution of the VANET topology characteristics on a large highway section by using realistic mobility traces generated using real-world road topology and accurate microscopic mobility modeling. We use real-data based traffic demand and realistic channel models, taking into account the effect of vehicles on the received signal power, when comparing the performance of this realistic scenario to the commonly used more simplistic channel models. The contributions of this paper are as follows. To the best of our knowledge, this is the first study that: • incorporates real-world road topology and real-time data from Freeway Performance Measurement System (PeMS) database into the microscopic mobility model provided by 978-1-4673-5939-9/13/$31.00 ©2013 IEEE 978-1-4673-5939-9/13/$31.00 ©2013 IEEE 2013 IEEE Wireless Communications and Networking Conference (WCNC): NETWORKS 2013 IEEE Wireless Communications and Networking Conference (WCNC): NETWORKS 1774
Transcript of VANET Topology Characteristics under Realistic Mobility...
VANET Topology Characteristics underRealistic Mobility and Channel Models
Nabeel Akhtar∗, Oznur Ozkasap∗ & Sinem Coleri Ergen†∗ Department of Computer Engineering
†Department of Electrical and Electronics EngineeringKoc University, Turkey
[email protected], [email protected], [email protected]
Abstract—Developing real-time safety and non-safety applica-tions for vehicular ad hoc networks (VANET) requires under-standing the dynamics of the network topology characteristicssince these dynamics determine both the performance of routingprotocols and the feasibility of an application over VANET.Using various key metrics of interest including node degree,number of clusters, link duration and link quality, we provide arealistic analysis of the VANET topology characteristics. In thisanalysis, we integrate real-world road topology and real-timedata extracted from Freeway Performance Measurement Systemdatabase into the microscopic mobility model in order to generaterealistic traffic flows along the highway. Moreover, we use morerealistic, recently proposed, obstacle-based channel model andcompare the performance of this sophisticated model to the mostcommonly used more simplistic channel models including unitdisc and log-normal shadowing model. Our investigation on thekey system metrics reveal that largely used unit disc model failsto realistically model communication channel, while parametersof simplistic models like log normal can be adjusted to matchthe corresponding system metrics of more complex and hard toimplement obstacle based model.
I. INTRODUCTION
Vehicular Ad-Hoc Network (VANET) is a promising Intelli-gent Transportation System (ITS) technology that offers manyapplications such as safety message dissemination [1], [2], [3],dynamic route planning [4], content distribution, gaming andentertainment [5]. Majority of the VANET research effort onprotocol design has relied on simulations due to the prohibitivecost of employing real world test-beds. Building a realisticsimulation environment for VANET is therefore essential injudging the performance of the protocols proposed at variouslayers.
A realistic simulation environment requires an accuracterepresentation of both the vehicular mobility and signal propa-gation among the vehicles. Different vehicle mobility and sig-nal propagation models should be compared through variousmetrics including node degree, number of clusters, link dura-tion and quality [6], [7], [8], [9]. Recent studies on the analysisof VANET topology characteristics have incorporated large-scale mobility models based on either statistics performedby the urban planning and traffic engineering communities[10] or mobility traces gathered through various measurementcampaigns [11], [12]. However, none of these studies analyzeVANET topology characteristics on a large-scale highway
considering real data based traffic demand of vehicles usingmicroscopic mobility model.
Realistic representation of the signal propagation can beachieved by sophisticated methods like ray-tracing model [13],[14]. However, such models are impractical since they requirea detailed description of site-specific propagation environment.Stochastic models on the other hand determine the physicalparameters of the vehicular channel in a completely stochasticmanner without presuming any underlying geometry [15].Most of the channel modeling activities try to take averageof the additional attenuation due to obstacles, resulting ina log-normal distribution around the mean received signalpower [16], [17]. Although some of these models estimatedifferent variations of the large-scale fading distribution atlow and high traffic densities [17], mechanisms for takinginto account the effect of vehicles and static obstacles on thereceived signal power have been recently proposed in [18]and [19] respectively. Finally, for small-scale fading models,various distributions have been proposed, including Rice [20],Nakagami [16] and Weibull [21], [17] distributions.
Although signal propagation has great impact on the per-formance of the communication protocols, most of the recentwork on the analysis of VANET topology characteristics eitheruse unit disc as the signal propagation model [6], [7], [10],[9], [22] or use more sophisticated stochastic signal propa-gation models including both large-scale fading [9], [23] andsmall-scale fading [24], [23]. However, none of these modelsincorporate the effect of vehicles on the signal propagation.
The goal of this study is to analyze the evolution of theVANET topology characteristics on a large highway sectionby using realistic mobility traces generated using real-worldroad topology and accurate microscopic mobility modeling.We use real-data based traffic demand and realistic channelmodels, taking into account the effect of vehicles on thereceived signal power, when comparing the performance ofthis realistic scenario to the commonly used more simplisticchannel models.
The contributions of this paper are as follows. To the bestof our knowledge, this is the first study that:
• incorporates real-world road topology and real-time datafrom Freeway Performance Measurement System (PeMS)database into the microscopic mobility model provided by
978-1-4673-5939-9/13/$31.00 ©2013 IEEE978-1-4673-5939-9/13/$31.00 ©2013 IEEE
2013 IEEE Wireless Communications and Networking Conference (WCNC): NETWORKS2013 IEEE Wireless Communications and Networking Conference (WCNC): NETWORKS
1774
Simulation of Urban Mobility (SUMO).• incorporates more realistic recently proposed obstacle-
based channel model into the analysis of VANET topol-ogy characteristics, and compare its performance withcommonly used more simplistic channel models includ-ing unit disc and log-normal shadow fading models.
• analyzes the effect of using the obstacle-based channelmodel on the VANET topology characteristics.
The rest of the paper is organized as follows. Section IIdescribes the generation of the realistic vehicle mobility usingPeMS database. Section III provides the implementation ofdifferent radio channel models including unit disc, log-normalshadowing and obstacle-based model. Section IV provides thesimulation results. The main results are summarized and futurework is given in Section V.
II. VEHICLE MOBILITY MODEL
Realistic representation of the vehicle mobility requiresusing accurate microscopic mobility modeling, real-world roadtopology and real-data based traffic demand modeling asdetailed next.
Microscopic Mobility Modeling: SUMO [25] is used tosimulate the microscopic mobility of vehicles. SUMO is anopen-source, space-continuous, discrete-time traffic simulatordeveloped by the German Aerospace Center capable of mod-eling the behavior of individual drivers. The parameters of thesimulator that determine the driver’s acceleration and overtak-ing decisions include the distance to the leading vehicle, thetraveling speed, the acceleration and deceleration profiles, anddimension of the vehicles.
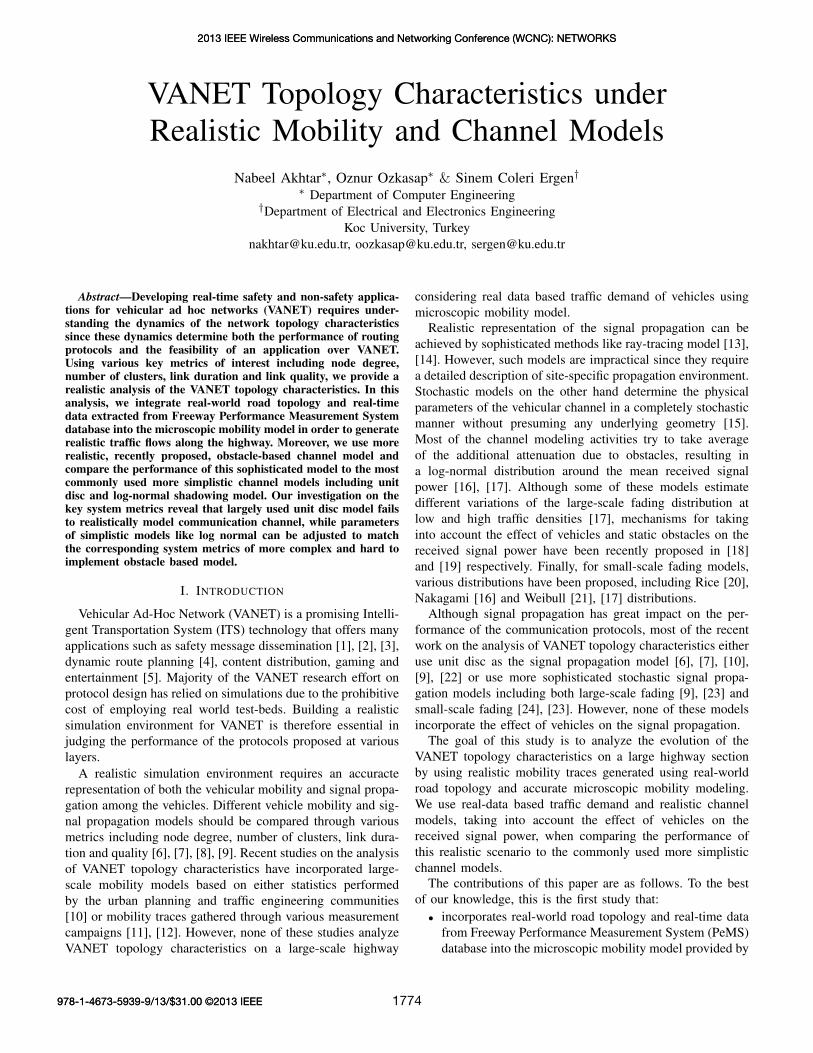
Traffic Demand Modeling: PeMS collects historical and real-time data from freeways in the State of California with the goalof computing freeway performance measures thus providingmanagers with a comprehensive assessment of freeway perfor-mance [26]. The flow and speed data are collected in real timefrom over 25,000 individual detectors located over all majormetropolitan areas in the state of California. The samplingrate of the flow and speed data ranges from 30 seconds to 5minutes. Fig. 1 shows the road sensors located on I-880S inAlameda County.
Realistic Mobility Generation: The first step in the gen-eration of the realistic mobility model is to determine theinput of SUMO for the assignment of the vehicular trafficflows over the road. The data from 419 road sensors onhighway I880-S, as shown in Fig. 1, are extracted for both hightraffic density i.e. 121 vehicles/km at 18 : 00, and low trafficdensity i.e. 11 vehicles/km 01 : 00 using PeMS database. Forthe simulation using SUMO, the parameters of the vehiclesinjected (i.e. maximum speed, start speed, acceleration, de-acceleration, type, distance to the leading vehicle) are selectedsuch that traffic flow and average speed values determined bysimulation and PeMS database agree with each other.
III. VEHICULAR CHANNEL MODELS
Realistic representation of the signal propagation among thevehicles located on the highway requires incorporating the
Fig. 1. Road sensors located on I-880S in Alameda County
effect of the moving obstacles (i.e. vehicles) on the receivedsignal power due to their dominating influence as illustrated in[18]. Following the description of the commonly used moresimplistic channel models including unit disc and stochasticlarge-scale fading, the algorithm for estimating the additionalattenuation caused by the surrounding vehicles is explained.
A. Unit disc Model
In unit disc model, the vehicles can communicate witheach other if they are within a threshold distance and cannotcommunicate otherwise. Although this model is widely usedin the analysis of the VANET topology characteristics due toits simplicity [6], [7], [10], [9], [22], the sharp cut-off at thethreshold distance fails to capture the random noise that canmake even nearby nodes unreachable and account for the effectof obstacles on the received signal strength.
B. Stochastic Large-Scale Fading Model
Stochastic large-scale fading model aims to take average ofthe additional attenuation caused to the obstacles. The resultingdistribution of these variations has been found to be log-normalformulated as follows [16], [17]:
Prx(d) = P0 − 10n log10d
d0+N (1)
where d is the distance between the transmitter and thereceiver, d0 is the reference distance, Prx(d) is the receivedsignal power at distance d (in dBm), P0 is the received signalpower at the reference distance d0 (in dBm) , n is the path lossexponent and N is zero mean Gaussian random variable withvariance σ2. A vehicle can communicate with another vehicleif Prx is greater than a certain threshold value [27]. Notethat the log-normal shadowing model reduces to the unit discmodel if σ = 0. The parameter P0 of the log-normal model
1775
is chosen such that the mean transmission range is equal tothe threshold distance in the unit disc model to have a faircomparison, while the parameter values of n and σ of themodel are chosen based on the channel measurement resultsreported in [28], [16], [17]: n = 4.45, σ = 14.40dB. Thesevalues are adjusted such that the log-normal model behavesimilar to obstacle based model.
C. Obstacle-based Channel Model
Obstacle-based channel models propose mechanisms to in-corporate the effect of the surrounding obstacles, such as othervehicles, walls and buildings, on the received signal strength[18], [17] rather than averaging the additional attenuation dueto these obstacles using stochastic large-scale fading model.Since there are few buildings around the highway mostlyfar from the vehicles, we only consider the impact of thesurrounding vehicles as obstacles. Additional obstacles aroundthe road can only further reduce the received signal strengthso this approach can be considered as a best case analysis forthe effect of obstacles on received signal strength as stated in[18].
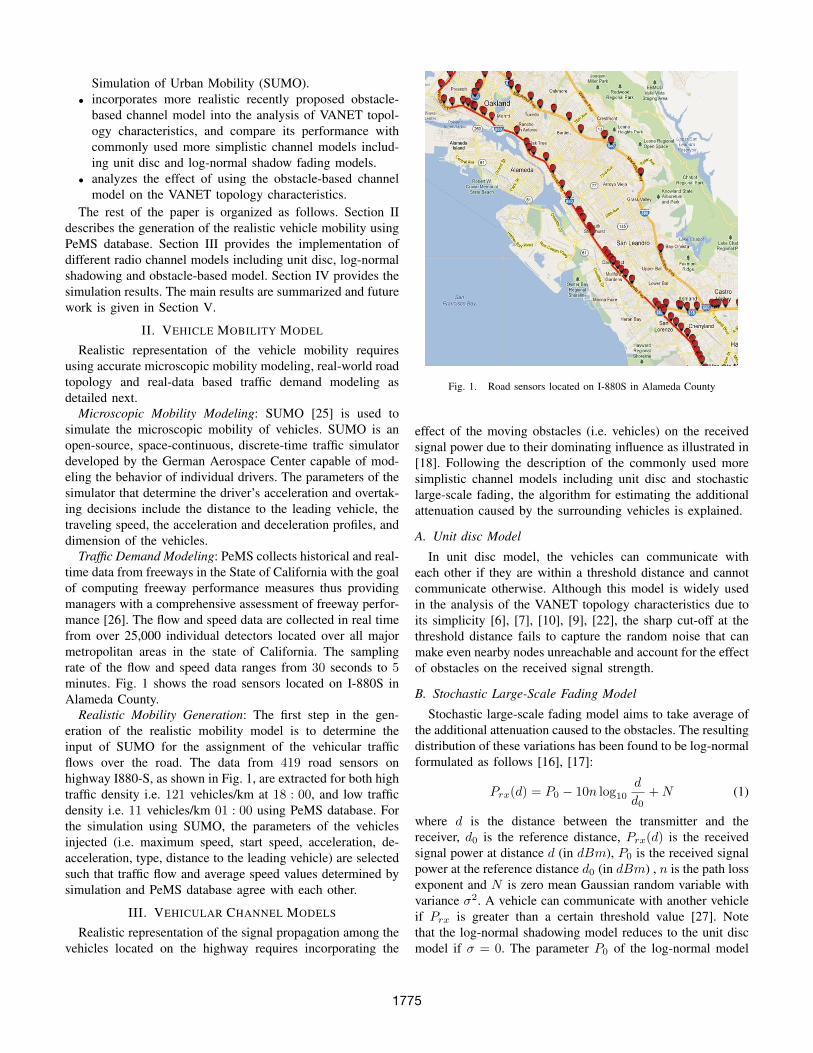
The algorithm proposed and validated in [18] is imple-mented for calculating the additional attenuation caused byother vehicles. This algorithm consists of three main parts asshown in Algorithm 1. First, the vehicles which can poten-tially obstruct the LOS between the transmitter vehicle i andreceiver vehicle j are determined (getPotentialObs(i, j)): Ifthe distance from the center of the vehicle to the LOS linebetween vehicles i and j is less than half the width of thevehicle, the vehicle is considered as a potential obstacle asillustrated in Fig. 2-a.
Algorithm 1 Obstacle Based Model: Calculation of the addi-tional attenuation between vehicles i and j due to surroundingvehicles as obstacles
[PotentialObs] = getPotentialObs(i, j) {Determine potentialobstacle vehicles}if size([PotentialObs]) 6= 0 then
[ObsV eh] = getLOSobs([PotentialObs]) {Determine LOSobstructing vehicles}if size([ObsV eh]) 6= 0 then
addAttenuation = calAttenuation([ObsV eh]) { Calcu-late additional attenuation caused by obstructing vehicles}
elseaddAttenuation = 0
end ifelse
addAttenuation = 0end if
Second, the vehicles that obstruct the LOS between ve-hicles i and j are determined from the set of the po-tential obstructing vehicles determined in the previous step(getLOSobs([PotentialObs])): From the prospective of theelectromagnetic wave propagation, if there exist a visual sightline between transmitter and receiver vehicle, it does notguarantee that LOS exist. Transmitted signal gets effected
Fig. 2. Determining the vehicles that: a) Potentially obstruct the LOS betweentransmitter and receiver b) Obstruct the LOS between vehicles i and j (Vehicleantenna heights (ha) are not shown for simplicity).
only if other vehicle obstructs the Fresnel ellipsoid. Theeffective height of the LOS line that connects vehicles i andj at a potential obstacle vehicle, considering the first Fresnelellipsoid, is given by
h = (hj − hi)dobsd
+ hi − 0.6rf + ha (2)
where hi and hj are the heights of the transmitter vehiclei and receiver vehicle j respectively, dobs is the distancebetween the transmitter and the obstacle, d is distance betweenthe transmitter and receiver, ha is the height of the vehicleantennas, and radius for the first Fresnel zone ellipsoid rf isgiven by
rf =
√λdobs(d− dobs)
d(3)
where λ denoting the wavelength. Fig. 2-b illustrates theseparameters. Since the height of each potentially obstructingvehicle is known beforehand, the vehicle is considered toobstruct the LOS between the transmitter and receiver if his greater than its height. Based on the assumption that thevehicle heights follow a normal distribution as assumed in[18], the probability of the LOS for the link between vehiclesi and j is calculated as
Pr(LOS|hi, hj) = 1−Q(h− µσ
) (4)
where µ and σ are the mean and standard deviation of theheight of the obstacle vehicle.
Third, the additional attenuation in the received signal poweris calculated for the LOS obstructing vehicles determined inthe previous step (calAttenuation([ObsV ehicles])). The ex-isting models to calculate the attenuation vary from pessimistic[30], [31] to optimistic [29] approximations. Additional atten-uation is calculated by using ITU-R method based on multipleknife edge model [32] as suggested in [18].
IV. SIMULATION RESULTS
The goal of the simulations is to compare the effect of differ-ent channel models including unit disc, log-normal fading andobstacle-based on the topology characteristics of VANETs on
1776
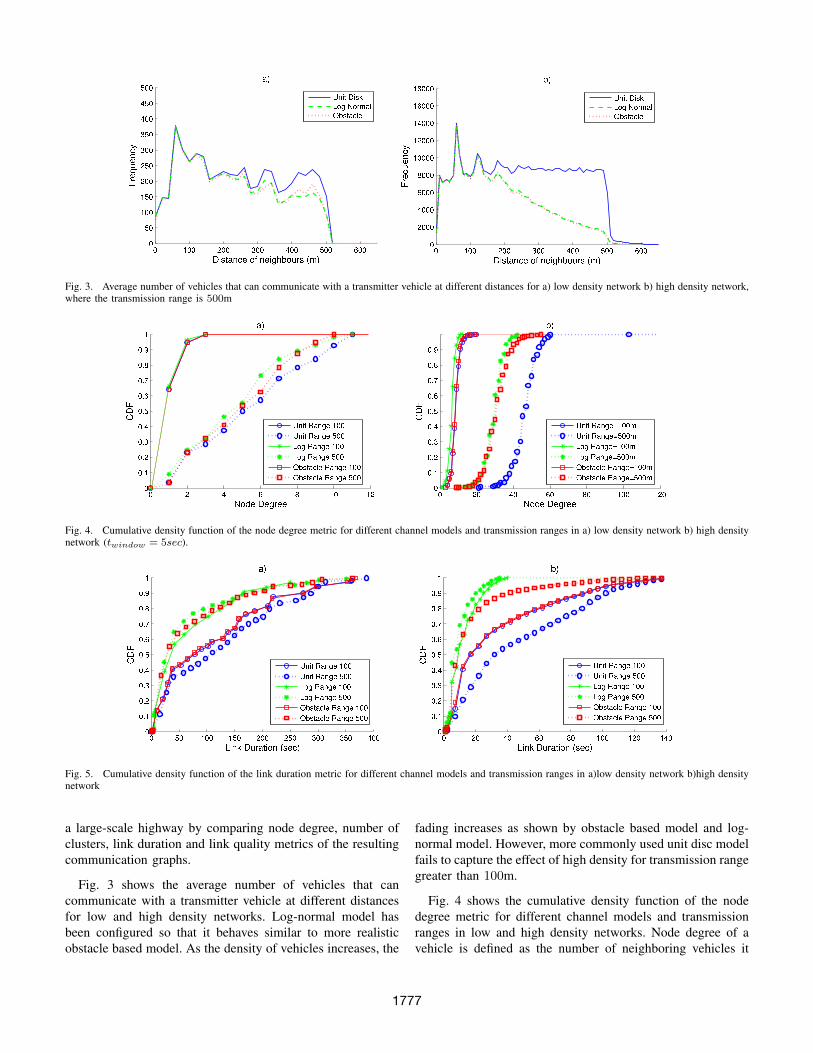
Fig. 3. Average number of vehicles that can communicate with a transmitter vehicle at different distances for a) low density network b) high density network,where the transmission range is 500m
Fig. 4. Cumulative density function of the node degree metric for different channel models and transmission ranges in a) low density network b) high densitynetwork (twindow = 5sec).
Fig. 5. Cumulative density function of the link duration metric for different channel models and transmission ranges in a)low density network b)high densitynetwork
a large-scale highway by comparing node degree, number ofclusters, link duration and link quality metrics of the resultingcommunication graphs.
Fig. 3 shows the average number of vehicles that cancommunicate with a transmitter vehicle at different distancesfor low and high density networks. Log-normal model hasbeen configured so that it behaves similar to more realisticobstacle based model. As the density of vehicles increases, the
fading increases as shown by obstacle based model and log-normal model. However, more commonly used unit disc modelfails to capture the effect of high density for transmission rangegreater than 100m.
Fig. 4 shows the cumulative density function of the nodedegree metric for different channel models and transmissionranges in low and high density networks. Node degree of avehicle is defined as the number of neighboring vehicles it
1777
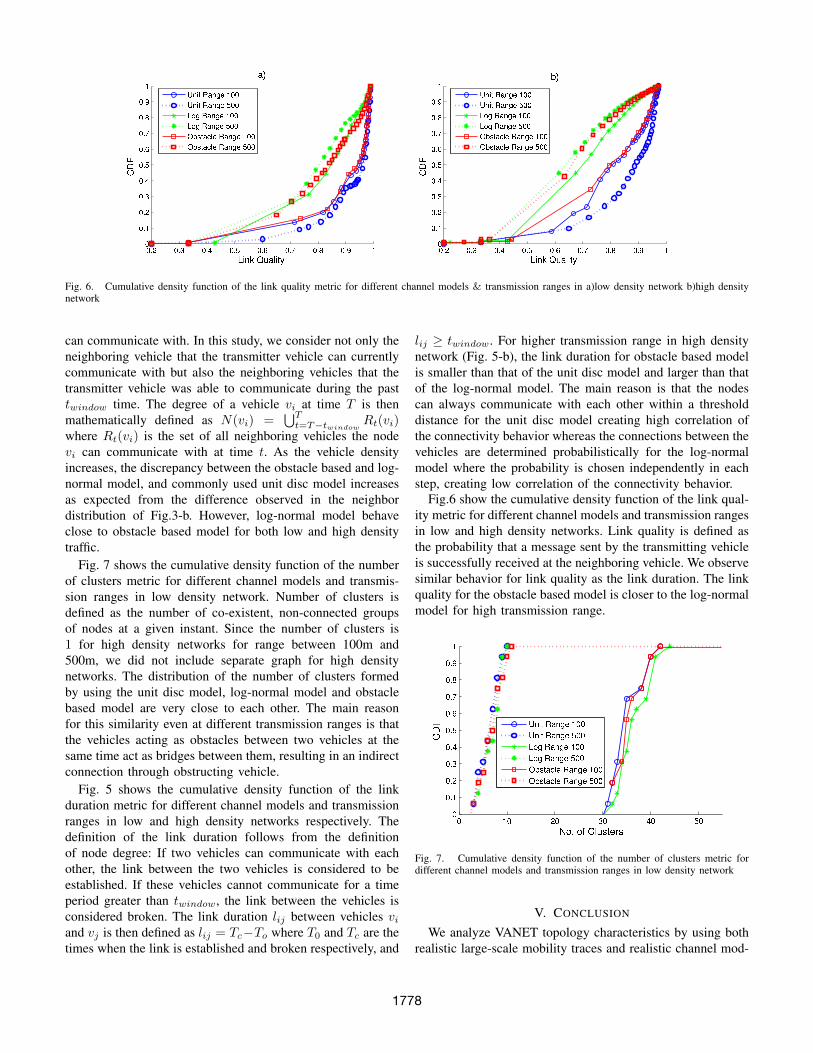
Fig. 6. Cumulative density function of the link quality metric for different channel models & transmission ranges in a)low density network b)high densitynetwork
can communicate with. In this study, we consider not only theneighboring vehicle that the transmitter vehicle can currentlycommunicate with but also the neighboring vehicles that thetransmitter vehicle was able to communicate during the pasttwindow time. The degree of a vehicle vi at time T is thenmathematically defined as N(vi) =
⋃Tt=T−twindow
Rt(vi)where Rt(vi) is the set of all neighboring vehicles the nodevi can communicate with at time t. As the vehicle densityincreases, the discrepancy between the obstacle based and log-normal model, and commonly used unit disc model increasesas expected from the difference observed in the neighbordistribution of Fig.3-b. However, log-normal model behaveclose to obstacle based model for both low and high densitytraffic.
Fig. 7 shows the cumulative density function of the numberof clusters metric for different channel models and transmis-sion ranges in low density network. Number of clusters isdefined as the number of co-existent, non-connected groupsof nodes at a given instant. Since the number of clusters is1 for high density networks for range between 100m and500m, we did not include separate graph for high densitynetworks. The distribution of the number of clusters formedby using the unit disc model, log-normal model and obstaclebased model are very close to each other. The main reasonfor this similarity even at different transmission ranges is thatthe vehicles acting as obstacles between two vehicles at thesame time act as bridges between them, resulting in an indirectconnection through obstructing vehicle.
Fig. 5 shows the cumulative density function of the linkduration metric for different channel models and transmissionranges in low and high density networks respectively. Thedefinition of the link duration follows from the definitionof node degree: If two vehicles can communicate with eachother, the link between the two vehicles is considered to beestablished. If these vehicles cannot communicate for a timeperiod greater than twindow, the link between the vehicles isconsidered broken. The link duration lij between vehicles viand vj is then defined as lij = Tc−To where T0 and Tc are thetimes when the link is established and broken respectively, and
lij ≥ twindow. For higher transmission range in high densitynetwork (Fig. 5-b), the link duration for obstacle based modelis smaller than that of the unit disc model and larger than thatof the log-normal model. The main reason is that the nodescan always communicate with each other within a thresholddistance for the unit disc model creating high correlation ofthe connectivity behavior whereas the connections between thevehicles are determined probabilistically for the log-normalmodel where the probability is chosen independently in eachstep, creating low correlation of the connectivity behavior.
Fig.6 show the cumulative density function of the link qual-ity metric for different channel models and transmission rangesin low and high density networks. Link quality is defined asthe probability that a message sent by the transmitting vehicleis successfully received at the neighboring vehicle. We observesimilar behavior for link quality as the link duration. The linkquality for the obstacle based model is closer to the log-normalmodel for high transmission range.
Fig. 7. Cumulative density function of the number of clusters metric fordifferent channel models and transmission ranges in low density network
V. CONCLUSION
We analyze VANET topology characteristics by using bothrealistic large-scale mobility traces and realistic channel mod-
1778
els. The realistic large-scale mobility traces are obtained byusing accurate microscopic mobility modeling of SUMO, de-termining its input and parameters based on the flow and speeddata of the road sensors, extracted from the PeMS database.The realistic channel model is obtained by implementing therecently proposed obstacle-based channel model, that takes allthe vehicles around the transmitter and receiver into account indetermining the received signal strength. The performance ofthe obstacle-based model is compared to the most commonlyused more simplistic channel models including unit disc andlog-normal shadowing model. Investigation of the system met-rics including node degree, number of clusters, link durationand quality reveals that tuning the parameters appropriatelyfor more simplistic and easy to implement log normal modelprovides a good match with more sophisticated obstacle basedmodel. This shows that finely tuned log normal model canbe used instead of both commonly used but inaccurate unitdisc model, and more accurate but hard to implement Obstaclebased model. We are currently working on improving the log-normal model by including time correlations to have a betterfit for link quality and duration metrics.
ACKNOWLEDGEMENT
Our work was supported by Turk Telekom under GrantNumber 11315-07. We would like to thank Cagatay Ulusoyand Pangun Park for their invaluable help during the initialphase of our work.
REFERENCES
[1] R. Chen, W.-L. Jin, and A. Regan, “Broadcasting safety informationin vehicular networks: issues and approaches,” IEEE Network, vol. 24,no. 1, pp. 20–25, 2010.
[2] W. Chen and S. Cai, “Ad hoc peer-to-peer network architecture for vehi-cle safety communications,” Communications Magazine, IEEE, vol. 43,no. 4, pp. 100 – 107, april 2005.
[3] M. Torrent-Moreno, J. Mittag, P. Santi, and H. Hartenstein, “Vehicle-to-vehicle communication: Fair transmit power control for safety- criticalinformation,” IEEE Transactions on Vehicular Technology, vol. 58, no. 7,pp. 3684 – 3703, September 2009.
[4] J. Nzouonta, N. Rajgure, G. Wang, and C. Borcea, “Vanet routing on cityroads using real-time vehicular traffic information,” IEEE Transactionson Vehicular Technology, vol. 58, no. 7, pp. 3609–26, Sep 2009.
[5] Y. Toor, P. Muhlethaler, and A. Laouiti, “Vehicle ad hoc networks:applications and related technical issues,” Communications SurveysTutorials, IEEE, vol. 10, no. 3, pp. 74 –88, quarter 2008.
[6] W. Viriyasitavat, F. Bai, and O. K. Tonguz, “Dynamics of networkconnectivity in urban vehicular networks,” IEEE Journal on SelectedAreas in Communications, vol. 29, no. 3, pp. 515 – 533, March 2011.
[7] M. Fiore and J. Harri, “The networking shape of vehicular mobility,”in ACM International Symposium on Mobile Ad hoc Networking andComputing (MobiHoc), May 2008, pp. 261–272.
[8] S. Uppoor and M. Fiore, “Large-scale urban vehicular mobility fornetworking research,” in IEEE Vehicular Networking Conference (VNC),November 2011, pp. 62–69.
[9] R. Meireles, M. Ferreira, and J. Barros, “Vehicular connectivity models:From single-hop links to large-scale behavior,” in IEEE VehicularTechnology Conference (VTC) Fall, September 2009, pp. 1–5.
[10] G. Pallis, D. Katsaros, M. D. Dikaiados, N. Loulloudes, and L. Tassiulas,“On the structure and evolution of vehicular networks,” in Modeling,Analysis and Simulation of Computer and Telecommunication Systems(MASCOTS), September 2009, pp. 1–10.
[11] H. Zhu, M. Li, Y. Zhu, and L. Ni, “Hero: Online real-time vehicletracking,” IEEE Transactions on Parallel and Distributed Systems,vol. 20, no. 5, pp. 740 – 752, May 2009.
[12] itetris - an integrated wireless and traffic platform for real-time roadtraffic management solutions. [Online]. Available: http://ict-itetris.eu
[13] J. Maurer, T. Fugen, M. Porebska, T. Zwick, and W. Wiesbeck, “A ray-optical channel model for mobile to mobile communications,” in 4thMCM COST 2100, February 2008.
[14] S. A. H. Tabatabaei, M. Fleury, N. N. Qadri, and M. Ghanbari, “Im-proving propagation modeling in urban environments for vehicular adhoc networks,” IEEE Transactions on Intelligent Transportation Systems,vol. 12, no. 3, pp. 705 – 716, September 2011.
[15] C. F. Mecklenbrauker, A. F. Molisch, J. Karedal, F. Tufvesson, A. Paier,L. Bernado, T. Zemen, O. Klemp, and N. Czink, “Vehicular channelcharacterization and its implications for wireless system design andperformance,” Proceedings of the IEEE, vol. 99, no. 7, July 2011.
[16] L. Cheng, B. E. Henty, D. D. Stancil, F. Bai, and P. Mudalige, “Mobilevehicle-to-vehicle narrow-band channel measurement and characteriza-tion of the 5.9 ghz dedicated short range communication (dsrc) frequencyband,” IEEE Journal on Selected Areas in Communications, vol. 25,no. 8, pp. 1501 – 1516, October 2007.
[17] O. Renaudin, V.-M. Kolmonen, P. Vainikainen, and C. Oestges, “Non-stationary narrowband mimo inter-vehicle channel characterization inthe 5-ghz band,” IEEE Transactions on Vehicular Technology, vol. 59,no. 4, pp. 2007 – 2015, May 2010.
[18] M. Boban, T. T. V. Vinhoza, M. Ferreira, J. Barros, and O. K. Tonguz,“Impact of vehicles as obstacles in vehicular ad hoc networks,” IEEEJournal on Selected Areas in Communications, vol. 29, no. 1, pp. 15 –28, January 2011.
[19] J. Karedal, F. Tufvesson, N. Czink, A. Paier, C. Dumard, T. Zemen,C. F. Mecklenbrauker, and A. F. Molisch, “A geometry-based stochasticmimo model for vehicle-to-vehicle communications,” IEEE Transactionson Wireless Communications, vol. 8, no. 7, pp. 3646 – 3657, July 2009.
[20] J. Maurer, T. Fugen, and W. Wiesbeck, “Narrow-band measurement andanalysis of the inter-vehicle transmission channel at 5.2 ghz,” in IEEEVehicular Technology Conference (VTC), 2002, pp. 1274–1278.
[21] I. Sen and D. Matolak, “VehicleÐvehicle channel models for the 5-ghzband,” IEEE Transactions on Intelligent Transportation Systems, vol. 9,no. 2, pp. 235 – 245, June 2008.
[22] X. Jin, W. Su, and Y. Wei, “Quantitative analysis of the vanet connectiv-ity: Theory and application,” in IEEE Vehicular Technology Conference(VTC) Spring, May 2011, pp. 1–5.
[23] J. Gozalvez, M. Sepulcre, and R. Bauza, “Impact of the radio channelmodelling on the performance of vanet communication protocols,”Telecommunication Systems, pp. 1 – 19, December 2010.
[24] R. Protzmann, B. Schunemann, and I. Radusch, “The influences of com-munication models on the simulated effectiveness of v2x applications,”IEEE Communications Magazine, vol. 49, no. 11, nov 2011.
[25] SUMO - Simulation of Urban MObility. [Online]. Available:http://sumo.sourceforge.net
[26] Performance measurement system (PeMS). [Online]. Available:http://pems.dot.ca.gov/
[27] S. C. Ng, W. Zhang, Y. Zhang, Y. Yang, and G. Mao, “Analysis of accessand connectivity probabilities in vehicular relay networks,” SelectedAreas in Communications, IEEE Journal on, vol. 29, no. 1, jan 2011.
[28] L. Cheng, B. E. Henty, F. Bai, and D. D. Stancil, “Highway and ruralpropagation channel modeling for vehicle-to-vehicle communicationsat 5.9 ghz,” in IEEE Antennas and Propagation Society InternationalSymposium, July 2008, pp. 1–4.
[29] J. Epstein and D. Peterson, “An experimental study of wave propagationat 850 mc,” Proceedings of the IRE, vol. 41, no. 5, pp. 595 –611, may1953.
[30] J. Deygout, “Multiple knife-edge diffraction of microwaves,” Antennasand Propagation, IEEE Transactions on, vol. 14, no. 4, pp. 480 – 489,jul 1966.
[31] C. Giovaneli, “An analysis of simplified solutions for multiple knife-edgediffraction,” Antennas and Propagation, IEEE Transactions on, vol. 32,no. 3, pp. 297 – 301, mar 1984.
[32] “Propagation by diffraction,” International Telecommunication UnionRadiocommunications Sector, Geneva, p. P.526, Feb 2007.
1779