
Van Lanschot NV Annual Report 2018 · total amounts may deviate from the sum of the parts....
221
Van Lanschot NV Annual Report 2018
Transcript of Van Lanschot NV Annual Report 2018 · total amounts may deviate from the sum of the parts....

Van Lanschot NVAnnual Report 2018

NOTES TO THE READER�Unrounded�figures�The management report uses unrounded figures and the total amounts may deviate from the sum of the parts. Percentage changes are based on these unrounded figures.
Disclosure�of�Non-financial�Information�ActThe Disclosure of Non-financial Information Act is a Dutch regulation that made reporting on a number of non-financial themes compulsory for companies that qualify as large public-interest entities (grote organisatie van openbaar belang) with more than 500 employees. These themes comprise environmental, social and employee issues, as well as anti-corruption, bribery and human rights. For each of these themes, companies are obliged to report on the relevant policies, results, risks (including management of these risks), and non-financial key performance indicators. The regulation also requires companies to describe their business models in their annual reports. If a legal entity’s non-financial information is included in the directors’ report of its consolidating parent company, the relevant subsidiary will be exempt from any obligation to disclose non-financial information. With the disclosure of non-financial information in Van Lanschot Kempen NV’s annual report, Van Lanschot NV is under no obligation to disclose non-financial information in this directors’ report.
Global�Reporting�InitiativeCommunicating transparently on our policies and results is an important element of CSR. To ensure this, our annual report has been prepared in accordance with the GRI Standards: "Comprehensive option". See the GRI table on our website for further details: vanlanschotkempen.com/responsible/external-assessment.
External�assessmentVan Lanschot Kempen’s CSR performance is assessed by a variety of external organisations. For more information, see vanlanschotkempen.com/responsible/external-assessment.

Contents
About�Van�Lanschot�Kempen�About Van Lanschot Kempen How we create value in the long term
StrategyVan Lanschot Kempen's strategic transformation Trends and developments Next phase in Van Lanschot Kempen's strategy
Business�themesEconomic and regulatory environment Solutions for clients Digitalisation and advanced analytics Responsible business Our people
Progress�reportPerformance Van Lanschot Private Banking Evi van Lanschot Kempen Asset Management Kempen Merchant Banking Private equity investments Risk and capital management Remuneration
Report�of�the�Supervisory�Board�
Corporate�governance
Executive�and�Supervisory�Boards�Personal details of members of the Executive Board Personal details of members of the Supervisory Board
Reconciliation�of�IFRS�and�management�reporting
Financial�statementsConsolidated statement of financial positionConsolidated statement of incomeConsolidated statement of comprehensive incomeConsolidated statement of changes in equityConsolidated statement of cash flows
NotesSummary of significant accounting principlesBasis of consolidationSummary of significant accounting policiesRisk managementNotes to the consolidated statement of financial positionNotes to the consolidated statement of incomeRelated partiesDisclosure of interests in other entitiesCommitmentsSegment informationCompany statement of financial position at 31 December 2018Profit appropriationRemuneration of the Statutory and Supervisory BoardsEvents after the reporting period
Other�informationIndependent auditor’s reportProfit appropriationGlossary
47
91012
1617181921
2436384043454756
59
66
7073
76
7879808183
859394
103132157165166174176180201202205
207215216
This 2018 annual financial report of Van Lanschot NV has been prepared to comply with Dutch law. Van Lanschot NV is a 100% subsidiary of Van Lanschot Kempen NV. In this report, Van Lanschot Kempen refers to Van Lanschot NV and its subsidiaries.
Van Lanschot Kempen is the oldest independent financial institution in the Netherlands. Our history is deeply intertwined with the history of the Low Countries and the people that represent them. Founded originally in Antwerp in the 17th century, Van Lanschot Kempen embodies the bloodstream of several entities; the common thread that links us all is trade.
Our purpose is the preservation and creation of wealth, in a responsible way, for our clients and the societies we serve.
We believe that wealth is not just about financial assets; essential as it may be, wealth is about all the things that we value in life. In a broader sense, wealth represents the collective wisdom of a society and the cultural norms and values that sustain it. Although our primary objective is to help our clients with the financial aspects of wealth, we endeavour to serve their broader objectives as well. We do this through our Foundation, our sponsorships, and our work on sustainability issues.
As a company, we believe that the generation of wealth – and the re-distribution of it through taxation – are critical to the process of creating and maintaining stable, successful societies. We also believe that the rule of law and stable societies are intertwined. Without a stable society, it is near impossible to generate wealth responsibly. The reverse is also true: societal or common wealth helps create stable societies. Given that societal cohesion necessitates that wealth creation, we believe that wealth management cannot be the preserve of a few but a necessity for all.
This view is reflected in our approach to our clients. As a company, we serve clients across the social spectrum and in several segments – private, institutional and corporate clients – with a singular mission: to be a trusted partner, and to assist our clients in preserving and creating wealth responsibly. We believe that serving the long-term interests of our clients helps create a platform for responsible investing and societal stability.
Our�values�Values and principles are important and essential to any successful enterprise. We are no exception. These values drive our decision-making process and our code of conduct. In turn, they define who we are and what we stand for. As a company, we believe in the following core values:
– Entrepreneurial�spirit: In our day-to-day pursuit of lifeand business, we strive to be entrepreneurial andinnovative. We believe that respecting differences whilechallenging each other to do our best for our clients andfor each other is crucial to the process of beingentrepreneurial.
– Craftsmanship: Craftsmanship underpins ourcommitment as professionals in our field of expertise toour clients. It simply cannot be otherwise. In and ofitself, craftsmanship represents a broader range ofvalues, including knowledge, expertise and integrity. Weembrace it with all its myriad characteristics.
– Dedication: We also believe in the power of anindividual to make a difference for the better. It is thepursuit of dedication at an individual level within ourgroup that ensures that we collectively reach our fullpotential, and in doing so make a difference to ourclients and society at large.
– Discretion: We believe in the importance of privacy atan individual, institutional and societal level. Weunderstand that notions of privacy are undergoing achange in this era of social media and digitaltransformation. We believe that respecting the privacyof our clients is key to earning their trust. We havetherefore defined discretion as a core value.
– Specialisation: As a company, we have chosen tospecialise in areas of our core expertise in privatebanking, asset management and merchant banking.Specialisation helps us to focus on what we do well andeschew all that is peripheral to the needs of our clients.
We believe that these values define what we do, and help us to serve our clients best.
About Van Lanschot Kempen 4
ABOUT VAN LANSCHOT KEMPEN

About Van Lanschot Kempen 5
Key�reasons�for�clients,�employees�and�investors�to�choose�Van�Lanschot�KempenAs a wealth manager, Van Lanschot Kempen builds on the experience of its core activities, operating under the strong brand names Van Lanschot, Evi van Lanschot and Kempen.
Reliable�reputation�and�rich�history– Clear choice for wealth management, targeting private,
institutional and corporate clients– Tailored, personal and professional service– Mutually reinforcing core activities, each with its own
distinct culture and positioning as a niche player– High level of interaction between business units to
create innovative solutions for clients– In-house, specialist asset manager with multiple
differentiating investment strategies and fiduciary expertise
– Strong track record in transformation processes and de-risking of the company
– Relatively small-scale organisation and high level of executive involvement
– Inspiring and professional work environment– Strong belief in corporate social responsibility and
responsible investing
Sound�financial�and�risk�management– Strong capital position and balance sheet– Capital increasingly freed up by winding down corporate
loan portfolio– Increased focus on core activities, creating opportunities
for further growth
Key�investor�information
Van�Lanschot�Private�Banking�– Tailored, proactive and
transparent personal wealth management services
– For entrepreneurs, family businesses, high net-worth individuals, business professionals and executives, healthcare professionals, foundations and associations
– Discretionary asset management, investment advice, financial planning, savings and deposits, structured products and lending
– Offices in the Netherlands, Belgium and Switzerland
Kempen�Merchant�Banking– Equities research and
trading, capital market transactions, corporate finance, and debt advisory services for corporate and institutional clients
– Focus on European corporates and worldwide institutional clients; sectors covered are real estate, life sciences, financial institutions & fintech, infrastructure, maritime & offshore, and the Benelux region
– Offices in the Netherlands, Belgium, the UK and the US
Evi�van�Lanschot�– Online wealth management
services for the mass affluent and Millennials
– Online wealth management solutions, discretionary asset management, savings and pension solutions
– Focus on the Netherlands and Belgium
Kempen�Asset�Management– Comprehensive fiduciary
wealth management services
– Long-term focused niche investment strategies: high-dividend equities, small-caps, real estate, infrastructure, credits, government bonds, sustainable value creation, funds of hedge funds and private markets
– Focus on European clients: institutional, wholesale distribution, family offices and endowments
– Offices in the Netherlands, the UK and France
Key figures 2018 2017
Net result (€ million) 80.3 94.9
Underlying net result1 (€ million) 103.0 112.3
Efficiency ratio, excluding special items (%) 79.4 76.2
CET 1 ratio (%) 21.4 20.3
Return on average CET 1 based on underlying net result (%) 9.8 10.4
Balance sheet total (€ billion) 14.0 14.7
Total loan portfolio (€ billion) 8.6 9.1
Client assets (€ billion) 81.2 83.6
Assets under management (€ billion) 67.0 69.02
Employees (FTEs at year-end) 1,621 1,658
1 The underlying net result is the net profit adjusted for one-off charges related to the costs incurred for the Strategy 2020 investment programme and restructuring. 2017 also adjusted for a one-off charge for the derivatives recovery framework.
2 As of 1 January 2018, €0.2 billion in AuM has been transferred to AuA. The comparative figures for 31 December 2017 have been adjusted accordingly.

About Van Lanschot Kempen 6
Income�from�operating�activities,�by�segment�(€�million)
265.7
99.8
58.9
44.323.5
499.2
Private Evi Asset Merchant Corporate Other 2018 Banking Manage- Banking Banking total ment
6.9
Private Evi Asset Merchant Corporate Other 2018 Banking Manage- Banking Banking total ment
Underlying�net�result�(€�million)
40.4
27.5
17.3
103.0
13.8
10.6
–6.6
The graphs below show the key data per brand or business activity.
Assets�under�management�(€�billion,�at�year-end)
Private Banking discretionary Private Banking non-discretionary
Evi Asset Management
2014 2015 2016 2017 2018
45.5
10.1
12.5
69.0
0.9
44.8
9.4
11.8
67.0
0.9
44.1
27.5
8.4
8.2
32.8
8.4
8.3
50.3
0.7
34.8
9.0
10.0
54.6
0.8
FTE�overview�(1,621�total)
Private Banking Evi Asset Management Merchant Banking Other
508
110
28
754
221
About Van Lanschot Kempen 7
HOW WE CREATE VALUE IN THE LONG TERM
Wealth enables our clients to achieve their business, personal and social goals. Wealth generation is essential to create and maintain stability in our society. This requires a long-term focus in which economic, social and environmental aspects all need to be taken into account.
Our value creation model on page 8 provides an overview of our impact and the value we create in the long term. The model is organised into five columns: input, business model, output, outcome and impact. Our strategy, influenced by trends and stakeholder interests3, results in the inputs and business model. The outputs and outcomes show the result of the allocation of inputs and our business model over the past financial year. These relate to short-term impacts. Most of our key performance indicators (KPIs) can be found in these columns, the results of which are explained in the "Performance" section on page 24, and mentioned along with our material topics, themes and risks on pages 13-14 and in our CSR Supplement. The last column captures the societal relevance and long-term impact we aim to achieve. We aim to mitigate negative impacts (as we also take social and environmental criteria, such as human rights and climate change, into account in our activities) and to enhance our positive impact (via sustainable and impact investing solutions). We also work with several external parties to encourage this (see our CSR Supplement for more information).
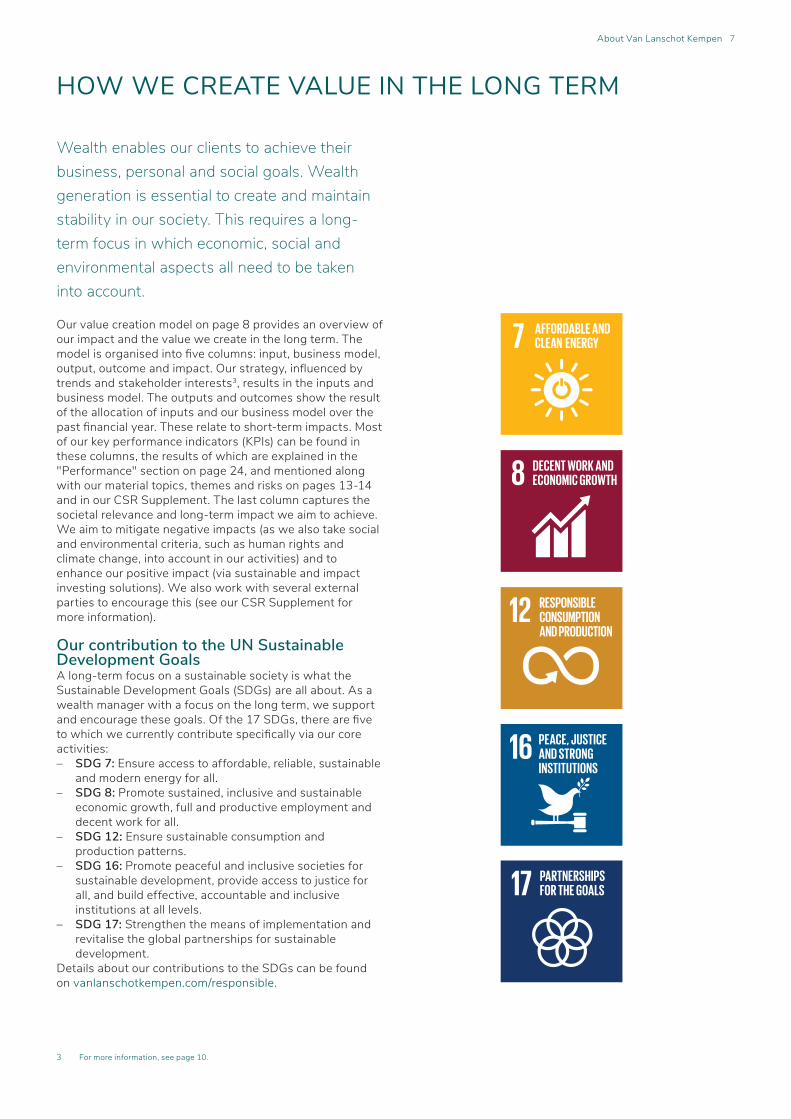
Our�contribution�to�the�UN�Sustainable�Development�GoalsA long-term focus on a sustainable society is what the Sustainable Development Goals (SDGs) are all about. As a wealth manager with a focus on the long term, we support and encourage these goals. Of the 17 SDGs, there are five to which we currently contribute specifically via our core activities:– SDG 7: Ensure access to affordable, reliable, sustainable
and modern energy for all.– SDG 8: Promote sustained, inclusive and sustainable
economic growth, full and productive employment and decent work for all.
– SDG 12: Ensure sustainable consumption and production patterns.
– SDG�16: Promote peaceful and inclusive societies for sustainable development, provide access to justice for all, and build effective, accountable and inclusive institutions at all levels.
– SDG 17: Strengthen the means of implementation and revitalise the global partnerships for sustainable development.
Details about our contributions to the SDGs can be found on vanlanschotkempen.com/responsible.
3 For more information, see page 10.

HOW WE CREATE VALUE
Human capital–� �Knowledge�of�economies,�capital�markets�and�sectors
–� �Strong�advisory�skills–� ����1,707�employees,�average�age�of�43.8,�64%�male�and�36%�female
–� �€4.5m�spent�on�training�and�development
–� �€0.3m�spent�on�employee� well-being
Contribution to achievement of clients’ business, personal and
social goals
High quality employment and
development opportunities
Positive business environment
More responsible companies and financial sector
Social engagement
Contribution to the Sustainable
Development Goals (SDGs)
Investment in employees–� �51%�of�employees�participated� in�Vitality�Programme
–� �Average�time�spent�on�training:� 9.7�days�per�FTE
–� 2.7%�absenteeism–� 13%�employee�turnover�
Social capital–� �Our�history,�brands�and�reputation�–� �Our�values:�entrepreneurial�spirit,�craftsmanship,�dedication,�discretion�and�specialisation�
–� �Expectations�of�our�stakeholders–� Approx.�€2m�spent�on�sponsorships
Continuous effort in meeting stakeholder expectations–� �Launch�of�6�new,�innovative�wealth�management�solutions�
–� Networking�events�for�clients–� Memberships�of�associations–� Stakeholder�dialogues–� 91�engagement�cases�
Stable, long-lasting relationships–� �Client�satisfaction�
– NPS PB: 2 – NPS Evi: –20 – NPS AM: 44 (2017)
–� �Long-lasting�client�relationships�–� �Stable�shareholder�base–� �High�positions�in�rankings�and� benchmarks
Financial capital–� Client�assets�€81.2bn – AuM €67.0bn – Savings and deposits €9.1bn
–� �Capital�base�and�wholesale�funding� – Share capital €1.3bn – Wholesale funding €2.6bn
Performance –� Performance�for�clients� – PB: average 3-yr performance vs.
benchmarks of –0.1% – AM: Average Morningstar
rating investment strategies of 4.0 – Evi: Average 3-yr performance vs.
benchmarks of –0.4% – MB: €37bn of M&A, debt advisory
and ECM transactions in 10 countries – €5.8bn in mortgages, €2.9bn in
other loans– Financial�performance – Net result €80.3m – 79.4% efficiency ratio
Achieving sustainable growth–� Net�inflow�of�AuM�€1.0bn–� �Growth�of�sustainable�and�impact� investing�15%�to�€1.3bn� (Private�Banking)
Manufactured and environmental capital–� �€22.0m�spent�on�investment�programme
–� �11�offices�and�21�client�reception�facilities
– 444 lease�cars,�609�public�transport�subscriptions
– 4,570 flights�
Focus on digitalisation–� �Digitalised�services�and�applied�advanced�analytics
– Innovative client features – Increase in sales effectiveness
Environmental output**–� �Carbon�emissions – AuM: 3.8m tonnes CO₂ – Balance sheet: 60,949 tonnes CO₂ – Own organisation: 4,679 tonnes CO₂
Skilled, motivated staff–� �Employee�engagement�survey�score:�� 81%�(2017)***�–� �Employer�NPS:�***
Improved operations–� Omni-channel�client�experience – 72% PB clients accessed online
portal – 21% PB clients with an
investment product downloaded an investment app to gain insight
Decrease in environmental footprint–� ��Decrease�in�carbon�emissions�vs.�
last�year – Decrease of 17% CO₂ emissions in
balance sheet – Decrease of 11% absolute CO₂
emissions in our own organisation
INPUT BUSINESS MODEL IMPACT*OUTCOMEOUTPUT
Preserving and creating long-term wealth
Private Banking, Evi and Asset Management clients
Client assets
Wealth management solutions
Banking solutions
Merchant Banking and Private Banking clients
–� Fiduciary�management�–� Investment�solutions�–� Investment�strategies
–� Savings�and�deposits–� Lending–� Payments
Performance Fee
Fee
Interest
–� Advisory�services–� Access�to�markets�and�liquidity–� Research
2018 figures
SecuritiesCorporate Finance
Equity Capital Markets
* For examples see vanlanschotkempen.com/responsible/policy.
** Our carbon measurement covers about two-thirds of our balance sheet and around half of our AuM. The figures are best estimates and will be further refined next year; for more information, see page 20.
*** We did not conduct an employee engagement survey in 2018. This means there is no 2018 data on the level of employee engagement, nor an Employer NPS.

Strategy 9
VAN LANSCHOT KEMPEN'S STRATEGIC TRANSFORMATION
Our transformation began in 2013, when we chose to position ourselves as a specialist wealth manager instead of a small universal bank.
As a wealth manager, we aim for growth in assets under management (AuM) on the one hand, while we have scaled back our corporate loan book on the other. This has led commission income to become our key source of income, while our capital position has substantially improved as our activities have become less capital intensive. The charts on this page illustrate this transformation. Our strong foundation puts us in a good position for further growth.
Underlying�net�result2�(€�million)
2012 2018
103.0
11.1
+ €91.9
Return�on�Common�Equity�Tier�13
2012 2018
9.8%
+ 22.5pps
–12.7%
Common�Equity�Tier�1�ratio3
2012 2018
21.4%+ 10.4pps
11.0%
Client�assets�and�AuM1�(€�billion)
2012 2018
81.2
52.3
67.040.9 Savings and other AuM
+ 55% 14.2
11.4
Risk-weighted�assets�(€�billion)
2012 2018
4.1
6.1
0.54.4 Private Banking and other Corporate Banking
- 56% 4.6
10.5
1 Other consists of deposits, assets under administration and assets under monitoring and guidance.
2 The underlying net result is the net profit adjusted for one-off charges related to the costs incurred for the Strategy 2020 investment programme and restructuring. 2012 has also been adjusted for an impairment on goodwill and intangible assets.
3 2012 phase-in; 2018 fully loaded.
Commission�as�%�of�operating�income�(€�million)
% commission of operating income 2012 2018
100% = 499.2100% = 525.3+ 17.5pps
41.3%
58.7%

Strategy 10
TRENDS AND DEVELOPMENTS
New trends, technologies and services are drastically reshaping our society, economy and the financial sector.
We briefly outline the most relevant developments in our operating environment below. We take these developments into account in adjusting our strategy and approach. For more details on Van Lanschot Kempen’s response to these trends and developments, see the sections under “Our business themes”.
� � Societal�change Importance�of�self-relianceThe average age of the Western European population will increase over the next few decades, and this is expected to put pressure on the current social system. In the near future, it is therefore expected that self-reliance will become more important; the supporting role of the government will continue to diminish, and the role of a support network of friends and family or commercial providers will grow. People are increasingly becoming aware of the need to start building such a support network, and to acquire the means to finance their chosen solution to become self-reliant. This will increase the need for wealth management solutions at a structural level.
Shift�to�doing�goodReducing and preventing negative impact on the environment and society is encouraged, both by government and by the corporate sector. Due to the attention that NGOs, governments and media are giving to sustainability, people are increasingly becoming aware of the consequences of non-sustainable behaviour. In the near future, we expect this “doing no harm” movement to shift towards “doing good”. Organisations are not only expected to limit their negative impact on the environment and society, but are increasingly challenged on their positive contribution. At the same time, more and more clients are demanding sustainable investments and impact investment solutions, while employees and potential employees are increasingly taking sustainability into account when considering their careers.
� � Advanced�technology Digitalisation�to�improve�client�experienceOver recent years, many processes and operations have been automated across industries. Automated processes increase efficiency and reduce the number of errors, thereby reducing costs. Jobs are increasingly changing from carrying out operations manually to overseeing and reviewing the digital process and checking the data for errors. This change has also been felt in the financial sector: many back- and mid-office activities have been automated, and the use of digital tools for monitoring has increased.
Digitalisation also enhances interaction with clients. The use of multiple communication channels allows clients to choose their preferred channel, which could significantly improve client experience.
Increasing�availability�of�dataAdvanced online services and applications allow improved data collection. Increasing data availability and computational power are opening up opportunities for advanced analytics, thereby creating insights into client needs, possible solutions and business efficiency. As the use of technology and advanced analytics increases and applications become more sophisticated, the value of the data collected increases. Advanced analytics go beyond pattern recognition, and include predictive models that can be used to suggest actions or behaviour, for example.
Having the ability to use data enables organisations to be more relevant to clients, to offer tailored products at more attractive prices, and to be more transparent about the exact details of a product. The use of data also requires organisations to change their way of working. New jobs are created, requiring a different set of capabilities and more adaptive performance. Security�of�informationAs the overall amount and quality of information and data gathered increases, information security is becoming even more critical. This encompasses both physical security (access to the premises of organisations) and online security (storage of data). Cybercrime is becoming more common, and organisations need to be able to guarantee their clients’ privacy. Investments in future-proof security measures are required, as the value of information is expected to increase even further.
� � Changing�client�needs Provide�relevant�informationTechnology allows us to be online and connected, every moment of the day, quickly leading to information overload. The need for organisations to be able to send relevant content to clients that offers the solution they need at the right moment is increasing. The information provided to clients needs to be customised, brief and clear, and include a call to action. Additional content should be easy to find if needed, and should provide sufficient information to meet the growing need for transparency.
Van�Lanschot�Kempen’s�operating�
environment
Socie
ty Clients
Technology Competitio
n
Demand�for�tailored�services�and�productsThere has been a shift from providing generic products to providing tailored services. Clients want solutions that instantly answer their needs. They prefer solutions that require minimal effort and low maintenance. Transparency, ease of access and use, and immediate availability are key. This has caused industries to integrate: via one organisation’s platform, clients can acquire related services/products from other organisations.
The institutional sector has also seen a change in demand for products and services. Fiduciary mandates are increasingly being broken down into sub-parts, with clients choosing which types of services they would like to obtain instead of buying the full package. In addition, some fiduciary clients are more involved in the actual set-up of the investment mandate to make sure that the investments fit perfectly in line with their requirements.
Passing�down�wealth�to�the�next�generationAs time passes, new generations will inherit their elders’ wealth and acquire their own. As with all service providers, wealth managers depend on their abilities to build relationships with their current and future clients. Different generations have different preferences regarding services and products, and this should be acknowledged by organisations. Different attitudes, skill-sets and knowledge might be required.
� � Increased�competition Competitive�landscapeThere is strong competition for new assets among existing and new wealth managers with different business models. The higher educational level of clients and their ability to compare service providers facilitates shopping around and comparing active and passive investment solutions. In addition, fintechs and robo-advisers are entering the market with new propositions for clients, offered at low prices and making use of new technology and low-maintenance platforms.
The consolidation of the financial and wealth management industry is a trend that’s continuing due to several developments: regulation forces wealth managers to reduce or ban inducements and make fees transparent to clients; wealth concentration leads to margin compression; and the persistent low-interest environment results in lower interest income.
In addition to competition from peers, wealth managers also need to address clients’ interest in investing their wealth in a broader range of assets. Investments in start-ups or real estate have grown over recent years, reducing the assets clients entrust to their wealth manager.
Development�of�sophisticated�solutionsWealth managers are increasingly specialising and differentiating their products and solutions. The strong inflow in passive products and outflows from undistinguished, semi-active, generic investment products underlines increased client investment knowledge and transparency. In order to remain relevant and profitable, wealth managers should move away from offering undifferentiated products and focus on developing high-growth specialist products.
Strategy 11
KEY RISK THEMES FOR VAN LANSCHOT KEMPENIn addition to the trends and developments that impact our operating environment, as a wealth manager we face specific risks associated with our sector. In 2018, we identified the following key risk themes:– Financial market volatility– Cybercrime– Trust in the financial sector (e.g. anti-money laundering)– Labour marketSee the “Risk and capital management” section (page 47) for more details.

Strategy 12
NEXT PHASE IN VAN LANSCHOT KEMPEN'S STRATEGY
Today, Van Lanschot Kempen is a well-capitalised, profitable wealth manager with a strong specialist position in the market. We believe that our knowledge and experience, our personal, client-focused approach, our unique combination of activities and our track record set us apart from the competition in our selected market segments, while offering growth opportunities.
Supported by our strong client relationships, we want to be a leading player in our relevant markets and geographies. This means being:– A leading wealth manager in the Benelux region;– A prominent, active investment manager that delivers
alpha in illiquid markets, as well as income and ESG across Europe;
– The leading fiduciary manager in the Netherlands, and a challenger in the UK fiduciary market;
– The preferred trusted adviser in selected niches in merchant banking across Europe;
– The number one online wealth management alternative for the mass affluent in selected markets.
With our history as a principled, active investor, focusing on the long term, we want to move – together with our clients – from responsible investing towards sustainable investing. We can achieve the most significant social and environmental impact via our clients’ assets. We aim to increase our positive contribution and the visibility thereof.
We have set our financial targets for 2023. To reflect both our wealth management profile and the economic environment in which we operate, we have redefined our efficiency ratio target: – CET 1 ratio: 15-17%;– RoCET 1: 10-12%;– Efficiency ratio: 70-72%;– Dividend policy: 50-70% of underlying net result
attributable to our shareholder.
We will maintain our solid risk profile with a moderate risk appetite. Over the years, we have developed a strong capital base. Our CET 1 ratio currently stands at 21.4%, well above our target level. In the future, we aim to optimise our capital base in terms of level and type of instruments, while leaving room for potential acquisitions.
Strategic�pillars�We have taken successful steps in simplifying and focusing our business model, yet we see the need to continue our transformation. Changing client needs, societal change, advanced technology, and increased competition all change our operating environment. We need to respond to these changes in order to deliver on our promises. For this purpose, we have defined four strategic pillars.
Accelerate�growth�–�organically�and�inorganicallyIn order to remain relevant for our clients and accelerate our organic growth, we believe that we have to truly understand our clients, anticipate their needs, and help them to fulfil these needs in a sustainable manner. Instead of searching for a single product or a specific brand, which demands a product-led approach, clients are looking for a solution that fulfils multiple needs.
On the back of a surge in personalised individual online experience in several sectors, clients – whether private individuals or professionals representing institutional clients – expect a higher level of personalisation in the financial sector as well. This is why we will shift to a solutions-led approach, in which a solution can consist of several building blocks that together answer the clients' needs.
In recent years, we have successfully expanded our activities through selective bolt-on acquisitions and hiring teams. Our high post-acquisition client retention rates show that clients value our proposition. Moreover, we have expanded our client offering with additional solutions following on from these acquisitions. We will consider acquisitions to accelerate our growth and increase our scale.
Activate�our�full�potentialIn order to unlock the full potential of our solutions-led organisation for our clients, we must be able to offer solutions that build on the knowledge and expertise of the entire group as well as our open architecture platform. This will enable us to better grasp opportunities, and to be flexible and adaptive in responding to our clients’ needs. We will further develop our client segmentation based on these needs. We believe that by providing clients access to the full range of services and products across our business lines, we will be able to fulfil client needs in a sustainable manner. Acting as one allows us to benefit from knowledge sharing, to make optimal use of resources across the organisation, and to reduce overlap.
Advance�through�digitalisation�and�analyticsChanges in clients’ needs and economic developments require us to react quickly. Streamlined products, processes and systems are a prerequisite for this. Technology and digitalisation will allow us to improve our productivity and service, by speeding up processes, reducing operational errors and improving the availability and quality of data. Digital interaction is also key to our omni-channel approach in Private Banking, as it offers both clients and employees increased flexibility in terms of means of communication and the time needed to communicate. We will roll out our digital programme across all business segments, so other client groups can benefit as well.
In order to truly understand our clients’ needs and offer them suitable solutions, we will apply advanced analytics. To grasp the full potential of patterns in internal and external data, tooling is being developed that helps end-users to interpret data and use it for data-driven decision-making in commercial processes, investment processes and operational processes. Insight into patterns of behaviour will enable early detection and improved identification of client needs. Supported by frequent human contact, this will strengthen our client relationships.

As the €60 million Strategy 2020 investment programme will come to a close in 2019, further investments will be funded from our current cost base.
Adapt�the�workforceOur people’s knowledge, experience and professionalism are key to the way we operate. Investing in our people will enable them to embrace technology and adopt a more data-driven way of working and decision-making.
We will facilitate and encourage development and training of our existing workforce. Together, we need to optimise the use of advanced analytics, to embrace technology and to work in a more agile manner. We will also hire new talent to bring different skills and capabilities into the organisation that will help drive our development and the changes required to stay ahead.
How�we�steer�our�businessDuring 2018, a new set of key performance indicators (KPIs) was developed, focusing on the creation of long-term value. The various steps in developing these are described below.
Our�themes�and�missionBased on strategic relevance, client needs, stakeholder interests, and industry trends and developments, we have defined six overarching themes, which all contribute to our mission. The six themes and our mission include the "most material" and "material" topics (see below) indicated by our stakeholders. For more information on materiality, see our CSR Supplement.
Three themes lay the foundation for our operations: – Financial�and�risk�management: These are key to our
organisation, as all stakeholders benefit from a solid capital position and sustainable performance.
– Ethics�and�integrity: We operate in an ethical manner, and encourage our employees to behave ethically and with integrity.
– Licence�to�operate: For us, business as usual means operating in line with the law, regulations and other generally accepted norms.
Three themes aim to create significant impact for our stakeholders: – Client�relations: We differentiate ourselves from our
competitors through our personal approach, in which we focus on long-term client relationships and on aspiring to be a trusted guide to our clients. We aim to improve our client experience by further digitalising our operations, processes and communication channels.
– Responsibility�and�sustainability: We see clear opportunities to create positive economic, environmental and social impact by investing the wealth of our clients in a responsible and sustainable manner. Clients are increasingly looking for these types of investments, and we will expand our range of sustainable investment solutions accordingly.
– Employees: We aim to be an attractive employer. As our employees are key to the success of our organisation, we invest in their training, development and health.
All six themes contribute to our mission:– Preservation�and�creation�of�wealth: We preserve and
create wealth for our clients and society, which requires our wealth management solutions to deliver positive, long-term performance.
Our performance on these themes and mission is measured via 59 financial and non-financial KPIs, of which 15 are reported externally. The complete list of KPIs is an integral part of our internal management information.
KPI�definition�processIn the diagram below, the interconnectivity between our strategy, themes, material topics and KPIs is shown.
We report externally on the most material topics, which form part of our mission and all themes except "Licence to operate"; information on these topics is included in this report on page 24. We do not report on the other six material topics externally because they relate to our “Licence to operate” theme – in other words, they relate to business as usual.
Strategy 13
External�KPIs
Internal�KPIs
Our strategy
Our�ambitions
Client�needs
Stakeholder�interests�
Industry�trends
Our�themes�and�mission� � Related�material�� � � � topics�as�stated�on��� � � � page�14
– Financial and risk management – Ethics and integrity– Licence to operate– Client relations– Responsibility and sustainability– Employees– Mission: Preservation and
creation of wealth
1 2
11
4 5 8 9 10 12
3
6 7
13
3

Strategy 14
Themes� and�mission
KPIs Most�material�topics�covered�(p.�24)
Targets
Financial�and�risk�management
1. CET 1 ratio (fully loaded) 1 and 2 15-17%5
2. Return on equity (CET 1) 1 and 2 10-12%5
3. Efficiency ratio 1 60-65%5
Ethics�and�integrity
4. Percentage of employees who feel the responsibility to act and behave ethically
11 > industry average
Client�relations 5. Net Promoter Score (NPS): a. Private Banking b. Evi c. Asset Management
3PB: 10Evi: 10AM: 20
Responsibility�and�sustainability
6. Private Banking: AuM invested in sustainable and/or impact investment wealth management solutions
7 > last year
7. Engagements with companies in which our funds invest 6 80-100 engagements
8. Asset Management: percentage increase in (internal and external) fund managers on our approved list that are scored on their overall sustainability profile
6 and 7 > last year
9. Decrease in carbon emissions: a. Direct emissions of our own organisation b. Indirect emissions via our balance sheet (mortgage portfolio)
7- 2.5%/FTE per year- CO2/€ < last year
Employees 10. Employee engagement score 13 > 80%
11. Employer Net Promoter Score (eNPS) 13 > 10%
12. Gender balance in management positions 13 > 30% female > 30% male
Mission:�Preservation� and�creation�of�wealth
13. Private Banking: 3-year performance of discretionary management mandates 3 > benchmark
14. Evi: 3-year performance of discretionary management mandates 3 > benchmark
15. Asset Management: average Morningstar rating of investment strategies (institutional share class)
3 > 3.5
5 Our 2020 financial targets applied to 2018. As of 2019, we are setting targets for 2023 (see page 12 for more information).
Strategy 15
VAN LANSCHOT KEMPEN FOUNDATION We want to support community projects that help create a better world for future generations. To do this more effectively, we have brought initiatives that were already running within Van Lanschot NV and Kempen together in one organisation: the Van Lanschot Kempen Foundation. The Foundation was officially launched in November 2016 and saw a good second year in 2018. An important feature of our Foundation activities is that we always seek to combine a financial donation with the – pro bono – deployment of Van Lanschot Kempen staff. By doing so, we hope to make a positive impact on society as well as on our employees. Participation in Foundation activities connects our staff to new people and unfamiliar situations, resulting in new experiences and energy. Over the year, hundreds of employees participated in around 20 different projects.
The activities of the Foundation focus on four themes: financial education and talent development, health, art and culture, and social cohesion via sport. The aim is to make the largest possible positive impact on people who need our support. To ensure these activities are carried out professionally, we prefer to cooperate with specialist partners, such as JINC, Hartstichting, Humanitas, De Zonnebloem, Amsterdam Cares, Bart de Graaff Foundation, I-Sport Special, IEX Scholenstrijd and many others.
The Foundation has a board, comprising six employees and a member of the Van Lanschot Kempen Executive Board (Richard Bruens), as well as a large group of ambassadors throughout the organisation. In 2019, Richard Bruens will be succeeded by Godfried van Lanschot, who was a member of the Supervisory Board until 2018. We expect to further expand the Foundation’s impact in 2019. For further details on the Foundation and its annual report, see vanlanschotkempen.com/en/vlkf.
SPONSSPONSORSHIP Arts sponsorship is an integral part of our market positioning as a wealth manager. The support we give to the arts, artists and museums helps to both preserve and expand our cultural heritage. In January 2018, we announced a five-year partnership with Het Concertgebouw in Amsterdam that will see Van Lanschot Kempen NV act as its main sponsor from 2018. This partnership is a perfect fit with our focus on creating and preserving wealth in the broadest sense of the word. It enables us to support the wonderful experience offered to audiences at Het Concertgebouw – a place where people enjoy very special moments together. Van Lanschot Kempen has been an official partner of the Van Gogh Museum in Amsterdam since 2015. This partnership allows our clients to enjoy both the museum’s beautiful collection and its world-class exhibitions. The Van Lanschot Kempen Art Prize is presented to a mid-career contemporary artist whose work best conveys the spirit of age to future generations. In the reporting year, the structure of the prize changed and we now work with jury selection of candidates. In 2018, the prize was awarded to Mark Manders. We are also a partner of the Nieuwe Kerk in Amsterdam, where the winner of the Van Lanschot Kempen Art Prize has an exhibition in 2019.
In line with Evi’s positioning towards specific client groups, we sponsor various initiatives: women’s beach volleyball duo Madelein Meppelink and Sanne Keizer, who won the European title in July 2018; and Justdiggit, which supports projects that contribute to cooling down the planet.
Kempen is the principal sponsor of the Nereus rowing club. We also sponsor the Holland Festival – an international event for theatre, music, dance, opera, film and the visual arts in Amsterdam. Both sponsorships will end in the course of 2020, as we will review Kempen's sponsorships and leverage our sponsorships within Van Lanschot Kempen as a whole.
Business themes 16
BUSINESS THEMES
New trends, technologies and services are reshaping our society, the financial sector and our operating environment. Our responses to the most relevant developments are covered by our business themes.
Economic�and�regulatory� environment�Both the economic environment and ongoing regulatory developments are important in shaping a stable financial system. As a specialist wealth manager, our business is strongly affected by the economy – both in Europe and globally. Equally, our work must comply with a number of regulations, for example relating to our duty of care towards our clients.
Economic�trendsThe global economy in 2018 was relatively strong, but this was not always reflected in the performance of equity markets, especially in Q4. Growth in the US meant that the US Federal Reserve raised interest rates, while economies in emerging markets remained in flux. Europe occupies a position in between: there are solid fundamental conditions for sustained economic growth, but interest rates remain low as inflation rates remain below the European Central Bank’s targets. Growth and political uncertainties increased as 2018 developed, with fallout over Brexit, the political situation in Italy, and tensions between the US and China all having an impact – more so in Europe than elsewhere.
The economy in late 2018 and early 2019 can be characterised by three clear trends:– Desynchronisation: Inequalities between different
markets and sectors mean that various global economies are responding differently to market shifts. EU markets were the first to show tension, but by the end of 2018 the US proved not to be immune either.
– Politicisation: While politics have slowly come to exert more influence over the economy over the last couple of years, 2018 was the first year in which investors could no longer ignore the politicians. Political debates about populism, deregulation and globalisation are effecting a shift from monetary policy to fiscal policy.
– Normalisation: While some economies (the US, in particular) have normalised more quickly than others following the 2008 financial crisis, overall normalisation means that we are slowly starting to see growth in inflation and wages. But the situation remains fragile, as doubts about sustainable economic growth illustrated in the last few weeks of 2018.
Impact�on�our�clientsThe corporate sector has been doing well over the past year – with above-average margins, strong cash flow, and money being returned to shareholders. During the last few months of the year, however, equity markets declined on the back of the trade tensions between the US and China and uncertainty around Brexit. This led to negative price
movements in our clients’ investment portfolios as well. Of course, there are differences in investment horizons and risk appetites between institutional and private clients – and these lead to differences in impact.
Historically low interest rates in the Netherlands have had an impact on the Dutch housing market, and by extension on private clients, some of whom have been investing in real estate as an alternative to lower-yield investments and savings. Growth uncertainty and higher policy rates combined to make for an eventful end to 2018. As markets were illiquid, this amplified volatility. The base case is one in which growth can be sustained and market moves offer private clients more opportunities to diversify. Interest rates are still low, but credit spreads have widened. Lower equity multiples mean that equities will still deliver higher returns than lower-risk assets over the long term. The difference in returns will, however, continue to shrink as corporate margins revert back to average. If inflation begins to rise, there will be opportunities to take advantage of assets that have shorter maturities and/or offer compensation for inflation.
Institutional investors may react in different ways: either taking on greater risks due to the strong economy, or becoming more prudent due to political uncertainty. Looking for new opportunities to generate yield – such as through impact investing or infrastructure funds – is more important than ever. And portfolios that comprise a variety of different asset classes are almost always a safe choice.
Regulatory�environment�Like other financial institutions, Van Lanschot Kempen has to deal with a large number of complex guidelines and regulations. In 2018, we faced the implementation of several new regulations. We finalised the implementation of the Markets in Financial Instruments Directive II (MiFID II), the General Data Protection Regulation (GDPR) and the new accounting standard IFRS 9 for financial instruments. All of these were major and potentially impactful changes, but we were able to implement them on schedule, and the ultimate impact is relatively limited. Finally, we’ve performed a comprehensive analysis of the finalised Basel reform package, referred to as Basel IV. For more information, see the “Risk and capital management” section on pages 47-55.
In terms of regulations, 2018 was an exceptional year, with several major changes running in parallel – putting severe pressure on our resources and infrastructure. In 2019, the situation will be less severe, but significant resources will still be needed. We will continue our dialogue with the National Resolution Authority on Resolution Planning, although no major impact is foreseen for this. In the regulatory domain, preparation for Brexit scenarios is on the agenda (for more information, see page 54), as well as the replacement of LIBOR and Euribor rates.
On the back of several money laundering incidents that took place in the financial industry in 2018, much public attention was paid to the role of banks in detecting any form of money laundering in the financial system. This is adding pressure on financial institutions to play their role as gatekeeper even more effectively, and we expect increased scrutiny from regulators over the coming months and years.

We have an advanced monitoring system and a team of experts in place to carry out client due diligence (CDD) and transaction monitoring. In 2018, the system received a sophisticated upgrade, by implementing advanced analytics tools to detect integrity risks. Also, given the incidents we’ve seen around us, additional assessments were made to double-check our processes. See the "Risk and capital management" section on page 54 for more information on CDD.
Solutions�for�clients Our ambition is to act as a guide for our private, corporate and institutional clients – financially, of course, but also non-financially – to help them achieve their long-term goals. In order to create this trusted relationship with our clients, we need to be relevant to them – today, tomorrow and in the future. And to do this, we need to truly understand them – who they are and what they need – so that we can help them fulfil their wishes. We believe that shifting from a product-based approach to a real solution-led approach will help both us and our clients to be successful.
Solutions-driven�approachIn order to be solutions-driven, it’s imperative that our starting points are the clients’ needs and their investment beliefs; we then co-create solutions with them that are customised to their specific wishes. As a secondary objective, we aim to create products that are useful to other clients in the future, too. Building on our vast experience, there are four elements in our solutions-driven approach:– Open�architecture: Working with an open architecture
means not only using our in-house knowledge, but also being specialists in selecting external fund managers for a mandate, for instance. This is how we create a range of high-quality options for clients, to make sure we can fulfil their needs.
– Sustainability: There is empirical evidence that sustainable portfolios are more robust in the long term. This is one of the reasons why we encourage our clients to look at the sustainability of their assets in the long term, including their social and environmental footprint.
– �Innovation: One of our goals is to use business and market intelligence to come up with investable ideas and create new categories for our internal advisers, bankers and relationship managers to bring forward and discuss with their clients.
– Simplification: Investing can be a complex process. We aim to simplify investment and asset management for our clients by essentially outsourcing the complexity to Van Lanschot Kempen.
Several examples from the reporting year show how we have brought together a combination of these elements in order to find high-quality solutions to our clients’ needs.
Family�solutionsIn 2018, our solutions-driven approach led to a group effort for our family office clients. The requirements of these clients are unique: they may have private banking needs as individuals, reporting and asset management needs from an institutional perspective, and they could be interested in private placements from Merchant Banking’s clients. In 2018, we put together a dedicated “Family Solutions” team to act as the linking pin between family office clients and the entire organisation, so that we can provide them with
the full range of our services. And their needs are the starting point for the solutions we develop.
Strategic�adviceAs part of our acquisition of UBS’s wealth management services in the Netherlands, we introduced a new proposition for Private Banking clients in which we provide strategic advice about all their assets – including a consolidated report on those assets – whether they are invested via our own propositions, third parties or in real estate, for instance. And we act as the client’s representative towards other parties, ensuring that their investment goals stay on track. In a nutshell, we offer full support and advice, management of external mandates, and monitoring of the quality of external asset managers.
Investing�in�illiquid,�private�markets�When looking for yields, people are increasingly investing in illiquid, private markets. We aim to provide solutions that make investing in private markets more accessible to all our clients:– Spinning off the management company of Van Lanschot
Participaties (at the end of 2017) opened up our private equity business to third parties, including our Private Banking clients, via a newly established fund: Bolster Investments Coöperatief U.A.
– In May 2018, we set up the Kempen Private Markets Fund. By the end of 2018, the assets under management in the fund had grown to €43 million. The fund has been attracting interest from the UK, some family offices and wealth managers, as well as new clients to Van Lanschot Private Banking.
– In 2018, we worked on the set-up of the new Kempen European Private Equity Fund. The fund was launched in January 2019 and we are already seeing interest from existing clients and prospects.
Sustainable�solutions�At Van Lanschot Private Banking and Kempen Asset Management, there is increasing demand from our clients for more sustainable solutions. We are therefore continuing to expand our impact investing services, and our Duurzaam+ sustainable discretionary management offering continues to be popular among our Private Banking clients.
In 2018, we worked on the introduction of the Van Lanschot Groenhypotheek (green mortgage) to help finance renovations to make properties more sustainable against a lower interest rate – this will be launched for clients in 2019.
CLIENT-CENTRICITYWe aim only to offer solutions that suit our clients’ needs. In addition, these solutions must be easy to understand, cost-efficient and not unnecessarily complicated. In order to balance client interests, risks and returns, we approve new products and services before they are launched via the product approval process. Products and services are tested periodically to check whether they still meet the needs of our clients. Representatives from across the organisation are involved in the approval process. The final evaluation lies with the Product Boards, in which members of the Executive Board are also represented.
Business themes 17

Many clients find environmental, social and governance (ESG) criteria as important as financial returns criteria. The long-term Sustainable Value Creation Fund, which was launched in 2017, stood at €182 million at year-end. At the beginning of 2018, we created the Kempen Global Impact Pool together with our pension fund clients – selecting the SDG criteria that are most relevant to their wishes. With an open architecture approach and by investing in the best external managers, the fund currently has €66 million in assets under management, and we expect more clients to join in the future.
Digitalisation�and�advanced analyticsPersonalised service is key to our business, and technology helps us to strengthen the quality of this service. In recent years, the use of technology to customise each individual’s online experience has become mainstream. Meanwhile, the rise in the use of mobile is a trend that’s only set to accelerate further. Van Lanschot Kempen is well positioned to take advantage of the opportunities that such trends offer – both to better serve our clients and to improve the efficiency and profitability of our business.
Data-driven�client�solutionsFor some years now, Van Lanschot Kempen has been leveraging business intelligence to truly understand the drivers behind our business. This has allowed us to extrapolate past data into future forecasts that help us to better understand client behaviour and to act on it more effectively. The next step is to use both internal and external data to predict situations and anticipate events before they happen.
There are several examples of how the use of data can improve client experience. In Private Banking, the Compass app sends bankers information that will help them to serve their clients better. Through Compass, we alert bankers of likely upcoming events so they can proactively approach their clients to discuss options, or act quickly to suggest an appropriate course of action.
At Evi, our digital capabilities are used in two main areas. On the one hand, we use advanced analytics to follow the client’s digital journey and to offer them tailored, personalised information that meets their individual needs and interests, on the website and via email. On the other, we use predictive modelling of inflow and outflow patterns to detect significant anomalies and fine-tune our client acquisition and retention processes.
Kempen Asset Management’s real estate team applies a data-driven investment process in which large amounts of data are processed into investment decision-making. Real estate data, such as distance to public transport, commuting times of employees, education levels and so on, are collected and used to improve our knowledge of the 200,000 buildings the listed real estate space comprises. Ultimately this leads to better risk-adjusted returns for our clients.
At Kempen Merchant Banking, our project to build a data warehouse was completed in 2018, allowing for more data-driven decision-making when it comes to our clients
and research. We’ve also implemented an approach that allows us to develop digital solutions and dashboards when needs arise: for example, Kempen has created dashboards that record a daily flow of market and client information, a digital planner for conferences, and dashboards that enable us to read the value of a particular client to Kempen’s business.
Personalisation�powered�by�artificial�intelligenceOur added value comes from the human interaction and personalised service we can give to our clients. While it’s difficult for algorithms to deal with complex issues and tailor solutions accordingly, tracking and interpreting a client’s financial situation is a data analytics-intensive task which can be automated and scaled across a banker’s client portfolio. By automating these tasks, bankers become more relevant and productive – and they can spend more time on where they add most value: serving clients to meet their unique needs. As a result, client satisfaction increases, leading to higher loyalty and – ultimately – a larger share of their assets being invested with us.
To support this, artificial intelligence (AI) can provide automated insights and information by analysing huge data sets that are growing all the time. On the product side, AI generally leads to fewer mistakes and is more reliable than humans, resulting in better intelligence to drive product development. On the sales and distribution side, AI can automate processes that were previously done manually, thereby creating efficiencies. For instance, we use predictive models to be able to proactively mitigate client attrition.
Digital�initiatives�and�toolsDigital tooling enables us to improve our client offering and to process the insights we gain from data analytics to make sure our response reaches the right destination. This could include changing our website content, sending a personalised email to a client, or notifying a relationship manager that they need to take action. Our aim is to be relevant for our clients – when, where and how they want – now and in the future.
CLIENT PRIVACY AND DATA SECURITYAs a wealth manager, we place a high value on our clients’ privacy – and handling large amounts of private client data is a responsibility we take very seriously. The Privacy Statement on our websites describes how we handle our clients’ personal information. We are also subject to the General Data Protection Regulation (GDPR), which came into force on 25 May 2018. We have integrated the GDPR requirements into our policies on processing personal data and into the specific processes and procedures involved. We have appointed a Data Protection Officer, and we pay regular attention to building employee awareness of client privacy and data security issues. We have also created a Privacy Framework for managing the processing and protection of personal data. Reporting according to GDPR is included in our compliance reports, and is reviewed by several committees. We have procedures in place to handle and record complaints, information requests, and any eventual breaches of client data. We have not registered any material complaints from clients or regulators relating to this in 2018.
Business themes 18

We started with our private banking business as part of our Strategy 2020 investment programme in 2016, with the aim of bringing new digital tools to other areas of the business in due course. In 2018, Van Lanschot Private Banking’s website was rebuilt, and we also launched a new “Mijn Van Lanschot” client portal. Both have a new design and are built to work seamlessly across all platforms. The website also provides tailored content to clients that is relevant to their specific needs. For example, a client who already has a mortgage with Van Lanschot would not be shown content about taking out a mortgage with us.
Our investment app now allows investment advisers to send tailored messages or push notifications to specific clients or sub-groups of clients. Meanwhile, our client service centre has also been improved so that all calls and emails are automatically scanned into the CRM system. The next time a client makes contact via whichever channel they choose, they can more quickly and easily be routed to the right person to handle their query. Group-wide�initiativesWithin the organisation, we have already started several initiatives to use advanced analytics and digitalisation to facilitate our services offering and effective distribution, as described above. The next phase in our wealth management strategy will accelerate and strengthen these activities by making them group-wide initiatives. We therefore plan to roll out our digital programme across all business segments, so that our other clients can benefit from Van Lanschot Private Banking’s omni-channel learnings, too. We have appointed a Chief Analytics Officer and a Chief Digital Officer, who will focus on implementation and development of advanced analytics tools, and on further digitalising our operations and processes.
Responsible�business Consideration of sustainability factors – environmental, social and governance (ESG) issues – is no longer a separate niche. It's a mainstream concern that we take into account. At Van Lanschot Kempen, this translates in practice into three areas: the assets we manage for our clients, our balance sheet-related activities, and our own organisation. We focus mainly on the first area because this
is most material. In short: what we do with our clients’ money – whether in Private Banking, Evi or Asset Management – has the most impact on the environment and society. The final part of this section goes into more depth about two ESG themes that were on our 2018 agenda: climate change and human rights.
Our�approach�to�sustainability�in�client�investments�The investment market as a whole is clearly shifting from “doing no harm” to “doing good”. Driving this shift are important international developments such as climate change and an increasing focus on addressing global challenges through the Sustainable Development Goals (SDGs). 1
As a responsible wealth manager and as long-term stewards of our clients' assets, we encourage positive change by taking financial and non-financial factors into account when making investment decisions. Non-financial factors include environmental, social and employment conditions, human rights, anti-corruption and bribery. We have an extensive responsible investment policy that translates international guidelines into ESG criteria, on the basis of which we screen our investments. Via our engagements and voting, we aim to improve the ESG practices of companies and investment funds. Companies that cannot improve (due to their products), or show no willingness to improve, can be excluded. See our CSR Supplement for more details.
Screening�Screening our assets against ESG criteria is part of our responsible investment process. In 2018, we further improved our ESG scoring methodology for (external) fund managers1. On the basis of this new methodology, every fund is now assigned an ESG score, ranging from 1 (inadequate) to 5 (leading). Currently, we have scored 53 funds, contributing to 19% of our AuM. Their ESG scores range between 2 and 4.5. As a percentage of AuM the scores are: 2% embryonic; 11% sufficient; and 6% maturing. The distribution of the 53 funds’ ESG scores are: 11% embryonic; 53% sufficient; 34% maturing; and 2% leading. In 2019, we will extend this scoring methodology to more funds.
Business themes 19
1 Until 2017, we calculated assets under screening; this metric only indicates whether an asset can be screened but not what the ESG quality of the asset is. We address this through ESG scoring for funds.
208
9120
Engagement
fund�managers�engaged�with
companies�engaged� with�directly 24
28companies�excluded
companies�on�the�avoidance�list�(plus�105�tobacco-related�companies)�
Exclusion�and�avoidance
461
37%11
of�meetings�with�at�least�one�vote�Against,�Withheld�or�Abstained
AGMs�attended�in�person
Voting
Responsible�investment�dashboard
53funds
companies�engaged�with�collaboratively
meetings�voted�at
Screening
19% of�AuM

EngagementThrough our engagements, we seek to encourage positive change at companies and investment funds. During the reporting year, we engaged with 299 companies on environmental, social and governance issues. Of these engagements, 91 were directly with companies (environmental (21%), employee and social (15%), human rights (10%), corruption & bribery (0%) and governance (54%)); 208 were collaborative engagements with companies; and 20 were dialogues with external fund managers. The latter include Eumedion, Carbon Action 100+, Platform Financials Living Wage, PRI and IIGCC. For more details and examples, see our CSR Supplement.
VotingAs a responsible wealth manager, we exercise voting rights. In 2018, we voted at 461 meetings, or 93% of all votable meetings, at which we voted 6% against management.
Exclusion�and�avoidanceBased on a company’s behaviour or products and services, we may choose to exclude or avoid that company. In 2018, Kempen Asset Management decided to exclude tobacco companies from its funds due to their negative impact on society. The companies we exclude can be found via: kempen.com/en/asset-management/responsible-investment.
New�sustainable�and�impact�investment�solutions�for�clients�In 2018, several developments have provided our clients with more opportunities to contribute to a sustainable society via their investments.
The Kempen (Lux) Global Sustainable Value Creation Fund offers investors the opportunity to invest in a diversified portfolio of listed companies worldwide which comply with strict sustainability criteria. It selects investments with a focus on long-term value creation for all stakeholders. This new fund reflects investors’ growing interest in sustainable investments. Together with our other sustainable and impact-focused Kempen funds, the total sustainable assets under management amounted to around €0.9 billion in 2018 for Kempen Asset Management.
In 2018, we also expanded our impact investing proposition by creating the Kempen Global Impact Pool, an investment solution that targets positive impact across four themes that relate to the SDGs and invests across listed and non-listed asset classes. It was made available to institutional as well as Private Banking clients.
In Van Lanschot Private Banking, our assets under sustainable discretionary management grew to €1,318 million in 2018 (2017: €1,138 million). Growth was driven mainly by our sustainable product offering, Duurzaam+.
In addition, our central Charity and Impact Investing Service continued to roll out its services through the local Van Lanschot network, and extended additional contributions in the form of pitches and workshops for clients and employees. We use personal advisory discussions to identify our clients’ wishes and needs in terms of social impact, and then help them choose the most appropriate donation or investment strategy.
Climate�changeClimate change continues to be an important issue globally, and is therefore an integral part of our responsible business strategy. The biggest contribution we can make is – again – via our client investments.
Client�investmentsFor the second year running, we have assessed the carbon footprint of our client investments. The aggregate carbon footprint of our clients' managed assets was 3.8 million tonnes of CO2, approximately the same as last year (2017: 3.9 million tonnes). To be able to ultimately steer the climate impact of our assets under management, for the first time in 2018 we also carried out a climate scenario analysis on two of our strategies in order to assess the impact that transitional and physical climate risks may have on our investment portfolios. Read more about climate scenario analysis and our initiatives in our Task Force on Climate-related Financial Disclosure (TCFD) statement online: vanlanschotkempen.com/responsible/environment.
Assets�on�our�balance�sheet�In 2018, we also further developed and applied our methodology (using 2017 data) to determine the carbon emissions of the total assets on our balance sheet, arriving at a total of 60,949 tonnes (2017: 73,525 tonnes); see our CSR Supplement for more information. As most of these balance sheet-related carbon emissions relate to mortgages, we developed the Van Lanschot Groenhypotheek (green mortgage). This new mortgage product, which comes with customised green energy advice, offers clients the opportunity to borrow extra money at attractive interest rates, to modify their homes in order to make them more sustainable. We expect to launch the Van Lanschot Groenhypotheek in 2019.
Our�own�organisationAlthough the climate impact of our own organisation is relatively limited, we take measures to reduce it. In 2018, we were once again on track to meet our objective of reducing carbon emissions per FTE by 2% a year in the 2015-25 period. At the end of 2018, we raised our reduction target to 2.5% a year. In the reporting period, our carbon emissions per FTE were 2.54 tonnes. For more details, see our CSR Supplement.
Business themes 20
2 CO2 figures based on 2017 data (scope 1 and 2); the coverage in 2017 was 55%.
Carbon footprint of our assets under management
CO2�assets�under�management2
Absolute�footprint�(in�million�tCO2)
Relative�footprint�(tCO2/€�m�invested)
Carbon�intensity� (tCO2/€�m�sales)�
Coverage�(CO2�based�on�%�AuM)�
Private Banking (incl. Evi) 1.5 111.8 – 60%
Asset Management 2.3 114.5 185.6 45%
Total 3.8 113.5 – 50%

Human�rightsAs we recognise the crucial importance of this topic, we have integrated it into all our businesses and activities.
Client�investmentsAt the end of 2018, pension funds in the Netherlands signed a Responsible Investment (RI) covenant, as a follow-up to the covenant that was signed by insurance companies earlier in the year. The covenant is underpinned by the OECD’s Guidelines for Multinational Enterprises and the United Nations Guiding Principles on Business and Human Rights. We expect these covenants to further contribute to the importance and growth of ESG implementation in the Netherlands.
Human rights has always been one of our focus areas. Since the OECD published its Responsible Business Conduct for Institutional Investors: Key Considerations for Due Diligence under the OECD Guidelines in 2017 (as well as the RI pension and insurance covenants mentioned above), this has become an even more prominent topic. Kempen Asset Management has joined two collaborative engagement initiatives that specifically focus on addressing salient human rights risks in supply chains. One is an existing initiative relating to sustainability issues in the cobalt supply chain; the other is the Platform Living Wage Financials (PLWF), a new initiative of which Kempen was a founding member. PLWF encourages, supports, and monitors investee companies on their commitment to paying a living wage to the workers in their supply chains.
Assets�on�our�balance�sheet�Although relatively less material, human rights are also a topic in relation to our balance sheet. In 2016, we signed the IMVO banking covenant on human rights, mainly focusing on human rights improvements in lending activities and our own organisation. After implementing most of the requirements from the covenant in 2017, we published our first compliance report in early 2018. We later organised a fruitful meeting with our stakeholders, ranging from clients to industry experts. The result was a list of relevant suggestions for further improvements that we will implement in due course.
Our�peopleAs a professional services company, Van Lanschot Kempen relies on the knowledge, experience and professionalism of its employees. To stay relevant to our clients and the world around us, we need to adapt to change. Our approach to our workforce reflects this.
Finding�the�right�peopleAs part of our strategy to deliver solutions to clients, we need to know and understand the needs of our clients in a broader sense. In order to be a solutions-led organisation, we need people with data and analytical skills, but also people with inquiring minds and strong social skills. The prevalent trend towards digital transformation means that we need to balance digital channels with real human contact. To add value, we need to adapt to this new way of working – and that means developing our employees to be digitally savvy and even more people-centric.
Building and maintaining strong relationships is key to staying relevant and reliable for our clients. We believe that digitalisation, advanced analytics and new technologies will help us to create and preserve the wealth of our clients.
This will fundamentally change the way we operate. Digital tools and data will enable our client-facing employees to increase their efficiency, but most of all to enhance client relationships and experience by providing the right service at the right time. Supported by human contact, through which we distinguish ourselves from others, this will strengthen the service we provide.
Leadership�programmeThe transformation that’s taking place both outside and inside our organisation requires our leaders to be competent in facilitating change: they need in-depth knowledge on the impact of digitalisation, and they need to learn to lead mixed teams of more traditional finance professionals as well as young digital talents. We’re therefore putting in place specific (on the job) learning interventions for this.
One example of the ways in which we’re linking our leadership programme to the specific business challenges we face is a series of breakfast talks. In 2018, inspiring external speakers came to share their knowledge with managers a total of nine times – with topics ranging from diversity and inclusion to blockchain. An average of 60% of managers attended the sessions live in person, while many others followed the presentations online afterwards. Our evaluation has shown that the breakfast talks are highly appreciated among our leaders.
RecruitmentIn addition to more traditional commercial and support roles, we now increasingly seek people with strong digital and data analytics skills as so much of the financial services industry is now IT-based. With historically low unemployment in the Netherlands, it’s becoming ever more difficult to attract the right people. Our competitors are all facing the same challenge, which means that the talent pool is even smaller and more competitive. During the reporting year, we have been running targeted recruitment campaigns – through agencies, social media and elsewhere – in a bid to grow our pipeline of digitally savvy people for the future.
Continuous�dialogueAcross businesses in general, there is a trend towards more open, transparent and continuous performance management throughout the year – rather than one or two appraisals at specific points. In line with this thinking, in 2018 Van Lanschot Kempen started a performance management pilot in around a dozen teams to promote continuous dialogue between employees and managers. Based on the feedback and results of the pilot, we’re confident that continuous dialogue is the way forward, and are now exploring how it can be implemented across the organisation.
Employee�engagementWe conducted an employee engagement survey in late 2017, which has given us the full year 2018 to evaluate and act on the results. Strengths that came out of the survey overall were identified as: positive cooperation between departments; a culture that invites opinion sharing; recommendation of Van Lanschot Kempen as a good employer to others; clarity on our objectives; and optimism about the future. Several opportunities were also identified, namely: the need to improve on client-centricity through innovation and more efficient processes; the desire for better recognition and attention to well-being; the need for more transparency surrounding promotion and performance; and the wish for more attention to be paid to our overall Van Lanschot Kempen values.
Business themes 21

Based on these results, concrete actions were taken across all teams. For example, individual in-depth interviews were set up to explore the reasons for some below-average scores, with the goal of reducing staff turnover, increasing satisfaction, and using the full potential of the team members who were interviewed.
Our next employee engagement survey will take place in the first half of 2019, and will be reported on in our 2019 annual report. We will conduct an employee engagement survey every two years.
Encouraging�diversity�and�inclusionIn 2018, all commercial business units and support functions drew up their own diversity plans, which they discussed with the Executive Board. For example, both Kempen Asset Management and Kempen Merchant Banking have been carrying out training on unconscious bias during recruitment. Managers tend to hire people like themselves, which by definition curtails diversity; by training our brains not to give into our unconscious bias, we can ensure that we’re including all relevant candidates in our potential talent pool. Within Private Banking, a special Diversity & Inclusion Team has been created, comprising ten representatives from different fields. The aim is to create more awareness of diversity and to encourage the hiring and appointment of a broader range of employees. In addition, we introduced a KPI on gender balance in management positions in 2018. As of year-end 2018, 20% of employees in management positions are female. For more information on this KPI, see page 24.
This need for diversity and inclusion will become ever more important as we strive to attract the different types of talent required to transform our workforce. For example, by hiring people with more digital and technical skills, we believe that the profiles of employees entering the company will become more diverse.
We believe it’s important to support people with an occupational disability to find employment. During the reporting year, we made a positive start by hiring several people within various parts of the organisation.
Vitality�ProgrammeTo support a better work-life balance, in 2018 we allocated each employee their own individual budget to put towards the Vitality Programme that suits them best: physical, mental, emotional or spiritual. The majority have used the budget for activities such as mindfulness and health coaching.
Staff�compositionThe number of FTEs employed at Van Lanschot Kempen slightly decreased in 2018 to 1,621 (2017: 1,658) due to our ongoing focus on process optimisation and efficiency. Of that total, 36% are women – the same as the previous year. The percentage of female members on the Executive Board is 33%.
Education�and�trainingAll our employees receive a regular performance review, and in 2018 we invested €4.5 million (2017: €4.2 million) in education and training programmes for our staff. The number of training hours averaged 9.7 days per employee per year4, an increase compared to 2017 (8.6 days)5.
AbsenteeismThe rate of absenteeism remained unchanged in 2018 (2.7%). Absenteeism policies and prevention are a continual focus. For more information about our staff numbers, see our CSR Supplement.
Business themes 22
3 Number of training hours for Van Lanschot Netherlands and Kempen only. The figure is calculated and not based on registration.4 The figure is calculated and not based on registration.5 In 2018, the amount of training per employee averaged 9.7 days for men and 9.6 for women.
Key�staff�data 2018 2017
Employees (FTEs at year-end) 1,621 1,658
Absenteeism (%) 2.7 2.7
Investment in training (€ million) 4.5 4.2
Training hours (total number of hours, individually and collectively)3
125,361 113,959
Male/female ratio (%) 64/36 64/36
Staff�per�business 2018 2017
Number FTEs Number FTEs
Private Banking 804 754 810 757
Evi 28 28 34 33
Asset Management 228 221 236 230
Merchant Banking 111 110 113 112
Other (support functions) 536 508 554 525
Total 1,707 1,621 1,747 1,658

Business themes 23
ETHICAL BEHAVIOURThe financial sector is built on trust, and a healthy culture and ethical behaviour are needed to sustain this trust with all our stakeholders. Van Lanschot Kempen has various policies in place to encourage an ethical culture and to ensure that we act with integrity. We also have various measures to help to prevent unethical behaviour that could result in significant reputational damage and/or financial losses.
BANKING CODE, CODE OF CONDUCT AND BANKER’S OATHThe Banking Code, with which we comply, sets out principles for sound and controlled business operations, corporate governance, risk management policies, and audit and remuneration policies. Its scope includes the integrity of the organisation (for more information, see page 68). As stated in the Banking Code, the Statutory and Supervisory Boards are responsible for developing and maintaining standards of integrity and ethical behaviour. Our Code of Conduct, to which every employee must adhere, goes further than complying with relevant legislation. It includes guidelines on how employees should act with integrity and balance the interests of all stakeholders. Our Code also includes the Banker’s Oath, which all our employees are required to sign. For more information, see vanlanschotkempen.com/en/governance. While there were no ethical incidents in 2018, there was one potential material incident resulting from a failure to comply with our Code of Conduct, Banking Code or Banker’s Oath.
MECHANISMS FOR ADVICE AND CONCERNS ABOUT ETHICSEmployees have various avenues for seeking advice or raising concerns about ethical issues – for example, via their managers and the Compliance department. We have a whistleblower policy and a complaints procedure in place; we have also appointed a confidential adviser who employees can turn to.

Progress report 24
PERFORMANCE
Financial�and�non-financial�KPIsDuring 2018, a new set of key performance indicators (KPIs) was developed in addition to the existing KPIs, focusing on long-term value creation. These financial and non-financial KPIs reflect both the interests of our stakeholders and our ambitions as a wealth manager.
Please note that Van Lanschot Kempen did not conduct an engagement survey in 2018. As a result, no scores are reported within the "Ethics and integrity" theme (KPI 4) and for KPI 11. For more information on the development of our KPIs, please refer to page 25.
An overview of our performance on the KPIs that we report externally is shown in the table below.
Themes�and�mission KPIs Targets Score�2018
Financial�and�risk�management 1. CET 1 ratio (fully loaded)
2. Return on equity (CET 1)
3. Efficiency ratio
15-17%1
10-12%1
60-65%1
21.4%
9.8%
79.4%
Ethics�and�integrity 4. Percentage of employees who feel the
responsibility to act and behave ethically
> industry average n/a n/a
Client�relations 5. Net Promoter Score (NPS):
a. Private Banking
b. Evi
c. Asset Management
PB: 10
Evi: 10
AM: 20
2
–20
442
Responsibility�and�sustainability 6. Private Banking: AuM invested in sustainable and/
or impact investment wealth management solutions
7. Engaging with companies in which our funds invest
8. Asset Management: percentage increase in (internal
and external) fund managers on our approved list
that are scored on their overall sustainability profile
9. Decrease in carbon emissions:
a. Direct emissions of our own organisation
b. Indirect emissions via our balance sheet
(mortgage portfolio)
> last year
80-100
engagements
> last year
- 2.5%/FTE per year
- CO2/€ < last year
2018: €1,318m
2017: €1,138m
91 engagements
2018: 53 funds
2017: 0 funds
–8.1%
–7.4%
Employees 10. Employee engagement score
11. Employer Net Promoter Score (eNPS)1
12. Gender balance in management positions
> 80%
> 10
> 30% female
> 30% male
81%2
–
20% female
80% male
–
Mission:�Preservation�and�
creation�of�wealth
13. Private Banking: 3-year performance of
discretionary management mandates
14. Evi: 3-year performance of discretionary
management mandates
15. Asset Management: average Morningstar rating
of investment strategies (institutional share class)
> benchmark
> benchmark
> 3.5
–0.1%
–0.4%
4.0
1 Our 2020 targets applied to 2018. As of 2019, we set targets for 2023 (please refer to page 12).
2 Score for 2017.
KPI more than achieved KPI achieved KPI almost achieved KPI not achieved KPI far from achieved

Financial�and�risk�managementFinancial performance and risk management are key to our organisation, as all direct stakeholders benefit from a solid capital position and sustainable performance. In 2018, our CET 1 fully loaded ratio increased to 21.4% and our return on CET 1 decreased to 9.8%. The efficiency ratio amounted to 79.4%. As of 2019, we have adjusted our target for the efficiency ratio from 60-65% to 70-72%. We believe this target aligns with our profile as a wealth manager and with the economic environment in which we operate. More information on the developments underlying these ratios is provided on pages 26-35.
Ethics�and�integrityWe operate in an ethical manner, and we encourage our employees to behave ethically and with integrity. We monitor the ethical behaviour of our employees by focusing on this item in our employee engagement survey. In 2018, no employee engagement survey was conducted so no score is reported this time. Our next employee engagement survey will take place in the first half of 2019 and will be conducted every second year.
Client�relationsThe relationship with our clients is one of our most important assets. To measure the satisfaction and loyalty of our clients, we use the Net Promoter Score (NPS), which gives insight into client loyalty and the number of promoters of the organisation. The score lies within a range of –100 to 100 points, the higher the better. The formula is as follows: NPS = % promoters - % detractors. Promoters give the organisation a score of 9 or 10, whereas detractors award a score of between 0 and 6. The NPS that we measure is also known as the Relationship NPS. The Relationship NPS differs from the Transactional NPS, which is also commonly used. The Transactional NPS measures client satisfaction after a single transaction and tends to lead to a higher score than the Relationship NPS.
We measure the Relationship NPS once a year for Private Banking and Evi. Our Private Banking clients awarded us an NPS of 2, below our target of 10. Evi clients awarded an NPS of –20, below our target of 10. Both NPS scores were impacted by disappointing absolute results on clients’ investment portfolios. For Asset Management, we measure the NPS once every two years as the relationship with – and the solutions provided to – institutional clients do not change as quickly as in the case of private clients. The NPS of 44 awarded by clients of Asset Management in 2017 was above our target of 20.
Responsibility�and�sustainabilityWe can achieve the most significant economic, environmental and social impact by investing the wealth of our clients in a responsible and sustainable manner. The Private Banking AuM invested in sustainable and impact investment rose to €1,318 million in 2018, from €1,138 million in 2017. Over the year, we undertook 91 engagements for change and awareness, well within our target of 80-100 cases. In 2018, we also started rating external fund managers on ESG criteria and were able to score 53 fund managers. In addition, we decreased the carbon emissions caused by our mortgage portfolio by 7.4% and those caused by our own organisation by 8.1% per FTE.
EmployeesAs a professional services company, Van Lanschot Kempen is dependent on hiring and retaining knowledgeable, experienced and professional staff. That means we are highly motivated to create an attractive work environment for our workforce and to invest in our people. At year-end 2018, 20% of the employees in management positions were female. We are also focusing on developing an additional KPI to reflect our ambition of encouraging diversity within our organisation (e.g. in terms of background). As mentioned above, no employee engagement survey was conducted in 2018, which is why the 2017 employee engagement score is reported and no Employer Net Promoter Score is provided for 2018. Our next employee engagement survey will take place in the first half of 2019 and will be conducted every second year.
Mission:�preservation�and�creation�of�wealthAs our mission is to preserve and create wealth for our clients, our wealth management solutions should deliver a positive performance in the long term, and our investment strategies should perform well compared to their benchmarks. At year-end 2018, the three-year performances of Private Banking and Evi discretionary management mandates relative to their benchmarks stood at –0.1% and –0.4% respectively. In 2018, performance was slightly below the benchmark due to the decision to take less interest rate risk than the benchmark by investing in credits and liquidity funds and due to the underperformance of the external equity funds selected. 2016 and 2017 showed an outperformance compared to the benchmark. At Asset Management the average Morningstar rating of our investment strategies is 4.0, well above our target of 3.5.
For more information on our KPIs, see our CSR Supplement.
Progress report 25

Results�(€�million) 2018 2017 %�
Commission 293.2 267.0 10%
– Of which securities commissions 238.5 230.6 3%
– Of which other commissions 54.7 36.3 50%
Interest 175.6 196.6 –11%
Income from securities and associates 31.1 37.0 –16%
Result on financial transactions –0.8 14.1
Income�from�operating�activities 499.2 ����������514.8� –3%
Staff costs 244.4 236.0 4%
Other administrative expenses 146.8 150.2 –2%
– Of which regulatory levies and charges 10.5 10.9 –4%
Depreciation and amortisation 5.2 5.8 –11%
Operating�expenses 396.4 392.1 1%
Gross�result 102.8 122.7 –16%
Addition to loan loss provision –12.7 –11.9 7%
Other impairments –0.9 –2.6 –63%
Impairments –13.7 –14.4 –5%
Operating profit before tax of non–strategic investments 17.8 12.6 41%
Operating�profit�before�special�items�and�tax 134.3 149.8 –10%
Strategic investment programme 22.0 21.4 2%
Derivatives recovery framework – 1.7
Amortisation of intangible assets arising from acquisitions 8.3 6.1 36%
Restructuring charges 8.3 –
Operating�profit�before�tax 95.8 ����������120.5� –21%
Income tax 15.5 25.6 –40%
Net�result 80.3 94.9 –15%
Underlying�net�result 103.0 112.3 –8%
Underlying�net�result�(€�million) 2018 2017 %�
Net�result 80.3 94.9 –15%
Strategic investment programme 22.0 21.4 2%
Derivatives recovery framework – 1.7
Restructuring charges 8.3 –
Tax effects –7.6 –5.8 30%
Underlying�net�result 103.0 112.3 –8%
Results2018 was a good year for Van Lanschot Kempen, with a net result of €80.3 million and an underlying net result of €103.0 million. Client assets fell to €81.2 billion from €83.6 billion, while our assets under management (AuM) were down 3% to €67.0 billion. The decline was driven by a negative market performance, offset in part by a net inflow of €1.0 billion. Commission income rose by 10% to €293.2 million, driven by higher average AuM volumes
and a high deal flow at Merchant Banking. At €396.4 billion, operating costs were up on last year. As expected, the larger proportion of costs was recorded in the first half of 2018, reflecting lower regulatory levies and charges in H2 2018 together with our focus on cost-saving measures (which also involved us taking a restructuring charge of €8.3 million). In 2018, the quality of our loan portfolio was back up, sparking a significant release from loan loss provisions.
Progress report 26

Income�from�operating�activitiesTotal operating income decreased by 3% from €514.8 million in 2017 to €499.2 million in 2018. Commission income showed an increase of 10% to €293.2 million. Interest income decreased by 11% and other sources of income were down by 41%.
Private Banking, Evi, Asset Management and Merchant Banking together generated 86% of total income from operating activities. These four segments accounted for 99% of commission income (on a par with 2017) and 80%
of interest income (2017: 79%).
All operating activities made a positive contribution to the underlying net result, with the exception of Evi. The underlying net result for 2018 is the net result adjusted for costs associated with the strategic investment programme and restructuring charges (respectively €22.0 million and €8.3 million gross).
As of 2019, we will integrate our Corporate Banking activities into our Private Banking segment. In line with our strategy we successfully reduced the Corporate Banking loan portfolio, which stood at €0.5 billion at the end of 2018 (year-end 2017: €0.9 billion).
Commission
Commission income accounted for 59% of our total operating income. Total commission rose 10% to €293.2 million in 2018, driven by higher management fees and other commission income. The net increase in management fees of 8% was the result of a higher average volume of AuM and a slightly lower margin due to the AuM composition. Compared with 2017, transaction fees were down by 24%. This was the result of lower transaction volumes due to less favourable market conditions. Other commissions were up by 50% on the back of high deal flow at Merchant Banking. Compared with the first half of 2018, commission income in H2 2018 showed a decline. This was visible in all commission items.
Private Banking’s total commission income was up by €2.5 million compared with 2017. Securities commissions were up by €4.2 million thanks to AuM net inflows and the acquisition of UBS’s wealth management activities in the Netherlands (UBS Netherlands), with management fees up by €6.7 million and transaction fees down by €3.3 million. During the second half of 2018, commission income was negatively impacted by a decrease in AuM as a result of negative market performance.
Evi’s commission income came in slightly lower (2018: €4.4 million, 2017: €4.5 million), due to cash incentives for new clients offered as part of a marketing campaign.
At Asset Management, new fiduciary mandates and the acquisition of UBS Netherlands led to a €7.5 million rise in commission income on 2017. The average margin decreased slightly, mainly due to a change in the composition of AuM; see ”Client assets” on page 30.
Commission income at Merchant Banking rose by €16.3 million in 2018, to €58.0 million (2017: €41.7 million). This was mainly driven by higher advisory income from M&A and capital market transactions. Our real estate and
499.2265.7
Income�from�operating�activities,�by�segment�(€ million)
99.8
58.9
44.323.5
Private Evi Asset Merchant Corporate Other 2018 Banking Manage- Banking Banking total ment
6.9
Commission�(€�million) 2018 2017 %�
Securities commissions 238.5 230.6 3%
- Management fees 215.2 199.8 8%
- Transaction fees 23.4 30.8 -24%
Other commissions 54.7 36.3 50%
Commission 293.2 267.0� 10%
Progress report 27
Private Evi Asset Merchant Corporate Other 2018 Banking Manage- Banking Banking total ment
Underlying�net�result�(€ million)
40.4
27.5
17.3
103.0
13.8
10.6–6.6
1.1 1.9
Commission�income�by�segment(€ million)
Private Evi Asset Merchant Corporate Other Banking Manage- Banking Banking ment
124.5 127.0
4.5 4.4
92.5100.0
41.7
58.0
1.92.6
2017 2018

life sciences teams were involved in several successful transactions in Europe and the US. The increase driven by higher advisory income was partly offset by the introduction of MiFID II, which impacted commissions earned by our securities team.
Interest
The current interest rate climate continues to put pressure on our interest income. Our 2018 interest income of €175.6 million was 11% down on the €196.6 million recorded in 2017, mostly due to margin pressure. This was the combined result of the issuance of new loans and repricing of current Private Banking loans against a lower interest rate and a smaller loan portfolio. The loan portfolio declined by €0.5 billion to €8.6 billion. In 2018, we did not reduce the interest rates on savings and deposits further, as the “natural floor” in client rates of 0% had already been reached by the end of 2017. Furthermore, during 2018 wholesale funding was reduced as a senior unsecured bond (€0.4 billion) and an RMBS (€0.4 billion) were redeemed.
The interest margin fell by 11 basis points to an average of 121 basis points. The “clean” interest margin3 declined by 12 basis points compared with its level at the end of 2017, to 115 basis points.
Miscellaneous interest income and charges went up from a negative -€8.7 million to -€0.1 million, driven by lower amortisation on previously discontinued interest rate hedges (€6.0 million down on 2017) and income from penalty interest.
Income�from�securities�and�associates
Income from securities and associates relates to investments of our equity investment company Van Lanschot Participaties and investments in Bolster Investments Coöperatief U.A. which was launched in 2017. We occasionally also take positions in our own investment funds, for instance by providing seed capital or to be aligned with our clients’ interests.
Capital gains were down by €1.6 million to €15.5 million in 2018. The capital gain of €14.2 million in H2 2018 includes the sale of part of our minority stake in Ploeger Oxbo of €10.4 million and the sale of our stake in Ormit Holding.
Valuation gains and losses were down to €12.5 million, from €15.4 million in 2017. H2 2018 valuation gains and losses showed a negative figure of -€1.3 million, reflecting the lower value of the companies in which we hold minority interests and the investment funds in which we hold positions. The reduced value of these investment funds reflects less favourable market conditions.
Over the last ten years, income from securities and associates on average amounted to around €25 million a year.
Result�on�financial�transactions
The -€0.7 million recorded on securities trading reflects the negative result on positions in our own issued debt securities, partly offset by positive results on the trading book.
The result on currency trading was relatively stable compared with 2017.
The €1.9 million profit on the investment portfolio breaks down into two separate parts: realised gains on the financial assets at fair value through other comprehensive income and results on the mark-to-market portfolio. The 2017 result of €6.9 million included more realised gains on the financial assets at fair value through other comprehensive income.
The result on interest rate hedges decreased by €4.4 million to -€2.6 million, mainly due to the negative result of the hedge on our Kempen Dutch Inflation Fund. This is an alternative fund that invests in Dutch leasehold contracts primarily in connection with residential real estate to create an investment in long term inflation-linked cash flows.
Other income decreased as a result of lower gains on our structured products, due to a lower volume issued.
Operating�expenses
Interest�(€�million) 2018 2017 %�
Gross interest margin 186.9 212.6 –12%
Interest equalisation –13.8 –11.0 26%
Miscellaneous interest income and charges
–0.1 –8.7
Loan commission 2.6 3.7 –29%
Interest 175.6 ��196.6� –11%
Income�from�securities�and�associates�(€�million) 2018 2017 %�
Dividend 3.2 4.6 –31%
Capital gains 15.5 17.1 –9%
Valuation gains and losses 12.5 15.4 –19%
Income�from�securities�and�associates 31.1 37.0 –16%
Result�on�financial�transactions�(€�million) 2018 2017 %�
Securities trading –0.7 –0.4 62%
Currency trading 8.0 7.9 2%
Investment portfolio 1.9 6.9 –72%
Interest rate hedges –2.6 1.8
Other income –7.5 –2.1
Result�on�financial�transactions –0.8 14.1
3 The interest margin is calculated on the basis of a 12-month moving average. The clean interest margin equals the gross interest margin adjusted for interest equalisation and interest-related derivatives amortisation.
Progress report 28
Operating�expenses�(€�million) 2018 2017 %�
Staff costs 244.4 236.0 4%
Other administrative expenses 146.8 150.2 –2%
- Of which regulatory levies and charges 10.5 10.9 –4%
Depreciation and amortisation 5.2 5.8 –11%
Operating�expenses 396.4� 392.1 1%

Total operating expenses rose by 1% to €396.4 million (2017: €392.1 million), mainly reflecting higher staff costs. As expected, the larger proportion of costs was recorded in the first half of 2018 (H1 2018: €209.3 million; H2 2018: €187.1 million). The lower cost level in H2 2018 reflects lower regulatory levies and charges together with our focus on cost-saving measures. As part of these measures, a restructuring charge of €8.3 million has been incurred.
Staff�costsAt €244.4 million, staff costs were 4% up on 2017 (€236.0 million). This increase is driven by factors including salary increases (mainly as a result of the competitive labour market), costs associated with the acquisition of UBS Netherlands and a higher contribution to the Dutch government’s sector fund (to cover social security costs).
At the end of 2018, we employed 1,621 full-time equivalent staff (FTEs), excluding employees of our non-strategic investments. This was 37 FTEs fewer than at year-end 2017 (1,658) and was largely the result of staff reductions in group functions and Private Banking.
Other�administrative�expensesOther administrative expenses amounted to €146.8 million in 2018, 2% below the figure for 2017 (€150.2 million). As expected, the larger proportion of the costs was recorded in the first half of the year (€80.6 million in H1 2018 vs. €66.3 million in H2). The decrease in the second half of 2018 was mainly related to lower regulatory levies and charges and lower consultancy fees, as well as a lower cost resulting from changes in the pro rata VAT percentage. As of 2018, regulatory levies and charges are shown separately and amounted to €10.5 million.
IT change expenses, excluding our strategic investment programme, amounted to €21.8 million. Given the upward pressure related to technological developments such as digitalisation and data analytics and our regulatory environment, we expect a normalised annual level of IT change costs between €20 million and €25 million.
Depreciation�and�amortisationDepreciation and amortisation was down by 11% to €5.2 million. The lower figure of €1.7 million for H2 2018 was attributable mainly to the profit from the sale of office buildings that we accounted for as an adjustment on depreciation.
Efficiency�ratioThe efficiency ratio, i.e. the ratio of operating expenses (excluding costs incurred for our strategic investment programme, amortisation of intangible assets arising from acquisitions, restructuring charges and a one-off charge for the derivatives recovery framework) to income from operating activities, deteriorated to 79.4% in 2018 from 76.2% in 2017. This increase was driven by lower interest income, a lower result on financial transactions and higher costs related to staff. We have set our financial targets for 2023 and as a result we have redefined our efficiency target to 70-72% to reflect both our wealth management profile and the economic environment in which we operate.
Impairments
Addition�to�loan�loss�provisionA total of €12.7 million was released from loan loss provisions in 2018, with Corporate Banking accounting for €10.6 million deriving from both the SME and real estate loan portfolios. Private Banking accounted for a release of €3.2 million. As in 2017, the favourable economic climate contributed to the release from loan loss provisions.
In 2018, the release from loan loss provisions relative to average risk-weighted assets worked out at 27 basis points (2017: 22 basis points).
Other�impairmentsOther impairments show a release of €0.9 million. This amount is a combined effect of impairments and reversal of impairments on our investments and participating interests. Reverse impairments were the result of the increase in the fair value of the minority holdings in some of our private equity investments to which impairments had been applied previously.
Non-strategic�investmentsDuring 2018, we held majority stakes in three non-strategic investments, AIO II (Medsen), Holonite (Holowell BV) and Allshare. Operating profit before tax from non-strategic investments amounted to €17.8 million in 2018 against €12.6 million in 2017, mainly thanks to the improved operating result at Medsen. In December 2018, we announced the sale of our stake in Medsen. The transaction was closed in February 2019 will generate a book profit of around €35 million in 2019. Our aim is to divest our shareholdings in these non-strategic investments over time.
Operating�expenses�(€ million)
194.0 198.0 209.3 187.1
H1 H2 H1 Staff IT Consul- Regu- Modifi- Depre- Other H2 2017 2017 2018 costs costs tancy latory cation ciation 2018 fees levies pro rata and VAT charges
–6.1–2.2
–3.6–5.4 –1.8 –1.7 –1.3 Impairments�(€�million) 2018 2017 %�
Private Banking –3.2 –3.3 –3%
Corporate Banking –10.6 –6.0 76%
Other 1.0 –2.6
Addition�to�loan�loss�provision� –12.7 –11.9 7%
Impairment on investments and participating interests –0.9 –2.7 –65%
Impairment on assets obtained through the seizure of collateral –
0.1
Other�impairments –0.9 –2.6� –63%
Impairments –13.7 –14.4 –5%
Progress report 29

Special�itemsWe recognised €38.5 million in special items in 2018 compared with €29.3 million in 2017; the following table gives a breakdown.
Strategic�investment�programmeAs part of our strategy update, we launched our strategic investment programme in April 2016. Between mid-2016 and the end of 2019, we plan to invest €60 million in developing an omni-channel private banking model, outsourcing our mortgage business and payment services, and completing the transformation of our IT landscape. Over the course of 2016-2018, total investments under the programme amounted to €50.7 million, charged directly to profit and loss. A total of €22.0 million was invested in 2018. Good progress was made on the development of our omni-channel service for our clients, as we launched our new website and the new client portal together with the introduction of new digital tools for our investment advisers and private bankers. In addition, we are working on the outsourcing of our payment service activities to Fidor. We will be rolling out the new platform and payment app to our clients in the course of 2019. The outsourcing of the mortgage administration to Stater also formed part of the strategic investment programme and was completed on schedule in September 2017. Our investment programme is scheduled for completion over the course of 2019. As of 2020, IT investments are included in our regular IT costs.
Other�special�itemsAmortisation of intangible assets arising from acquisitions rose by €2.2 million as a result of the acquisition of UBS Netherlands.
In the course of 2018, management took several cost-saving measures, such as:– Migrating the Belgian IT activities to the IT
infrastructure in the Netherlands;– Restructuring various departments, including pooling all
investment expertise in a single Kempen Asset Management investment office;
– Centralising small-cap strategies in Amsterdam, and the resultant closure of the Edinburgh office.
These measures have led to a one-time restructuring charge of €8.3 million, which also includes the outsourcing of payments announced previously as well as switching off the mainframe, both of which should generate cost savings. These cost-saving measures were initiated in 2018 and will be further implemented in 2019, leading to lower operating expenses. Taking into account possible investments and indexation, Van Lanschot Kempen aims for a net cost level of around €390 million.
Income�taxIncome tax for 2018 amounted to €15.5 million (2017: €25.6 million), which translates into an effective tax rate of 16.1% compared with 21.2% in 2017. The main reason for the lower effective tax rate in 2018 was the tax-exempt gain on two sales in our participation portfolio combined with a lower operating profit before tax. Our effective tax rate is lower than the general Dutch tax rate of 25% due to income covered by equity exemption rules.
Profit attributable to non-controlling interests of €5.7 million in 2018 largely relates to non-controlling interests in our non-strategic investments, while also including the management investment plan launched in 2010 for selected staff at Kempen (Kempen MIP). In the first half of 2018, Van Lanschot Kempen offered participants in Kempen MIP the opportunity to exchange certificates in MIP for shares in Van Lanschot Kempen NV. As a result, the share of non-controlling interests related to Kempen MIP decreased.
We will propose to pay a 2018 cash dividend to Van Lanschot Kempen NV shareholders of €59.5 million.
Client�assets
Special�items�(€�million) 2018 2017 %�
Strategic investment programme 22.0 21.4 2%
Derivatives recovery framework – 1.7
Amortisation of intangible assets arising from acquisitions 8.3 6.1 36%
Restructuring charges 8.3 –
Special�items 38.5� 29.3 32%
Earnings�per�share�(€�million) 2018 2017
Net result 80.3 94.9
Share of non-controlling interests –5.7 –5.4
Net�result�for�calculation�of�earnings�per� share 74.6
89.5�
Earnings�per�share�(€) 186.58 223.77
Underlying�net�result�for�calculation�of�earnings�per�share 97.3 106.9
Underlying�earnings�per�share�(€) 243.26 267.22
Weighted number of outstanding shares (x 1,000) 400 400
Progress report 30
Client�assets�(€�billion) 31/12/2018 31/12/2017 %
Client�assets 81.2 83.6� –3%
Assets under management 67.0 69.0 –3%
Assets under monitoring and guidance 3.4 3.5 –3%
Assets under administration 1.7 2.0 –16%
Savings and deposits 9.1 9.1 –1%
Client�assets 81.2 83.6� –3%
Private Banking 30.4 31.4 –3%
Evi 1.4 1.5 –6%
Asset Management 48.2 49.0 –1%
Other 1.2 1.7 –34%

Van�Lanschot�Private�BankingThe negative market performance of -€1.7 billion impacted client assets at Private Banking. However, total client assets decreased by only €1.1 billion in 2018 to €30.4 billion. Net inflows amounted to €0.5 billion, of which €0.2 billion was discretionary and €0.4 billion non-discretionary. At the end of 2018, assets under discretionary management made up 56% of total AuM (year-end 2017: 55%). Total discretionary AuM stood at €11.8 billion (year-end 2017: €12.5 billion) and total non-discretionary AuM was €9.4 billion (year-end 2017: €10.1 billion).
Assets under administration decreased slightly during 2018 to €0.7 billion (year-end 2017: €0.8 billion). These assets are partly administered by Van Lanschot Private Banking; we have little or no control over them and their earnings are relatively limited.
Evi�van�LanschotAuM decreased slightly and stood at €0.9 billion per year-end 2018, despite the challenging market conditions that led to negative market performance. Evi’s AuM client base expanded further by 23% to over 16,000 clients, although AuM growth was less strong. The volume of savings declined by €0.1 billion, which also means that total client assets decreased by €0.1 billion from €1.5 billion to €1.4 billion.
Savings and deposits Assets under administration Assets under management
8.3
Client�assets�at�Private�Banking(€ billion)
31/12/2017 Net inflow Net Market Other 31/12/2018 savings performance changes and deposits outflow
8.1
0.5 0.331.4
–0.1
30.4
–1.7
0.8 0.7
22.6 21.3
0.9 0.9
0.6
1.51.4
0.5
Client�assets�at�Evi(€ billion)
31/12/2017 31/12/2018
Assets under management Savings
9
13
+ 45%
+ 23%
Development�of�Evi’s�AuM�client�base(1,000)
31/12/2016 31/12/2017 31/12/2018
16
Progress report 31
Client�assets�(€�billion) Private�Banking Evi Asset�
Management Other Total
Client�assets�at�31/12/2017 31.4 1.5 49.0 1.7 �����83.6�
Assets under management in/outflow 0.5 0.0 0.4 0.0 1.0
Market performance of assets under management –1.7 –0.1 –1.2 0.0 – 3.0
Change in assets under monitoring and guidance – – –0.1 – – 0.1
Change in assets under administration 0.0 – – –0.3 – 0.3
Internal AuM transfer –0.1 0.0 0.1 0.0 0.0
Change in savings and deposits 0.3 0.0 0.0 –0.3 – 0.0
Client�assets�at�31/12/2018 30.4 1.4 48.2 1.2 81.2

Kempen�Asset�ManagementAuM at Asset Management declined to €44.8 billion, driven by a negative market performance of €1.2 billion. Fiduciary mandates showed an inflow, thanks to Stichting Pensioenfonds Arcadis Nederland (via Het nederlandse pensioenfonds) of €1.1 billion and Covra. We saw an outflow from investment strategies, partly as a result of the discontinuation of our Fundamental Index Strategy and as a result of rebalancing of clients’ portfolios. In 2018, we extended our investment strategies offering with the addition of the Private Market Fund, the Global Impact Fund and the Global Value Fund. Total client assets at Asset Management stood at €48.2 billion (2017: €49.0 billion).
In addition to third-party funds, Kempen Asset Management also manages our Private Banking discretionary management mandates and the Evi Beleggen products, with total AuM of €10.7 billion at the end of 2018 (this amount is not included in Asset Management’s total AuM of €44.8 billion).
Statement�of�financial�position
Loan�portfolio
Our loan portfolio contracted by 6% to €8.6 billion in 2018, due to the Corporate Banking run-off (-40%) and the Private Banking Other loans (-12%). Our mortgages portfolio remained stable at €5.8 billion.
Van�Lanschot�Private�BankingThe Private Banking loan portfolio breaks down into mortgages and other loans. Private Banking mortgages increased marginally to €5.8 billion. Over 66% of our loan portfolio consists of these Private Banking mortgages, primarily to high net-worth individuals. The weighted average loan-to-value (LTV) ratio improved further to 76% (year-end 2017: 81%), on the back of prepayments and rising house prices.
Other Private Banking loans comprise loans to high net-worth individuals as well as business loans that fit into the Private Banking relationship model. These other loans decreased to €1.8 billion (year-end 2017: €2.0 billion), mainly driven by prepayments as we no longer offer interest compensation as of Q4 2018 and as a result of low client rates on savings combined with the unfavourable market conditions for investing. General repayments are also a cause of the decline in other loans.
AuM�Asset�Management�(€ billion)
31/12/2017 Net Net Market Other 31/12/2018 inflow inflow performance changes fiduciary investment strategies
45.5 1.6–1.2 –1.2 0.1 44.8
30.5
6.7
7.7
Solutions - fiduciary Fixed income and (smart) passive Equity active & alternatives
29.1
7.7
8.7
Statement�of�financial�position�(€�million) 31/12/2018 31/12/2017 %
Equity attributable to shareholder 1,256 1,333 –6%
Equity attributable to non-controlling interests 12 16 –25%
Savings and deposits 9,091 9,145 –1%
Loans and advances to clients
8,561 9,103 –6%
Total assets 13,980 14,659 –5%
Funding ratio (%) 106.2 100.5
Return on assets (%) 0.74 0.77
Loan�portfolio�(€�million) 31/12/2018 31/12/2017 %
Mortgages 5,756 5,712 1%
Other loans 1,793 2,045 –12%
Private�Banking 7,550� 7,756� –3%
Loans to SMEs 251 457 –45%
Real estate financing 271 411 –34%
Corporate�Banking 523� 868� –40%
Mortgages distributed by third parties 602 600 0%
Total 8,674� 9,224� –6%
Impairments –114 –120 –6%
Total 8,561� 9,103� –6%
Progress report 32
40%
<=75% 75%-100% 100%-125% >125%
44% 43% 43%
14%11%
3% 2%
31/12/2017 31/12/2018
Private�Banking�in�the�Netherlands:�mortgage�loan-to-value�(%)

Van�Lanschot�Corporate�BankingAt the end of 2018, the commercial real estate loan portfolio and SME loans totalled €0.5 billion (year-end 2017: €0.9 billion). Risk-weighted assets came down by €0.2 billion and worked out at €0.5 billion (year-end 2017: €0.7 billion).
SME loans at Corporate Banking were 45% lower at €0.3 billion at the end of 2018, accounting for 3% of our total loan portfolio. This portfolio is well diversified across sectors. The real estate loan portfolio (€0.3 billion), which is well diversified in terms of collateral, contracted by 34%. The collateral assets against which the loans are secured are typically located in the Randstad conurbation comprising the cities of Amsterdam, Rotterdam, Utrecht and The Hague.
Mortgages�distributed�by�third�partiesThe portfolio with mortgages distributed by third parties consists of regular Dutch mortgages and is intended to supplement our investment portfolio and enable us to generate attractive returns on available liquidity. It accounts for 7% of our total loan portfolio with a volume of €0.6 billion.
ProvisionsWe take provisions for the impaired loans in our loan book. Impaired loans totalled €331 million at the end of 2018. The provisions for these loans amounted to €101 million, working out at a coverage ratio of 30%. As of 1 January 2018, we implemented accounting standard IFRS 9 – Financial Instruments. As a result, total impairments are not fully comparable with those reported in previous periods. The tables below break down the total loan portfolio and provisions.
The total impaired ratio decreased from 4.0% to 3.8% at the end of 2018 and the total coverage ratio was relatively stable at 30% (year-end 2017: 31%). The proportion of impaired loans at Private Banking decreased to 2.3% (year-end 2017: 2.5%). The coverage ratio for mortgages decreased to 12%, driven by rising house prices. The coverage ratio for other loans increased to 62%. The impaired ratio at Corporate Banking rose to 29.8% (year-end 2017: 20.2%), primarily as a result of the portfolio’s run-off. Our Corporate Banking coverage ratio decreased to 15% (year-end 2017: 19%). The relatively low coverage ratio is explained by the sufficiently high quality of the collateral pledged to secure these loans.
SME loans Current accounts Real estate loans Private loans Lombard loans
Private�Banking�other�loans:�type�of�loan�(100% = €1.8 billion)
14%
35%
25%
17%
9%
Provision�31/12/2018(€�million)
Loanportfolio
Impairedloans
Provision Impairedratio
Coverageratio
Impairedratio
Coverageratio
Mortgages 5,756 63 8 1.1% 12% 1.0% 20%
Other loans 1,793 112 69 6.2% 62% 6.8% 50%
Private�Banking 7,550� 175� 77 2.3% 44% 2.5% 41%
Loans to SMEs 251 125 22 49.9% 17% 29.2% 21%
Real estate financing 271 31 2 11.3% 8% 10.3% 16%
Corporate�Banking 523� 156� 24 29.8% 15% 20.2% 19%
Mortgages distributed by third parties 602 0 0 0.0% 3% 0.0% 15%
Total 8,674� 331 101 3.8% 30% 4.0% 31%
Provision –114
Total 8,561� 101
ECL stage 1 and 2 (IFRS 9) 13
Total�ECL�(IFRS�9) 114
Progress report 33

Capital�and�liquidity�management��Our fully loaded Common Equity Tier 1 ratio (CET 1 ratio) improved from 20.3% to 21.4% in 2018, reflecting our robust capital position. In 2016, we announced our ambition to distribute at least €250 million to shareholders of Van Lanschot Kempen NV in the period up to and including 2020. A total of over €210 million has now been paid out, in the form of both dividends and capital returns. Including the proposed 2018 dividend, a total of over €270 million will have been returned in 2019. This means that we have already achieved this ambition. In the future, we will continue to optimise our capital base in terms of level and type of instrument, while leaving room for possible acquisitions. If possible, we will also consider paying out excess capital to shareholders of Van Lanschot Kempen NV, subject to approval by the regulator.
Due to the treatment of Tier 2 notes, Van Lanschot NV’s total capital ratios differ from those of Van Lanschot Kempen NV.
Capital�managementOur CET 1 fully loaded ratio improved once again, to 21.4% at the end of 2018, mainly driven by an 8% decline in risk-weighted assets to €4.6 billion (year-end 2017: €5.0 billion).
The total capital ratio strengthened to 24.9% (year-end 2017: 23.4%).
As expected, the CET 1 ratio decreased by 1.3 percentage points due to the capital return and by 0.2 percentage points due to the impact of IFRS 9. The €0.2 billion reduction in risk-weighted assets at Corporate Banking due to run-off had a positive impact on the CET 1 ratio of 0.9 percentage points. The ratio also gained 0.7 percentage points from an improvement in credit and data quality.
Basel�IVIn December 2017, the Basel Committee on Banking Supervision (BCBS) published the final instalments of its reforms for the calculation of risk weighted assets and capital floors. The finalised reforms are collectively referred to as “Basel IV”. Assuming no delay in translating this into EU regulation, Basel IV will come into effect on 1 January 2022. Our expectation as to the impact of Basel IV remains unchanged. Based on our current balance sheet and credit models, provisional calculations suggest that our risk-weighted assets should increase by no more than 10% on the implementation of Basel IV. These calculations are based on assumptions about the actual implementation of the Basel IV proposals in legislation.
IFRS�16IFRS 16 Leases was issued in January 2016 and replaces IAS 17 Leases and IFRIC 4 Determining Whether an Arrangement Contains a Lease. IFRS 16 sets out the principles for recognition, measurement, presentation and disclosure of leases and will result in almost all leases being recognised on the balance sheet. The impact of applying IFRS 16 as of 1 January 2019 is expected to result in an increase in risk-weighted assets of €60-70 million. The effect of this increase in risk-weighted assets on our CET 1 ratio is a decrease of approximately 0.3 percentage points.
Investment�portfolio�and�cashThe total investment portfolio and cash5 amounted to €3.9 billion at the end of 2018 (year-end 2017: €4.4 billion). Relative to its end-2017 level, cash held with central banks decreased by €0.3 billion. Other financial assets at amortised cost portfolio6 stood at €0.6 billion at the end of 2018 and had hardly changed in size or composition. The investment portfolio is primarily held for asset and liability management purposes, and mainly comprises low-risk and highly liquid instruments.
Capital�and�liquidity�management�(€�million) 31/12/2018 31/12/2017 %
Risk-weighted assets 4,580 4,979 –8%
Common Equity Tier 1 ratio, fully loaded (%)4 21.4 20.3
Common Equity Tier 1 ratio, phase-in (%)4 21.4 20.5
Tier 1 ratio, fully loaded (%)4 21.4 20.3
Tier 1 ratio, phase-in (%)4 21.4 20.5
Total capital ratio, fully loaded (%)4 24.9 23.4
Total capital ratio, phase-in (%)4
25.0 23.6
Leverage ratio, fully loaded (%)4
6.9 6.7
Leverage ratio, phase-in (%)4 6.9 6.7
Common�Equity�Tier�1�ratio�(fully loaded) (%)
31/12/2017 Capital IFRS 9 Retained Corporate Credit Other 31/12/2018 return impact earnings Banking and data run-off quality improvement
–1.3% –0.2%
0.3%
0.9%
0.8%
0.7%20.3%
21.4%
4 Full year 2018 and 2017 including retained earnings; half-year 2018 excluding retained earnings.5 Investment portfolio and cash comprises the balance of financial assets at fair value through other comprehensive income, other financial assets at amortised cost, financial
assets designated at fair value through profit or loss, cash withdrawable on demand from central banks, and highly liquid (cash) investments.6 Previously known as held-to-maturity investments.
Investment�portfolio�and�cash�by�country�at�31/12/2018(100% = €3.9 billion)
Cash Netherlands Belgium United Kingdom Canada Australia Norway France Italy Other
33%
19%10%
7%
5%
5%
4%
4%4%
9%
Progress report 34

FundingWe aim to retain access to both retail and wholesale markets through diversified funding. At the end of 2018, our funding ratio had increased by 5.7 percentage points to 106.2% (year-end 2017: 100.5%) in the wake of a decline in loans and advances to clients (-6%) and in savings and deposits (-1%).
In June 2018, a senior unsecured bond was redeemed and in December 2018 an RMBS was redeemed. Overall issued debt securities fell by €0.9 billion in 2018. We no longer have RMBS and benchmark unsecured debt issuances placed with investors.
RatiosAt the end of 2018 our liquidity ratios based on Basel III rules as currently known were as follows:
Events�after�the�reporting�period�On 19 February 2019, Van Lanschot Kempen announced the sale to De Goudse Verzekeringen of its interest in Van Lanschot Chabot | Mandema & Partners. The proposed transaction is expected to be completed in the first half of 2019 and to generate a book profit of around €15 million, with possibly a minor earn-out in the first half of 2020.
Funding�redemption�profile�(€ million)
2019 2020 2021 2022 2023 ≥2024
1,000
800
600
400
200
0
Senior unsecured Covered bond Subordinated
Funding�mix�at�31/12/2018�(100% = €14.0 billion)
Client savings and deposits Debt securities Interbank funding Equity Other funding
65%
19%
2%9%
5%
Ratios 31/12/2018 Require-ment
31/12/2017
Liquidity coverage ratio (%) 140.6 > 100 163.6
Net stable funding ratio (%) 129.8 > 100 129.2
Progress report 35

Progress report 36
VAN LANSCHOT PRIVATE BANKINGGuiding�our�clients�during�every�phase�of�their�lives
Despite a somewhat unpredictable market in 2018, Private Banking saw a net inflow in assets under management of €0.5 billion, driven by organic growth from existing clients as well as new clients. And there are many reasons for this. We have broadened the range of investment strategies and products available to clients, which has helped to encourage our existing clients to do more business with us as well as contributing to referrals. We’ve also seen increased interest in our sophisticated investment advice product, which includes a highly innovative app. Moreover, our personal approach continues to make our service very popular among clients.
In the Netherlands, the strong economy made it easier for entrepreneurs to sell their businesses, which has also resulted in increased assets invested with us. Our mortgages portfolio has been stable as a result of a strong housing market on the back of low interest rates. On the flip side, however, interest income remains under pressure due to lower interest margins. Investments in riskier assets such as equities have increased during 2018 as they represent higher returns in a climate where lower risk investments
yield very little. We also see clients opting for alternative ways to make returns, for example by investing in real estate.
We continue to serve our defined target groups – entrepreneurs, family businesses, high net-worth individuals, business professionals and executives, healthcare professionals, and foundations and associations – within our markets in the Netherlands, Belgium and Switzerland. In the latter, we are the only Dutch bank catering specifically to Dutch and Belgian clients.
Improving�client�experience�through�technologyAs part of our Strategy 2020 investment programme, in 2018 our Digital XL team made great strides in taking our omni-channel Private Banking model to the next level. The reporting year has seen the continuous improvement of our investment app, a new “Mijn Van Lanschot” (online portal) for all our clients, the introduction of Vermogenshorizon (goal monitoring and scenario analyses), the Compass app for bankers, and the Messaging Centre for investment advisers. All these tools have significantly strengthened our client offering, especially when coupled with our personal service.
Alongside our own omni-channel platform, we are collaborating with strategic partners for non-core wealth management services such as payments. Under the strategic investment programme, Van Lanschot Kempen is therefore forging ahead with the outsourcing of our payment services to German fintech company Fidor. The technical development of the new payments platform and payments app was completed at the end of 2018. Migration of all existing clients to the new platform is planned in the course of 2019.
In addition to our strategic investment programme, our work on advanced data analytics has already enhanced client experience in multiple ways. We were able to develop data applications for our bankers to help them to serve their clients better.
Private�Banking�(€�million) 2018 2017 %
Commission 127.0 124.5 2%
Interest 137.7 151.4 –9%
Other income 1.1 1.0 1%
Income�from�operating�activities �265.7� �276.9� –4%
Staff costs 99.4 96.5 3%
Other administrative expenses 48.0 51.3 –6%
Indirect costs 61.5 57.9 6%
Depreciation and amortisation 1.0 1.3 –28%
Operating�expenses� 209.9 207.0 1%
Gross�result �55.9� �69.9� –20%
Impairments –3.2 –3.2 –
Operating�profit�before�special�items�and�tax �59.0� 73.1 –19%
Strategic investment programme 22.0 21.4 3%
Amortisation of intangible assets arising from acquisitions
4.8 3.0 60%
Restructuring charges 3.8 – –
Operating�profit�before�tax 28.4 �48.6� –42%
Income tax 7.4 13.4 –45%
Net�result 21.0 �35.2� –40%
Underlying�net�result 40.4 �51.3� –21%
Financial�performance Assets�under�management:�by�country�(€21.3�billion)
Netherlands Belgium Switzerland
14%
82%
4%

Progress report 37
We also created an analytical tool to allow us to deep-dive into investment portfolios at multiple levels: for example, regional level and macro/company-wide level. We will continue to educate our employees to be able to make the best use of all the data and channels available to them, so they can play a guiding role for our clients. For full details, please read the “Digitalisation and advanced analytics” section on page 18.
Innovation�in�our�processesIn our ambition to keep on innovating from an operations perspective, in 2018 we succeeded in launching our first process using Robotics Process Automation (RPA) – meaning we are using a robot for one of our administrative wealth management processes. In 2019, we plan to develop more RPA processes. By innovating on our operational processes, we’re able to serve our clients more quickly and efficiently.
Our�business�in�BelgiumOur Belgian Private Banking business saw strong growth in 2018, with net inflow in assets under management at more than 7% (2017: 5%) driven by organic growth from both new and existing clients. Reasons for this include our tax-efficient product proposition, simplicity and transparency in terms of costs and underlying assets in our funds, and our focus on liquidity events with our clients. We are pleased to report on our strong cooperation with Kempen Merchant Banking during the reporting year – both collaborating with the Structured Products team to create tailor-made structured products for our Belgian clients, and working with the Corporate Finance team in the life sciences and real estate sectors in particular.
Other highlights of progress made in 2018 include:– Initiation of our migration to the same IT infrastructure
as the Dutch Private Banking business in order to benefit from omni-channel development, enhanced security and greater efficiencies. Once completed, our Belgian clients will also gain access to far more digital capabilities than they have currently, including all the apps and the new website under the Strategy 2020 investment programme. This long and complex process started in April 2018 and is scheduled for completion over the course of 2019.
– Development of Lombard loans. We have created a new team and redesigned the credit department to help bankers offer these kinds of loans as a solution for our clients.
– Since the end of 2018, we are using the best-in-class method to manage our five profile funds, based on ESG research by MSCI ESG. Forum Ethibel has been appointed as an independent controller to monitor the application of this method every six months to ensure the funds comply with the chosen ESG approach.
Integration�of�UBS’s�domestic�wealth�managementFollowing our acquisition of the wealth management arm of UBS in the Netherlands in 2017, the integration was completed successfully in 2018. We are now also able to offer consolidated reporting and strategic advice to existing Van Lanschot clients as well as former UBS wealth management clients in the Netherlands.
Van�Lanschot�Private�ServiceWe aim to act as a guide to our clients in every phase of their lives – in financial as well as non-financial services. We therefore offer Van Lanschot Private Service as an additional, complimentary advice service to our investment advisory clients. Accessible via our investment app, Van Lanschot Private Service offers access to a range of possibilities covering six services: lifestyle, travel, concierge, healthcare, wine circle and trusted advisers. Our clients value this service because of the strong and trusted reputation of the Van Lanschot brand.
Net�Promoter�Score�Our clients with at least €500,000 in assets under management gave Private Banking an average rating of 7.8 in 2018, bringing our Net Promoter Score (NPS) to 2. This is a different methodology compared with previous years, when we measured client satisfaction and NPS amongst all our clients, including clients with less than €500,000 in assets under management. In 2017, our clients overall rated us at 7.6 (NPS: –4).
Priorities�for�2019In 2019 and beyond, we aim to grow further and to build on our ambition to provide customised solutions to clients, including by improving our new family solutions proposition. For full details, please read the “Solutions for clients” section on page 17. We will also continue building our predictive capabilities based on our data analytics for the benefit of bankers and clients, and improving our digital tooling so that our clients can reach us anywhere, anytime, and receive the service that’s most relevant for them. We also plan to make our investment app a two-way communication channel so that investment advisers can send their clients an investment proposal, which clients can accept or decline immediately within the app.

Progress report 38
EVI VAN LANSCHOTMaking�investment�easy�online�
Evi is Van Lanschot Kempen’s online savings and investment coach in the Netherlands and Belgium. It is mobile-first, easy to use and available to everyone who can invest at least €1,000. Evi’s strength is to keep it simple and insightful for both first-time and experienced investors.
Continued focus on client growth has led to a 23% increase in the number of clients entrusting their assets under management to Evi – from 13,000 in 2017 to over 16,000 in 2018. This growth was across all target groups – including Millennials, mass-affluent individuals (with over €100,000 in liquid assets) and the children of our Private Banking clients.
Despite client growth, assets under management were relatively stable at €0.9 billion. Increased financial market volatility and negative price movements made clients hesitant to invest, in particular in the last quarter of the year. In addition, we have seen Evi clients withdrawing money for consumption purposes, especially those who have been clients for a while. Total client assets stood at €1.4 billion at year-end (2017: €1.5 billion).
The trend from savings to investments continued in 2018 – partly due to continued low interest rates, and partly due to Evi’s goal to demystify asset management. The share of assets under management within total client assets increased slightly from 60% to 61% in the reporting year. The average account size of clients investing with Evi amounts to around €55,000.
Mobile�firstIn line with our clients’ increasing adoption of mobile technologies, Evi has now fully embraced a mobile-first approach. The Evi app has seen several developments during the reporting year:– Full digital on-boarding enables users to become clients
via mobile, without the need for any other devices.– Evi’s products – Evi Beheer, Evi Pensioen, Evi
Doelbeleggen, Evi4Kids and Evi Go – are now accessible via one single app.
– In Evi Beheer, clients can now continuously withdraw money or make additional investments, with no blackout period.
– Clients can opt to receive push notifications about their investments.
– The app has been fully revamped with a new look & feel and new functionality – including the ability to see the performance of each client’s particular product(s) and fund, specific to their profile.
Evi�GoOur new Evi Go product was introduced in September 2018 as a self-directed investment solution for clients. The tool enables clients to choose their own risk profile from the five on offer, and then start investing personal savings quickly and easily.
Net�Promoter�ScoreIn 2018, our clients gave Evi an average rating of 7.3 (2017: 7.5), and our Net Promoter Score (NPS) decreased from –3 in 2017 to –20. Part of this drop can be explained by disappointing returns on clients’ investment portfolios; this NPS survey was conducted in November, in the midst of equity market turbulence. On the positive side, the 60% open rate of our monthly newsletter shows that our clients appreciate Evi’s communication and provision of information.
Financial�performance
AuM Savings
Client�assets�by�product�(€1.4�billion)
39%
61%
Evi�(€�million) 2018 2017 %
Commission 4.4 4.5 –2%
Interest 2.5 3.3 –25%
Other income – – –
Income�from�operating�activities �6.9� 7.9 –12%
Staff costs 4.2 4.6 –9%
Other administrative expenses 9.1 7.9 15%
Indirect costs 2.9 7.0 –59%
Depreciation and amortisation 0.0 0.0 –18%
Operating�expenses� �16.1� �19.5� –17%
Gross�result –9.2 �–11.6� –21%
Impairments 0.0 – –
Operating�profit�before�special�items�and�tax –9.2 �–11.6� 21%
Restructuring charges 0.1 – –
Operating�profit�before�tax –9.3 �–11.6� 20%
Income tax –2.6 –2.0 28%
Net�result �–6.7� �–9.6� 31%
Underlying�net�result �–6.6� �–9.6� 31%

Progress report 39
Priorities�for�2019The reporting year marked Evi’s fifth anniversary. Now that our online asset manager is becoming a mature e-commerce organisation, less IT and product development spend will be needed going forward. In 2019, our main challenge is to grow Evi’s business, by increasing the average assets under management per client and improving financial results. In order to do this, Evi is aiming for even greater efficiency and improvements in mobile functionality. Ease of use and quality of service will continue to be improved, especially via our Evi avatar that enables conversational on-boarding of clients through the use of digital technologies. We will also continue to use advanced marketing analytics to make personalised offers to clients that satisfy their individual needs and interests. Finally, we will look for possible partnerships – for example, with parties that also serve mass-affluent clients.

Progress report 40
KEMPEN ASSET MANAGEMENTSpecialising in investment strategies and fiduciary management
Kempen Asset Management, trading as Kempen Capital Management (KCM), is a specialist asset manager in two main areas: investment strategies, and client solutions in the area of fiduciary management. Our net inflows of AuM amounted to €0.4 billion in 2018, which combined with a €1.2 billion negative market performance to push down total assets under management to €44.8 billion in the reporting year (2017: €45.5 billion). Fiduciary management recorded robust AuM inflows on the back of various new mandates. Our investment strategies faced a net AuM outflow over the year, due to portfolio rebalancing on the part of various clients. Traditionally an active manager, Kempen Asset Management decided to stop fundamental index investing as part of its product offering in 2018, which also contributed to the AuM outflow from our investment strategies.
Growing our fiduciary businessKempen Asset Management has once again been the fastest growing fiduciary manager in 2018 – acquiring several new pension schemes. Notable fiduciary mandates that came in during the reporting year included the acquisition and on-boarding of pension fund Arcadis (after winning the pension fund in collaboration with Hnpf in 2017), a new €8.5 billion mandate from Stichting Pensioenfonds PostNL (won in 2018 and coming into effect in 2019), and a new
mandate from Covra. Our success in the pensions market is down to the client focus of the team as well as the highly specialist and long-term nature of the solutions we create with our clients, both in the Netherlands and in the UK, putting us in a good position for future execution.
Growth in our UK fiduciary business has been flat in 2018, but there is a growing pipeline as a result of a review by the Competition Market Agency (CMA) into the consultancy and fiduciary marketplace in the UK. As a result, Kempen Asset Management is well positioned to take opportunities to win fiduciary mandates in the UK. Moreover, 600 pension funds that currently have fiduciary arrangements in place need to re-tender in the near future.
From a regulatory perspective, we’ve seen an increase in supervision and regulation in the savings and pension market – especially with the implementation of MiFID II during the reporting year. While some see this as a constraint, this represents an opportunity for our fiduciary business. It both rewards us for the clarity of our advice to clients, and creates barriers to new fiduciary managers entering the market. We have already been providing clients with advice on solutions and underlying investment managers for many years – allowing them to select their own investment policy.
Developments in our investment strategies For investment strategies, we saw inflow in all of our core markets: the Netherlands, the UK, Germany and Switzerland. The overall total effect on our assets under management was down, however, due to the effect of closing our passive fundamental indexation products and some asset allocation shifts out of our credit and dividend strategies.
In order to free up resources, create efficiencies and focus on future growth, in some cases we may need to discontinue certain products or strategies - for example, the closing of our passive fundamental indexation investment strategy and funds. We also decided to close our Edinburgh office in order to centralise our small-cap capabilities in Amsterdam.The results of most of our investment strategies in 2018 were again very good. Over the last three years, 80% of our funds outperformed their benchmarks. Most of our investment strategies score first quartile within their international peer group and have high Morningstar ratings.
Financial performance
Pension funds and insurance providers
Banking alliances and wealth managers
Family offices and high net-worth individuals
Van Lanschot and Evi clients
AuM breakdown by client type (€44.8 billion)
9%
84%
1%6%
Asset Management (€ million) 2018 2017 %
Commission 100.0 92.5 8%
Interest –0.0 –0.0 –
Other income –0.2 –1.3 84%
Income from operating activities 99.8 91.2 9%
Staff costs 43.6 39.6 10%
Other administrative expenses 23.5 21.9 7%
Indirect costs 12.8 10.9 18%
Depreciation and amortisation 0.1 0.1 –3%
Operating expenses 80.1 72.5 10%
Gross result 19.7 18.7 6%
Impairments – – –
Operating profit before special items and tax 19.7 18.7 6%
Amortisation of intangible assets arising from acquisitions 0.8 0.5 83%
Restructuring charges 2.5 – –
Operating profit before tax 16.3 18.2 –10%
Income tax 4.4 5.0 –12%
Net result 11.9 13.2 –9%
Underlying net result 13.8 13.2 5%

Progress report 41
During 2018, we also further improved the sustainability of our funds and strategies. As long-term stewards, we strongly believe in active ownership of the companies we invest in on behalf of our clients. Also last year we made good progress on this front. Please read the “Responsible business” section on pages 19-21 for more details.
New solutions introducedIn 2018, we co-created the Global Impact Pool together with our clients – the fund brings together the knowledge of assets, investments and ESG of both our impact team and our fiduciary team. Throughout the year, this fund has been extended to be used more in the portfolios of both Private Banking clients and Asset Management clients as part of our broader solutions framework.
Our Kempen Private Markets Fund was also successfully launched in 2018, with €43 million in assets under management by the end of the year. This is a unique proposition for investing in less liquid markets, such as private equity, infrastructure and land.
Redesign of distribution strategyIn 2018, we started implementing our strategy to grow internationally, adding clients in all our core markets. We are focusing on the Netherlands, Germany, the UK and France, with an emphasis on particular products that meet local needs. In the UK, we made two new distribution agreements, extending our relationships in the UK market.
Meanwhile, we have also been future-proofing our business by making significant investments in data infrastructure and application management. Distribution no longer takes place solely on a person-to-person level. In addition to direct distribution by Kempen employees, we are increasingly introducing agents and call centres, databases, consultants and multi-managers. Internationally, we are focusing more on this B2B2C business: no longer selling our investment strategies directly to clients, but instead to distributors. We are using data infrastructure – including databases and third-party distributors – to improve our distribution capabilities. We are also enhancing the information we provide to databases such as Morningstar in order to strengthen our distribution power.
Operational developmentsAcquiring significant numbers of new clients also requires us to on-board those new clients – something we successfully achieved in 2018. We were able to help new clients change custodians and start serving them within the agreed time period. With several new funds being launched, we were able to get these approved by the regulators and put everything in place in time to introduce and establish them successfully.
We also put a lot of effort into further enhancing our data architecture so that we are better able to service the information demands of our clients in the future.
Teaming up with Private Banking and EviKempen Asset Management aims to support Van Lanschot Kempen’s private clients in meeting their financial goals – both in Van Lanschot Private Banking and Evi. In 2018, we focused on performance in terms of variety of solutions, asset allocation and manager selection. For Van Lanschot Private Banking, we created more specialist products,
selected different managers for specific clients, made better advice products and so on – all to help meet client objectives. We’ve seen a high success rate in on-boarding the former UBS clients, in which the two sides of the business have conducted meetings together – demonstrating our strength when we act as one. In collaboration with Evi, we created Evi Go, which was successfully launched in 2018.
Net Promoter ScoreAsset Management measures its Net Promoter Score (NPS) every two years. Our NPS in 2017 was a very strong 44. Although we did not conduct an NPS survey in 2018, we continue to receive positive feedback from our clients.
Awards and rankingsKempen Asset Management was recognised with a number of awards and rankings in the reporting year:– Lipper Fund Awards: Kempen won five prizes at the
annual Lipper Fund Awards. – Morningstar ratings: Due to the strong long-term
performance of our investment funds, the average Morningstar rating of our funds is a very strong four stars (out of five).
– RI Reporting Award: Kempen’s annual responsible investment report 2016-17 won the Responsible Investor Award for Best Report by an asset owner of large funds over $25 billion.
– UN PRI: PRI awarded Kempen’s responsible investment process with an average score of A or A+ on three ESG-related modules.
– Institutional Investor Benelux Awards: Kempen won this award in the “Best Fund Selection Team Alternative Investments” category and in the “Best ESG programme” category.
Priorities for 2019In 2019, we aim to continue the growth of our fiduciary business – focusing on diversification and quality in our portfolio of businesses and clients. We will also reinforce our sales approach by increasing our sales to distributors and pension funds rather than directly to the end-client. Additional priorities will be further expansion in the UK, and family solutions in cooperation with Van Lanschot Private Banking.
Within the investment strategies side of the business, we are already focusing more on niche products in areas where we can really add value. Given the long-term track record and performance of our existing investment strategies, in 2019 we will leverage our capabilities to grow further in this area.
Focusing capital on the long term has always been an important concept for us, which is why sustainability and ESG factors are an increasing priority and growth area – not only in the Netherlands but increasingly in the UK and France as well. Our continued focus on ESG puts us in a good position for the future.

Progress report 42
Selection of Kempen investment strategies
Performance overview 1 vs. benchmark (3-year horizon, %)
Dutch Small-caps2
European Participations2
European Small-caps
European Sustainable Small-caps
Global Small-caps
European Dividend
Global Dividend
Global Sustainable Equity
Euro Credit
Euro Credit Plus
Euro Sustainable Credit
Euro Government Bonds
European Real Estate
Global Real Estate
Global Diversified Hedge Fund Solutions2
Global Non-Directional Hedge Fund Solutions2
1 Annualised performance figures based on a representative account gross of fees until end of December 2018. 2 Performance figures net of fees. 3 No benchmark available.
Benchmark
Kempen Strategy
Dutch Smacaps
European Participations*
European Smartcaps
European Sustainable Sn-caps
Global Smacaps
European Dividend
Global Dividend
Global Sustainable Equity
Euro Credit
Euro Sustainable Credit
Euro Credit Plus
Euro Government Bonds
European Real Estate
Global Real Estate
Global Diversified Fund of Hedge Funds*
Global No-Directional Fund of Hedge Funds*
21.021.0
33.4
15.1
12.615.1
17.711.6
7.97.0
11.99.5
9.39.5
3.02.1
2.82.1
3.42.1
1.71.3
10.87.9
8.54.7
2.7–0.1
–0.13.2
13.7
384
674
799
571
315
431
881
938
128
117
2,352
763
118
186
2,174
4,657
AuM overview (€ million)
3203.8
14.23
–0.6
–2.1
1.1
1.1
11.34.2
2.60.4
7.5
7.24.5
2.71.9
3.01.9
2.5
1.61.5
0.8
3.31.0
1.2
3.1
–0.9
–2.1
–2.1
1.9
4.5
4.4
570
466
346
308
579
308
201
2,291
697
303
476
419
4,397
1,936
90

Progress report 43
KEMPEN MERCHANT BANKINGFocusing on sectors to create a strong franchise
Kempen Merchant Banking is a unique boutique that combines Corporate Finance and Equity Capital Markets (ECM) with a Securities franchise. In 2018, we were able to harvest positive results due to a strong focus on our selected sectors coupled with close collaboration between the two parts of the business. Overall, our commission income in 2018 saw a strong increase compared to last year at €58.0 million (2017: €41.7 million). In Corporate Finance and ECM, we successfully completed €37 billion in M&A, debt advisory and ECM transactions for our clients in ten countries.
Our sectors Kempen Merchant Banking combines strong execution skills with in-depth expertise in financial institutions & fintech, infrastructure, life sciences & healthcare, maritime & offshore, real estate, and the Benelux region. We have realised growth in all our sectors during the reporting year. Our real estate business has expanded in Spain, the UK, Belgium and France. In infrastructure, we executed our first ECM, M&A and debt advisory mandates. In our life sciences business, we’ve executed our first ECM transactions in the US.
Our geographies In 2018, we continued to expand our activities in Europe as well as in the US.
When our European life sciences clients grow and need additional capital, they often seek a secondary listing in the US, for which they ask for our help. As a result, we decided to explore the possibility of assisting them in raising capital in this way; and in July 2018, we were granted approval by the US regulator FINRA to offer our services as an underwriter in ECM transactions in the US. In September, we executed our first two deals: both Galapagos and argenx were looking to raise additional capital in the US, and we were able to participate as underwriter – helping them to raise $345 million and $301 million respectively in capital.
Also in 2018, we made good progress on our Belgian business. In January, we obtained a licence from the Belgian regulators, as a result of which we were able to carry out our activities from Belgium. We therefore opened an office in Antwerp. This has allowed us both to tap into the Belgian talent pool in terms of new hires, and to create a stronger commercial position for ourselves among Belgian institutional investors. As a result, we’ve seen an increase in our number of Belgian clients in Securities, from 10 in 2017 to 18 in 2018, as well as a couple of new prospects.
In the UK market, the reporting year saw our first UK ECM transaction completed: we acted as joint global coordinator for logistics real estate company Tritax EuroBox in their £300 million IPO. Having been actively targeting the UK market as part of our international growth strategy, this is an important step for our franchise.
Corporate Finance and ECM transactionsOf the 38 transactions we carried out in 2018, a few were particular highlights. When Unibail-Rodamco acquired Westfield in the largest real estate takeover seen to date, we were advisers on the $24.7 billion transaction. We were also proud to advise residential housing operator Vesteda in their acquisition of a portfolio of residential real estate from NN Group for €1.5 billion.
Financial performance
Merchant Banking (€ million) 2018 2017 %
Commission 58.0 41.7 39%
Interest –0.0 0.0 –
Other income 1.0 4.5 –79%
Income from operating activities 58.9 46.2 27%
Staff costs 26.2 23.4 12%
Other administrative expenses 9.1 8.0 15%
Indirect costs 9.9 9.2 7%
Depreciation and amortisation 0.0 0.0 –9%
Operating expenses 45.2 40.6 11%
Gross result 13.7 5.6 –
Impairments –0.0 – –
Operating profit before special items and tax 13.7 5.6 –
Restructuring charges 0.1 – –
Operating profit before tax 13.6 5.6 –
Income tax 3.1 1.7 83%
Net result 10.5 3.9 –
Underlying net result 10.6 3.9 –
Commission income by type of transaction (€58.0 million)
M&A ECM Brokerage and research Structured Products Other
25%
7%2%
24%
42%
Progress report 44
In Belgium, we were joint bookrunner in the €575 million IPO of Shurgard, whilst in Germany we were a bookrunner on the €1 billion capital increase for Vonovia. And in Spain, Kempen Merchant Banking acted as sole financial adviser to Lazora in the €750 million capital increase for its residential fund.
In our other sectors, we advised Van Oord on the acquisition of MPI Offshore, a specialist offshore wind installation contractor; and we acted as sole financial adviser to UnifiedPost in the issuance of their pre-IPO convertible. Finally, we were involved in raising almost €1 billion in equity financing for life sciences and healthcare companies, mostly in leading syndicate roles. For instance, for repeat client Mithra Pharmaceuticals, we acted as joint bookrunner in their €77.5 million capital increase. In addition, we were sole financial adviser to pharmacy chain Medsen and wholesale chemist Ceban in its proposed sale to Bencis Capital Partners.
All companies to which Corporate Finance provides services are first subjected to screening. Screening based on our ESG criteria also forms an integral part of our research reports. If a company does not meet these ESG criteria, we engage its management.
SecuritiesIn 2018, we continued to implement our strategy to expand the reach of our existing activities. Our financial results were impacted by the volatile markets during the last two months of the year. Global Property Research had another solid year. In addition to providing our Structured Products services to Van Lanschot Private Banking, we’ve been able to do more business in the over-the-counter market. In 2018, we closed a total of 143 deals (2017: 194) worth €181 million in new notional (2017: €294 million).
MiFID II has a substantial impact on our Securities business because of its requirement to unbundle research fees and execution commission. This is partly reflected in our results.Both before and since the regulation came into effect on 3 January 2018, a lot of effort has been made in terms of implementation and mitigation, but we expect it to take up to two years before the implications are fully clear. Our strong focus on, and deep knowledge of, our sectors continue to add value to our clients in all areas of our Securities business.
Our project to build a data warehouse was completed in 2018, allowing for more data-driven insights and decision-making when it comes to our clients and research. We are now better able to develop digital solutions and dashboards – for example, to monitor the progress of our business, to monitor interactions with clients, and to provide more customised services to clients. For more details, please see the “Digitalisation and advanced analytics” section.
ConferencesIn 2018, we organised six successful conferences: in New York (real estate), Amsterdam (life sciences and real estate), Paris (local alpha), London (local alpha) and Stockholm (real estate). A record number of corporates and investors joined the events; in total, we welcomed over 140 corporates and over 200 investors.
Priorities for 2019In 2018, we continued executing on the priorities we set in 2017. Given the positive results so far, we intend to continue our activities based on the same strategy in 2019. Our aim is to focus particularly on realising the full potential of our specialist approach, through further cooperation between the different sectors and services within Merchant Banking. Other priorities include developing tools to better benefit from the use of data; and attracting, developing and retaining the best talent.

Progress report 45
PRIVATE EQUITY INVESTMENTS
Over the years, Van Lanschot Kempen has been active in private equity in three different ways:1. Acquiring and managing minority holdings;2. Managing non-strategic investments;3. Managing interests in private equity funds.
1. Acquiring and managing minority holdingsVan Lanschot Kempen holds a number of minority holdings, both indirectly via Bolster Investments Coöperatief U.A. since 2017, and directly via our Van Lanschot Participaties portfolio that was built up over the years prior to 2016.
Bolster Investment PartnersIn December 2017, we spun off the management company of Van Lanschot Participaties, now Bolster Investment Partners. This enabled us to open up our private equity business to our Private Banking clients as well as to third parties, via a newly established fund: Bolster Investments Coöperatief U.A.. Bolster lnvestment Partners’ investment strategy is in line with Van Lanschot Participaties’ original focus: investing in well-managed Dutch companies with strong market positions and convincing growth strategies. Bolster Investment Partners specialises in taking primarily minority shareholdings in private companies, and pursues a flexible, long-term investment horizon. An integral part of the due diligence Bolster undertakes before acquiring an interest in a company involves assessing whether that company meets specific environmental, social and governance criteria.
Bolster Investments Coöperatief U.A. raised €135 million in its first closing in December 2017. In addition to Van Lanschot Kempen, which holds a significant minority interest, other investors mainly comprise Van Lanschot Private Banking clients. In February 2018, Bolster Investments Coöperatief U.A. raised an additional €25 million in a second and final closing, through which it reached its hard cap of €160 million committed capital. In 2018, two new investments were added to the fund: Esschert Design and Careflex Zorg Groep. In the coming years, Bolster Investment Partners will strive to put the capital raised to work by making additional investments.
Maintaining direct minority holdings in our Van Lanschot Participaties portfolio Van Lanschot Kempen has built a portfolio of direct minority holdings over the years, focusing on entrepreneurs and owner-directors: both existing Van Lanschot Private Banking clients and entrepreneurs who are potential clients. We have provided growth capital, facilitated management buy-outs, and acquired shareholdings from existing shareholders.
Our portfolio of direct minority holdings comprised nine companies on 31 December 2018. No new holdings will be added to this portfolio, but we may make follow-on investments in existing minority holdings. We maintain our long-term investment horizon, and potential divestments will be driven mostly by the strategic development of the companies. This portfolio continues to be managed by Bolster lnvestment Partners.
In July 2018, our portfolio company Ploeger Oxbo Group attracted NPM Capital as a new major (40%) shareholder. As a result, we were able to realise a net profit of over €10 million as part of the recapitalisation and sale of approximately 9% of our equity shares. NPM Capital is the strong financial partner that the manufacturer of specialty agricultural equipment has been looking for to further support its long-term growth strategy. This strategy is aimed at bolstering innovation and product development as well as bolt-on acquisitions to further strengthen Ploeger Oxbo’s leading position in its worldwide niche markets. We currently still hold a stake of around 12% in Ploeger Oxbo Group.
In October 2018, our 30.5% equity stake in ORMIT was sold to a new shareholder, HR investment group Pyramid. Van Lanschot Participaties acquired its stake in ORMIT in 2010. Since then, ORMIT and its shareholders have successfully expanded the business in the Dutch and Belgian markets for recruitment, retention and development of talent.
MARKET VALUEAt year-end 2018, our total portfolio of private equity investments reflected a market value of over €170 million (2017: over €160 million).

Progress report 46
2. Managing non-strategic investmentsWe hold a number of companies classified as non-strategic investments. These are typically majority interests arising from debt-for-equity swaps we agreed in the past. Our aim is to divest our shareholdings in such non-strategic investments over time.
In December 2018, Van Lanschot Kempen announced the sale of its stake in chemists chain AIO II (Medsen) to funds under management of Bencis. The relevant regulators and competition authorities have since approved the deal and the transaction was completed in February 2019. Book profit works out at around €35 million and will be recognised in 2019 results. AIO II is the holding company
of pharmacy chain Medsen and wholesale chemist Ceban. Van Lanschot Kempen has held an equity stake in AIO II since 2009, when it acquired a minority interest through a debt-for-equity swap. The company staged robust growth in the years that followed. In 2016, Van Lanschot Kempen exercised its option to expand its stake to a majority interest of 72%.
At this point, we hold two non-strategic interests: Holonite and Allshare. Holonite, in which we hold a 90% stake, makes high-quality composite stone products and finishing elements. Allshare, in which we hold a 97% stake, develops software for the financial sector and is a key supplier to Van Lanschot Kempen.
Direct minority holdings1
1 For more information on our investments in associates using the equity method, see page 171.
3. Managing interests in private equity fundsWe built a portfolio of interests in private equity funds before 2010. As most of these funds are being liquidated, these interests are gradually being wound down.
Non-strategic investments

RISK AND CAPITAL MANAGEMENT
Risk ManagementRisk profile and risk appetiteHistorically, we have sought to achieve a solid risk profile – expressed in transparent risk levels coupled with a robust liquidity and capital position. The risks we face are outlined in the following sections. More detailed descriptions can be found in the financial statements, where these risks are also quantified, wherever possible, in terms of their impact on Van Lanschot Kempen.
We evaluate our risk appetite annually, and this is then communicated in a risk appetite statement containing both qualitative and quantitative elements. Our risk appetite represents our willingness to accept the risk of particular losses or decreasing buffers, and as such sets our operating boundaries. We use the loss absorption capacity (maximum acceptable level of losses) for the calibration of these boundaries. The statement is prepared by the Statutory Board and is subject to the Supervisory Board’s approval.
Key risk themes for Van Lanschot Kempen
Financial market volatilityThe 2018 financial year was marked by a continuation of strong growth in economies around the world. However, several indicators are pointing towards an end to this cycle. Financial markets are more volatile than before and, despite some monetary tightening in the United States, interest rates in the Eurozone remain relatively stable at low levels. The risk of severe shocks in financial markets in the shorter term is increasing, amplified by uncertainties such as Brexit and tense trade relations as well as high government debt levels in some countries. As a result of its focus on wealth management, Van Lanschot Kempen is increasingly exposed to financial markets: direct effects of financial market shocks could include pressure on fee income as a result of decreasing assets under management, and the challenge of excess liquidity as a result of increasing levels of savings and deposits.
Actions The Asset & Liability Committee (ALCO) monitors and discusses developments in financial markets on a monthly basis, with extra attention devoted to interest rate risk management, stress testing and analysis of changes in client behaviour. We are actively managing our funding profile in order to balance funding diversification and liquidity buffers. Considering current risk levels and uncertainties, we are keeping our equity duration low, mainly by using interest rate swaps. We maintain solid capital buffers and the risk appetite for our investment portfolio has traditionally been conservative.
CybercrimeAlthough Van Lanschot Kempen did not face any serious cybercrime issues in 2018, the news is dominated by incidents and this risk is considered to be permanently high. While the impact of DDOS attacks and payments fraud seems to be stabilising, the focus is shifting to areas such as hacking between nations, identity fraud and fake news. Digitalisation and technological developments such as cloud computing and blockchain make it increasingly complex to monitor and manage these risks. The deep embedding of social media into people’s lives adds another layer of vulnerability. Protective measures evidently need to keep pace with the increasing threats, and emphasis is put on security awareness and on preparing the organisation to act quickly in case of incidents.
Actions Van Lanschot Kempen’s cyber defence is at par with industry standards; in 2018, several steps were taken to further enhance the level of sophistication. Measures such as intrusion detection and reinforced security of servers and devices were combined with automated code reviews of internally developed software and attack simulation, such as red teaming and ethical hacking. Van Lanschot Kempen has strengthened its governance on IT security, and extra attention was devoted to security awareness and staff training. For example, phishing and password protection campaigns have increased awareness throughout the organisation.
Trust in the financial sectorTrust in the financial sector remains low despite efforts by the financial services industry supervisory authorities to put various regulations in place in the wake of the 2008 financial crisis. In 2018, several incidents – for example, regarding anti-money laundering – received prominent media attention and led to outrage in the public and political domain. Apart from financial measures such as substantially higher risk buffers and preparatory measures such as recovery and resolution planning, several additional measures were taken, in terms of corporate responsibility and employee integrity. Public confidence is critical for financial stability: it is the joint and individual responsibility of financial institutions to protect their own reputations and to contribute to the reputation of the financial services sector as a whole, as well as to make decisions that take into account the needs and expectations of society at large.
Actions One of the leading principles in Van Lanschot Kempen’s risk appetite statement is that “we take the requirements and expectations of all stakeholders into account”. Within the organisation, and especially within product management and via our investment strategies, corporate responsibility and ESG are becoming increasingly important priorities. We are embedding these further into the organisation. In 2018, much attention was paid to preventing money laundering. We implemented additonal analytics tools to detect integrity risks, in addition to our advanced monitoring system and team of experts. To understand the position of our stakeholders, we organise various engagements in different forms. We hold meetings and events (e.g. with clients, investors, regulators or NGOs) about various sustainability topics. Our annual report and our CSR Supplement (see “Stakeholder dialogue”) provide an extensive overview of our approach to stakeholder dialogue. Furthermore, we introduced a new set of KPIs in 2018 that include both financial and non-financial KPIs. In defining these, we have taken into account both the interests of our stakeholders and our ambitions as a wealth manager.
Labour marketVan Lanschot Kempen is becoming a more specialist organisation: simpler, more routine tasks are being outsourced or automated, while the remaining professional roles are becoming harder to fill. Strong economic growth means that the labour market for professionals is tightening and competition between financial institutions for top talent is fierce. If we are unable to find and retain the right employees, it could limit our capacity for growth. As a people business, we need both to develop a strong network to attract new talent, and to offer attractive benefits and development opportunities to retain existing talent.
Actions Van Lanschot Kempen offers professionals the unique combination of a highly reputable organisation with an informal, non-hierarchical work environment in which individuals enjoy challenging work and can make a big impact. This is recognised by our staff and actively used in our recruitment process. We are also currently modernising our HR processes. Finally, across the organisation, young talent programmes are a successful source of future specialists and leaders.
Progress report 47

Progress report 48
Targets and risk limits are more dynamic and may occasionally be reviewed, at least annually. That said, we do not change the key principles that underlie our risk appetite and that create the framework within which we operate: – We only take risks that we understand and can explain;– We only take risks that – directly or indirectly – serve our
strategic objectives;– The sum of all risks taken should not exceed our
risk-bearing capacity;– When taking risks, we take the requirements and
expectations of all stakeholders into account;– We do not take any risks that could materially harm our
reputation;– Our risk appetite should be considered in all business
decisions at every level of the organisation;– We avoid risks that could lead to legal or regulatory
breaches.
A risk dashboard and progress report is discussed by the Group Risk Committee every quarter, as well as periodically by the Risk Committee of the Supervisory Board. Risk-taking is in the nature of banks; low risks are not a means to an end. For a number of reasons, it may be appropriate to accept a higher risk – either temporarily or for a prolonged period. We always consider both gross and net – i.e. after mitigating measures – risk positions, paying extra attention to high risks.
The scores and risk appetite for each individual risk type at year-end 2018 are shown in this simplified version of the risk dashboard below. For more information on risk appetite and our management of the various risks, see the section on risk management in the financial statements.
We operate our risk framework in accordance with the “three lines of defence” model. The management teams at individual departments and units (the first line) are responsible for managing their specific risks. The Group Risk Management department (the second line) supports the management by facilitating risk assessments, providing expertise for the formulation of controls and mitigating actions, providing reports, and challenging the first line on the management of their risks. Group Audit (the third line) monitors whether the activities of the first and second line are effectively mitigating the risks identified. Lastly, we use insurance to cover certain remaining risks.
Strategic riskStrategic risk is defined as the risk to Van Lanschot Kempen’s results or continuity resulting from failure to respond adequately to changes in external factors or from poor
strategic decisions. External factors include the actions of competitors, clients, potential market entrants and public authorities, as well as public opinion. Keeping up with technological developments and fintech is also a key topic on our strategic agenda. We use a range of performance indicators – such as growth in assets under management, net result, efficiency ratio and FTE trends – together with a qualitative assessment to monitor and control strategic risk. The size and development of strategic risks are discussed quarterly by the Executive Board and reported in our risk appetite report. Due to the challenging environment and the strategic transformation that we continue to undergo, we currently classify our strategic risk as “medium”. To determine capital levels for Pillar 2 purposes, we use a risk model that is primarily based on the ratio between fixed and variable margins. In 2019, we will redevelop the model and include the impact of shocks in financial markets.
Credit risk Credit risk is still our most significant financial risk type, albeit declining. Our loan portfolio amounts to €8.6 billion and has manageable risks. We aim to keep the size of exposure to the Private Banking residential mortgage portfolio constant by generating enough new business to offset prepayments and redemptions. Over 66% of the loan portfolio consists of mortgage loans, primarily to Private Banking clients who also hold assets under management within Van Lanschot Kempen.
In 2017, the Dutch banking industry investigated the risk of interest-only mortgages that will mature in the next 10–15 years. Repayment or refinancing might become difficult for some clients – particularly older clients – with decreasing incomes. In 2018, we developed a plan to limit the risks for this group of clients.
Credit quality in general further improved in 2018, reflecting a robustly growing economy, a continuing rise in house prices in the Netherlands, and declining unemployment levels. These effects continue to feed through to our loan portfolio with a slight lag.
Loan losses in 2018 continued to reach historically low levels. We use sophisticated risk models (internal ratings-based approach) to measure and monitor credit risks for most of our loan portfolios. We see positive rating migration in nearly all portfolios as another indicator of improved credit quality. Our loan portfolio and credit risks are concentrated in the Netherlands (96%); lending in Belgium and Switzerland is limited, and mainly concerns Lombard loans with low risk profiles.
Risk score Risk appetite
Risk dashboard Low Medium High
Strategic risk
Credit risk
Market risk
Liquidity risk
Interest rate risk
Operational risk
Information risk
Private Banking – Mortgage loans Private Banking – Other loans Corporate Banking – SME loans Corporate Banking – Real estate loans Mortgage loans – Distributed by third
parties
Loan portfolio, excluding provision (100% = €8.7 billion)
3%
66%
21%
3%7%
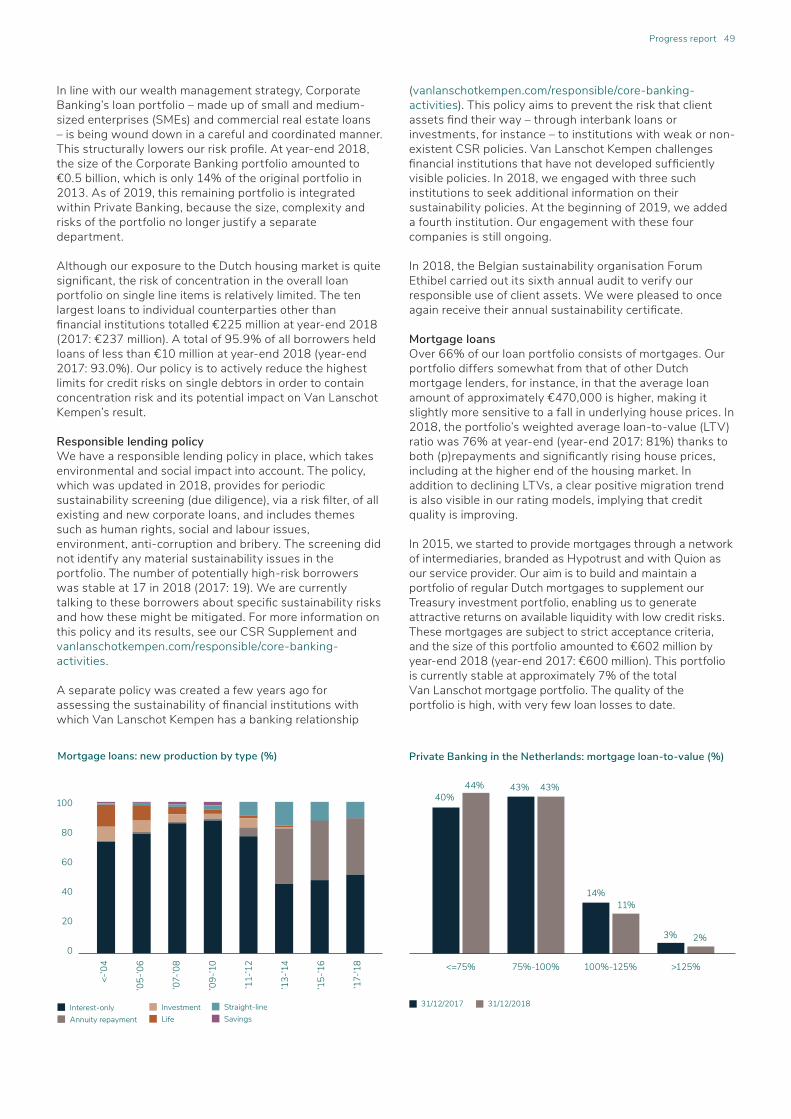
Progress report 49
In line with our wealth management strategy, Corporate Banking’s loan portfolio – made up of small and medium-sized enterprises (SMEs) and commercial real estate loans – is being wound down in a careful and coordinated manner. This structurally lowers our risk profile. At year-end 2018, the size of the Corporate Banking portfolio amounted to €0.5 billion, which is only 14% of the original portfolio in 2013. As of 2019, this remaining portfolio is integrated within Private Banking, because the size, complexity and risks of the portfolio no longer justify a separate department.
Although our exposure to the Dutch housing market is quite significant, the risk of concentration in the overall loan portfolio on single line items is relatively limited. The ten largest loans to individual counterparties other than financial institutions totalled €225 million at year-end 2018 (2017: €237 million). A total of 95.9% of all borrowers held loans of less than €10 million at year-end 2018 (year-end 2017: 93.0%). Our policy is to actively reduce the highest limits for credit risks on single debtors in order to contain concentration risk and its potential impact on Van Lanschot Kempen’s result.
Responsible lending policyWe have a responsible lending policy in place, which takes environmental and social impact into account. The policy, which was updated in 2018, provides for periodic sustainability screening (due diligence), via a risk filter, of all existing and new corporate loans, and includes themes such as human rights, social and labour issues, environment, anti-corruption and bribery. The screening did not identify any material sustainability issues in the portfolio. The number of potentially high-risk borrowers was stable at 17 in 2018 (2017: 19). We are currently talking to these borrowers about specific sustainability risks and how these might be mitigated. For more information on this policy and its results, see our CSR Supplement and vanlanschotkempen.com/responsible/core-banking-activities.
A separate policy was created a few years ago for assessing the sustainability of financial institutions with which Van Lanschot Kempen has a banking relationship
(vanlanschotkempen.com/responsible/core-banking-activities). This policy aims to prevent the risk that client assets find their way – through interbank loans or investments, for instance – to institutions with weak or non-existent CSR policies. Van Lanschot Kempen challenges financial institutions that have not developed sufficiently visible policies. In 2018, we engaged with three such institutions to seek additional information on their sustainability policies. At the beginning of 2019, we added a fourth institution. Our engagement with these four companies is still ongoing.
In 2018, the Belgian sustainability organisation Forum Ethibel carried out its sixth annual audit to verify our responsible use of client assets. We were pleased to once again receive their annual sustainability certificate.
Mortgage loansOver 66% of our loan portfolio consists of mortgages. Our portfolio differs somewhat from that of other Dutch mortgage lenders, for instance, in that the average loan amount of approximately €470,000 is higher, making it slightly more sensitive to a fall in underlying house prices. In 2018, the portfolio’s weighted average loan-to-value (LTV) ratio was 76% at year-end (year-end 2017: 81%) thanks to both (p)repayments and significantly rising house prices, including at the higher end of the housing market. In addition to declining LTVs, a clear positive migration trend is also visible in our rating models, implying that credit quality is improving.
In 2015, we started to provide mortgages through a network of intermediaries, branded as Hypotrust and with Quion as our service provider. Our aim is to build and maintain a portfolio of regular Dutch mortgages to supplement our Treasury investment portfolio, enabling us to generate attractive returns on available liquidity with low credit risks. These mortgages are subject to strict acceptance criteria, and the size of this portfolio amounted to €602 million by year-end 2018 (year-end 2017: €600 million). This portfolio is currently stable at approximately 7% of the total Van Lanschot mortgage portfolio. The quality of the portfolio is high, with very few loan losses to date.
40%
<=75% 75%-100% 100%-125% >125%
44% 43% 43%
14%11%
3% 2%
31/12/2017 31/12/2018
Private Banking in the Netherlands: mortgage loan-to-value (%)
<-’0
4
’05-
’06
’07-
’08
’09-
’10
’11-
’12
’13-
’14
’15-
’16
’17-
'18
Interest-only Annuity repayment
100
80
60
40
20
0
Mortgage loans: new production by type (%)
Investment Life
Straight-line Savings

Progress report 50
Other Private Banking loansThis part of the loan portfolio comprises loans to high net-worth individuals, in the form of overdraft facilities or funding for a second home, for example. In the same category are commercial activities that fit into Private Banking’s relationship model, such as funding investments for family businesses, business professionals and executives, and healthcare professionals. Our aim is to keep the size of this portfolio stable. The average loan size is approximately €86,000.
SME credit and real estate loansIn line with our strategy, in 2018 we continued to wind down our Corporate Banking loan portfolio, made up of SME credit and real estate loans. Some real estate exposures to individual clients within Private Banking will remain. The remaining SME loan portfolio is well diversified, with no dominant sector. The average loan size amounted to €1,16 million at year-end 2018 (year-end 2017: €1.01 million).
Gross mortgage business (left-hand axis) Price index (right-hand axis, 2010 = 100)
Mortgage loans: remaining gross business per year (€ million) compared with house price trends
600
500
400
300
200
100
0
120
100
80
60
40
20
0
'00 '01 '02 '03 '04 '05 '06 '07 '08 '09 '10 '11 '12 '13 '14 '15 '16 '17 '18
Volumes outstanding (left-hand axis) Number of loans (right-hand axis)
Mortgage loans: outstanding volumes (€ million) and number of loans by size
9,000
8,000
7,000
6,000
5,000
4,000
3,000
2,000
1,000
0
1,935
€0 - €0.5m €0.5 - €1m €1 - €1.5m €1.5 - €2m €2 - €4m > €4m
1,960
813
365339
120
2,500
2,000
1,500
1,000
500
0
Private Banking other loans: type of loan(100% = €1.8 billion)
SME loans Current accounts Real estate loans Private loans Lombard loans
25%
14%
9%
35%
17%
Corporate Banking: SME loans by sector(100% = €251 million)
Banks and financial intermediaries Real estate Capital goods Services Leisure and tourism Other
51%
16%
8%
4%3%
18%
566 134 208 242 341 435 473 359 260 214 100 129 75 64 145 378 393 468 503

We sold a portfolio of non-performing commercial real estate loans to a company affiliated to Cerberus Capital Management LP in 2015. The sale concerned loans with a total nominal amount of €400 million and around 120 client relationships. A small number of individual debtors initiated legal proceedings in relation to this sale, claiming that the transfer of the debtors’ loans and the rights related to these loans were invalid. In the case of one individual debtor, the court ruled that the transfer of the contractual relationship with the debtor to the buyer of the loan was invalid – a decision that we have appealed against. The transfer of the claims under the loan to the buyer of the loan (and the rights related to the loan), however, was upheld. The potential financial impact of the ruling is likely to remain limited.
Our portfolio of real estate loans is well diversified. Project development loans account for less than 1% of this portfolio. The average loan size of our real estate loans amounted to €1.7 million at year-end 2018 (year-end 2017: €1.5 million). Average LTV ratios improved to 66% (year-end 2017: 70%).
Our real estate loans are provided primarily on the basis of a total quality assessment of their borrowers. We also take into account the quality of the real estate object and the stability of the rental flows. The debt service coverage ratio (DSCR) is calculated so that we can determine the extent to which a client will be able to make interest and principal payments from the rental income generated by their commercial real estate. At year-end 2018, 78.2% of our real estate loans generated sufficient rental income to cover interest and principal payments, i.e. had a DSCR of over 1 (year-end 2017: 78.5%). Clients with a DSCR of less than 1 often have other income they can use to service their loan obligations. Lastly, the LTV of the loans also improved due to strong economic growth in the Netherlands, causing prices of most real estate to rise.
Impaired loansImpaired loans are loans for which a provision has been taken. Impaired loans accounted for 3.8% of the loan portfolio at the end of 2018 (year-end 2017: 4.0%). A provision equal to 30% of these loans was taken (2017: 31%), resulting in specific provisions amounting to €101 million. In 2018, we reached a further net release of €12.7 million in provisions (2017: €11.9 million). Current provisions as well as expected losses have continued to fall significantly. The teams for preventive and intensive management continue to contribute to the reduced inflow into the Restructuring & Recovery department.
In 2018, we implemented the new IFRS 9 standard by developing sophisticated expected credit loss models. IFRS 9 entails a revised approach to calculating loan losses (from incurred losses to expected losses). The first-time adoption impact on loan loss provisions was €13.0 million. The impact was low since the incurred but not reported (IBNR) provision was simultaneously released. During 2018, the migration between the credit quality stages was limited, which is partly the result of the current phase of the economic cycle. See the financial statements for more details on this change and its impact.
For more information about credit risk, please refer to the discussion of risk management in the financial statements, Section 2, “Credit risk”.
Market riskVan Lanschot Kempen is exposed to a limited degree of market risk through its client-servicing activities, as a result of client-facilitating transactions. Kempen Merchant Banking performs equity and structured product transactions for clients and provides market liquidity, which may result in temporary trading positions. The same applies at Van Lanschot Private Banking and Corporate Banking regarding transactions in interest-related and foreign currency products: temporary positions may arise from our efforts to facilitate our clients’ requests. We invest in our own funds to support Kempen Asset Management, in order to align our interests with those of our clients. The Risk Management department monitors market risks on a daily basis.
For further information on market risk, see Section 3, “Market risk”, in the financial statements.
Liquidity risk and fundingAs a result of active loan book reduction, our balance sheet has decreased structurally. As a wealth manager, we have a large client savings and deposits base, which can fund our entire loan portfolio. This is reflected in our 106.2% funding ratio. As such, our liquidity risk profile mostly consists of possible unanticipated outflows in the deposit base, especially the deposit share that is not covered by the deposit guarantee scheme. We take a cautious approach to liquidity risk and aim to hold solid liquidity buffers that would allow us to absorb severe unexpected liquidity stress situations. Outcomes of liquidity stress tests are discussed by ALCO on a monthly basis. The results of the stress tests showed that Van Lanschot Kempen is capable of absorbing acute and persistent liquidity stress. The total liquidity buffer at year-end 2018 amounted to €3.6 billion (2017: €4.2 billion) with the liquidity coverage ratio standing at 140.6% (2017: 163.6%).
Although our loan portfolio can be entirely funded by client deposits, we aim to keep sufficient diversification in our funding mix by supplementing the savings and deposits base with issuances of secured debt under the Conditional Pass-through Covered Bond programme. As of December 2018, total outstanding debt under the covered bond programme was €1.5 billion. In 2018, we redeemed a benchmark senior unsecured loan in June and an RMBS in December. Due to our structurally high liquidity buffer, we did not replace these redemptions with new wholesale debt issuances. Net issued debt securities came down by €0.9 billion during the reporting year. We no longer have RMBS and benchmark unsecured debt issuances placed with investors.
Progress report 51
Corporate Banking: real estate loans by collateral(100% = €271 million)
Retail Commercial Office Residential
11%
35% 34%
20%
31%
13%13%
42%
31/12/2017 31/12/2018

Progress report 52
Reducing the impact of excess liquidity on net interest income, while maintaining a solid liquidity cushion and sufficient funding diversification, remains the main funding and liquidity planning objective. The procedures, processes and reporting associated with liquidity risk management are combined in our internal liquidity adequacy assessment process (ILAAP), which is assessed by our regulator every year. Our 2018 ILAAP was rated satisfactory on both qualitative and quantitative criteria.
Investment portfolioOur investment portfolio totalled €3.9 billion at year-end 2018, down from €4.4 billion at year-end 2017. It is maintained primarily for liquidity purposes and consists mainly of liquid, low-risk instruments. The composition of the portfolio was relatively stable in 2018, with only a limited number of transactions. There are strict limits on instrument types, counterparties, countries, ratings and credit spread risk.
We review our investment portfolio annually to ensure it meets our environmental, social and governance criteria. Investee financial services companies are subject to our CSR policy for financial institutions as outlined above (see “Responsible lending policy” on page 49). Corporates in the portfolio are assessed for compliance with our responsible investment policy (see page 19). We have not encountered any material sustainability issues in our investment portfolio to date.
For further information on our liquidity risk profile, see Section 9, “Liquidity risk”, in the financial statements.
Interest rate riskIn 2018, interest rates remained low and yield curves remained flat. This translated into a further reduction in rates for clients wishing to take out mortgages and loans. However, deposit rates could not be reduced any further, due to the “natural floor” in client rates of 0% that had already been reached by the end of 2017. These factors, combined with lower yields on new purchases in our relatively large investment portfolio, inevitably had a negative effect on net interest income.
Client preference for long interest rate maturities for mortgages continued, both for newly agreed mortgages and for interest rate resets. At year-end 2018, approximately 31% of the mortgage portfolio consisted of loans with remaining fixed-rate terms of eight years or more. On the liability side of the balance sheet, clients held their balances in savings accounts, in the expectation of rising interest rates. Appetite for term deposits remained negligible. From an interest rate risk perspective, the combination of mortgages with long interest rate maturities, funded to a large extent by a variable-rate deposit base, continues to pose challenges: there is less room to adjust loan rates if future funding costs rise. We use balance sheet management instruments such as interest rate swaps to manage these risks. For net interest income at risk, we have set a limit of 15% net interest income loss in the first 12 months, relative to our baseline scenario. All stress scenarios remain within this limit. We address long-term interest rate risk mainly via the economic value approach,
Funding mix (100% = €14.0 billion)
Savings and deposits Debt securities Interbank funding Equity Other funding
2%
19%
9%5%
65%
Cash at central banks Covered bonds Government and government
guaranteed RMBS Banks Funds and corporates
Investment portfolio and liquidity by counterparty(100% = €3.9 billion)
8% 3%
13%
18%
24%
33%
Cash at central banks AAA AA A BBB Other
Investment portfolio and liquidity by rating(100% = €3.9 billion)
5%4%
3%
15%
40%
33%
Funding redemption profile (€ million)
1,000
800
600
400
200
0 2019 2020 2021 2022 2023 ≥2024
Senior unsecured Covered bond Subordinated

Progress report 53
which examines how movements in interest rates impact the value of our assets and liabilities. Duration analysis is one of the main metrics used in the economic value calculation: the duration of equity reflects how much the economic value of our equity capital would change as a result of movements in market interest rates. During 2018, ALCO kept duration around a two-year range, balancing risk and return given the low and flat yield curve.
For more information on interest rate risk, see Section 8, “Interest rate risk”, in the risk management section of the financial statements.
Non-financial riskNon-financial risk comprises operational risks, information risks and business continuity risks. Operational risks are potential losses that result from inadequate or failed internal processes or systems, inadequate or incorrect human actions, external events and fraud. To identify and manage non-financial risks, we have created a group-wide operational risk framework. Within this, the control framework allows us to regularly test the effectiveness of key controls in our processes and systems. Other instruments that we use for measuring and monitoring non-financial risks include incident registration, root cause analyses, risk self-assessments, and key risk indicators.
We have defined a non-financial risk appetite. On a quarterly basis, the current non-financial risk exposure related to the non-financial risk appetite is discussed with senior management in the Compliance and Operational Risk Committee. In 2018, we further strengthened our non-financial risk management competencies. The second line of defence continues to interact more closely with the businesses, aiming to encourage an increasingly risk-based approach in managing non-financial risks. Influencing human behaviour and the risk culture is a structural way of further mitigating operational risk. In 2018, a campaign was launched to encourage people to actively report operational incidents, with the goal of learning from these and improving our operational effectiveness.
One of our key focuses is preventing cybercrime. We have invested significantly in this area and are currently at par with industry standards, but we aim to go one step further by investing more in technological and preventive measures such as awareness programmes and staff training. We also continue to develop intelligent solutions and work closely with industry partners.
For the continuation of operational processes during potential disruptions, threats and incidents, we have developed business continuity measurements. These include a policy, a governance structure with a Business Continuity Committee and Crisis Management Team, and working instructions. Moreover, several tests are performed during the year to assess whether these measures work in practice.
For more information about operational risk, please refer to the discussion of risk management in the financial statements, Section 4, “Operational risk”.
Compliance riskOur Compliance department aims to ensure that our employees adhere to legislation, internal regulations and our own Code of Conduct at all times. Non-compliance with legislation may result in significant reputational damage
and/or financial losses. The Compliance department plays a key role in safeguarding our operational integrity. Both domestic and international laws continue to increase in volume and complexity. We therefore continue to assess whether our processes and procedures remain compliant with changing laws and regulations.
In 2018, our Compliance department paid special attention to our duty of care towards our clients, the review of our anti-money laundering (AML) policy, and data protection. The department’s activities focused on our approach to all aspects of AML, bribery, corruption and fraud prevention. The implementation of rules and regulations in our procedures and processes was also a focus point, together with testing and evaluating the implementation of MiFID II. In 2018, various departments were involved in the implementation of the GDPR privacy legislation. The protection of our clients’ privacy is a key element in our financial services offering.
During the course of business in 2018, we complied with legislation on our duty of care towards our clients, fraud, marketing communications and privacy. For more information about our extensive CDD processes, see page 54.
Together with five other Dutch banks, in 2016 Van Lanschot Kempen agreed to abide by the derivatives recovery framework to enable the efficient handling of the derivatives issue for SME clients in the Netherlands. Up until 2013, we sold interest rate derivatives to our SME clients as part of our corporate lending as an alternative to fixed-rate loans. In terms of both clients and interest rate swaps, the numbers were relatively small and arrangements were typically customised, with only plain vanilla interest rate swaps and a limited number of caps sold. In 2018, Van Lanschot Kempen completed the review of its portfolio and offered compensation to all affected (former) clients. Most (former) clients accepted such compensation.
In 2018, the Kempen Dutch Inflation Fund I was the subject of negative publicity regarding its ground lease fund, Grondvermogen. We became aware that the public prosecutor started an investigation into possible criminal offences committed by a specific counterparty in connection with some transactions in ground leases in Grondvermogen. Kempen is not considered to be a suspect. In 2017, we conducted an enquiry into financial transactions within the ground lease fund, as a result of which a number of internal organisational and procedural measures were taken to improve our processes. Supervisory authorities received full disclosure of the findings as well as the measures taken.
Regulatory impactWhile there is still a risk that we may not have enough skilled experts in our team to implement new regulations in a timely manner, pressure from a regulatory perspective has decreased compared to previous years. Many of the regulations that could have a major impact on our business have now been successfully implemented – or impact assessments have been carried out that reveal limited impact in any case.

Progress report 54
IFRS 9 – Effective as of 1 January 2018, International Financial Reporting Standards (IFRS) 9 was a major change in accounting standards, and we met the deadline for reporting on these new financial reporting standards. In January 2018, a one-off addition of €14.4 million was booked as a total result of the adoption of the new standards. We expect more volatility in provisions in the event of a downturn in the economy, because the new reporting standards methodology is more forward-looking and the state of the economy has more influence on the calculations of provisions compared to the previous methodology (IAS 39).
Basel IV – In 2018 we conducted an impact analysis regarding Basel IV, which confirmed that its impact on our business would be relatively limited. The analysis includes changes to the approaches for credit risk and operational risk. Together with the Fundamental Review of the Trading Book (FRTB), these reforms will take effect as of 2022 with transitional arrangements. While implementing the new regulation will take a lot of work, it will not require any significant change to our strategy: the impact on our risk-weighted assets is estimated to be no more than 10%.
MiFID II – Although the Markets in Financial Instruments Directive II (MiFID II) regulation came into effect on 1 January 2018, we had spent much of 2017 preparing for it and implementing the processes to cope with it. This meant that the process went smoothly and the impact on the business was less than expected. Currently, advanced implementation is still ongoing to ensure effectiveness; for more information, see the “Merchant Banking” section.
GDPR – We take our clients’ privacy very seriously – it is essential to our business. Our clients have every right to know what we do with their data and how we use it, which is why we embrace privacy laws such as the General Data Protection Regulation (GDPR) that came into effect on 25 May 2018. As for many businesses in Europe, GDPR was a major project for Van Lanschot Kempen during the reporting year. We only use our clients’ data for the services we provide to them – we do not sell data to third parties. After a client chooses to close their account with us, their data is automatically destroyed after a period of ten years.
Client due diligence – To prevent money laundering, corruption, bribery and fraud, we check our clients and their financial transactions carefully. As part of the implementation of the fourth European Anti-Money Laundering (AML) Directive that came into effect in 2018, financial services companies such as ours are required to carry out more extensive client due diligence (CDD) procedures, in addition to the strict CDD procedures we already apply. In 2018, there was also much public attention on the role of banks in detecting any form of money laundering through the financial system, adding pressure on financial institutions to play their role as gatekeepers even more effectively. We have an automated monitoring system in place, which was upgraded in 2018, and we employ a team of experts to evaluate any signs that our clients may be involved in illegal activities. In such cases, the CDD Acceptance and Exit Committee will take appropriate measures. The use of smart technology and reliable systems is critical, as well as training staff members in recognising and acting on possible red flags.
Anacredit, RRE and DGS – We have implemented several new regulatory reporting requirements. Anacredit and Residential Real Estate (RRE) reporting involve periodical loan-by-loan reporting on our portfolios of commercial loans and mortgages. The requirements for the Deposit Guarantee Scheme (DGS) have changed. As of 2019, the Dutch Central Bank should – in cases of bankruptcy – be able to pay out money to creditors within seven days.
BrexitOver the past few months, Van Lanschot Kempen has been preparing for Brexit, including the possibility of a hard Brexit as of 29 March 2019. Several working groups have identified risks, defined an approach, and coordinated the relevant preparatory actions taken. A group-wide steering committee has taken the lead in coordinating this process. The preparations concern various topics, such as continued authorisation for our UK business, uninterrupted performance/servicing in relation to derivative contracts, and determining Brexit’s impact on the offering of funds and instruments to our clients. We believe that we have taken (and continue to take) the necessary steps to mitigate risks for our organisation and for our clients, even in a no-deal scenario.
Capital managementIn 2018, we made further progress on our capital strategy, which is aimed at operating on a more capital-light basis, predominantly by means of reducing our corporate loan exposure. Our Common Equity Tier 1 ratio (CET 1, fully loaded and including retained earnings) increased from 20.3% at year-end 2017 to 21.4% at year-end 2018, well above our target range of 15-17%. The total capital ratio rose from 23.4% to 24.9%. Active reduction of RWA (in the corporate loan book) continues to be the main contributor to the strong growth in solvency ratios, but underlying credit quality has also been improving.
The ongoing improvement in solvency continues to result in significant amounts of excess equity capital. In December 2018, we followed up on the first special capital return to the shareholders of Van Lanschot Kempen NV in 2017 (€41 million), by means of a second special capital distribution of over €60 million (€1.50 per share). The special capital return was approved by shareholders of Van Lanschot Kempen NV in October 2018. We will continue to consider paying out excess capital to shareholders of Van Lanschot Kempen NV in the form of dividends and capital returns, subject to regulatory approval. Since 2016, €210 million has been returned to the shareholders of Van Lanschot Kempen NV. In addition, we aim to engage in acquisitions, and intend to leave room for these in our capital position as well.
Following the annual supervisory review evaluation process (SREP), DNB informed us about the capital requirements that we had to meet from June 2018 onwards. The minimum capital requirements comprise a CET 1 ratio of 9.5%, a Tier 1 ratio of 11.0%, and a total capital ratio of 13.0%. The SREP requirements cover both Pillar 1 and Pillar 2 risks.

Progress report 55
In addition to the 9.5% CET 1 requirement, we need to comply with the combined buffer requirements, which must be met by CET 1 capital. The capital conservation buffer stood at 1.875% in 2018 and will reach its fully phased-in level of 2.5% in 2019. The countercyclical buffer for the Netherlands is currently set at 0%. As the systemic risk buffer does not apply to us, for 2018 the total CET 1 requirement adds up to 11.38% and the total capital ratio to 14.88%. This requirement excludes “Pillar 2 guidance” (P2G). Institutions are expected to comply with P2G by holding CET 1 capital, but P2G does not have binding status and does not automatically restrict dividend distributions in the event of a breach.
With a CET 1 ratio of 21.4% and a total capital ratio of 24.9% at year-end 2018, we meet all capital requirements, including P2G. The Basel III leverage ratio increased to 6.9% at year-end 2018 (year-end 2017: 6.7%), which is high compared with other Dutch banks and well above the minimum Basel requirement of 3%.
As bail-in (loss absorption) currently stands, we also comply with the minimum required eligible liabilities (MREL) requirements. So far, the National Resolution Authority has not imposed additional MREL requirements for Van Lanschot Kempen that are related to the resolution strategy. No total loss absorption capacity (TLAC) requirements apply, as we are not a global systemically important institution.
Pillar 1 Pillar 2 Capital Conservation Buffer Pillar 2 Guidance (not disclosed)
SREP requirement for 2018
CET 1requirement
2018
SREP CET 12018
CET 131/12/2018
Tier 1requirement
2018
SREP Tier 12018
Tier 131/12/2018
Overall capitalrequirement(OCR) 2018
SREP total capital 2018
Total capital ratio
31/12/2018
21.4%4.50%
5.00%
1.88%
4.50%
5.00%
6.00%
5.00%
21.4%6.00%
5.00%
1.88%
24.9%8.00%
5.00%
8.00%
5.00%
1.88%

Progress report 56
REMUNERATION
We pursue a remuneration policy that is in line with our strategy and contributes to long-term value creation. This section sets out our remuneration governance and the policies that apply to our employees, identified staff, the Statutory Board and the Supervisory Board.
Remuneration policy governanceThe Statutory Board sets the remuneration policy for employees, based on the advice of the Human Resource Management (HRM), Finance, Reporting & Control, Group Risk Management and Compliance departments. These, together with Group Audit, also have an important part to play in setting up, adjusting, implementing and reviewing our variable remuneration policy. They advise the Statutory and Supervisory Boards and report to them on their conclusions.
The Statutory Board is responsible for implementing our remuneration policy. The Supervisory Board approves our variable remuneration policy, including its general principles, and oversees its implementation. Approval by the Supervisory Board is also required for our variable remuneration pools, any significant individual variable remuneration, and for individual variable remuneration proposed for employees designated as identified staff. The Supervisory Board’s Remuneration Committee prepares the Supervisory Board’s decision-making on remuneration and advises it in this area.
Fixed remunerationEmployees’ fixed remuneration reflects their relevant working experience and organisational responsibilities.
Variable remuneration policy for Van Lanschot Kempen employeesVan Lanschot Kempen has variable remuneration policies in place governing all employees of Van Lanschot NV and Kempen. Every employee can be considered for a variable remuneration award, provided that certain conditions are met (as mentioned under the "Award" section). Our policies comply with all relevant legislation and regulations.
Based on operating results, the Statutory and Executive Boards determine whether variable remuneration will be awarded and what amount is available, taking into account achievement of financial and non-financial performance criteria. The boards submit the proposed amount for thevariable remuneration pool for the approval of the Supervisory Board, and any deviations also require Supervisory Board approval.
Once the amount available for variable remuneration at Van Lanschot NV and Kempen has been determined, the Statutory Board decides how this variable remuneration will be distributed at Van Lanschot NV, while Kempen’s Management Board decides on its distribution at Kempen.
The average variable remuneration of all Van Lanschot Kempen employees who work (largely) in the Netherlands may not exceed 20% of their fixed remuneration, as prescribed by the Dutch Financial Supervision Act (Wft). Variable remuneration of up to 100% of fixed remuneration may be granted on special grounds in individual situations. This only applies to a relatively low number of employees.
AwardVariable remuneration to individual employees is awarded on the basis of individual performance, market competitiveness and special factors. An employee’s personal performance is assessed on quantitative (i.e. financial) and qualitative (non-financial) performance criteria, with some departments applying only qualitative criteria. At least 50% of the allocation of any variable remuneration is based on non-financial criteria, such as showing the desired professional behaviour, improving client satisfaction, developing new products or solutions for clients, and improving internal processes, policies or systems.
Individual performance is measured based on the degree to which employees have achieved targets set at the beginning of the year. Performance criteria include nothing that might encourage irresponsible risk-taking.
Variable remuneration is only awarded if 1) Van Lanschot Kempen’s financial position allows; 2) it is justified by the performance of Van Lanschot Kempen, the relevant business unit and the individual employee; 3) Van Lanschot Kempen meets the prevailing buffer requirements under the EU´s Capital Requirements Regulation (CRR), the Dutch Financial Supervision Act (Wft) and its implementing legislation; 4) the risks taken have been reassessed and no material risks have occurred that were not expected or factored in; and 5) the employee has received a good performance assessment, has met compliance targets, has not been subject to disciplinary measures, and has not taken any risks that fall outside Van Lanschot Kempen’s accepted risk appetite.
PaymentVariable remuneration can be paid to employees entirely in cash up to a gross maximum of €50,000. If it exceeds this amount, 50% of the portion above the gross figure of €50,000 is paid immediately and unconditionally, and the remaining 50% conditionally and on a deferred basis over a period of three years following the year in which it was awarded. The deferred portion can only become unconditional if Van Lanschot Kempen still meets the prevailing buffer requirements.
The Statutory Board may, with the approval of the Supervisory Board, hold or claw back all or part of the:– Conditional variable remuneration previously awarded to
an employee (or former employee) if payment of the variable remuneration would be considered unfair or unreasonable (hold back);
– Unconditional variable remuneration previously paid to an employee (or former employee). This might occur if, for instance, payment was based on incorrect information about performance or about the conditions on which the variable remuneration depended (claw back).

Progress report 57
If payment has taken place on the basis of such incorrect information, or has been made in conflict with the variable remuneration policy and/or applicable legislation and regulations, the Statutory Board will exercise its authority in this respect.
Long-term share planOur 2011 long-term share plan (LTP) allows us to award variable remuneration to certain key employees, including identified staff. The plan is not open to members of the Statutory or Executive Boards. Offering variable remuneration in the form of depositary receipts for Class A Van Lanschot Kempen NV shares (“Van Lanschot Kempen shares”), the LTP is governed by our variable remuneration policy. Under the LTP, 60% of the Van Lanschot Kempen shares are awarded immediately and unconditionally, while 40% are awarded conditionally over a period of three years starting in the year after the year of conditional award (the vesting period).
Profit-sharing schemeIn 2017, we introduced a profit-sharing scheme for all Van Lanschot Kempen employees working in the Netherlands to further increase their alignment with Van Lanschot Kempen NV as shareholders. For the 2018 financial year, an equal number of Van Lanschot Kempen shares were granted to all employees in scope in February 2019. The number of shares is linked to Van Lanschot Kempen NV's profit and is conditional on this exceeding a certain threshold. A lock-up period of two years applies.
Remuneration in 2018Variable remuneration totalling €16.2 million was paid to employees (including identified staff) over 2018. One person received total annual remuneration of over €1 million in 2018.
Remuneration policy for identified staffIdentified staff are employees whose activities have a material impact on the risk profile of the business. Strict additional rules apply to the variable remuneration of this group of employees. The identified staff remuneration policy applies to all identified staff of Van Lanschot Kempen. Members of the Statutory and Executive Boards are not eligible for variable remuneration.
The criteria of the variable remuneration policy for identified staff are the same as for Van Lanschot Kempen’s variable remuneration policy. The variable remuneration of identified staff is paid 50% in cash and 50% in Van Lanschot Kempen shares, while the variable remuneration of identified staff ofKempen Capital Management NV (KCM) is paid 50% in cash and 50% in a flexible mix of Van Lanschot Kempen shares and investments in funds managed by KCM. In all cases, 60% of both parts of the variable remuneration is awarded immediately and unconditionally, and 40% conditionally and deferred. This deferred remuneration is then paid out over a period of three years following the year of award. Whether an award becomes unconditional depends on reassessment of the five predetermined criteria mentioned on the previous page. If this reassessment leads to a review of the deferred remuneration, the hold and/or claw-back system applies. A lock-up period of one year applies to Van Lanschot Kempen shares that have become unconditional.
More information about our remuneration policy for identified staff can be found at vanlanschotkempen.com/remunerationpolicies.
Statutory Board remuneration policyThe remuneration policy for members of Van Lanschot Kempen’s Statutory Board is adopted by the general meeting following a proposal by the Supervisory Board. The policy is aimed at ensuring a balanced, sustainable and competitive remuneration package. The current remuneration for the members of the Statutory Board was approved and adopted by the general meeting on 31 May 2018, and applied from 1 January 2018.
When adopting the Statutory Board remuneration package, we consider pay ratios within the company. A comparison of the remuneration package of the CEO and the average labour cost1 of an employee within Van Lanschot Kempen results in a pay ratio of 10:1 (2017: pay ratio 9:1).
We ended all variable remuneration for the Statutory Board in 2015. As partial compensation, a fixed remuneration component was introduced in the form of Van Lanschot Kempen shares. In 2018, the lock-up period applicable to these shares was increased from three to five years.
In addition to the lock-up period applicable to these shares, Statutory Board members are also bound by the share ownership guidelines. These guidelines stipulate that Van Lanschot Kempen shares held by Statutory Board members must be equivalent to the cash portion of two years’ gross salary for as long as they remain in office. Statutory Board members will gradually meet this requirement over the years through the award of fixed remuneration in the form of Van Lanschot Kempen shares. The share ownership guidelines contribute to Van Lanschot Kempen’s long-term value creation.
In 2015, it was agreed that the remuneration policy of the Statutory Board would be revisited in 2017 and evaluated in light of developments and circumstances at the time.
In December 2017, Willis Towers Watson conducted a market assessment for the remuneration of the Statutory Board. The peer group for the market assessment was selected in keeping with the Dutch Banking Code, and consisted of: – Dutch banks; – Western European specialised standalone wealth
management companies;– Dutch corporates (cross-industry benchmark).In this market assessment, the compensation from 1 January 2018 positions us in the 29th percentile of the reference group, well below the median.
For information on the composition of the reference group used for the market comparison of Statutory Board remuneration, please refer to vanlanschotkempen.com/remunerationpolicies. This information is an integral part of the Remuneration section.
1 The average labour cost is calculated by dividing total staff costs by the number of FTEs working for Van Lanschot Kempen.

Progress report 58
Statutory Board remuneration packageThe following table shows the remuneration package for members of the Statutory Board, who are not entitled to variable compensation. There are no early retirement schemes for Board members. Their severance remuneration is in line with current statutory and regulatory rules and amounts to one year’s gross salary.
The remuneration of the Statutory Board consists of two components: fixed income and benefits.
Fixed income
Statutory Board remuneration package Type of payment Purpose/rationale
Fixed income Cash Reflects responsibilities, performance and market trends
Fixed income Van Lanschot Kempen shares Achievement of long-term strategy
Benefits Payment towards pension and disability insurance, fixed expenses reimbursement
Market competitiveness
Remuneration of the Statutory Board Chairman Members
Fixed in cash €772,500 €437,750
Fixed in Van Lanschot Kempen shares €387,500 €312,250
BenefitsThe members of the Statutory Board are responsible for their own pension provision, towards which they receive a payment. They also receive a payment for taking out disability insurance. For more information, see “Remuneration of the Statutory and Supervisory Boards” on page 202 of the 2018 financial statements.
Supervisory Board remuneration policyThe remuneration policy for members of the Supervisory Board was adopted by the general meeting on 31 May 2018 and applied from 1 January 2018. Supervisory Board remuneration is summarised in the table below.
Remuneration Supervisory Board
Chairman Deputy Chairman
Member
Supervisory Board €90,000 €70,000 €60,000
Audit and Compliance Committee €15,000 €10,000
Risk Committee €15,000 €10,000
Remuneration Committee €10,000 €7,000
Selection and Appointment Committee €10,000
€6,000

Report of the Supervisory Board 59
REPORT OF THE SUPERVISORY BOARD
This report gives an overview of the activities of the Supervisory Board and its committees in 2018. A description of the composition and operation of the Supervisory Board is set out in the notes on corporate governance (see page 66).
Supervision
Achievement of corporate targetsThe Supervisory Board can reflect on a commercially successful year for Van Lanschot Kempen, as is proven by the net inflow of assets under management and the increase in commission income. In addition, the capital position has been strengthened further, which allowed for a second special capital return. However, the rise in cost levels in the first half of the year combined with the continuing low interest rates, resulted in a higher efficiency ratio than targeted. We are confident that appropriate measures are being taken to mitigate this effect.
Having simplified and focused the business model, Van Lanschot Kempen has now defined the next phase in its strategy. This phase takes into account the competitive landscape, broader economic conditions, and behavioural changes driven by digital technology and the potential of advanced analytics.
We are pleased to see organic inflow, both of assets under management at Private Banking and from new fiduciary mandates at Asset Management. Merchant Banking had a strong year due to multiple successful transactions. Evi is growing its client base, although assets under management remained relatively stable.
During 2018, we’ve also seen an increased focus on digitalisation and advanced analytics. Throughout the organisation, projects were initiated to increase efficiency and improve the client experience. We are enthusiastic about these initiatives, and confident that they will lead to a more cost-efficient organisation. We support the appointment of a Chief Digital Officer and a Chief Analytics Officer, who will accelerate change through the whole organisation. Van Lanschot Kempen further aligned its business units by integrating teams with similar tasks and setting up a new cross-functional team for a specific client group. Moving from a product-based offering to a more solutions-led approach will enable clients to profit even more from the broad range of services Van Lanschot Kempen can provide, and is expected to result in further growth in assets under management.
A new set of financial and non-financial KPIs was introduced during 2018. We expect these KPIs to effectively measure both the financial and non-financial value created for stakeholders. For the main elements of Van Lanschot Kempen’s strategy, please see pages 9-14.
Structure and functioning of internal risk managementVan Lanschot Kempen’s principal risks, as well as the structure and functioning of its risk management and control systems, are discussed by the Risk Committee. In 2018, the committee’s chairman regularly reported its conclusions and recommendations to the Supervisory Board. Van Lanschot Kempen’s risk appetite statement is subject to the Supervisory Board’s annual approval. The statement for 2019 was approved at the Board’s December meeting. The 2019-21 capital and funding plan was also discussed and approved.
Financial reportingFinancial reporting is discussed regularly at the Audit and Compliance Committee’s meetings, which are also attended by the external auditors. In 2018, the committee gave special attention to the impact and implementation of Basel IV and IFRS 16, the implementation of IFRS 9 in the opening balance, and the 2018 interim financial statements. After each meeting, the chairman of the committee reports on committee discussions to the Supervisory Board. All members of the Supervisory Board were invited to attend the Audit and Compliance Committee’s meetings in 2018 at which the annual and half-year figures were discussed. The Supervisory Board approved the financial statements for 2017 on 21 February 2018.
The Supervisory Board decided to propose to the general meeting of Van Lanschot NV held on 31 May 2018 that it reappoints PricewaterhouseCoopers Accountants NV (PwC) as external auditors for the 2018 and 2019 financial years. The general meeting has reappointed PwC as external auditors for the 2018 and 2019 financial years. In December 2018, the Supervisory Board decided to propose the reappointment of PwC for the 2020 financial year to the general meeting to be held in May 2019.
Legal and regulatory complianceThe quarterly reports of the Compliance department were discussed by the Audit and Compliance Committee. These meetings were also attended by the Director of Compliance. During the Supervisory Board meetings, there were regular updates on specific projects, such as client due diligence. The Supervisory Board was also informed periodically about the ongoing implementation of new legislation and regulations such as MiFID II, the General Data Protection Regulation (Algemene Verordening Gegevensbescherming), the EBA Guidelines on internal governance, and the EBA and ESMA Guidelines on the assessment of the suitability of members of the management body and key function holders.
Relationship with stakeholdersThe Supervisory Board regularly discussed Van Lanschot Kempen NV's relationship with its shareholders. The most important topics Van Lanschot Kempen discussed with its shareholders were the general development of Van Lanschot Kempen, the progress made on executing Strategy 2020, and Van Lanschot Kempen NV's strong capital base, which enabled it to make a capital return payment to its shareholders in December 2018. The scope of engagement with shareholders was further expanded in 2018.

In December 2018, Willy Duron and Jeanine Helthuis attended the Works Council’s meeting with the Executive Board, at which the general course of business at Van Lanschot Kempen was discussed. The Supervisory Board values its constructive relationship with the Works Council.
Relevant aspects of corporate social responsibilityAs part of the continuing education programme, in September 2018 the Head of CSR and the Director of Impact and Responsible Investment informed the Supervisory Board about recent developments in the area of CSR. The focus was on growing client demand for sustainable investment solutions, the increasing relevance of external sustainability frameworks, and the upcoming (European) regulations on sustainability. In addition, Kempen Capital Management’s Chief Investment Officer informed the Supervisory Board about the relevant aspects of Focusing Capital on the Long Term: an initiative in which Kempen actively participates to emphasise the importance of investing in companies with a long-term focus.
The Risk Committee was informed about progress made on applying the responsible lending policy. Based on the way CSR is integrated in the organisation – e.g. in policies, products and reporting – the Supervisory Board concluded that Van Lanschot Kempen has taken significant steps in the area of CSR over the years. In view of the continuous developments in this field, CSR remains a topic that requires ongoing attention from Van Lanschot Kempen.
Internal organisation
Composition of the Statutory and Executive BoardsThe composition of the Statutory Board did not change in 2018. From 2015 onwards, the Statutory Board has, in principle, been taking its decisions at the Executive Board’s meetings. The composition of the Executive Board changed in 2018. Paul Gerla sadly passed away in November 2018 after having to step down as a member of the Executive Board for medical reasons on 5 February 2018. He was succeeded by Leni Boeren, responsible for Asset Management, who was appointed as a member of the Executive Board on 5 February 2018. As of that date she was also appointed as Chairman of the Managing Board of Kempen. The Executive Board consists of Karl Guha (Chairman), Constant Korthout, Arjan Huisman, Richard Bruens, Leni Boeren, and Leonne van der Sar. Constant Korthout, Richard Bruens and Arjan Huisman were reappointed as members of the Statutory Board for a period of four years by the annual general meeting in May 2018.
Composition of the Supervisory BoardGodfried van Lanschot stepped down as a member of the Supervisory Board at the general meeting on 31 May 2018. He had been a member of the Supervisory Board for a period of 12 years. The Supervisory Board is sincerely grateful to Godfried van Lanschot for his valuable contribution to the Board over the past 12 years.
At the general meeting on 31 May 2018, Maarten Muller was appointed as a new member of the Supervisory Board until the general meeting that will take place in 2022. At the extraordinary general meeting on 5 October 2018, Frans Blom was appointed as a new member of the Supervisory Board until the general meeting that will take place in 2023.
According to schedule, Willy Duron’s and Bernadette Langius's terms of office as members of the Supervisory Board will expire in May 2019.
Supervisory Board meetingsThe Supervisory Board held 12 meetings in 2018. The Executive Board attends the formal meetings of the Supervisory Board and prepares detailed supporting information. Regular items on the agenda of these meetings included strategy, developments within the various business lines, corporate governance, risk management, IT and operations, results and budget. In addition, the Board discussed the return of capital to shareholders of Van Lanschot Kempen NV, and the simplification of the legal structure of Van Lanschot Kempen.
The Supervisory Board also held 12 additional meetings – most of which were in advance of the regular Supervisory Board meetings – with Supervisory Board members only. These closed meetings give the Supervisory Board the opportunity to reflect on the agenda items and discuss possible concerns in advance of the regular meetings, as well as to discuss matters such as the proposal for the amendment of the remuneration of the Statutory and Supervisory Boards and the suitability matrix of the Supervisory Board. The Chairman of the Executive Board was invited to attend some of these closed meetings, depending on the topics being discussed. The table on the next page shows the composition of Supervisory Board committees, and the attendance rate of each member of the Supervisory Board at committee meetings.
The Supervisory Board received all information needed to perform its tasks from the Executive Board and the external auditors. Employees from within the organisation regularly attended meetings to provide additional information on themes within their respective fields. The agendas for Supervisory Board meetings were drawn up by the Company Secretary, in consultation with the Chairman of the Supervisory Board.
In addition, the Supervisory Board held three sessions with the Executive Board which were fully dedicated to Van Lanschot Kempen’s strategy. The strategy sessions were attended by all members of the Supervisory Board.
Report of the Supervisory Board 60

Supervisory Board committees
Composition of Supervisory Board committeesThe Supervisory Board has appointed four committees from among its members. Each committee advises the Supervisory Board and prepares decision-making by the Board in its designated area of interest.
The Supervisory Board remains fully responsible for all decisions. The table below shows the composition of the Supervisory Board and its committees, and their respective attendance rates.
Composition and attendance rate
Supervisory Board Audit and Compliance Committee
Risk Committee Selection and Appointment
Committee
Remuneration Committee
Willy Duron 95.83% (Chairman)
80% 100% 100% (Chairman)
100%
Manfred Schepers 95.83% 100% 100% (Chairman)
Jeanine Helthuis 91.67% 100% 100%
Bernadette Langius 95.83% 100% 100% (Chairman1)
Godfried van Lanschot 100% 100% 100% (Chairman2)
Lex van Overmeire 91.67% 100% (Chairman)
100%
Maarten Muller3 100% 100% 100%
Frans Blom4 100% 100% 100%
Key items for discussion Audit and Compliance Committee review and conclusion
Impairments of loans and advances to the public and private sectorsAs of 2018, impairments for individually identifiable loans are based on IFRS 9, which replaced IAS 39. Van Lanschot Kempen recognises a loss allowance for expected credit losses (ECL) on all loans. The ECL is calculated by using purpose-built IFRS 9 models. For credit-impaired loans, the Restructuring & Recovery team provides input in determining the lifetime of ECL.
Determining the appropriateness of the individual items involves elements of judgement and requires management to make assumptions.
On the basis of periodically discussed management reports, we challenged the completeness and accuracy of the impairments made. We discussed the changes in loss allowances during the year as well as the loss allowances recognised in the profit and loss statement.
Based on our discussion and considering the acceptable range in the context of estimate uncertainty, we agree with the methodology applied by management in determining the provisions for impairments of loans and advances to the public and private sectors, and with the corresponding results. The disclosures relating to this item are set out in Note 9 to the financial statements.
Fair value measurement of financial instrumentsFor financial instruments traded in an active market (Level 1) the valuation is based on quoted prices and market data. There is limited judgement involved in the fair value valuation of these instruments. For financial instruments not traded in an active market (Levels 2 and 3) management applies subjective judgement in the fair value valuation of these instruments. The fair value of Level 2 and 3 instruments is determined with the use of net present value models, option models or the net asset value of the underlying investment.
In addition, for certain Level 3 instruments, Van Lanschot Kempen uses market and transaction multiples in the valuation. The nature of the instrument determines the model and data used.
We were informed about the methods used for, and the outcome of, management’s valuations of Level 2 and 3 financial instruments, including the governance around model and assumption changes.
Based on our discussions and considering the acceptable range in the context of estimation uncertainty, we agree with the estimates applied in the fair valuation of the Level 2 and 3 financial instruments.
Report of the Supervisory Board 61
Audit and Compliance Committee The Audit and Compliance Committee held five meetings in 2018. These meetings were attended by a delegation from the Statutory Board. The external auditors and the directors of Group Audit, Compliance, and Finance, Reporting & Control were also present at the meetings.
The Audit and Compliance Committee carried out a detailed assessment of the annual figures, half-year figures, and information used for the trading updates and the proposal for a capital return to the shareholders of Van Lanschot Kempen NV of €1.50 per share. The committee considered significant financial items in relation to the Van Lanschot Kempen NV's financial statements and disclosures, which are shown in the table below and overleaf.
1 As of 1 June 2018. 2 Until 31 May 2018.3 As of 31 May 2018. 4 As of 5 October 2018.

The committee discussed the external auditors’ audit plan, reports and the management letter prior to their consideration by the full Supervisory Board. During these discussions, the committee discussed the audit scope, materiality and key audit matters as reported by the auditors. The Audit and Compliance Committee works closely with the Risk Committee on some key audit matters such as reliability and continuity of the IT environment and cyber security. In the December meeting, the functioning of PwC in 2018 was evaluated. The committee reviews the external auditors’ independence, communication and fees every year. The outcome of the evaluation resulted in the proposal to reappoint PwC for the 2020 financial year.
The committee considered the annual plan and reports from Group Audit, and the annual plan and reports from the Compliance department. The Audit and Compliance Committee also discussed the report regarding the external recertification of Group Audit. The basis of this periodical recertification is the code of conduct and the standards of The Institute of Internal Auditors Inc. The committee was informed about contacts with, and correspondence and reports of, De Nederlandsche Bank (DNB) and the Dutch Authority for the Financial Markets (AFM). The Audit and Compliance Committee also met separately with the internal and external auditors.
The Audit and Compliance Committee discussed the quarterly reports of Group Audit and Compliance, as part of its evaluation of the quality and effectiveness of Van Lanschot Kempen’s governance, risk management and internal control systems. Group Audit reports present the results of reviews of the risk & control framework, the implementation and functioning of IT systems, the management of the loan portfolio, and the impact of the strategy on the organisation. Quarterly reporting from Compliance covered themes such as client-centricity, client due diligence, implementation of rules and regulations, and adherence to the applicable rules.
Risk CommitteeManfred Schepers was appointed as Chairman of the Risk Committee as of 1 January 2018. He replaced Willy Duron, who remained a member of the committee. In October 2018, Frans Blom was appointed as a new member of the Risk Committee. The Risk Committee met three times in 2018. Its meetings were also attended by the CFO/CRO and the directors of Group Risk Management and of Credit Risk and Credit Restructuring and Recovery.
The committee paid detailed attention to the credit, operational, market and interest rate risks to which the organisation is exposed.
The quarterly risk appetite reports were discussed by the Risk Committee. Specific attention was given to reviewing whether Van Lanschot Kempen’s risk profile was within the limits set in Van Lanschot Kempen’s risk appetite. In its meetings, the committee discussed credit risk, execution risk, data management risk, cyber risk and business continuity risk. Interest rate and market risk developments were discussed based on duration analyses, the development of value at risk, and stress tests.
The committee was also informed generally about the way in which Van Lanschot Kempen is preparing for the implementation of Basel IV and IRB model developments.
At the committee’s December 2018 meeting, the capital and funding plan for 2019-21 and Van Lanschot Kempen’s risk appetite for 2019 were discussed. Both documents were submitted to the Supervisory Board with a positive recommendation. See vanlanschotkempen.com/en/governance (“Banking Code”) for the principles on which Van Lanschot Kempen’s risk appetite is based.
Report of the Supervisory Board 62
Key items for discussion Audit and Compliance Committee review and conclusion
Adoption of IFRS 9 (Financial Instruments)Van Lanschot Kempen adopted IFRS 9 as of 1 January 2018. This resulted in changes in accounting policies and adjustments to the amounts previously recognised in the financial statements. Adjustments were recognised in the opening balance, including in retained earnings and other reserves.
Under IFRS 9, impairments are based on an expected credit loss model rather than the incurred credit loss model used under IAS 39.
We have monitored the implementation of IFRS 9 and have reviewed the disclosures made in the financial report on the 2018 half-year results and in the 2018 annual report. Management informed us about the changes made in classification of financial instruments and in determining the level of impairments. PwC explained their audit procedures regarding IFRS 9, including validating the IFRS 9 models developed by Van Lanschot Kempen, and testing the internal control environment and relevant IT systems and applications.
Financial and non-financial KPIsDuring 2018, a new set of financial and non-financial Key Performance Indicators (KPIs) was developed, focusing on the creation of long-term value. These KPIs reflect both the interests of our stakeholders and our ambitions as a wealth manager.
In the process of preparing the annual accounts for 2018, we assessed the new KPIs in light of our strategy and made enquiries about how these KPIs link to the material topics prioritised by our stakeholders in the materiality matrix.
Implementation of IFRS 16IFRS 16 Leases was issued in January 2016 and replaces IAS 17 Leases and IFRIC 4 Determining Whether an Arrangement Contains a Lease. IFRS 16 sets out the principles for recognition, measurement, presentation and disclosure of leases and will result in almost all leases being recognised on the balance sheet, similar to the accounting for finance leases under IAS 17.
Management informed the Audit and Compliance Committee in detail on the progress of preparations for implementing IFRS 16. We find that Van Lanschot Kempen is prepared for this new standard.
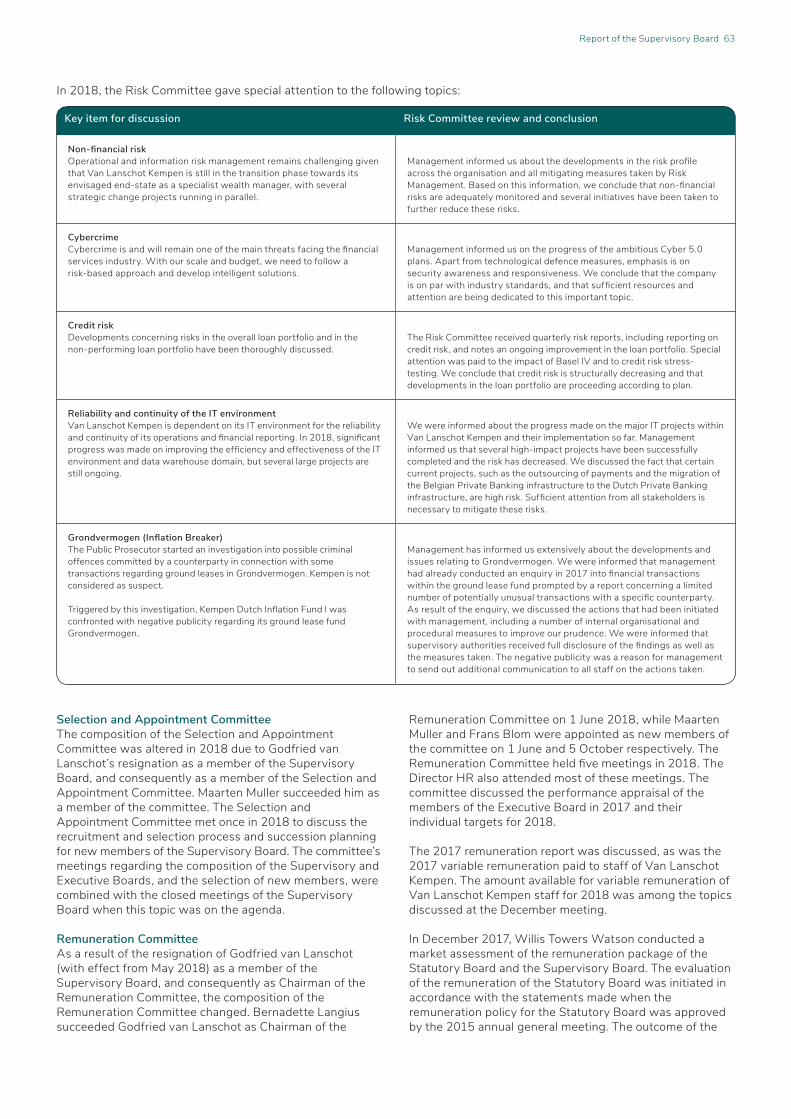
In 2018, the Risk Committee gave special attention to the following topics:
Selection and Appointment CommitteeThe composition of the Selection and Appointment Committee was altered in 2018 due to Godfried van Lanschot’s resignation as a member of the Supervisory Board, and consequently as a member of the Selection and Appointment Committee. Maarten Muller succeeded him as a member of the committee. The Selection and Appointment Committee met once in 2018 to discuss the recruitment and selection process and succession planning for new members of the Supervisory Board. The committee’s meetings regarding the composition of the Supervisory and Executive Boards, and the selection of new members, were combined with the closed meetings of the Supervisory Board when this topic was on the agenda.
Remuneration CommitteeAs a result of the resignation of Godfried van Lanschot (with effect from May 2018) as a member of the Supervisory Board, and consequently as Chairman of the Remuneration Committee, the composition of the Remuneration Committee changed. Bernadette Langius succeeded Godfried van Lanschot as Chairman of the
Remuneration Committee on 1 June 2018, while Maarten Muller and Frans Blom were appointed as new members of the committee on 1 June and 5 October respectively. The Remuneration Committee held five meetings in 2018. The Director HR also attended most of these meetings. The committee discussed the performance appraisal of themembers of the Executive Board in 2017 and their individual targets for 2018.
The 2017 remuneration report was discussed, as was the 2017 variable remuneration paid to staff of Van Lanschot Kempen. The amount available for variable remuneration of Van Lanschot Kempen staff for 2018 was among the topics discussed at the December meeting.
In December 2017, Willis Towers Watson conducted a market assessment of the remuneration package of the Statutory Board and the Supervisory Board. The evaluation of the remuneration of the Statutory Board was initiated in accordance with the statements made when the remuneration policy for the Statutory Board was approved by the 2015 annual general meeting. The outcome of the
Report of the Supervisory Board 63
Key item for discussion Risk Committee review and conclusion
Non-financial riskOperational and information risk management remains challenging given that Van Lanschot Kempen is still in the transition phase towards its envisaged end-state as a specialist wealth manager, with several strategic change projects running in parallel.
Management informed us about the developments in the risk profile across the organisation and all mitigating measures taken by Risk Management. Based on this information, we conclude that non-financial risks are adequately monitored and several initiatives have been taken to further reduce these risks.
CybercrimeCybercrime is and will remain one of the main threats facing the financial services industry. With our scale and budget, we need to follow a risk-based approach and develop intelligent solutions.
Management informed us on the progress of the ambitious Cyber 5.0 plans. Apart from technological defence measures, emphasis is on security awareness and responsiveness. We conclude that the company is on par with industry standards, and that sufficient resources and attention are being dedicated to this important topic.
Credit riskDevelopments concerning risks in the overall loan portfolio and in the non-performing loan portfolio have been thoroughly discussed.
The Risk Committee received quarterly risk reports, including reporting on credit risk, and notes an ongoing improvement in the loan portfolio. Special attention was paid to the impact of Basel IV and to credit risk stress-testing. We conclude that credit risk is structurally decreasing and that developments in the loan portfolio are proceeding according to plan.
Reliability and continuity of the IT environmentVan Lanschot Kempen is dependent on its IT environment for the reliability and continuity of its operations and financial reporting. In 2018, significant progress was made on improving the efficiency and effectiveness of the IT environment and data warehouse domain, but several large projects are still ongoing.
We were informed about the progress made on the major IT projects within Van Lanschot Kempen and their implementation so far. Management informed us that several high-impact projects have been successfully completed and the risk has decreased. We discussed the fact that certain current projects, such as the outsourcing of payments and the migration of the Belgian Private Banking infrastructure to the Dutch Private Banking infrastructure, are high risk. Sufficient attention from all stakeholders is necessary to mitigate these risks.
Grondvermogen (Inflation Breaker)The Public Prosecutor started an investigation into possible criminal offences committed by a counterparty in connection with some transactions regarding ground leases in Grondvermogen. Kempen is not considered as suspect.
Triggered by this investigation, Kempen Dutch Inflation Fund I was confronted with negative publicity regarding its ground lease fund Grondvermogen.
Management has informed us extensively about the developments and issues relating to Grondvermogen. We were informed that management had already conducted an enquiry in 2017 into financial transactions within the ground lease fund prompted by a report concerning a limited number of potentially unusual transactions with a specific counterparty. As result of the enquiry, we discussed the actions that had been initiated with management, including a number of internal organisational and procedural measures to improve our prudence. We were informed that supervisory authorities received full disclosure of the findings as well as the measures taken. The negative publicity was a reason for management to send out additional communication to all staff on the actions taken.

assessment was that the remuneration of the Statutory Board and the Supervisory Board was significantly below median levels. The Supervisory Board decided to make proposals for the adjustment of the remuneration of the Statutory Board and the Supervisory Board. These proposals were both approved by the annual general meeting in May 2018.
Assuring supervision quality
Evaluation of the Supervisory BoardThe Supervisory Board performs an annual evaluation of the functioning of the Supervisory Board, its committees and individual members. The evaluation is carried out under the guidance of an external adviser once every three years. In the years in between, the evaluation process is carried out using a questionnaire completed by each board member. In 2018, the questionnaire was further supplemented based on the new EBA and ESMA guidelines on the assessment of the suitability of members of the management body and key function holders. Included in the evaluation are the participation and contribution of each member of the Supervisory Board, the knowledge and experience of the Supervisory Board collectively, the interaction and dynamics within the Supervisory Board, the communication and provision of information, the decision-making process, the independence of mind of the individual members, and the relationship with the Executive Board. The outcomes and recommendations from the evaluation were discussed by the Supervisory Board at the Supervisory Board meeting in February 2019; recommendations will be implemented as a result. The overall conclusion of the evaluation was that the Supervisory Board is functioning well and that its composition is in line with the required profile in terms of suitability, expertise and diversity, and also complies with Principle 2.1 of the Dutch Corporate Governance Code. The conclusions and recommendations relevant to the Executive Board will be shared with the Executive Board.
Evaluation of the Statutory Board and Executive BoardIn February 2019, the Supervisory Board evaluated the functioning of the Statutory Board and Executive Board as a whole and that of the individual members of both boards on the basis of the key performance indicators (KPIs) for 2018. The Supervisory Board sets the KPIs for the Executive Board every year. The KPIs are divided into 50% financial KPIs, 40% non-financial KPIs and 10% personal KPIs. The financial KPIs include the return on CET 1 capital, the operating profit before tax, and the cost/income ratio. The non-financial KPIs include the implementation of the 2020 strategy, diversity and inclusion, and client NPS. The assessment of the KPIs is included as the basis for the collective assessment of the Executive Board and the individual assessment of the members of the Executive Board for 2018. The outcome was that the performance of the Executive Board in 2018 is slightly above target. The conclusions and recommendations relevant to the Statutory and Executive Boards were shared with the members of these boards.
The Executive and Statutory Boards evaluate their own functioning and effectiveness on a regular basis during their quarterly off-sites. Board members gave each other feedback on their strengths and points to consider, and reflected on these.
On-boarding programmeAll new members of the Supervisory Board complete an extensive on-boarding programme when appointed. The programme is tailor-made for each newly appointed member of the Supervisory Board, as their knowledge and experience varies. The aim of the on-boarding programme is to ensure that new members have thorough knowledge of Van Lanschot Kempen and its business activities in order to fulfil their role within the Supervisory Board.
EducationThe members of the Supervisory and Executive Boards took part in the continuing education programme. In 2018, three continuing education sessions were organised. Topics covered included:– Data, privacy and digital strategy;– Sustainability and focusing capital on the long term;– The Dutch Money Laundering and Terrorist Financing
(Prevention) Act (Wwft) and the fourth European Anti-Money Laundering (AML) Directive.
These education sessions were positively rated by the members of the Supervisory and Executive Boards.
IndependenceAll members of the Supervisory Board perform their duties independently and critically. The independence requirements described in best practice provisions 2.1.7 to 2.1.9 of the Dutch Corporate Governance Code have been fulfilled. Currently, there are no dependent members on the Supervisory Board. In the event of a potential conflict of interest relating to a particular topic, the Supervisory Board member concerned is not allowed to participate in discussions or decision-making on that topic. Best practice provisions 2.7.3 to 2.7.4 of the Dutch Corporate Governance Code were observed as far as applicable. In 2018, there were no conflicts of interest of material significance for members of the Supervisory or Statutory Boards.
Financial statementsThe Supervisory Board has reviewed and approved the annual report for 2018 and the 2018 financial statements. The 2018 financial statements have been audited by the external auditors, PwC. The independent auditors’ report can be found on page 207. We invite the annual general meeting to adopt the 2018 financial statements as submitted and to discharge the Statutory Board in respect of its conduct of Van Lanschot NV's affairs and the members of the Supervisory Board in respect of their supervision.
Report of the Supervisory Board 64

AcknowledgementsThe Supervisory Board would like to thank all stakeholders for their continued trust and confidence in Van Lanschot Kempen. We would also like to express our thanks to the Executive Board and to all staff for their personal dedication and ongoing commitment, as well as for their achievements in 2018.
We would particularly like to remember Paul Gerla, who sadly passed away in November 2018 after having to resign from the Executive Board for medical reasons earlier in the year. In him, we lost an experienced board member and ever-optimistic colleague. Paul Gerla played a key role in the successful integration of Van Lanschot NV and Kempen into Van Lanschot Kempen. We are very grateful for his important contribution to the company over the past years. He will be dearly missed by us all.
‘s-Hertogenbosch, the Netherlands, 13 March 2019
Supervisory Board
Willy Duron, Chairman Manfred Schepers, Deputy ChairmanFrans BlomJeanine HelthuisBernadette LangiusMaarten MullerLex van Overmeire
Report of the Supervisory Board 65
Corporate governance 66
CORPORATE GOVERNANCE
Van Lanschot NV is a full subsidiary of Van Lanschot Kempen NV. The Supervisory and Statutory Boards of Van Lanschot NV also serve as the Supervisory and Statutory Boards of Van Lanschot Kempen NV. In view of this, the section below reflects most of the key elements of corporate governance at Van Lanschot Kempen NV. The Articles of Association and various other regulations and documents relating to corporate governance can be found at vanlanschotkempen.com/en/governance and vanlanschotkempen.com/management-supervision.
Corporate governance structureVan Lanschot Kempen NV is a listed public limited company under Dutch law, governed by a two-tier board. The Statutory Board is responsible for managing the company, while the Supervisory Board oversees the policies pursued by the Statutory Board, and the general conduct of affairs at the company and its associated business. The Supervisory Board advises the Statutory Board on the performance of its duties.
Van Lanschot Kempen NV is a structuurvennootschap. Under Dutch corporate law this means that in addition to the tasks already mentioned, the Supervisory Board is responsible for appointing and dismissing the Statutory Board and for approving some of its decisions. Both the Statutory Board and the Supervisory Board report to Van Lanschot Kempen NV's general meeting.
Statutory BoardThe Statutory Board is responsible for the continuity of the company and its associated business. It focuses on long-term value creation for the company and its associated business, and takes into account stakeholders’ interests that are relevant in this context. The Statutory Board is responsible for the management of the company, and its duties include drawing up and achieving Van Lanschot Kempen’s mission, its strategy and related risk profile, its goals and the pattern of its results, while also attending to the social aspects of doing business that are relevant to the company.
Van Lanschot Kempen NV holds all the shares in Van Lanschot NV. The Statutory Board of Van Lanschot Kempen NV is also the Statutory Board of Van Lanschot NV. The Supervisory Board notifies the general meeting of any proposed appointment of a member of the Statutory Board. A member is appointed by the Supervisory Board for a maximum period of four years. The Supervisory Board may dismiss a member of the Statutory Board at any time, but only after consulting the general meeting.
In strategic decisions, the Statutory Board takes all material environmental and social aspects into account. Periodically, it determines the financial and non-financial key performance indicators (KPIs) at Van Lanschot Kempen.
Executive BoardSince 2015, Van Lanschot Kempen NV has had an Executive Board comprising the members of the Statutory Board of Van Lanschot Kempen NV and the members of the Management Board of Kempen.
The Executive Board oversees the implementation of company strategy and manages core activities. This ensures better alignment between core activities and a more effective decision-making process. In principle, all members of the Executive Board attend Supervisory Board meetings. The Executive Board makes sure that all the information relevant to the Supervisory Board is provided. Van Lanschot Kempen NV's Statutory Board members have ultimate responsibility for the actions and decisions of the Executive Board.
We are exploring the possibilities for a legal merger between Van Lanschot NV and Kempen. If this goes ahead, we will consider expanding Van Lanschot NV's Statutory Board to include the members of Kempen’s Management Board who are not yet members of the Statutory Board of Van Lanschot NV. This would take place starting from the date of the legal merger between Van Lanschot NV and Kempen. Supervisory BoardIn performing its duties, the Supervisory Board focuses on the interests of the company and its associated business. The Supervisory Board of Van Lanschot Kempen NV is also the Supervisory Board of Van Lanschot NV.
The members of Van Lanschot Kempen NV's Supervisory Board are appointed by the general meeting, in accordance with the provisions set out in Article 23 of Van Lanschot Kempen NV's Articles of Association. Members of the Supervisory Board are appointed for a term of four years and may be reappointed for one further four-year period. A member of the Supervisory Board may subsequently be reappointed again for a period of two years, and this appointment may be extended another two years. In the event of reappointment after eight years, the reasons for reappointment should be given in the report of the Supervisory Board. Willy Duron was reappointed as member of the Supervisory Board for a third term of four years in 2015. As stipulated in the Dutch Corporate Governance Code 2016, best practice provision 2.2.2 does not apply to him since his appointment complies with best practice provision III.3.5 of the Dutch Corporate Governance Code adopted in 2008.
A member of the Supervisory Board may only be dismissed by the Enterprise Chamber of the Amsterdam Court of Appeal with due observance of Article 161(2) of Book 2 of the Dutch Civil Code. In addition, the general meeting may pass a motion of no confidence in the Supervisory Board as a whole, in accordance with Article 161(a) of Book 2 of the

Dutch Civil Code. Such a resolution results in the immediate dismissal of all members of the Supervisory Board.
Diversity policyThe Supervisory Board of Van Lanschot Kempen NV has adopted a diversity policy for the composition of the Supervisory and Executive Boards (the policy can be found at vanlanschotkempen.com/management-supervision under “Diversity Policy Supervisory Board and Executive Board”). In view of their joint functioning, the diversity policy for the Executive Board includes the Statutory Board of Van Lanschot Kempen NV.
We are committed to supporting, valuing and leveraging inclusiveness and diversity, and aim for a diverse composition of the Supervisory and Executive Boards in the areas relevant to us, such as age, background, experience, gender and nationality. The importance of diversity should not mean setting aside a candidate’s qualifications, the requirements for the position to be filled or the overriding principle that someone should be recommended, nominated and appointed for being “the best person for the job”.
With regard to gender diversity, we strive for a reasonable spread across gender and aim for the composition of the Supervisory and Executive Boards to be such that at least 30% of their respective members are men and at least 30% women. We strive for a reasonable spread across ages and nationalities in the composition of the Supervisory and Executive Boards, but we do not believe that age or nationality are suitable criteria for setting specific diversity targets so we do not set specific objectives for these. With regard to background, experience and expertise, we aim – in keeping with the Supervisory Board’s profile – to ensure that the combined background, experience and expertise of Supervisory Board members enables the board as a collective to best carry out its range of responsibilities and duties towards Van Lanschot Kempen NV, taking into account the nature of our business and activities. The same applies for the Executive Board. Our diversity policy describes the relevant areas of background, experience and expertise of the Supervisory Board and the Executive Board respectively.
In implementing our diversity policy, the individual profiles drawn up for vacancies in the Supervisory and Executive Boards take into account the policy’s criteria and objectives. These profiles form the basis for the recruitment and selection of new members of the Supervisory and Executive Boards. These criteria and objectives are also taken into account when evaluating the functioning of the Supervisory and Executive Boards. The results of our diversity policy are described in the section below on the boards’ composition and performance.
The policy governing recruitment and selection of members of the Statutory and Supervisory Boards can be found at vanlanschotkempen.com/management-supervision, under “Policy Recruitment and Selection Van Lanschot Kempen”.
Composition and performance of the Statutory and Executive BoardsThe Statutory Board must consist of at least three members, with the actual number set by the Supervisory Board. The composition of the Statutory Board did not change in 2018, and consisted of Karl Guha (Chairman), Constant Korthout, Arjan Huisman and Richard Bruens. The composition of the Executive Board did change in 2018: Paul Gerla resigned from the Board on 5 February 2018 and Leni Boeren took over his positions from that date. The Executive Board comprises Karl Guha (Chairman), Constant Korthout, Arjan Huisman, Richard Bruens, Leni Boeren and Leonne van der Sar.
The Statutory and Executive Boards evaluate their functioning as a whole and that of individual Board members at least once a year. The Supervisory Board discusses, at least once a year, the performance of the Statutory Board and the Executive Board as a whole and members’ performance individually. The Supervisory Board has concluded that the composition of the Statutory and Executive Boards meets the objectives of our diversity policy. The specific target for the Executive Board’s male/female ratio as set out in our diversity policy was met since two of the six members of the Executive Board are female.
No decisions were taken in 2018 to conclude transactions involving a conflict of interest on the part of members of the Statutory Board that were of material significance to Van Lanschot Kempen NV and/or the Board member in question.
Composition and performance of the Supervisory Board and its committeesThe Supervisory Board has a minimum of three members and a maximum of nine. Currently the Supervisory Board comprises Willy Duron (Chairman), Manfred Schepers (Deputy Chairman), Frans Blom, Jeanine Helthuis, Bernadette Langius, Maarten Muller and Lex van Overmeire. More information about the changes in composition during 2018 can be found on page 60 of the report of the Supervisory Board.
The Supervisory Board has appointed four committees from among its members to prepare the board’s decision-making: the Audit and Compliance Committee, the Risk Committee, the Remuneration Committee, and the Selection and Appointment Committee. These committees advise the Supervisory Board on matters relating to their respective areas of interest. More information about the committees and their composition can be found on page 61 of the report of the Supervisory Board.
The Supervisory Board has drawn up a profile1 for its size and composition, taking into account the nature and activities of the business associated with Van Lanschot Kempen NV and its subsidiaries, and the required expertise and background of the members of the Supervisory Board. The Supervisory Board appraises its own performance, that of its committees and that of individual Supervisory Board members, at least once a year without members of the Statutory Board being present. The Supervisory Board appraises its own performance with independent support
Corporate governance 67
1 The profile can be viewed at vanlanschotkempen.com/management-supervision.
once every three years. The Supervisory Board has concluded that it would be desirable to appoint new members with a legal background as well as a background in change processes, disruption and strategic planning. For these reasons, Maarten Muller and Frans Blom were appointed as new members of the Supervisory Board in 2018.
The Supervisory Board meets the objectives of our diversity policy. The Supervisory Board currently has seven members, two of whom are female, which means 28.6% of the positions in the Supervisory Board are held by women. Given the size of the Supervisory Board, the aim for 30% of the positions to be held by women has in effect been achieved.
Dutch Banking CodeThe updated Banking Code2 came into effect on 1 January 2015, superseding the original Banking Code which had been in force since 1 January 2010. The Banking Code contains principles on sound and ethical business operations, governance, risk policy, audit and remuneration policy.
The Banking Code applies to activities performed in, and aimed at, the Netherlands by banks with registered offices in the Netherlands and which hold a banking licence issued by De Nederlandsche Bank (DNB). It therefore applies to Van Lanschot NV, the subsidiary of Van Lanschot Kempen NV that holds a banking licence in the Netherlands. Where banks that are subject to the Banking Code form part of a group, parts of the Banking Code may be applied at the level of the entity which acts as the head of the group, rather than at the level of individual subsidiaries. Certain parts of the Banking Code are therefore applied at the level of Van Lanschot Kempen NV.
Application of the Banking CodeIn 2018, Van Lanschot NV complied with the Banking Code. An explanation (in Dutch) of how Van Lanschot has applied the Banking Code during the reporting year is given on our website: vanlanschotkempen.com/en/governance.
Main features of Van Lanschot Kempen’s management and control systemVan Lanschot Kempen’s management and control system is designed to manage internal and external risks. This includes the management of financial reporting risks, to ensure reliable financial reporting and financial statements that are prepared in accordance with generally accepted accounting principles, and which comply with the prevailing legislation and regulations.
Van Lanschot Kempen applies the “three lines of defence” model for the management of risk. The first line of defence is the business, responsible for day-to-day risk management. The second line of defence is provided by departments such as Group Risk Management and Compliance, which oversee the first line. Group Audit acts as the third line of defence, providing an independent evaluation of the adequacy of the internal management and control systems.
The three lines of defence model provides the Statutory Board with a reasonable degree of certainty as to how the internal management and control system is functioning, including the efficacy of both the first and second lines. In 2018, we improved our monitoring of the effectiveness of key controls (as part of the risk & control framework), and updated the risk & control framework to reflect changes in the organisational structure.
Group Audit is responsible for carrying out IT and operational audits. All of Group Audit’s reports were submitted to the Statutory Board. Group Audit, Compliance and Group Risk Management ensure adequate follow-up and prioritisation. Supplementary control measures have been defined in the meantime, which should mitigate risk sufficiently.
The effectiveness of the framework is evaluated annually by Group Risk Management and Compliance, while Group Audit also assesses its quality and effectiveness. The results of these evaluations featured in the respective quarterly reports of Group Risk Management, Compliance and Group Audit.
For more detailed information on risk management within Van Lanschot Kempen, see page 47. The financial statements include also a more detailed explanation of risk management at Van Lanschot Kempen (see “Risk management”, beginning on page 103).
Financial reporting riskThe Statutory Board is responsible for the design and operation of an adequate system of internal control for Van Lanschot Kempen’s financial reporting. The system is designed to provide reasonable assurance as to the reliability of financial reporting. The financial statements must be prepared in accordance with generally accepted accounting principles and applicable legislation and regulations.
Van Lanschot Kempen has tools in place to manage financial reporting risks:– Periodic management reports and KPI dashboards,
accompanied by analysis of financial and non-financial figures and trends;
– A risk & control framework describing processes and procedures, and setting out primary controls such as authorisations and segregation of duties;
– Evaluation of the functioning of the internal management and control system by Group Audit. The main findings are discussed with the Statutory Board, the Audit and Compliance Committee and the Supervisory Board;
– Assessment and approval of the annual report by the Statutory Board, and discussion of the annual report by the Audit and Compliance Committee and the Supervisory Board;
– The Accounting Manual, which sets out the principles regarding financial accounting.
Corporate governance 68
2 The Banking Code can be downloaded from nvb.nl.

In-control statements are provided by the management of the relevant departments. These are based on the results of testing procedures for the risk & control framework, the risks reported on a quarterly basis, the follow-up of these risks, and the incidents reported. Group Risk Management and Compliance evaluated the 2018 in-control statements. The quarterly reports of Group Audit, setting out its main findings, were discussed with the Executive Board and the Audit and Compliance Committee. The conclusions of the Audit and Compliance Committee were subsequently shared with the Supervisory Board.
The Supervisory Board was informed about the Statutory Board’s internal control of the organisation, and how it safeguards the integrity of financial information. The subjects considered by the Supervisory Board when assessing the financial statements include the management letter and the audit by the external auditors.
The key audit matters cited in the independent auditors’ report were discussed with the Statutory Board and the Audit and Compliance Committee, and formed part of the organisation’s management and control.
External auditorsPricewaterhouseCoopers Accountants NV ("PwC") were reappointed as external auditors for the 2018 and 2019 financial years at the general meeting of Van Lanschot NV on 31 May 2018. PwC’s audit plan for 2018 and risk analysis were discussed in August 2018 at meetings of the Statutory Board and the Audit and Compliance Committee.
PwC issued a 2018 management letter in December 2018, and a board report for 2018 in February 2019. The subjects set out in this management letter and board report are in line with the notes included in this annual report with respect to risk management, insofar as these relate to financial reporting risks.
The Statutory Board and the Audit and Compliance Committee evaluated the functioning of PwC in December 2018.
Investor relations policyOur investor relations policy is designed to provide current and potential shareholders and bondholders, rating agencies and research analysts with accurate and timely information on developments within the business. We engage in active dialogue with all our financial stakeholders,by publishing press releases and our annual report, and by organising meetings and one-to-one discussions with existing and potential investors.
We observe a “silent” period of three weeks prior to the publication of our annual and half-year results. No meetings are held with shareholders or analysts during this period. We also publish our policies on investor relations at vanlanschotkempen.com /investorrelationspolicy.
All documents and other relevant information may be found at vanlanschotkempen.com/en. If you would like to receive Van Lanschot Kempen’s press releases by email, you can subscribe to our news service at vanlanschotkempen.com/pressreleases.
Investors and advisers with questions are welcome to contact our Investor Relations department byphone on +31 20 354 45 90 or by emailing [email protected].
Corporate governance 69
STATEMENT BY THE STATUTORY BOARD As required by Article 5:25c (2c) of the Financial Supervision Act, each of the undersigned hereby confirms that to the best of their knowledge:– The 2018 financial statements give a true and fair view
of the assets, liabilities, financial position and profit or loss of Van Lanschot NV and its consolidated entities;
– The 2018 Report of the Statutory Board of Van Lanschot NV gives a true and fair view of the position of the company and its consolidated entities on balance sheet date, and of the course of their affairs during the 2018 financial year, and describes the material risks that Van Lanschot NV faces.
’s-Hertogenbosch, the Netherlands, 13 March 2019
Statutory Board
Karl Guha, ChairmanConstant KorthoutArjan HuismanRichard Bruens

Executive Board 70
From left to right: Leni Boeren, Richard Bruens, Karl Guha, Arjan Huisman, Leonne van der Sar, Constant Korthout
PERSONAL DETAILS OF MEMBERS OF THE EXECUTIVE BOARD
Karl Guha
Chairman of the Statutory Board of Van Lanschot Kempen NV/Van Lanschot NV
Born1964, male
NationalityDutch
Appointed2 January 2013
Areas of responsibilityEvi, Company Secretariat/Legal, Strategy & Corporate Development, Human Resource Management, Communications, Compliance, Group Audit, Van Lanschot Belgium, Advanced Analytics
Total number of board and/or supervisory positionsTwo
Background1989 – ABN AMRO: Various managerial positions in Structured Finance, Treasury, Capital Management, Investor Relations, Risk Management and Asset & Liability Management2009 – UniCredit Banking Group: CRO and member of the executive management committee, and member of supervisory boards of Bank Austria, HVB in Germany and Zao Bank in Russia
Constant Korthout
Member of the Statutory Board, Chief Financial Officer/Chief Risk Officer of Van Lanschot Kempen NV/Van Lanschot NV, Member of the Management Board of Kempen & Co NV
Born1962, male
NationalityDutch
Appointed27 October 2010
Areas of responsibilityFinance, Reporting & Control, Treasury, Group Risk Management, Credit Restructuring & Recovery
Total number of board and/or supervisory positionsThree
Background1985 – ABN AMRO: Management trainee, senior account manager corporate clients1990 – KPMG Management Consultants1992 – Robeco: Group Controller, CFO and member of the executive board of Weiss, Peck & Greer in New York, and Corporate Development Director2002 – Robeco: CFO, including Risk Management, Treasury and Corporate Development

Arjan Huisman
Member of the Statutory Board, Chief Operating Officer of Van Lanschot Kempen NV/Van Lanschot NV
Born1971, male
NationalityDutch
Appointed6 May 2010
Areas of responsibilityIT Platforms & Security, Digital & Innovation, Service Centres: Securities, Data Management, Procurement, Contract Management & Facilities
Total number of board and/or supervisory positionsFour
Significant supervisory board memberships and/or (board) positionsVan Lanschot Chabot Holding: Member of supervisory board
Background1995 – BCG Amsterdam and Boston offices: Various consulting positions, with a strong focus on financial services2004 – BCG Prague office: Partner and Managing Director 2008 – BCG Amsterdam office: Partner and Managing Director
Richard Bruens
Member of the Statutory Board of Van Lanschot Kempen NV/Van Lanschot NV
Born1967, male
NationalityDutch
Appointed15 May 2014
Areas of responsibilityPrivate Banking, Corporate Social Responsibility, Van Lanschot Switzerland
Total number of board and/or supervisory positionsFive
Significant supervisory board memberships and/or (board) positionsVan Lanschot Chabot Holding: Member of supervisory boardFeyenoord Rotterdam: Member of supervisory board
Background1991 – ABN AMRO: Various managerial positions in the Global Markets division, Managing Director of Investor Relations2007 – Renaissance Capital: Member of group managing board2010 – ABN AMRO: Global Head Product & Private Wealth Management at ABN AMRO Private Banking International
Leni Boeren
Chairman of the Management Board of Kempen & Co NV
Born1963, female
NationalityDutch
Appointed5 February 2018
Areas of responsibilityAsset Management
Total number of board and/or supervisory positionsFive
Significant supervisory board memberships and/or (board) positionsTata Steel Nederland: Member of supervisory boardAir France-KLM: Independent member of board of directors and audit committeeFCLT Global: Member of board of directors
Background1983 – Paribas: Account Manager1984 – Rabobank: Senior Investment Adviser, Head of Account Management1992 – Robeco Group: Head of Investment Services Strategy, Head of Marketing and Product Management1997 – Amsterdam Exchanges: Member of board of directors2000 – Euronext: Member of executive committee2005 – Robeco Group: Member, Vice-Chair and Chair of the group management board and chair/member of the boards of a number of Robeco Group subsidiaries
Leonne van der Sar
Member of the Management Board of Kempen & Co NV
Born1969, female
NationalityDutch
Appointed1 August 2017
Executive Board 71

Areas of responsibilityMerchant Banking: Corporate Finance, Equity Capital Markets, Securities
Total number of board and/or supervisory positionsOne
Background1994 – ABN AMRO: Various positions in Investment Banking1998 – ABN AMRO Rothschild: Various positions in Investment Banking and Equity Capital Markets2004 – ABN AMRO Rothschild: Managing Director and Head of ABN AMRO Rothschild Netherlands office2006 – ABN AMRO: Executive Director Corporate Development2008 – Several interim management assignments in the financial sector2014 – Van Lanschot Kempen: Head of Strategy & Corporate Development
Executive Board 72

Supervisory Board 73
From left to right: Frans Blom, Jeanine Helthuis, Lex van Overmeire, Willy Duron, Bernadette Langius, Manfred Schepers, Maarten Muller
PERSONAL DETAILS OF MEMBERS OF THE SUPERVISORY BOARD
Willy Duron
Chairman of the Supervisory BoardSupervisory Board committees: Audit and Compliance, Remuneration, Risk, Selection and Appointment (Chairman)
Born1945, male
NationalityBelgian
Appointed10 May 2007; third term of office expires in 2019
Total number of supervisory board memberships and/or board positionsThree
Significant other supervisory board memberships and/or (board) positionsWindvision: Chairman of board of directors
Previous positions or offices heldKBC Group: Chairman
Manfred Schepers
Deputy Chairman of the Supervisory BoardSupervisory Board committees: Audit and Compliance, Risk (Chairman)
Born1960, male
NationalityDutch
Appointed18 May 2017; first term of office expires in 2021
Total number of supervisory board memberships and/or board positionsSix
Significant other supervisory board memberships and/or (board) positionsNWB Bank: Member of supervisory boardFotowatio Renewable Ventures: Member of supervisory boardAlmar Water Solutions: Member of supervisory board
Principal other positions or offices heldAmsterdam Institute of Finance: Member of advisory boardUWC Atlantic College: Member of board of governorsEuropean Fund for Strategic Investments: Member of investment committeeCardano Development: Project manager ILX
Previous positions or offices heldEuropean Bank for Reconstruction and Development: Vice President and Chief Financial Officer

Frans Blom
Member of the Supervisory BoardSupervisory Board committees: Risk, Remuneration
Born1962, male
NationalityDutch
Appointed5 October 2018; first term of office expires in 2023
Total number of supervisory board memberships and/or board positionsTwo
Principal positionBoston Consulting Group The Netherlands: Chairman
Jeanine Helthuis
Member of the Supervisory BoardSupervisory Board committees: Audit and Compliance, Selection and Appointment
Born1962, female
NationalityDutch
Appointed2 July 2013; second term of office expires in 2021
Total number of supervisory board memberships and/or board positionsSeven
Principal positionPC Uitvaart: Managing director
Significant other supervisory board memberships and/or (board) positionsProrail: Member of supervisory board
Significant other positions or offices heldNintes: Member of advisory council
Previous positions or offices heldMonuta Holding/Monuta Verzekeringen: Chairman of board of managementFortis Bank Nederland: Member of board of directors
Bernadette Langius
Member of the Supervisory BoardSupervisory Board committees: Remuneration (Chairman), Risk
Born1960, female
NationalityDutch
Appointed13 May 2015; first term of office expires in 2019
Total number of supervisory board memberships and/or board positionsFive
Significant other supervisory board memberships and/or (board) positionsIBM Nederland: Member of supervisory boardBDO Nederland: Member of supervisory boardIngenico ePayments Nederland: Member of supervisory board
Previous positions or offices heldVU Amsterdam: Member of executive boardABN AMRO: CEO Commercial Banking NL, CEO Private Banking NL
Maarten Muller
Member of the Supervisory BoardSupervisory Board committees: Remuneration, Selection and Appointment
Born1954, male
NationalityDutch
Appointed31 May 2018; first term of office expires in 2022
Total number of supervisory board memberships and/or board positionsTwo
Significant other supervisory board memberships and/or (board) positionsStichting continuïteit TomTom: Chairman
Previous positions or offices heldAllen & Overy LLP: Partner
Lex van Overmeire
Member of the Supervisory BoardSupervisory Board committees: Audit and Compliance (Chairman), Risk
Born1956, male
NationalityDutch
Appointed30 January 2017; first term of office expires in 2021
Total number of supervisory board memberships and/or board positionsThree
Supervisory Board 74

Significant other supervisory board memberships and/or (board) positionsCentrum indicatiestelling zorg (CIZ): Chairman of audit advisory committeeStichting Arq: Member of supervisory board
Previous positions or offices heldEY Accountants LLP: Audit partner
Supervisory Board 75

Reconciliation of IFRS and management reporting 76
RECONCILIATION OF IFRS AND MANAGEMENT REPORTING
Reconciliation of IFRS and management reporting (€ million)
IFRS Non-strategic
investments
Investment programme
Amortisation of intangible
assets arising from
acquisitions
Restructuring charges
Managerial
Commission 293.2 – – – – 293.2
Interest 175.2 0.4 – – – 175.6
Income from securities and associates 31.3 –0.2 – – – 31.1
Result on financial transactions –0.8 – – – – –0.8
Other income 7.3 –7.3 – – – –
Income from operating activities 506.3 –7.1 – – – 499.2
Staff costs 263.7 –7.8 –3.9 – –7.6 244.4
Other administrative expenses 162.0 3.2 –18.1 – –0.4 146.8
Depreciation and amortisation 14.4 –1.0 – –8.3 –0.0 5.2
Operating expenses 440.2 –5.6 –22.0 –8.3 –8.0 396.4
Gross result 66.1 –1.5 22.0 8.3 8.0 102.8
Impairments –13.4 – – – –0.3 –13.7
Operating profit before tax of non-strategic investments
– 17.8 – – – 17.8
Operating result before special items and tax 79.5 16.3 22.0 8.3 8.3 134.3
Strategic investment programme – – 22.0 – – 22.0
Amortisation of intangible assets arising from acquisitions
– – – 8.3 – 8.3
Restructuring charges – – – – 8.3 8.3
Operating profit before tax 79.5 16.3 – – – 95.8
Income tax 12.1 3.4 – – – 15.5
Discontinued activities 12.9 –12.9 – – – –
Net result 80.3 – – – – 80.3

2018 financial statements

31/12/2018 01/01/20181 31/12/2017
Assets
Cash and cash equivalents and balances at central banks 1 1,406,864 1,832,751 1,832,751
Financial assets from trading activities 2 62,468 38,234 38,234
Due from banks 3 539,180 186,459 186,459
Derivatives 4 332,719 322,258 322,258
Financial assets at fair value through profit or loss 5 218,583 416,899 394,898
Financial assets at fair value through other comprehensive income 6 1,803,584 1,716,354 –
Available-for-sale investments 7 – – 1,738,355
Held-to-maturity investments 8 – – 521,349
Loans and advances to the public and private sectors 9 8,561,497 9,092,207 9,103,327
Other financial assets at amortised cost 10 554,209 521,321 –
Investments in associates using the equity method 11 54,071 70,390 70,390
Property and equipment 12 48,238 63,468 63,468
Goodwill and other intangible assets 13 183,083 218,389 218,389
Tax assets 14 25,941 31,669 26,719
Assets classified as held for sale 15 68,058 – –
Other assets 16 121,513 142,277 142,277
Total assets 13,980,007 14,652,676 14,658,875
Equity and liabilities
Financial liabilities from trading activities 17 333 1,899 1,899
Due to banks 18 334,902 101,645 101,645
Public and private sector liabilities 19 9,090,939 9,145,119 9,145,119
Derivatives 4 469,316 318,417 318,417
Financial liabilities at fair value through profit or loss 20 940,361 971,453 971,453
Issued debt securities 21 1,521,504 2,411,671 2,411,671
Provisions 22 28,965 24,284 23,085
Tax liabilities 23 5,764 13,007 12,841
Liabilities classified as held for sale 24 20,871 – –
Other liabilities 25 125,383 156,820 156,820
Subordinated loans 26 173,473 173,620 166,802
Total liabilities 12,711,812 13,317,935 13,309,752
Issued share capital 40,000 40,000 40,000
Share premium reserve 216,149 277,674 277,674
Other reserves 925,203 911,296 925,678
Undistributed profit attributable to shareholder 74,631 89,508 89,508
Equity attributable to shareholder 1,255,982 1,318,478 1,332,860
Non-controlling interests 6,529 10,827 10,827
Undistributed profit attributable to non-controlling interests 5,684 5,437 5,437
Equity attributable to non-controlling interests 12,213 16,264 16,264
Total equity 27 1,268,195 1,334,742 1,349,124
Total equity and liabilities 13,980,007 14,652,676 14,658,875
Contingent liabilities 28 134,449 122,189 122,189
Irrevocable commitments 29 853,276 861,342 861,342
987,725 983,530 983,530
CONSOLIDATED STATEMENT OF FINANCIAL POSITION AT 31 DECEMBER 2018Before profit appropriation (€1,000)
The number beside each item refers to the Notes to the consolidated statement of financial position.
1 The consolidated statement of financial position reflects new presentation requirements related to the application of IFRS 9 as from 1 January 2018.
Consolidated statement of financial position at 31 December 2018 78

2018 2017
Income from operating activities
Interest income calculated using the effective interest method 251,985 275,893
Other interest income 52,359 64,158
Interest expense calculated using the effective interest method 66,518 76,319
Other interest expense 62,612 67,882
Net interest income 30 175,213 195,849
Income from associates using the equity method 28,728 24,074
Other income from securities and associates 2,594 12,956
Income from securities and associates 31 31,323 37,029
Commission income 307,714 280,519
Commission expense 14,467 13,533
Net commission income 32 293,247 266,986
Result on financial transactions 33 –805 14,127
Net sales 11,020 12,020
Cost of sales 3,716 3,472
Other income 34 7,304 8,548
Total income from operating activities 506,282 522,539
Expenses
Staff costs 35 263,724 246,343
Other administrative expenses 36 162,043 168,481
Staff costs and other administrative expenses 425,766 414,824
Depreciation and amortisation 37 14,427 14,166
Operating expenses 440,193 428,990
Impairments of financial instruments –12,737 –11,875
Other impairments –679 414
Impairments 38 –13,416 –11,461
Total expenses 426,778 417,529
Operating profit before tax 79,504 105,010
Income tax 39 12,086 22,129
Net profit from continuing operations 67,418 82,881
Net profit from discontinued operations 40 12,897 12,064
Net result 80,315 94,945
Of which attributable to shareholder 74,631 89,508
Of which attributable to non-controlling interests 5,684 5,437
Earnings per share (€) 41 186,58 223.77
Earnings per share from continuing operations (€) 41 154,34 193.61
Proposed dividend per share (€) 149.94 149.08
CONSOLIDATED STATEMENT OF INCOME FOR 2018 (€1,000)
The number beside each item refers to the Notes to the consolidated statement of income.
Consolidated statement of income for 2018 79

2018 2017
Net result (as per statement of income) 80,315 94,945
Other comprehensive income to be reclassified to profit or loss in subsequent periods
Other comprehensive income through revaluation reserve
Revaluation of financial assets at fair value through other comprehensive income –12,881 –
Revaluation of available-for-sale equity instruments – –7,778
Revaluation of available-for-sale debt instruments – 9,719
Realised return on financial assets at fair value through other comprehensive income –3,764 –
Realised return on available-for-sale equity instruments – –911
Realised return on available-for-sale debt instruments – –6,407
Impairments of financial assets at fair value through other comprehensive income –86 –
Income tax effect 3,985 –860
Total other comprehensive income through revaluation reserve 27 –12,746 –6,237
Other comprehensive income from value changes of derivatives (cash flow hedges)
Increase in value of derivatives directly added to equity –3,892 1,410
Income tax effect 208 –352
Total other comprehensive income from value changes of derivatives (cash flow hedges) 27 –3,684 1,057
Other comprehensive income from currency translation differences
Other comprehensive income from currency translation differences –1,499 –655
Income tax effect – –
Total other comprehensive income from currency translation differences 27 –1,499 –655
Total other comprehensive income to be reclassified in subsequent periods to profit or loss –17,929 –5,835
Other comprehensive income not to be reclassified in subsequent periods to profit or loss
Change in fair value attributable to change in credit risk of financial liabilities at fair value through profit or loss
Change in fair value attributable to change in credit risk of financial liabilities at fair value through profit or loss –2,931 –
Income tax effect 733 –
Total change in fair value attributable to change in credit risk of financial liabilities at fair value through profit or loss –2,198 –
Remeasurement of defined benefit plans
Remeasurement of defined benefit plans 385 –580
Income tax effect –91 38
Total remeasurement of defined benefit plans 27 294 –542
Total other comprehensive income not to be reclassified in subsequent periods to profit or loss –1,904 –542
Total other comprehensive income –19,833 –6,377
Total comprehensive income 60,483 88,569
Of which attributable to shareholder 54,798 83,131
Of which attributable to non-controlling interests 5,684 5,437
Total comprehensive income to shareholder
Of which continuing operations 46,919 75,995
Of which discontinued operations 7,880 7,136
54,798 83,131
CONSOLIDATED STATEMENT OF COMPREHENSIVE INCOME FOR 2018 (€1,000)
The number beside each item refers to the Notes to the consolidated statement of financial position.
Consolidated statement of comprehensive income for 2018 80

Share capital Share premium reserve1
Other reserves1
Undistri-butedprofit
Total equity attributable
to share-holder
Equity attributable to
non-controlling
interests
Total equity
At 31 December 2017 40,000 277,674 925,678 89,508 1,332,860 16,264 1,349,124
Impact of adopting IFRS 92 – – –14,382 – –14,382 – –14,382
At 1 January 2018 40,000 277,674 911,296 89,508 1,318,478 16,264 1,334,742
Net result (as per statement of income) – – – 74,631 74,631 5,684 80,315
Total other comprehensive income – – –19,833 – –19,833 – –19,833
Total comprehensive income – – –19,833 74,631 54,798 5,684 60,483
Share plans – – 3,271 – 3,271 – 3,271
To other reserves – – 29,827 –29,827 – – –
Dividends / Capital return – –61,526 – –59,680 –121,206 –895 –122,101
Other changes – – 642 – 642 – 642
Change in non-controlling interests – – – – – –8,840 –8,840
At 31 December 2018 40,000 216,149 925,203 74,631 1,255,982 12,213 1,268,195
CONSOLIDATED STATEMENT OF CHANGES IN EQUITY IN 2018 Before profit appropriation (€1,000)
1 For additional information on the nature and composition of the share premium reserve and other reserves, see Note 27.
2 See page 90.
Consolidated statement of changes in equity in 2018 81
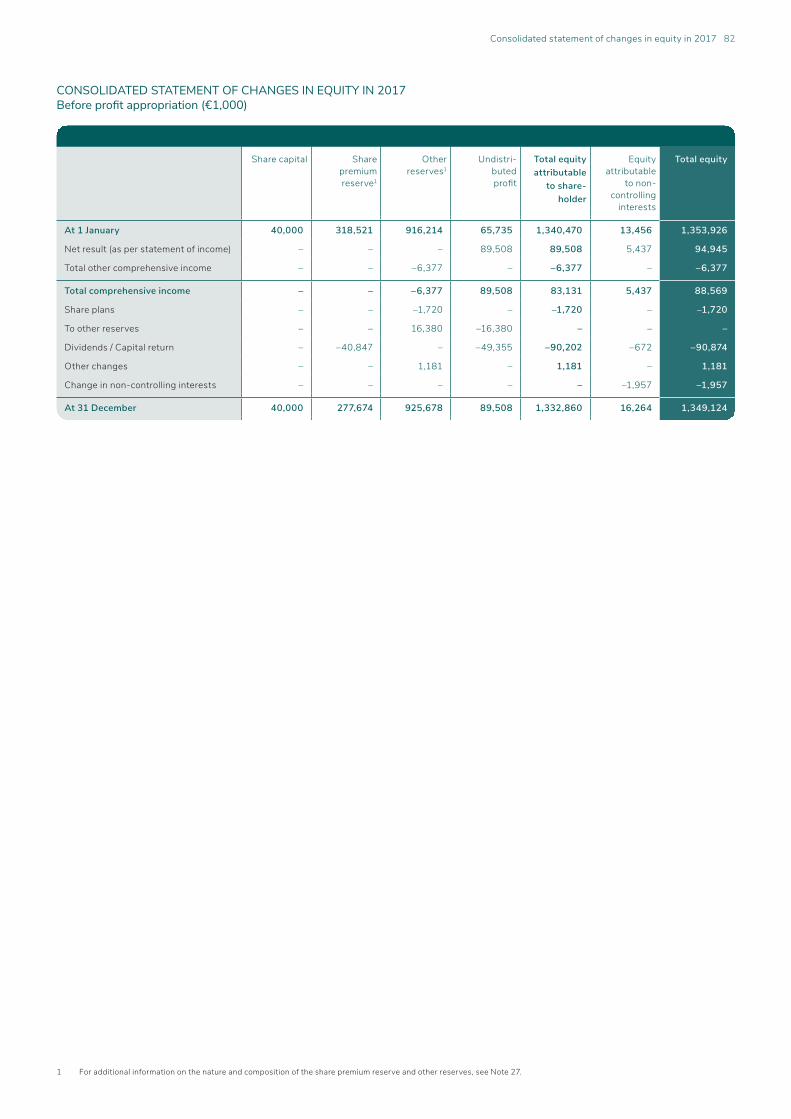
1 For additional information on the nature and composition of the share premium reserve and other reserves, see Note 27.
Share capital Share premium reserve1
Other reserves1
Undistri-butedprofit
Total equity attributable
to share-holder
Equity attributable
to non- controlling
interests
Total equity
At 1 January 40,000 318,521 916,214 65,735 1,340,470 13,456 1,353,926
Net result (as per statement of income) – – – 89,508 89,508 5,437 94,945
Total other comprehensive income – – –6,377 – –6,377 – –6,377
Total comprehensive income – – –6,377 89,508 83,131 5,437 88,569
Share plans – – –1,720 – –1,720 – –1,720
To other reserves – – 16,380 –16,380 – – –
Dividends / Capital return – –40,847 – –49,355 –90,202 –672 –90,874
Other changes – – 1,181 – 1,181 – 1,181
Change in non-controlling interests – – – – – –1,957 –1,957
At 31 December 40,000 277,674 925,678 89,508 1,332,860 16,264 1,349,124
CONSOLIDATED STATEMENT OF CHANGES IN EQUITY IN 2017 Before profit appropriation (€1,000)
Consolidated statement of changes in equity in 2017 82

2018 2017
Cash flow from operating activities
Operating profit before tax 79,504 105,010
Adjustments for
– Depreciation and amortisation 37 16,799 16,024
– Costs of share plans 2,989 4,773
– Results on associates using the equity method –11,759 –12,949
– Valuation results on financial assets at fair value through profit or loss 19,803 2,870
– Valuation results on financial liabilities at fair value through profit or loss –46,177 –7,399
– Valuation results on derivatives –4,818 –19,080
– Impairments 38 –13,416 –11,460
– Changes in provisions 8,458 3,322
Cash flow from operating activities 51,383 81,112
Net movement in operating assets and liabilities
– Financial assets/liabilities from trading activities –25,800 –19,427
– Due from/to banks –33,238 –8,907
– Loans and advances to public and private sectors/Public and private sector liabilities 506,713 72,455
– Derivatives 129,920 3,099
– Withdrawals from restructuring provision and other provisions –2,931 –15,021
– Other assets and liabilities –14,457 –2,554
– Tax assets and liabilities 1,382 –
– Income taxes paid –9,523 –9,358
– Dividends received 3,192 4,602
Total net movement in operating assets and liabilities 555,259 24,889
Net cash flow from operating activities 606,642 106,001
Net cash flow from discontinued operations –6,027 28,856
Cash flow from investing activities
Investments and acquisitions
– Investments in debt instruments –1,302,486 –973,327
– Investments in equity instruments –48,331 –84,990
– Acquisitions (excluding acquired cash and cash equivalents) – –28,700
– Investments in associates using the equity method –9,609 –27,147
– Property and equipment –5,016 –7,291
– Goodwill and other intangible assets –878 –7,318
Divestments, redemptions and sales
– Investments in debt instruments 1,307,076 896,695
– Investments in equity instruments 92,589 25,170
– Investments in associates using the equity method 27,115 40,983
– Property and equipment 4,686 6,671
– Goodwill and other intangible assets 1,873 678
Dividends received 3,473 3,753
Net cash flow from investing activities of continuing operations 70,492 –154,823
Net cash flow from investing activities of discontinued operations 154 –799
CONSOLIDATED STATEMENT OF CASH FLOWS FOR 2018 (€1,000)
The numbers in the statement of cash flows refer to the Notes to the consolidated statement of financial position and the Notes to the consolidated statement of income.
Consolidated statement of cash flows for 2018 83

CONSOLIDATED STATEMENT OF CASH FLOWS FOR 2018 (CONTINUED)(€1,000)
1 Cash and cash equivalents and balances at central banks also includes amounts due from/to banks available on demand.
2018 2017
Cash flow from financing activities
Share plans 282 –5,545
Change in non-controlling interests –8,133 –3,639
Redemption of subordinated loans –113 –113
Receipts on issued debt securities – 500,000
Redemption of issued debt securities –907,256 –187,027
Receipts on financial liabilities at fair value through profit or loss 129,771 275,645
Redemption of financial liabilities at fair value through profit or loss –116,872 –191,048
Dividends paid –122,101 –90,874
Net cash flow from financing activities of continuing operations –1,024,422 297,399
Net cash flow from financing activities of discontinued operations – –
Net change in cash and cash equivalents and balances at central banks –353,161 276,633
Cash and cash equivalents and balances at central banks at 1 January1 1,826,733 1,550,100
Cash and cash equivalents and balances at central banks at 31 December1 1,473,572 1,826,733
Additional disclosure
Cash flows from interest received 310,702 341,695
Cash flows from interest paid 135,195 146,007
Reconciliation of liabilities arising from financing activities in 2018
Subordinated loans
Issued debt securities
Financial liabilities at fair value
through profit or loss
Total
At 1 December 166,802 2,411,671 971,453 3,549,926
Impact of adopting IFRS 9 6,818 – – 6,818
At 1 January 173,620 2,411,671 971,453 3,556,744
Cash flows –113 –907,256 12,899 –894,470
Non-cash changes
– Fair value changes –34 17,089 –43,991 –26,936
At 31 December 173,473 1,521,504 940,361 2,635,338
Reconciliation of liabilities arising from financing activities in 2017
Subordinated loans
Issued debt securities
Financial liabilities at fair value
through profit or loss
Total
At 1 January 167,218 2,116,094 894,256 3,177,568
Cash flows –113 312,973 84,596 397,456
Non-cash changes
– Fair value changes –303 –17,396 –7,399 –25,098
At 31 December 166,802 2,411,671 971,453 3,549,926
The numbers in the statement of cash flows refer to the Notes to the consolidated statement of financial position and the Notes to the consolidated statement of income.
The table below provides a reconciliation of changes in liabilities arising from financing activities.
Consolidated statement of cash flows for 2018 84

GeneralVan Lanschot NV is an independent wealth manager specialising in the preservation and creation of wealth for its clients and for society. Van Lanschot NV (formerly F. van Lanschot Bankiers NV) (“Van Lanschot”) is a 100% subsidiary of Van Lanschot Kempen NV. The company has its registered office at Hooge Steenweg 29, 5211 JN ’s-Hertogenbosch, the Netherlands. Van Lanschot NV is a public limited company incorporated under Dutch law and registered under number 16038212 at the Chamber of Commerce.
The consolidated financial statements of Van Lanschot NV at 31 December 2018 were prepared by the Statutory Board on 13 March 2019 and will be submitted to the general meeting for adoption. At the request of the general meeting, the financial statements may – subject to the consent of the Supervisory Board – be amended by the Statutory Board after publication. The amended financial statements will be submitted to the general meeting for adoption. Basis of preparationThe consolidated financial statements of Van Lanschot NV and its subsidiaries (hereinafter Van Lanschot Kempen) have been prepared in accordance with International Financial Reporting Standards (IFRS) as adopted by the European Union (EU), and with Part 9, Book 2 of the Dutch Civil Code. The assets and liabilities disclosed in the consolidated financial statements are measured in accordance with the accounting principles as set out below. ContinuityThe Statutory Board has examined the ability of Van Lanschot Kempen to continue its operations and concluded that we are able to do so for the foreseeable future. Moreover, the Board is not aware of any material uncertainties that cast significant doubt on our ability to continue as a going concern. The consolidated financial statements have been prepared on this basis. Functional and reporting currencyThe consolidated financial statements are denominated in euros, the functional and reporting currency of Van Lanschot Kempen. Unless stated otherwise, all amounts are given in thousands of euros. The totals may not always match the sum of the individual values due to rounding.
Changes in presentation In the first half of 2018, AIO II BV (Medsen) was classified as held for sale. In December 2018, an agreement was reached with funds under management of Bencis about the sale of the stake in AIO II BV.
The assets and liabilities of AIO II BV are recognised under Assets and liabilities classified as held for sale i.e. the disposal group; see Note 15, Assets classified as held for sale, and Note 24, Liabilities classified as held for sale. The result of AIO II BV is included under Discontinued operations; see Note 40, Discontinued operations. The cash flow statement and the income statement for 2017 have been adjusted accordingly.
In the second half of 2018, Van Lanschot Chabot Mandema & Partners was classified as held for sale. The assets and liabilities of Van Lanschot Chabot Mandema & Partners are recognised under Assets and liabilities classified as held for sale.
The presentation of Contingent liabilities now includes the credit card guarantees, due to a revised interpretation of the revocability of these facilities. The comparative figures have been adjusted for an amount of €56.6 million.
Changes in accounting policiesThe accounting policies adopted in the preparation of our annual consolidated financial statements for the year ended 31 December 2018 remain unchanged, except for the adoption of new standards and interpretations effective from 1 January 2018.
Changes in published IFRS standards and interpretationsThe IFRS standards listed below became effective from 1 January 2018 and have been applied to our financial statements for 2018. Unless stated otherwise, application of these standards had no impact on Van Lanschot Kempen’s equity or result. Application of the amended standards generally entails amendment or expansion of notes.
IFRIC Interpretation 22 Foreign Currency Transactions and Advance ConsiderationThe interpretation clarifies that in determining the spot exchange rate to use on initial recognition of the related asset, expense or income (or part of it) on the derecognition of a non-monetary asset or non-monetary liability relating to advance consideration, the date of the transaction is the date on which an entity initially recognises the non-monetary asset or non-monetary liability arising from the advance consideration. If there are multiple payments or receipts in advance, then the entity must determine a date of the transaction for each payment or receipt of advance consideration. The impact is expected to be immaterial due to the limited volume of foreign currency transactions involving advance consideration.
Annual Improvements to 2014-2016 CycleChanges to standards concern:
IAS 28 Investments in Associates and Joint VenturesThe amendments clarify that measuring investments at fair value through profit or loss is an investment-by-investment choice.
SUMMARY OF SIGNIFICANT ACCOUNTING PRINCIPLES
Summary of significant accounting principles 85

IAS 1 Presentation of Interest Revenue Calculated Using the Effective Interest MethodWith the adoption of IFRS 9, a consequential amendment to paragraph 82(a) of IAS 1 is introduced. Under this amendment, interest revenue calculated using the effective interest method for financial instruments measured at amortised costs must be separately presented as a component of revenue on the face of the balance sheet. As a result, we have made changes in our consolidated statement of income. The line item Interest income is split between Interest income calculated using the effective interest method and Other interest income. Similar presentation has been applied to interest expense. Other interest income and other interest expense includes the interest revenue on all other financial instruments. The comparative figures have been reclassified accordingly.
IFRS 2 Classification and Measurement of Share-based Payment TransactionsThe amendments to IFRS 2 focus on the effects of vesting conditions on the measurement of a cash-settled share-based payment transaction, the classification of a share-based payment transaction with net settlement features for withholding tax obligations, and accounting for when the classification of a share-based payment transaction changes from cash-settled to equity-settled.
IFRS 15 Revenue from Contracts with CustomersIFRS 15 replaces all previous revenue requirements in IFRS. The standard outlines the principles an entity must apply to measure and recognise revenue. The core principle is that an entity will recognise revenue at an amount that reflects the consideration to which the entity expects to be entitled in exchange for transferring goods or services to a customer.
IFRS 9 Financial InstrumentsVan Lanschot Kempen adopted IFRS 9 as issued by the IASB in July 2014 with an effective date of 1 January 2018. This adoption resulted in changes in accounting policies and adjustments to the amounts previously recognised in the financial statements. We had not early adopted any of IFRS 9 prior to 1 January 2018. Comparative figures in our financial statements are not restated as permitted by the transitional provisions of IFRS 9. Any adjustments to the carrying amounts of financial assets and financial liabilities at 1 January 2018, the transition date, are recognised in the opening balance of equity under the line item Other reserves. We have prepared and present transition disclosures at the end of this section, and have provided an opening consolidated statement of the financial position as at 1 January 2018.
Recognition and derecognition of financial assets and liabilitiesVan Lanschot Kempen recognises a financial asset or financial liability in the statement of financial position when it becomes party to a contractual provision of the instrument. At origination, the financial asset or financial liability is recognised at fair value plus or minus transaction costs directly attributable to the acquisition or issue. After initial recognition, we measure financial assets at amortised cost and fair value through other comprehensive income, or at fair value through profit or loss. Financial liabilities are measured at amortised cost or fair value through profit or loss. Interest revenues and expenses on financial assets and liabilities are calculated using the effective interest method. The effective interest method is calculated for all financial assets and liabilities except for
financial assets that should be classified as impaired assets and financial assets measured at fair value through profit or loss. For impaired assets, we calculate the credit-impaired effective interest rate, which is based on the amortised cost of the financial asset instead of the gross carrying amount, and incorporates the impact of expected credit losses in estimated future cash flows.
A financial asset is derecognised when the contractual rights to the cash flows from the financial asset expire or when the rights to receive cash flows are transferred. When the cash flows of the financial asset are transferred we evaluate the extent to which we will retain the risks and rewards of ownership of the financial asset. A financial asset is only derecognised when substantially all of the risks and rewards of the ownership of the financial asset are transferred.
A financial liability is derecognised from the statement of financial position when the obligation specified in the contract is discharged, cancelled or expired. A substantial modification or exchange at substantially different terms results in a derecognition of the financial liability and a recognition of a new financial liability. The difference between the carrying amount of the modified or exchanged financial liability and the consideration paid is recognised in profit or loss.
ModificationsIf the contractual cash flows on a financial asset have been renegotiated or otherwise modified and the renegotiation or modification does not result in the derecognition of the financial asset, we recalculate the carrying amount of the financial asset and recognise a modification gain or loss. We apply IFRS 9 modification accounting as follows:– Changes in the prepayment terms of a loan at the request
of a client;– A switch from a fixed to a variable interest rate during a
pre-agreed interest rate period;– A switch to a current market interest rate with
compensation paid; – Interest rate averaging, which, although qualifying as
modification, does not lead to a modification gain or loss; – Excercising embedded options that are not separate but
are part of the financial asset and are included in the contract’s fair value. Exercising these options does not result in derecognition or in a modification gain or loss.
The following changes at the request of a client are significant changes to the agreement and do not qualify as modification: – Switching to a different redemption period;– Postponing the final repayment.These changes lead to the financial asset being derecognised and a new financial asset being recognised.
Classification and measurementWe have made two assessments to determine the classification and measurement of debt instruments under IFRS 9: a business model assessment and an assessment of the contractual cash flows. The classification and measurement categories for financial assets under IFRS 9 are: – Fair value through other comprehensive income (FVOCI);– Amortised cost (AC);– Fair value through profit or loss (FVPL).
Summary of significant accounting principles 86

Business model assessmentThe business model assessment represents an assessment of how the business is managed and how it is seen from a strategic point of view. The frequency and volume of sales are also taken into account. This assessment results in a classification:– Hold to collect (HTC): where a financial asset is held within
a business model whose objective is to hold financial assets in order to collect contractual cash flows; or
– Hold to collect and sell (HTCS): where the financial asset is held within a business model whose objective is achieved by both collecting contractual cash flows and selling financial assets; or
– Other business model.
The business model assessment is carried out at portfolio level, whereas the contractual cash flow assessment is done for each individual financial asset. We only reclassify debt instruments if the business model for managing those assets changes.
Our business models are based on the existing management structure and refined based on analysis of how businesses are evaluated and reported, how their specific business risks are managed and on historic and expected future sales.
A debt instrument that is held within the hold to collect business model and meets the SPPI test is measured at amortised cost unless the asset is designated at fair value through profit or loss. Our Asset & Liability Committee (ALCO) sets restrictions for buying and selling in the hold to collect portfolio. Sales are permitted when these are due to an increase in credit risk, take place close to the maturity date, are significant in value (both on individual and aggregated level) or are infrequent.
A debt instrument that is held within the hold to collect and sell business model and meets the solely payments of principal and interest (SPPI) test is measured at fair value, with fair value adjustments recognised in other comprehensive income unless the asset is designated at fair value through profit or loss. The financial assets in the hold to collect and sell portfolio are governed by ALCO and sales need to be approved by ALCO. Sales as a result of managing everyday liquidity needs, maintaining a particular interest yield profile on the secondary market, or to match the duration and sales required by regulators, are consistent with the objective of the hold to collect and sell portfolio.
All other debt instruments are measured at fair value through profit or loss. No restrictions are set for sales within the fair value through profit or loss portfolio. These debt instruments are governed by ALCO and sales need to be approved by ALCO.
Assessment of the contractual cash flows To assess the contractual cash flow characteristics of financial instruments, we have designed a SPPI test. To pass the SPPI test, the contractual terms of the debt instruments need to result in payments that are solely principal and interest. A key element of the SPPI criteria is that the contractual cash flows of the financial instrument should be consistent with a basic lending arrangement. In a basic lending arrangement, the contractual cash flows may include compensation for the time value of money, credit risk, liquidity risk, administrative costs and a profit margin. When the cash flows of a financial instrument do not give rise to solely repayment of principal
and payment of interest, the SPPI test is failed and the financial instrument is mandatorily classified and measured at fair value through profit or loss.
New classifications under IFRS 9This section describes the outcome of our business model assessment and SPPI test. In general: – Debt instruments from the IAS 39 HTM and L&R
categories have been reclassified to the AC category;– Debt instruments from the IAS 39 AFS category have
been reclassified to the FVOCI category.
Debt instruments previously classified as available for sale but which fail the SPPI testWe hold cumulative preference shares that failed to meet the SPPI test. These instruments have no reasonable penalty to compensate the missing future cash flows in the event of prepayments. As a result, these instruments, which amounted to €10.9 million, have been reclassified (mandatorily) to FVPL from the date of initial application of IFRS 9.
Equity instrumentsThe equity instruments previously in the IAS 39 AFS category, amounting to €11.1 million, have been reclassified to the FVPL category from the date of initial application of IFRS 9. The revaluation reserve for these equity instruments has been reclassified to retained earnings. We have not used the option to make an irrevocable election on initial recognition to measure equity instruments at fair value with results through other comprehensive income.
Financial liabilitiesThe classification and measurement of financial liabilities remain for the most part unchanged under IFRS 9. Changes in the fair value of financial liabilities at fair value through profit or loss due to changes in Van Lanschot Kempen’s own credit risk are recognised in other comprehensive income. The cumulative change in the fair value of financial liabilities through profit or loss which can be allocated to changes in own credit risk – amounting to €13.3 million at 31 December 2017 – has been reclassified, for an amount of €10.0 million, from retained earnings to the own credit risk reserve in other comprehensive income. In addition, a negative tax asset and a deferred tax asset have been recognised for an amount of €3.3 million.
Impairments We recognise a loss allowance for expected credit losses (ECL) on financial assets measured at amortised cost or fair value through profit or loss, as well as for financial guarantees and loan commitments. When there is no significant deterioration in credit risk since initial recognition, ECL is recognised based on a 12-month expected credit loss (Stage 1). When a significant increase in credit risk has occurred, ECL is recognised based on a lifetime expected credit loss (Stage 2). For impaired loans (Stage 3), a lifetime ECL is recognised.
To determine the deterioration in credit risk of a financial instrument since initial recognition, we compare the current risk of default at the reporting date with the risk of default on initial recognition. In general and without taking into account the passage of time, to be called “significant”, a larger relative increase in the risk of default will be required for an asset with a higher risk of default on initial recognition than for an asset with a low risk of default on initial recognition.
Summary of significant accounting principles 87

Furthermore, we evaluate individually whether objective evidence of impairment exists for financial instruments that are individually significant. We collectively assess financial instruments that are not significant and financial instruments which have no objective evidence of impairment available. This assessment includes quantitative and qualitative information based on our historical experience, credit risk assessment, days past due and forward-looking information.
Expected loss measurementWe measure expected credit losses by using a sophisticated approach and an alternative approach. In both these approaches, ECL reflects an unbiased probability-weighted amount that is determined by evaluating a range of possible outcomes, the time value of money, and reasonable and verifiable information that is available without undue cost or effort at the reporting date about past events, current conditions and forecasts of future economic conditions.
Both approaches calculate a 12-month and a lifetime ECL for the exposures of all three stages. After the risk stage determination in the stage calculation, the relevant ECL is assigned:– 12-month ECL for Stage 1; – Lifetime ECL for Stage 2 and Stage 3. For more information, see the Risk management section, under 2.8 Impairments.
Hedge accountingWe have opted to continue to apply the hedge accounting guidance of IAS 39 under the EU carve-out, as explicitly permitted by IFRS 9. The hedge accounting disclosures as required by IFRS are included in Note 4, Derivatives.
Transition disclosuresThe tables below provide information on the impact of adopting IFRS 9 as of 1 January 2018.
Summary of significant accounting principles 88
IAS 39 measurement IFRS 9 measurement
Category Carrying amount
Reclassi- fications
Remeasure-ments
Category Carrying amount
Assets
Cash and cash equivalents and balances at central banks AC 1,832,751 – –0 AC 1,832,751
Financial assets held for trading – equity instruments FVPL 35,673 – – FVPL 35,673
Financial assets held for trading – debt instruments FVPL 2,561 – – FVPL 2,561
Due from banks AC 186,459 – –0 AC 186,459
Derivatives FVPL 322,258 – – FVPL 322,258
Financial assets at fair value through profit or loss FVPL 394,898 22,001 – FVPL 416,899
Financial assets at fair value through other comprehensive income n/a – 1,716,354 – FVOCI 1,716,354
Available-for-sale equity instruments FVOCI 11,151 –11,151 – n/a –
Available-for-sale debt instruments FVOCI 1,727,204 –1,727,204 – n/a –
Held-to-maturity investments AC 521,349 –521,349 – n/a –
Loans and advances to the public and private sectors AC 9,103,327 – –11,121 AC 9,092,207
Other financial assets at amortised cost n/a – 521,349 –28 AC 521,321
Investments in associates using the equity method 70,390 – – 70,390
Property and equipment 63,468 – – 63,468
Goodwill and other intangible assets 218,389 – – 218,389
Tax assets 26,719 – 4,950 31,669
Other assets 142,277 – – 142,277
Total assets 14,658,875 – –6,199 14,652,676
The following table shows the changes in classifications of financial assets and liabilities.

Summary of significant accounting principles 89
IAS 39 measurement IFRS 9 measurement
Category Carrying amount
Reclassi- fications
Remeasure-ments
Category Carrying amount
Equity and liabilities
Financial liabilities from trading activities FVPL 1,899 – – FVPL 1,899
Due to banks AC 101,645 – – AC 101,645
Public and private sector liabilities AC 9,145,119 – – AC 9,145,119
Derivatives FVPL 318,417 – – FVPL 318,417
Financial liabilities at fair value through profit or loss FVPL 971,453 – – FVPL 971,453
Issued debt securities AC 2,411,671 – – AC 2,411,671
Provisions 23,085 – 1,200 24,284
Tax liabilities 12,841 – 166 13,007
Other liabilities 156,820 – – 156,820
Subordinated loans AC 166,802 – 6,818 AC 173,620
Total liabilities 13,309,752 8,183 13,317,935
Issued share capital 40,000 – – 40,000
Share premium reserve 277,674 – – 277,674
Other reserves 925,678 – –14,382 911,296
Undistributed profit attributable to shareholder 89,508 – – 89,508
Equity attributable to shareholder 1,332,860 – –14,382 1,318,478
Non-controlling interests 10,827 – – 10,827
Undistributed profit attributable to non-controlling interests 5,437 – – 5,437
Undistributed profit of previous year attributable to non-controlling interests – – – –
Equity attributable to non-controlling interests 16,264 – – 16,264
Total equity and liabilities 14,658,875 – –6,199 14,652,676
The following table shows the changes in classifications of financial assets and liabilities (continued).

Revaluation reserve available-for-sale investments
Closing balance under IAS 39 (31 December 2017) 14,013
Reclassification of equity instruments from available-for-sale to retained earnings –4,828
Reclassification of debt instruments from available-for-sale to financial assets at fair
value through other comprehensive income –9,185
Opening balance under IFRS 9 (1 January 2018) –
Revaluation reserve financial assets at fair value through other comprehensive income
Closing balance under IAS 39 (31 December 2017) –
Reclassification of debt instruments from available-for-sale to financial
assets at fair value through other comprehensive income 9,185
Recognition of expected credit losses under IFRS 9 for financial assets at fair value
through other comprehensive income 663
Deferred tax effect –166
Opening balance under IFRS 9 (1 January 2018) 9,682
Own credit risk reserve
Closing balance under IAS 39 (31 December 2017) –
Impact of recognising credit risk on financial liabilities at fair value
through profit or loss in own credit risk reserve –13,288
Deferred tax effect 3,322
Opening balance under IFRS 9 (1 January 2018) –9,966
Retained earnings
Closing balance under IAS 39 (31 December 2017) 937,773
Impact of recognising credit risk on financial liabilities at fair value
through profit or loss in own credit risk reserve 13,288
Tax effect relating to own credit risk reserve –3,322
Reclassification of equity instruments from available-for-sale to retained earnings 4,828
Recognition of expected credit losses under IFRS 9 –13,012
Tax effect relating to expected credit losses under IFRS 9 3,247
Recognition of modification loss on certificates of indebtedness –6,818
Tax effect relating to modification loss on certificates of indebtedness 1,704
Opening balance under IFRS 9 (1 January 2018) 937,687
Total change in equity due to adopting IFRS 9 –14,382
Measurement category IAS 39 loan loss allowance 31 December 2017
Remeasurements IFRS 9 loan loss allowance 1 January 2018
Cash and cash equivalents and balances at central banks – 0 0
Due from banks – 0 0
Financial assets at fair value through other comprehensive income – 663 663
Other financial assets at amortised cost – 28 28
Loans and advances to the public and private sectors 120,400 11,121 131,520
Provision for financial guarantees and loan commitments – 1,200 1,200
Total 120,400 13,012 133,412
Summary of significant accounting principles 90
The following table shows the impact on equity under other reserves of adopting IFRS 9.
The table below provides a reconciliation of the impairment allowances in accordance with IAS 39 and the provisions in accordance with IAS 37 to the opening loss allowances determined in accordance with IFRS 9.

Summary of significant accounting principles 91
The loss allowance for financial assets at fair value through other comprehensive income is recognised in other comprehensive income and does not reduce the carrying amount of the financial asset.
Published IFRS standards and interpretations not yet effectiveIn addition to the IFRS standards and interpretations referred to above, a number of IFRS standards and interpretations are new or have been amended, and apply to financial statements for periods beginning on or after 1 January 2019. We have not applied the following standards in the 2018 financial statements. Unless stated otherwise, standards are applied as soon as they become effective and have been endorsed by the EU.
IFRS 16 LeasesIFRS 16 Leases was issued in January 2016 and replaces IAS 17 Leases and IFRIC 4 Determining Whether an Arrangement Contains a Lease. IFRS 16 sets out the principles for recognition, measurement, presentation and disclosure of leases and will result in almost all leases being recognised on the balance sheet, similar to the accounting for finance leases under IAS 17. We will elect to use the exemptions proposed by the standard on lease contracts for which the lease terms end within 12 months as of the date of initial application, and lease contracts for which the underlying asset is of low value. Van Lanschot Kempen has leases of certain office equipment (i.e., printing and photocopying machines) that are considered of low value. We have performed a detailed impact assessment of IFRS 16 and concluded that this standard will have no material impact on the result of the group. We expect application of this standard to increase assets and liabilities within a range of €60-€70 million.
The standard is effective for annual periods beginning on or after 1 January 2019 and must be applied retrospectively; We will apply the standard from its mandatory adoption date of 1 January 2019 and use the modified retrospective approach.
IFRIC 23 Uncertainty over Income Tax TreatmentsThe interpretation clarifies how the recognition and measurement requirements of IAS 12 Income Taxes are applied for income tax treatments that have yet to be accepted by the tax authorities. The interpretation is effective for annual periods beginning on or after 1 January 2019 and must be applied retrospectively; early adoption is permitted. The interpretation is not yet endorsed by the EU. The standard has no material impact on group results.
Annual Improvements to 2015-2017 CycleChanges to standards concern:
IFRS 3 Business CombinationsThe amendments clarify that, when an entity obtains control of a business that is a joint operation, it applies the requirements for a business combination achieved in stages, including remeasuring previously held interests in the assets and liabilities of the joint operation at fair value. These amendments are effective for annual reporting periods beginning on or after 1 January 2019. Earlier application is permitted.
IAS 12 Income TaxesThe amendments clarify that the income tax consequences of dividends are linked more directly to past transactions or events that generated distributable profits than to distributions to owners. Therefore, an entity recognises the income tax consequences of dividends in profit or loss, other comprehensive income or equity according to where the entity originally recognised those past transactions or events. These amendments are effective for annual reporting periods beginning on or after 1 January 2019. Earlier application is permitted. When an entity first applies these amendments, it applies them to the income tax consequences of dividends recognised on or after the beginning of the earliest comparative period.
Significant accounting judgements and estimatesWe have identified those accounting policies which involve the most complex or subjective decisions or assessments. In the process of applying these accounting policies, we use estimates, assumptions and judgements which can have a significant impact on the amounts recognised in the financial statements. These estimates and assumptions are based on the most recent information available, and the actual amounts may differ in the future. The principal estimates and assumptions relate to impairments on financial instruments measured at amortised cost and fair value through other comprehensive income, investments in associates using the equity method, property and equipment, goodwill, intangible assets, and assets acquired through foreclosures.
Such estimates and assumptions also relate to the determination of the fair value of financial instruments, deferred tax positions, share-based payments, employee benefits and provisions.
Accounting judgementsWe have applied critical judgement to determine significant influence in companies in which we hold minority interests smaller than 20%. In our opinion, the influence on the financial and operating policy decisions that we have in some minority interests is more in line with the expected influence in an associate. Examples of this influence are veto rights in decisions on issuance of new shares and decisions on amendments of the statutes. Therefore we classify these minority interests articles of association and apply equity accounting instead of IFRS 9 fair value accounting. For furher information, see the disclosure on Investments in associates using the equity method.
Furthermore, we have applied critical judgement in determining the assets and liabilities held for sale. In cases where we have decided that we will recover the carrying amount through a sale of these assets or liabilities rather than through continuing use and the sale is highly probable within twelve months we will classify these assets as held for sale. We measure these assets or liabilities at the lower of its carrying amount and fair value less costs to sell. For further information on specific judgements made, see the note on Assets classified as held for sale.

Summary of significant accounting principles 92
Significant accounting estimates
Determination of fair value of financial instrumentsThe fair value of financial instruments, in so far as available and provided there is an active market, is based on stock market prices at the reporting date. For financial assets, the bid price is used; for financial liabilities, the selling price.
The fair value of financial instruments not traded in an active market is determined on the basis of cash flow and of option and other valuation models. These models are based on the market circumstances prevailing at the reporting date. Estimates mainly relate to future cash flows and discount rates. For more details, see the Risk management section, under 13, Fair value.
Impairments of financial assetsWe recognise a loss allowance for expected credit losses (ECL) on financial assets measured at amortised cost or fair value through profit or loss, as well as for financial guarantees and loan commitments. When there has been no significant deterioration in credit risk since initial recognition, ECL is recognised based on a 12-month expected credit loss (Stage 1). When a significant increase in credit risk has occurred, ECL is recognised based on a lifetime expected credit loss (Stage 2). For impaired loans (Stage 3), a lifetime ECL is recognised. The impairments of financial assets are determined as a critical estimate. For more information on deterioration in credit risk, see the Risk management section, under 2.8 Impairments.
Impairments of goodwillTo measure the recoverable amounts, we calculate the value in use for each cash-generating unit (CGU). This calculation reflects an estimate of future cash flows, multiple scenario analyses and discount rates. Future cash flow estimates are based on our strategic plans and different types of investigation into possible trends. Events and factors that could have a significant impact on these estimates include market expectations, effects of mergers and acquisitions, competitive conditions, client behaviour and changes in the client base, cost structure, trends in interest rates and risks, and other circumstances specific to the industry and sector. The impairments of financial assets are determined as a critical estimate. For more information on the discount rates used, see Note 13, Goodwill.
Other accounting estimates
Impairments of non-financial assetsThe recoverable amount of non-financial assets is the higher of the fair value of an asset less costs to sell and its value in use. This fair value less costs to sell is the price that would be received on sale of an asset or paid on transfer of a liability in an orderly transaction between market participants at the valuation date. To determine whether assets are impaired, the individual assets are allocated to the lowest level at which cash flows can be identified (cash-generating units). Non-financial assets that have been subject to impairment, other than goodwill paid, are reviewed annually to determine whether the impairment can be reversed. Non-financial assets, other than goodwill paid, are tested for impairment annually by assessing whether there are any indications that these assets are impaired.
Deferred tax assetsDeferred tax assets are recognised only if it is probable that taxable profits will be realised in the near future against which these temporary differences can be offset. Estimates are used when determining future taxable profits, since these are subject to uncertainty.
AcquisitionsIn the case of acquisitions, it is necessary to determine the fair value of the acquired assets (including any intangible assets and goodwill acquired), as well as of liabilities and obligations not recognised in the statement of financial position. Estimates are used for this, particularly for those items which are not traded on an active market.
Share-based paymentsThe fair value is determined based on the volume-weighted day price for depositary receipts for Class A shares of Van Lanschot Kempen NV on the second trading day after release of Van Lanschot Kempen’s NV annual figures.
Actuarial assumptions of provisionsThe pension liabilities are determined using actuarial calculations. These calculations make assumptions regarding elements such as the discount rate, future trends in salaries and returns on investments. These assumptions are subject to uncertainty. See Note 22, Provisions.

BASIS OF CONSOLIDATION
Basis of consolidation 93
Subsidiaries The consolidated financial statements of Van Lanschot Kempen comprise the financial statements of Van Lanschot and its subsidiaries. These have been prepared at 31 December 2018 using consistent accounting policies and their financial year is concurrent with the calendar year.
Subsidiaries (including the consolidated structured entities) are associates in which Van Lanschot Kempen exercises decisive control. Van Lanschot Kempen has decisive control over an entity when it has power over that entity and is exposed to or has rights to variable income from its involvement in the entity and is able to use its power over the entity to influence the entity’s income. The assessment of control is based on the actual relationship between Van Lanschot Kempen and the entity. Factors taken into account include existing and potential voting rights. A right is a material right if its holder is able to exercise that right in practice.
Van Lanschot Kempen has power over an entity if its existing and potential voting rights amount to more than 50%. If these rights amount to less than 50%, Van Lanschot Kempen determines whether it has power over the entity pursuant to contractual agreements. In making this assessment, a distinction is made between substantive and protective rights. Substantive rights are rights which enable the decision-making power of an enterprise to be influenced directly and which give Van Lanschot Kempen decisive control over an entity. Examples include the right to appoint and dismiss members of the board of management, and to set the level of their remuneration. Protective rights are rights which protect the interests of an entity in another entity, but which do not directly confer decision-making powers. Protective rights do not give Van Lanschot Kempen decisive control over an entity. When acquiring non-controlling interests, Van Lanschot Kempen in principle includes only protective rights in the contractual agreement. These are rights of approval which enable Van Lanschot Kempen to protect its minority position without acquiring decision-making power. Examples of protective rights are rights of approval in respect of the issue of shares and the effecting of significant acquisitions.
Intra-group transactions are eliminated in the consolidation process. Subsidiaries are consolidated from the date of incorporation or acquisition, being the date on which Van Lanschot Kempen acquires control, and are consolidated until the date that such control ceases.
We consolidate interests in investment funds if we have power over the investment fund and are exposed to or have rights to variable income stemming from our involvement and are able to use our power over the investment fund to influence the variable income. The assessment of control is based on the actual relationship between Van Lanschot Kempen and the investment fund. Van Lanschot Kempen takes into account its interest for its own account and its own role, or that of one of its group companies, as fund manager.
In the case of subsidiaries not fully controlled by Van Lanschot Kempen, the non-controlling interest in equity is presented separately in the consolidated statement of financial position as a component of total equity. The profit or loss for the reporting period that can be attributed to the non-controlling interest is disclosed separately.
AcquisitionsAcquisitions are recognised using the acquisition method. Accordingly, the cost of an acquisition is allocated to the fair value of the acquired assets (inclusive of any intangible assets not previously disclosed in the statement of financial position), liabilities and obligations not disclosed in the statement of financial position.
Goodwill, being the difference between the cost of the acquisition (including assumed debts) and our interest in the fair value of acquired assets, liabilities and obligations not disclosed in the statement of financial position at the acquisition date, is capitalised as an intangible asset. If this difference is negative (negative goodwill), it is taken directly to the statement of income.
A non-controlling interest in the company acquired is recognised at the fair value prevailing on the acquisition date or at the proportionate share in the identifiable assets and liabilities of the company acquired.
Results of companies acquired are disclosed in the statement of income from the date at which control is obtained.
Adjustments to the fair value of acquired assets and liabilities at the acquisition date which are identified within 12 months of the acquisition may lead to adjustment of goodwill. Adjustments identified after expiry of one year are disclosed in the statement of income.
On disposal of group companies, the difference between the sale proceeds and the acquisition cost (including goodwill) is included in the statement of income together with any unrealised gain or loss.
Goodwill is not amortised. For more information on its valuation, see Note 13, Goodwill and other intangible assets.

SUMMARY OF SIGNIFICANT ACCOUNTING POLICIES
Foreign currencies Functional currencyItems in the statement of financial position pertaining to each group company are stated in the currency of the economic environment in which the entity operates (i.e. the functional currency).
Group companiesThe assets, liabilities, income and expenses of group companies that use a functional currency other than the reporting currency are translated as follows:– Assets and liabilities are translated using the closing
exchange rate at the reporting date;– Income and expenses are translated using the rate
prevailing on the transaction date, which is approximately equal to the average exchange rate;
– Remaining exchange-related gains or losses are recognised as a separate component of equity.
Upon consolidation, exchange-related gains or losses arising from monetary items forming part of a net investment in foreign divisions are recognised in equity. Exchange-related gains or losses on borrowings and other items designated as hedging instruments for such investments are also recognised in equity.
Transactions and line itemsOn initial recognition, transactions in foreign currencies are translated into the functional currency at the exchange rates prevailing on the transaction date. Translation differences arising on the settlement of such transactions or on the translation of monetary assets and liabilities denominated in foreign currencies are recognised in profit or loss, except where they are recognised in equity as qualifying cash flow hedges or qualifying net investment hedges in foreign divisions.
In general, translation differences in the statement of income are included in the result on financial transactions. Translation differences on non-monetary items measured at fair value through profit or loss are reported as part of the fair value gain or loss. Non-monetary items are translated into the reporting currency at the same time as the determination of their fair value. By retranslation on reporting date, translation differences on non-monetary items measured at fair value through equity are included in the revaluation reserve in equity.
Non-monetary items not measured at fair value are translated at the exchange rate prevailing on the original transaction date. Translation differences relating to the sale of available-for-sale investments are treated as an inherent part of the realised/unrealised gains and losses and recognised under Income from securities and associates.
Recognition of financial assets in the statement of financial positionPurchases of financial assets designated at fair value through profit or loss whose value is subject to change, or financial assets at fair value through other comprehensive income, or other financial assets at amortised costs, which are settled according to standard market conventions, are recognised on the transaction date, i.e. the date on which we undertake to purchase or sell the asset concerned. Loans and advances are recognised on the settlement date, i.e. the date on which we receive or transfer the asset.
Derecognition of financial assets and liabilities in the statement of financial positionFinancial assets are derecognised when:– Our rights to the cash flows from the asset expire; or– We have retained the right to receive the cash flows
from an asset, but have an obligation to pay these in full to a third party under a special agreement; or
– We have transferred our rights to the cash flows from the asset and have transferred substantially all the risks and rewards; or
– We have not transferred substantially all the risks and rewards but have transferred control over the asset.
If we have transferred our rights to the cash flows from an asset, but have not transferred substantially all the risks and rewards of the asset and have not transferred control, the asset is recognised as long as we have continuing involvement in the asset.
A financial liability is derecognised as soon as the obligation under the liability is discharged, cancelled or expired.
Repo transactions and reverse repo transactionsSecurities sold subject to repurchase agreements (repos) continue to be recognised in the statement of financial position. The related liability is included under the relevant line item (principally Due to banks).
Securities purchased subject to resale agreements (reverse repos) are recognised under the line item Due from banks or under Loans and advances to the public and private sectors. The difference between the sale price and the purchase price is recognised in the statement of income as interest during the term of the agreement.
SecuritisationWe have placed parts of our loan portfolio in special purpose entities (SPEs). If we have effective control over an SPE, it is consolidated. We have control over an entity when we have power over that entity and are exposed to or have rights to variable income from our involvement in the entity and are able to use our power over the entity to influence the entity’s income.
The accounting principles followed by Van Lanschot Kempen are applied when consolidating SPEs.
Summary of significant accounting policies 94

Transfers of financial assetsAll or a part of a financial asset is transferred if:– The contractual rights to receive the cash flows from
that financial asset are transferred; or– The contractual rights to receive the cash flows from
that financial asset are retained, but a contractual obligation is assumed to pay the cash flows to one or more recipients under an arrangement.
For more details, see “Disclosure of interest in other entities”.
We have no other assets meeting the criteria for transfers of financial assets.
DerivativesA derivative is initially recognised at fair value on the effective date of the contract. After initial recognition, the derivative is subsequently remeasured at fair value and movements in value are taken to the statement of income under Result on financial transactions. Fair values are based on stock exchange prices, cash flow models, and option and other valuation models.
Hedge accountingWe use derivatives, such as interest rate swaps, to hedge our exposure to risks. The carrying amount of assets and liabilities which are hedged through fair value hedging and which would otherwise be recognised at cost is adjusted for movements in the fair value that can be attributed to the hedged risks. Any gains or losses arising from changes in the fair value of derivatives not relating to the hedged risks are taken directly to the statement of income.
At the inception of a hedge transaction, we formally designate and document the hedge relationship and the financial risk management objective when entering into the hedge transaction. The documentation includes identification of the hedging instrument, the hedged item or transaction, the nature of the risk being hedged and how we will assess the hedging instrument’s effectiveness in offsetting the exposure to risks.
Such hedges are considered to be effective if we may expect, both upon inception and during the term of the hedge, that changes in the fair value or cash flows of the hedged item will be almost fully offset by changes in the fair value or cash flows of the hedging instrument, in so far as they relate to the hedged risk, and the actual outcome is within a range of 80-125%. The effectiveness is assessed and documented on a monthly basis in order to determine that the hedge has been highly effective throughout the financial reporting periods for which it was intended. We apply the EU carve-out on portfolio fair value hedges.
Hedges that qualify for hedge accounting are recognised as follows:
Fair value hedgesFair value hedges are hedges of the exposure to changes in the fair value of an asset or liability arising as a result of interest rate changes. Movements in the value of the hedging instrument are taken to the statement of income.
Any change in the fair value of the hedged item is also recognised in the statement of income, in so far as the hedging instrument has been effective in the preceding period. Movements in the value of the hedging instrument are taken to the statement of income.
A hedge relationship ends if a hedging instrument is sold, expires or is exercised, or if the hedging transaction no longer meets the criteria for hedge accounting, with the remaining value adjustment of the hedged item amortised through profit or loss until the end of its term.
We apply micro fair value hedge accounting and macro fair value hedge accounting.
Micro fair value hedgesA fair value hedge is classified as a micro fair value hedge when the hedged item (or group of items) is a distinctively identifiable asset or liability hedged by one or a few hedging instruments. Debt securities at fair value through other comprehensive income and issued debt securities are hedged for interest rate risk in a micro fair value hedge.
Macro fair value hedgesWe apply macro fair value hedges for fixed rate mortgages. A portfolio of mortgages is identified comprising homogeneous loans based on their contractual interest rates, maturity and other risk characteristics. Mortgages within the identified portfolio are allocated into repricing term buckets based on expected repricing dates rather than contractual repricing dates. The hedging instruments are designated appropriately to those repricing term buckets.
Cash flow hedgesCash flow hedges are hedges of the exposure to fluctuations in the cash flow of an asset, liability or future transaction arising as a result of interest rate changes and/or inflation. The portion of the gain or loss on the hedging instrument that has been determined to be an effective hedge is recognised directly in equity until the hedged item affects the statement of income, while the ineffective portion is recognised in profit or loss.
If the hedging instrument expires or is sold, or if it can no longer be designated as a hedge, accumulated gains and losses remain in equity until the expected future transaction is taken to the statement of income. If the expected future transaction is no longer likely to take place, the accumulated result is transferred directly from equity to profit or loss.
Embedded derivativesFinancial assets with embedded derivatives are considered in their entirety when determining whether their cash flows are solely payment of principal and interest.
If the hybrid contract contains a host that is not an asset, the embedded derivatives are separated from the host contract and treated as separate derivatives when:– The economic characteristics are not closely related to
those of the host contract;– A separate instrument with the same terms would meet
the definition of a derivative; and– The hybrid contract is not measured at fair value
through profit or loss.
Summary of significant accounting policies 95

Day 1 profitDiscrepancies between the transaction price and the fair value may arise if valuation techniques are applied at the time of the transaction. Such a discrepancy is referred to as a Day 1 profit. Any resulting profit or loss is recognised directly in the statement of income if the valuation method is based on observable inputs in an active market. In the event of unobservable inputs, the gain or loss is amortised over the term of the transaction.
Netting of financial assets and liabilitiesFinancial assets and liabilities are netted and presented in the consolidated financial statements at the net amount when we have a legally enforceable right to offset the recognised amounts and there is an intention to settle on a net basis, or to realise the asset and settle the liability simultaneously. This mainly concerns netting of derivatives. See 2.7, Risk management.
Statement of financial position by IFRS accounting policyFor the layout of the statement of financial position by IFRS accounting policy, see “Consolidated statement of financial position by category” in the supplementary notes.
Statement of financial position
Cash and cash equivalents and balances at central banksCash and cash equivalents and balances at central banks comprise, at nominal value, cash in hand and deposits with a term of less than three months, investments readily convertible into a known amount of cash with an insignificant risk of value changes, balances at central banks and balances withdrawable on demand at other banks in respect of which the risk of value changes is insignificant. The amount due from DNB arising from the minimum reserve requirement is also included in this item.
Financial assets from trading activitiesFinancial assets from trading activities are transactions for our own account whereby the aim is to actively sell these instruments in the short term. Financial assets from trading activities consist of the trading portfolio of both equity instruments and debt instruments. The financial assets from trading activities are recognised at fair value with effect from the trade date and value adjustments are taken to the statement of income under the line item Result on financial transactions.
Due from banksAmounts due from banks are initially recognised at fair value and subsequently at amortised cost using the effective interest method.
DerivativesDerivatives are carried at fair value. The positive and negative values of derivatives are shown separately on the face of the statement of financial position on the assets side and the liabilities side, respectively. The values of derivatives with a positive and negative value, concluded with the same counterparty, are only netted if the cash flows are settled on a net basis and this is permitted under law. Movements in the value of derivatives are taken directly to the line item Result on financial transactions. If the hedge is completely effective, the net impact on the statement of income is nil. The difference, in so far as this
remains within the ranges set, reflects ineffectiveness and is taken to the statement of income.
Derivatives include:– The fair value of derivatives held for trading Derivatives held for trading are transactions for own
account whereby the aim is to actively sell them in the short term;
– Economic hedges Economic hedges are derivatives used to manage risks
without applying hedge accounting;– Structured product derivatives Structured product derivatives are options we have
acquired in order to hedge structured products sold to clients, without application of hedge accounting;
– Client option positions Offsetting market transactions are conducted for all
option positions held by our clients on a one-on-one basis;
– Derivatives with application of hedge accounting These are derivatives used as hedging instruments in
the application of hedge accounting.
Financial assets at fair value through profit or loss Assets that do not meet the criteria for amortised cost or fair value through other comprehensive income (FVOCI) are measured at fair value through profit or loss (FVTL). Additionally, any instrument for which the contractual cash flow characteristics are not solely payments of principal and interest (SPPI) must be measured at FVTL. No restrictions are set for sales within the fair value through profit or loss portfolio. These debt instruments are governed by ALCO and sales need to be approved by ALCO. Interest earned on these assets is recognised as interest income. All other realised and unrealised gains and losses on remeasuring debt instruments at fair value are recognised under Result on financial transactions. All realised and unrealised gains and losses on remeasuring equity instruments at fair value are recognised under Income from securities and associates.
Financial assets at fair value through other comprehensive incomeA debt instrument that is held within the hold to collect and sell business model and meets the SPPI test is measured at fair value, with fair value adjustments recognised in other comprehensive income unless the asset is designated at fair value through profit or loss. The financial assets in the hold to collect and sell portfolio are governed by ALCO and sales need to be approved by ALCO. Sales as a result of managing everyday liquidity needs, maintaining a particular interest yield profile on the secondary market, or to match the duration and sales required by regulators, are consistent with the objective of the hold to collect and sell portfolio.
Under FVOCI, a financial asset is measured at its fair value and movements in the carrying amount are taken through OCI, except for the recognition of impairment gains or losses, interest revenue and foreign exchange gains and losses on the instrument’s amortised cost which are recognised in profit or loss. When the financial asset is derecognised, the cumulative gain or loss previously recognised in OCI is reclassified from equity to profit or loss and recognised in Result on financial transactions. Interest income from these financial assets is included in Interest income using the effective interest rate method.
Summary of significant accounting policies 96

Available-for-sale investmentsThis does not apply from 1 January 2018 onwards due to the adoption of IFRS 9.
Investments included in this line item have been classified by management as transactions held indefinitely and are carried as available for sale. This line item comprises investments in both equity instruments and debt instruments. These investments are initially measured for any changes occurring in the fair value of the investment after its acquisition. Unrealised gains and losses resulting from changes in the fair value of investments classified as available for sale are recognised on a net basis in equity.
On realisation of available-for-sale equity instruments, the accrued revaluation reserve is released to the statement of income under the line item Income from securities and associates. When calculating the transaction result, cost is determined using the average cost method.
Interest earned on these assets is recognised as interest income. Dividends are recognised under Income from securities and associates.
Available-for-sale investments may be sold as a result of liquidity control or changes in interest rates, exchange rates or share prices. Discounts or premiums on interest-bearing available-for-sale investments are amortised based on the effective interest rate and recognised in profit or loss. If the investments are sold or impairment losses occur, the adjustments to fair value are recognised in profit or loss.
We assess on a quarterly basis whether impairment losses have occurred. The fair value of an investment in an equity instrument being below cost significantly or for a prolonged period is an objective indication of impairment, and this is determined by the Impairment Committee on the basis of the policy adopted.
We treat unrealised losses on debt instruments in the investment portfolio due to interest rate fluctuations as temporary decreases in value. We aim to retain these investments in debt instruments for a term considered long enough to offset these unrealised losses, and expect to receive the full principal if they are held to maturity.
In the first year of investment, shareholdings are recognised at fair value and are adjusted where applicable for any changes in this value occurring after acquisition. The market value of shareholdings is based on reports prepared by the fund manager. This value is adjusted where applicable for carried interest arrangements and annual fund charges.
All purchases and sales of available-for-sale investments transacted according to standard market conventions are recognised on the transaction date. All other purchases and sales are recognised on the date of settlement.
Held-to-maturity investmentsThis does not apply from 1 January 2018 onwards due to the adoption of IFRS 9.
Investments for which the date of maturity and cash flows are known are classified as held-to-maturity investments in so far as the Asset & Liability Committee has both the intention and the ability to hold them until maturity.
The Asset & Liability Committee determines the appropriate classification for its investments on their transaction dates.
Held-to-maturity investments are initially recognised at fair value and subsequently measured at amortised cost using the effective interest method, after any reduction of an allowance to account for impairment. Interest earned on held-to-maturity investments is recognised as Interest income. All transactions in held-to-maturity investments are recognised on the settlement date.
If there are objective indications that an impairment has occurred, the impairment is determined as the difference between the carrying value of the investment and the present value of estimated future cash flows (with the exception of future loan losses that have not yet occurred) calculated at the original effective interest rate of the investment.
The impairment is recognised in the statement of income. If the amount of the impairment reduces in a subsequent period and the reduction can be objectively related to an event that occurred after the impairment was applied, the earlier impairment is reversed. The amount of the reversal is recognised in the statement of income in so far as the carrying value of the asset does not exceed its amortised cost on the reversal date.
Loans and advances to the public and private sectorsLoans and advances to the public and private sectors are recognised at amortised cost using the effective interest method.
Other financial assets at amortised costA debt instrument that is held within the hold to collect business model and meets the SPPI test is measured at amortised cost unless the asset is designated at fair value through profit or loss. Our Asset & Liability Committee (ALCO) sets restrictions for buying and selling in the hold to collect portfolio. Sales are permitted when these are due to an increase in credit risk, take place close to the maturity date, are significant in value (both on individual and aggregated level) or are infrequent. Under this measurement category, the financial asset is measured at fair value at initial recognition minus the principal repayments, plus or minus the cumulative amortisation using the effective interest method of any difference between that initial amount and the maturity amount and adjusted for any impairment allowance. The impairment is recognised in the statement of income. Interest income from these financial assets is included in Interest income using the effective interest rate method.
Investments in associates using the equity methodThese investments have been designated by management as transactions held indefinitely, and as a result of the acquired control can be classified as investments in associates using the equity method. These are investments in entities where we have significant influence but not control. If there is a change in the equity of the associate, we recognise our share in this change and include it in the statement of changes in equity. This also applies to results of associates recognised in our statement of income.
In the first year of investment, investments classified as investments in associates using the equity method are
Summary of significant accounting policies 97

recognised at cost, and where applicable are adjusted for any changes in the value of the associate’s individual receivables and payables occurring after the acquisition, measured using the policies applied by Van Lanschot Kempen.
The recoverable amount of the investments in associates using the equity method is determined each quarter. The valuation methods applied are the capitalisation method (peer group analysis), the discounted cash flow method and the disclosed net asset value method. An impairment is recognised if the recoverable amount is lower than the carrying amount.
The capitalisation method determines the value of a business by multiplying the operating profit (EBIT) and the operating profit before depreciation and amortisation (EBITDA) by a multiplier factor derived from similar listed companies (the peer group), if applicable also taking account of a discount for poor liquidity and minority shareholding. EBIT and EBITDA are adjusted for one-off items where applicable.
The discounted cash flow method calculates the enterprise value by discounting the forecast operational cash flows at a discount rate for the planning period and a final value based on the extrapolation of the operating profit. The discount rate is determined on the basis of the discount rate of listed companies with a high degree of similarity and on the specific characteristics of the company. If applicable, the discounted cash flow method takes account of a discount for poor liquidity and minority shareholdings.
The company’s net debt is then deducted from the value resulting from the capitalisation method and/or discounted cash flow method and multiplied by the share in the capital structure in order to derive the shareholder value from the enterprise value.
The disclosed net asset value method determines the value of a company based on the statement of financial position.
If our share in the associate’s losses is equal to or exceeds our interest in the associate, no further losses are recognised unless we have assumed obligations or made payments for these associates.
Property and equipmentProperty and equipment comprise property, information technology, furniture and fixtures, and communication and safety equipment. Property and equipment are initially carried at cost and subsequently measured at historical cost less accumulated depreciation and accumulated impairments. The carrying value includes the costs for replacement of part of the existing property as soon as these costs are incurred, but excludes day-to-day servicing costs. Depreciation is calculated on a straight-line basis over the useful life of the asset.
The recoverable amount of individual property items is determined every year, irrespective of whether there is any indication of impairment, and more often if market conditions so dictate. The recoverable amount is the higher of the fair value less costs or the value in use.
The fair value less costs is set by an independent surveyor. If the fair value less costs is below the carrying amount, the value in use is determined. This value is calculated using the value-in-use method. If the value in use is also below the carrying amount, an impairment is recognised for the difference between the carrying amount and the higher of the fair value less costs and the value in use.
Estimated useful life of property and equipment (years)
Land Indefinite
Buildings 40
Alterations 10 - 15
Operating system software and IT 3 - 5
Communication equipment 5
Safety equipment 15
Infrastructure 10
Furniture and fixtures 5 - 10
Operating system software development costs are capitalised if they are identifiable, if there is a likelihood that future economic benefits will flow to Van Lanschot Kempen and if costs can be measured reliably.
Property not in own use comprises office buildings no longer in own use. Our policy is focused on selling these assets in due course. Property not in own use is carried at historical cost less accumulated depreciation and accumulated impairments. This property is considered to be impaired if its carrying amount exceeds the recoverable amount. The recoverable amount less the relevant variable costs to sell is based on the appraisal value as determined by an independent surveyor.
Goodwill and other intangible assetsGoodwill represents the difference between the fair value of the acquired assets (including intangible assets) and liabilities, and the purchase price paid (excluding acquisition costs). Goodwill paid is included in the financial statements at cost less any accumulated impairment losses. Goodwill paid is tested for impairment annually or whenever events or changes in circumstances indicate that the carrying value may be impaired. An impairment is calculated based on the difference between the carrying value and the recoverable amount of the cash-generating unit (CGU) to which the goodwill relates. A CGU’s recoverable amount is the higher of its fair value less costs to sell and its value in use.
Owing to the absence of a market for separate CGUs, we are unable to calculate a reliable fair value less costs to sell for each CGU. The recoverable amount is therefore deemed to be equal to the value in use. The value in use is determined by discounting the future cash flows generated by a CGU to their net present value. If the recoverable amount of a CGU is lower than its carrying amount, goodwill is impaired. The impairment is first applied in full to the goodwill and then pro rata to the individual assets.
Other intangible assets with a finite useful life, such as application software, client bases, contractual rights and the value of acquired funds and loans and advances, are capitalised at cost and amortised on a straight-line basis over their respective useful lives.
Summary of significant accounting policies 98

Estimated useful life of intangible assets (years)
Client bases 5 - 20
Third-party distribution channels 12 - 20
Brand names 20
Application software 3 - 5
Tax assets and liabilitiesTax assets and liabilities are stated at face value. Current and deferred tax assets and liabilities are offset when they relate to the same tax authority, the same type of tax and the law permits offsetting of these assets and liabilities.
Deferred taxes are recognised on the face of the statement of financial position if the valuation of an asset or liability temporarily differs from the valuation for tax purposes. Deferred taxes are calculated using the tax rates prevailing on the reporting date. Deferred tax assets and liabilities are offset if they relate to the same tax authority, concern the same type of tax, if it is permitted under law to offset these deferrals and if the deferrals are expected to be settled simultaneously. Deferred tax assets are recognised only if it is probable that taxable profits will be realised in the near future against which these temporary differences can be offset.
Tax assets are assessed at every reporting date and reduced to the extent that it is no longer probable that sufficient taxable profit will be available to allow all or part of the deferred tax assets to be used. This reduction will be reversed if it is probable that sufficient taxable profits will be available.
Changes in the value of investments classified as available for sale and movements in the value of derivatives forming part of a cash flow hedge are recognised in equity net of deferred tax. Deferred tax assets and liabilities cease to be recognised when these movements in value are realised. Current tax is taken to the statement of income on realisation of the movement in value.
Assets and liabilities classified as held for saleThe line items Assets and liabilities classified as held for sale includes a group of assets whose carrying amounts will principally be recovered through a sale transaction. These assets and liabilities are measured at the lower of either the carrying amount or fair value less costs to sell and depreciation. The group of assets and liabilities concerned is available for immediate sale in its present condition subject only to terms that are usual and customary for sales of such disposal groups. We plan to sell assets at a price which is reasonable considering their current fair value, as a result of which a sale is highly probable and expected to be completed within one year.
Other assetsAssets acquired through foreclosures are carried at the lower of cost or the recoverable amount. This recoverable amount is the estimated selling price in the ordinary course of business less the relevant variable costs to sell. The recoverable amount less the relevant variable costs to sell is based on the appraisal value as determined by an independent surveyor.
Other assets are stated at historical cost.
Financial liabilities from trading activitiesFinancial liabilities from trading activities are transactions for own account whereby the aim is to repurchase these instruments in the short term. Financial liabilities held for trading are stated at fair value, with movements in value being recognised in the statement of income under Result on financial transactions. This line item comprises short positions on the trading portfolio in both equity instruments and debt instruments. Recognition is from the date on which the contract is concluded.
Due to banksAmounts due to banks are initially recognised at fair value excluding transaction costs. After their initial recognition, they are recognised at amortised cost using the effective interest method.
Public and private sector liabilitiesPublic and private sector liabilities are initially recognised at fair value excluding transaction costs. After their initial recognition, they are recognised at amortised cost using the effective interest method.
Financial liabilities at fair value through profit or lossFinancial liabilities at fair value through profit or loss comprise financial instruments which management believes should be recognised at fair value through profit or loss based on one of the following reasons:– Designation eliminates or significantly reduces
inconsistencies in measurement and recognition which would otherwise arise as a result of liabilities being valued or income and expenses being recognised under different accounting policies;
– The contract in which the financial instrument is included contains one or more embedded derivatives and the entire contract is recognised at fair value through profit or loss. This is only permitted if the embedded derivative has significant influence on the contractually agreed cash flows.
The valuation takes account of our own credit risk. This is based on the internal funding curve, which is determined by spreads on issued debt securities and estimates by investment banks of interest rates on new issued debt securities. The own credit risk is recognised in equity under the line item Own credit risk reserve. The remaining amount of change in the fair value is presented in Result on financial transactions. Issued debt securitiesIssued debt securities are initially recognised at fair value excluding transaction costs. After initial recognition, issued debt securities are carried at amortised cost using the effective interest method. Repurchase by us of our own debt securities is offset in the consolidated financial statements against the liability; the difference between the cost and the carrying amount based on the remaining term is taken to the statement of income.
ProvisionsA provision is a liability of uncertain timing or amount. A provision is included in the statement of financial position if we have an obligation as a result of a past event, it is probable that an outflow of resources will be required to settle the obligation, and a reliable estimate can be made. Provisions are discounted if the time value of money for the liability has a material effect.
Summary of significant accounting policies 99

Provisions for pensionsWe operate defined benefit plans and defined contribution plans. Under defined contribution plans, contributions to pension providers are taken to the statement of income as staff costs. We have no further payment obligations with respect to defined contribution plans once the contributions have been paid. Our main pension provider for defined contribution plans is Stichting Pensioenfonds F. van Lanschot. The starting point in determining the contribution is to maintain a balanced development of the pension costs over time.
A defined benefit plan is a pension plan which defines the amount of pension benefit that an employee will receive on retirement. Factors such as age, years of service and salary are taken into account when determining the amounts to be paid. The provision for defined benefit plans is the present value of the defined benefit obligation at the reporting date less the fair value of plan assets.
The pension obligation is calculated with reference to the expected return on plan assets. Differences between the expected and actual return on plan assets and actuarial gains and losses are recognised directly in equity; net interest is recognised under Interest in the statement of income.
Provisions for long-service benefits Employees receive a bonus to mark a long-service anniversary of 25 and 40 years. In addition, receptions or dinners with colleagues are organised for employees who have been in service for 25 and 40 years.
Provision for employee discountsWe have arrangements in place under which employees are granted discounts on mortgage interest rates, for example. The discount is calculated on an actuarial basis for the period during which the employee is inactive (retired) and is recognised in the statement of financial position as a provision.
Restructuring provisionA provision for restructuring is recognised only if the recognition criteria are met. We have a constructive obligation if we have a detailed formal restructuring plan identifying at least the business or part of the business concerned, the principal locations affected, the number of employees affected, a detailed estimate of the expenditure to be undertaken and a suitable timeframe. Employees are also notified of the main features of the plan.
Provision for the interest rate derivatives recovery frameworkA provision for the interest rate derivatives recovery framework is recognised. We have agreed to abide by the Netherlands’ general recovery framework for interest rate derivatives clients, implying that we will offer payments as a result of the implementation of the uniform recovery framework.
Other liabilitiesOther liabilities are recognised at historical cost.
Subordinated loansSubordinated loans are initially recognised at fair value excluding transaction costs. After initial recognition, they are carried at amortised cost. Purchases by us of our own subordinated loans are set off against the liability in the
consolidated financial statements; the difference between cost and the carrying amount based on the remaining term is taken to the statement of income.
Obligations not recognised in the statement of financial positionThis includes obligations that represent a potential credit risk. For the other obligations not recognised in the statement of financial position, see “Commitments” in the supplementary notes.
Contingent liabilitiesContingent liabilities are carried at the contract value and relate in particular to guarantees and irrevocable letters of credit.
Irrevocable commitmentsThis item consists of unused overdraft facilities, sale and repurchase commitments, irrevocable payment commitments for the Single Resolution Fund (SRF) and all other obligations resulting from irrevocable commitments that could give rise to loans.
Statement of income
GeneralRevenue is recognised in so far as it is likely that the economic benefits will flow to Van Lanschot Kempen and the revenue can be measured reliably. Costs are allocated as far as possible to the period in which the services were rendered or to the relevant proceeds.
Net interest incomeThis item consists of income earned on lending and costs of borrowing, derivatives, related commission, and other income/expense similar to interest. The amortisation of remaining value adjustments on mortgage portfolios of fair value hedges which expired in the past is disclosed under Interest income.
Interest income and interest expense are recognised in the statement of income on an accrual basis, using the effective interest method. The effective interest rate is the rate that exactly discounts estimated cash flows over the life of the financial instrument, or a shorter period when appropriate, to the net carrying amount of the financial asset or liability. When calculating the effective interest rate, we take into account all contractual terms of the financial instrument (for example early repayment) but not future losses due to uncollectible amounts.
Negative interest on derivatives whereby interest paid is recognised under Interest expense and interest received is recognised under Interest income. Negative interest on balances at central banks is recognised under Interest expense.
Income from securities and associatesAll dividends received from investments in equity instruments are included under dividends and fees. Dividends are recognised directly in the statement of income when they are made payable. Prolonged or significant decreases in the value of equity instruments forming part of the available-for-sale investments are recognised in the statement of income as impairments. Gains or losses on the sale of available-for-sale investments
Summary of significant accounting policies 100

in equity instruments and debt instruments are recognised under Gains/losses on sale of available-for-sale investments in equity instruments (Income from securities and associates) and Realised gains/losses on available-for-sale debt instruments (Result on financial transactions).
Our share in the results of equity-valued associates is recognised under Income from securities and associates using the equity method. Dividends received are deducted from the carrying amount of the equity-valued associate. Due to the fact that these investments in associates using the equity method are part of our investment strategy, we present the income as part of our operating activities.
Net commission incomeThis item comprises the income, other than income similar to interest, earned on wealth management services provided to third parties. Commission paid to third parties is accounted for as commission expense.
We receive commission for the wide range of services we provide to clients. This can be divided into commission on a transaction basis and periodic commission charged to the client during the year.
Commission on a transaction basisCommission income on a transaction basis is recognised in the periods in which we provide the services. Transaction commission for which we only provide a service on the transaction date (e.g. commission on buying and selling shares) is taken directly to the statement of income. Transaction commission for which we have to provide a service in the future (e.g. commission on structured products) forms part of the amortised cost and is recognised in the statement of income over the expected term of the instrument.
Periodic commissionPeriodic commission (e.g. management fees) is recognised in the statement of income in the period in which the services are provided.
Result on financial transactionsResult on securities trading includes realised and unrealised value differences on gains and losses on financial instruments relating to the securities trading portfolio. Exchange and price gains and losses on trading in other financial instruments are recognised under Result on foreign currency trading. Gains and losses due to ineffectiveness in hedge accounting are recognised under Unrealised gains/losses on derivatives under hedge accounting. Result on economic hedges includes realised and unrealised gains and losses on derivatives that are not included in a hedge accounting model. Result on financial instruments at fair value through profit or loss comprises unrealised value differences and interest expenses on financial liabilities at fair value through profit or loss.
Other incomeOther income comprises non-banking income resulting from the consolidation of non-banking subsidiaries.
Staff costsStaff costs comprise wages and salaries, pension and early retirement costs, other social security costs and other staff costs such as remuneration in the form of share-based employee benefits.
Share-based paymentsEmployees may be eligible to receive remuneration in the form of share-based payments. The cost of equity instrument-settled transactions of Van Lanschot Kempen NV with employees is measured by reference to the fair value at the date on which they are granted. The fair value is determined based on the share price on the grant date. The cost of equity instrument-settled transactions of Van Lanschot Kempen NV is recognised, together with a corresponding increase in equity, in the period in which the employee’s performance criteria are fulfilled, ending on the date on which the employee becomes fully entitled to the award (the vesting date). Share-based payments: Management Investment PlanThe Management Investment Plan entails an equity instrument-settled transaction. If, at the moment that the share-based payment is made, the fair market value per depositary receipt exceeds the issue price, the costs relating to this higher fair market value are treated as expenses during the vesting period, with a corresponding adjustment to equity. The total sum to be taken into consideration is determined on the basis of the fair value of the depositary receipts as established on the date on which they are granted.
Other administrative expensesOther administrative expenses comprise IT expenses, costs of marketing and communication, accommodation expenses, office expenses and other administrative expenses.
DepreciationDepreciation and amortisation are determined on the basis of estimated useful life and charged to the statement of income.
ImpairmentsThis item comprises the balance of the required impairments and reversals of such impairments.
Income taxTax on operating profit is recognised in the statement of income in accordance with applicable tax law in the jurisdictions in which we operate.
Tax effects of any losses incurred in certain jurisdictions are recognised as assets when it is probable that sufficient future profits will be available in the relevant jurisdiction against which these losses can be offset.
Earnings per shareEarnings per share are calculated by dividing the profit for the year available to the shareholder by the weighted average number of shares outstanding during the period.
Statement of cash flowsThe statement of cash flows is prepared using the indirect method. This statement of cash flows shows the source and application of cash items. Cash flows are divided into those from operating, investing and financing activities. Cash and cash equivalents comprise, at face value, all cash in hand, balances at central banks and balances withdrawable on demand at other banks in respect of which the risk of value changes is insignificant.
Summary of significant accounting policies 101

LeaseLease contracts, including operating sale and leaseback agreements, under which the risks and benefits of ownership of the assets are substantially retained by the lessor, are classified as operating lease contracts. We have entered into operating lease contracts as lessee. Operating lease payments (less any discounts granted by the lessor) are charged to the statement of income on a straight-line basis over the term of the lease. In the case of sale and leaseback, if the selling price of the asset falls below its fair value, the difference between the carrying amount and the selling price is recognised through profit or loss unless the difference between the fair value and the selling price is offset through future non-standard lease instalments.
Lease contracts, including financial sale and leaseback agreements, under which the risks and benefits of ownership of the assets are substantially transferred to Van Lanschot Kempen, are classified as financial lease contracts. We have entered into financial sale and leaseback contracts as lessee. Financial lease contracts are capitalised on the effective date of the lease contract at the lower of the fair value of the leased asset and the present value of the minimum lease payments. The discount rate used in calculating the present value of the minimum lease payments is the implicit interest rate of the lease contract.
The leased property or asset is recognised under Property and equipment. Depreciation is applied using the same method as for wholly owned tangible assets. The lease obligation is recognised under Other liabilities. The interest component of the finance costs is charged to the statement of income over the term of the lease.
Segment informationThe different operating segments form the basis for our primary segmentation. An operating segment is a business unit that can earn revenues and incur expenses and whose operating results are regularly reviewed by its management or the chief operating decision maker and for which discrete financial information is available. Additional information is reported geographically based on where the business activities are located. Intra-segment transactions are conducted on commercial terms and market conditions (at arm’s length).
Summary of significant accounting policies 102

1. Risk and capital managementOur front-office functions are essential in delivering services to our clients. Risk management supports the front office, clients and other stakeholders in ensuring that the risks incurred by Van Lanschot Kempen are controlled and comply with our risk appetite and legal requirements. This section describes our risk appetite, the organisational and governance arrangements that are in place regarding risk management, and the three lines of defence principle. After discussing these general arrangements, the section continues with credit risk, market risk, operational risk, settlement risk, CVA risk, strategic risk, interest rate risk, liquidity risk, securitisation risk, compliance risk, financial reporting risk and assets at fair value. 1.1 Risk appetite Solid capital and liquidity ratios are essential prerequisites for a successful proposition to our clients, and this is reflected in our risk appetite statement. We aim to have a simple and transparent balance sheet. Lending activities occur mainly in Private Banking and the corporate loan portfolio is being wound down.
We have a robust risk appetite framework in place. Each year, the Statutory Board prepares the risk appetite statement, which translates our risk appetite into strategic limits. The risk appetite statement is then submitted to the Supervisory Board for review and approval. In addition, the Supervisory Board reviews the development of the risk profile twice a year. Risk appetite reports serve as important discussion documents for these reviews.
The risk appetite statement is based on the following guiding principles:– We only take risks that we understand and can explain;– We only take risks that – directly or indirectly –
serve our strategic objectives;– The sum of all risks taken should not exceed our
risk-bearing capacity;– When taking risks, we take the requirements and
expectations of all stakeholders into account;– We do not take any risks that could seriously harm our
reputation;– Our risk appetite should be considered in all business
decisions at every level of the organisation;– We avoid risks that could lead to legal or regulatory
breaches.
1.2 Organisation of risk and capital managementThe purpose of our risk management framework is to identify and analyse risks at an early stage, as well as to mitigate and monitor those risks. Adequate internal control procedures and reporting systems, including the application of standards and limits, are key elements of the risk management framework.
The organisation of our risk management framework is based on the three lines of defence principle. Day-to-day responsibility for risk control lies with the front office and/or operational departments (the first line of defence); Compliance, Group Risk Management and Finance, Reporting & Control form the second line of defence for financial and non-financial risks. These departments are responsible for initiating risk policies and the supervision of risk controls within Van Lanschot Kempen. Group Audit forms the third line of defence and is responsible for performing independent audits on the risk framework. This set-up creates a clear, balanced and appropriate division of tasks, powers and responsibilities, and ensures independent and effective execution of the risk management function.
Group Risk Management stands at the core of capital management. We actively manage our capital base to cover risks inherent to our business and meet the capital adequacy requirements of De Nederlandsche Bank (DNB). The adequacy of our capital is monitored by using the rules and ratios established by the Basel Committee on Banking Supervision as transposed into EU law. This legal framework also forms the basis for supervision by DNB. Over the reporting period, we fully complied with all externally imposed capital requirements. Both external and internal capital adequacy targets are taken into account, and the central focus is on safeguarding our financial solidity and stability. Each year, a capital and funding plan is prepared for capital management purposes.
RISK MANAGEMENT
Risk management 103

1.2.1 SupervisionThe Supervisory Board oversees the risks and capital requirements in relation to the group’s operations and portfolio composition. It has set up two committees specifically for this purpose.
The Risk Committee focuses on all identified risks in the group’s business activities, as well as the risk management framework. The Committee also informs decision-making by the Supervisory Board on risk matters.
The Audit and Compliance Committee was created to advise the Supervisory Board on financial reporting, internal and external audits, compliance and matters regarding duty of care. 1.2.2 Risk and capital management The Statutory Board is responsible for developing and executing the strategy of the group. This includes the capital and funding plan, which is based on a number of risk and capital policies.
The primary objective of our capital management is to ensure that we comply with external and internal capital requirements in order to support our businesses and to create value for our stakeholders. We manage our capital structure by taking into account changes in economic conditions and the risk characteristics of our activities. To maintain and/or manage our capital structure, we may ad-just the amount of dividend payments to shareholder, return capital to shareholder or issue capital securities. However, these are under constant review by the Statutory Board.
The Statutory Board also bears responsibility for ensuring the proper functioning of the processes that safeguard the group’s liquidity and capital position. In addition, it is required to provide information to the Supervisory Board, which in turn assesses the risk appetite of the group. The decisions of the Statutory Board are taken during meetings of the Executive Board. In order to ensure the various risk types are managed properly, the Statutory Board has set up the following risk committees:
Group Risk CommitteeThe Group Risk Committee, which includes all members of the Statutory and Executive Board, discusses overarching risk management themes. In this committee, the various risk types are brought together, discussed and monitored on an integrated level. The committee is involved in setting the annual risk appetite statement, and discusses the risk appetite report and emerging trends in the risk profile. Other areas covered include recovery and resolution planning, operational incidents, etc.
Credit Risk CommitteeThe Credit Risk Committee sets and adjusts the group’s overall credit risk policy and translates this into acceptance and portfolio management policies. In executing its tasks, the committee bears in mind our strategic objectives and the guiding principles contained in the risk appetite statement. Two members of the Executive Board serve on this committee (the CFRO and the member of the Executive Board responsible for Private Banking), along with representatives of Group Risk Management, Private Banking, Credit Service Centre, Corporate Banking, Credit Approval, and Restructuring & Recovery. The committee meets on a quarterly basis.
Market Risk CommitteeThis committee focuses on all market risks within Van Lanschot Kempen. Market risk is the risk of loss as a result of changes in market variables, including interest rates (excluding interest rate risk in the banking book), exchange rates and equity prices. It also considers variables not directly observable in the market, such as volatility and correlations, which also influence the value of certain financial instruments. Market risks at Kempen occur due to the trading of securities (mainly equities, equity derivatives, management book investments and structured products). Van Lanschot is exposed to a certain amount of market risk (mainly FX risk) through its treasury activities. This risk is limited, as the majority of transactions and positions in the statement of financial position are denominated in euros. Van Lanschot is also exposed to market risk as result of management book investments. The committee meets on a quarterly basis.
Table 1.2 Risk and capital management framework
Supervision§ 1.2.1
Supervisory Board– Risk Committee – Audit and Compliance Committee
Risk and capital management§ 1.2.2
Statutory Board– Group Risk Committee– Credit Risk Committee– Market Risk Committee– Asset & Liability Committee– Compliance & Operational Risk Committee– Credit Committee– Product Board
Implementation and review§ 1.2.3
Group Risk Management
Finance, Reporting & Control
Compliance Group Audit
Execution§ 1.2.4
Private Banking
Evi Asset Management
Merchant Banking
Treasury Restructuring & Recovery
Corporate Banking
Risk management 104

Asset & Liability CommitteeThe Asset & Liability Committee (ALCO) is responsible for managing risks that result from mismatches between assets and liabilities (interest rate and liquidity risks), as well as the capital position of the bank. ALCO’s main tasks are:– Overseeing the Asset & Liability Management (ALM)
process;– Monitoring and adjusting the funding profile;– Setting policies on interest rate risk in the banking
book1, liquidity and funding risk, funds transfer pricing and capitalisation;
– Monitoring the development of the balance sheet and balance-sheet projections.
ALCO meets once a month and is chaired by the CFRO. As well as the CFRO, ALCO’s members comprise:– The Chairman of the Executive Board;– The Executive Board member responsible for Private
Banking;– Representatives of Treasury, Group Risk Management
and Finance, Reporting & Control.On a quarterly basis, ALCO meets as an expanded group, which includes the COO and representatives of the commercial departments. Compliance & Operational Risk CommitteeThe Compliance & Operational Risk Committee is responsible for the implementation and execution of our compliance and operational risk management policies. The committee assesses compliance and operational risks, and ensures remedial actions are taken if required. The committee also challenges and approves the annual plans of the Non-Financial Risk Management and Compliance departments. It meets on a quarterly basis and is chaired by the CFRO.
In addition to the committees described above (in which Group Risk Management takes the lead), we have a number of committees that form part of the first line of defence and that cover specific risk-related topics, such as the Credit Committee and the Product Board.
1.2.3 Implementation and review of risk and capital management policies
Implementation and monitoring of our risk and capital policies is carried out by:– Group Risk Management;– Finance, Reporting & Control;– Compliance.In addition, Group Audit periodically reviews these policies.
Group Risk Management is responsible for:– Second-line monitoring and management of all risks
relating to the statement of financial position at group level, including modelling, measuring, managing and reporting on our credit, market, interest rate, liquidity and strategic risks;
– Business continuity management;– Information security;– The risk appetite process;– Preparing, developing and maintaining policy
documents;– Preparing ICAAP and ILAAP documentation as well as
the recovery plan;– Issuing daily market risk reports;– Proactively and reactively providing advice on managing
risks;
– Raising risk awareness among staff in order to improve their ability to strike a sound balance between risk and return.
Finance, Reporting & Control is jointly responsible with Group Risk Management for the financial accounting and business control function. Through its various reports, Finance, Reporting & Control fulfils an important role in challenging the businesses and coordinating supervision of risk management.
Compliance has both an advisory and a monitoring role with respect to compliance with internal and external laws and regulations that apply to the Statutory Board, senior management and employees. Compliance operates independently and its director reports directly to the Chairman of the Statutory Board. In addition, Compliance reports periodically to the Supervisory Board’s Audit and Compliance Committee.
Group Audit reviews the design and effectiveness of the risk organisation and the execution of our risk and capital management policies. The department reports to the Statutory Board. The applicable policies form the starting point for the independent review by Group Audit. Processes, infrastructure, organisation and systems are audited based on these policies in order to determine whether the organisation adequately executes its risk and capital management policies. 1.2.4 Execution of risk and capital management policiesThe commercial departments, i.e. the departments shown under “Execution” in Table 1.2 (excluding Treasury and Restructuring & Recovery), are responsible for preparing their business plans. On the basis of these plans, current and future risks are assessed, including expected capital and liquidity requirements. These assessments serve as input for the Asset & Liability Committee.
1.3 Capital requirementsThe standards set by the Basel Committee on Banking Supervision, and translated into law, apply to all Dutch banks. The Basel framework consists of three pillars:– Pillar 1 stipulates capital requirements for credit, market
and operational risk.– Pillar 2 requires banks to have internal processes for risk
management and to calculate the capital requirements needed to address all risks that are not included in Pillar 1. The Supervisory Review and Evaluation Process (SREP) is also part of Pillar 2.
– Pillar 3 sets out requirements for disclosure of information about the institution’s risk profile to external stakeholders.
Our website has Pillar 3 information (unaudited) and a detailed breakdown of our portfolio of loans to companies and institutions (unaudited), published once a year. Our remuneration policy is explained in the Remuneration section and in a Pillar 3 remuneration disclosure (unaudited), which can also be found on the website.
We hold regulatory capital to be able to mitigate Pillar 1 and Pillar 2 risks. This capital consists of Common Equity Tier 1 (CET1), which comprises share capital, share premium, retained earnings including current year profit, and other reserves less net long positions in own shares and after
Risk management 105
1 The banking book comprises all assets that are not held for trading purposes under the regulatory definition.

1.4 Individual risksThe following sections detail the individual risk types to which we are exposed. It therefore covers a combination of Pillar 1 and Pillar 2 capital requirements. The risk types covered are:– Credit risk (Section 2);– Market risk (Section 3);– Operational risk (Section 4);– Settlement risk (Section 5);– CVA risk (Section 6);– Strategic risk (Section 7);– Interest rate risk (Section 8);– Liquidity risk (Section 9);– Securitisation risk (Section 10);– Compliance risk (Section 11);– Financial reporting risk (Section 12).
2. Credit riskCredit risk is defined as the risk that a counterparty or client is no longer able to fulfil its obligations to the bank. Our credit risk policies focus on the counterparty risks associated with lending to private and corporate clients. Strict selection criteria for new clients and active credit management for existing clients are applied to safeguard the quality of the loan portfolio. The lending activities that we conduct are required to be in line with stated objectives, and individual assessments are used to ascertain this.
As well as from lending activities, credit risk also arises from:– Investment activities;– International payment transactions and cash
management;– Foreign exchange (FX) risk;– Hedging activities;– Settlement risk.
Our investment activities relate to the management of our liquidity buffer and equity investments. For the liquidity buffer, a limit framework is in place to manage and monitor associated credit risks.
Counterparty credit risk with respect to financial institutions arises from international payment transactions, cash management, FX and hedging activities. Some of these activities also involve settlement risk. For derivatives transactions, counterparty credit risk is mitigated by daily margining.
We apply a strict policy when determining and monitoring country and counterparty (financial institutions) limits. The country limits serve as a cross limit for financial institutions, meaning that the counterparty risks in respect of financial institutions in one country are limited by the relevant country limit, as the country limit is usually lower than the aggregate of the individual counterparty limits.
2.1 Loans and advances 2.1.1 Credit acceptanceOur loan approval policy focuses on maintaining a high-quality loan portfolio. The authority to approve loans and loan reviews is delegated to a limited number of departments, mainly our Credit Approval department.
The authority to approve large loans rests, according to the credit approval authorisation matrix, with the Credit Committee, which comprises representatives of the relevant divisions as well as members of the Statutory Board.
The mid- and back-office for nearly all residential mortgage loans is carried out by a third party. A service level agreement (SLA) has been signed to ensure adequate control of the operational risks, including the outsourcing risk. The acceptance process has been outsourced for only a limited number of cases: mortgage loans to a maximum amount of €1 million and only for borrowers who are employed – and are not company directors, major shareholders or owner-directors.
We also offer residential mortgages via a third party under a white label. From a risk management perspective, the credit and outsourcing risk are of particular relevance here.
other capital deductions (e.g. goodwill, deferred tax assets, IRB shortfall). Certain adjustments are made to IFRS-based results and reserves, as legally required.
The other component of our regulatory capital consists of Tier 2 capital instruments, including subordinated long-term debt.
Table 1.3 Capital requirements 2018 2017
Actual Required1 Actual Required2
Common Equity Tier 1 (CET1) 982,058 520,984 1,021,773 520,318
Tier 1 982,058 589,686 1,021,773 595,005
Total capital 1,144,949 681,287 1,173,738 694,587
Risk-weighted assets 4,580,083 4,979,120
CET1 ratio (phase-in) 21.4% 11.4% 20.5% 10.5%
Tier 1 ratio (phase-in) 21.4% 12.9% 20.5% 12.0%
Total capital ratio (phase-in) 25.0% 14.9% 23.6% 14.0%
Risk management 106
1 Required capital amount based on Pillar 1, Pillar 2 (5.0%) and capital conservation buffer (1.875%).
2 Required capital amount based on Pillar 1, Pillar 2 (4.7%) and capital conservation buffer (1.25%).

An SLA has been signed to ensure adequate control of the operational risks, including the outsourcing risk. The acceptance and management of credit risks have been outsourced to a third party and these activities are monitored using detailed data from the mortgage portfolio, provided in accordance with prevailing legal requirements. This allows for the recognition of any arrears, for example. We also review random samples of mortgage loans.
Limits on financial institutions and countries are determined using a number of hard criteria such as the external rating, BIS ratios, capital ratios, country of origin and gross domestic product (for countries). Limits can also be adjusted and withdrawn on a daily basis.
New loan requests are assessed to determine if they are in line with our strategy and we adopt a conservative approach to granting them. The Corporate Banking loan portfolio is being purposely run down.
The credit risk concentration mainly lies with Van Lanschot in the Netherlands. Our foreign subsidiaries grant few loans. The limits depend entirely on the collateral provided and may change on a daily basis.
2.1.2 Credit management – policy and processesA high-quality loan portfolio requires strict credit management. Credit management is carried out at both individual loan and portfolio level. At the individual loan level, explicit attention is devoted to the management of unauthorised overdrafts and accounts past due. Loans with an elevated risk profile are subjected to a risk check. In addition, a portion of the portfolio is regularly reviewed and as part of this review the credit risk of individual clients is scrutinised. The frequency of the reviews varies according to the individual borrower’s risk profile, but they take place at least annually. In addition to the financial analysis, the review takes account of future developments in the client’s situation (partly in the light of relevant macroeconomic trends).
A deterioration in a client’s risk profile may lead to closer supervision, an adjusted rating, corrective measures (such as requiring additional collateral or increasing the frequency of financial reporting), involvement of the Restructuring & Recovery department or a combination of these measures. It may also lead to a stage transfer under IFRS 9 - see Section 2.9.
At portfolio level, credit risks are monitored on a monthly basis. A detailed credit risk report and any relevant developments or expected developments are discussed in the Credit Risk Policy Committee on a quarterly basis. Any negative trend identified in the risk profile of a particular client segment, sector or loan type can lead to the adjustment of the relevant lending policy. Trends in sectors where there is a concentration risk are monitored particularly closely.
If the review, risk check, payment arrears or external signals point to an increased risk of discontinuity, the Restructuring & Recovery department is involved in the credit management process. An estimate is made of the probability of continuity. Depending on the seriousness and magnitude of the problem, either monitoring or intensive supervision is applied. If there are objective indicators of impairment as referred to under the line item Impairments,
the Restructuring & Recovery department draws up an impairment proposal. On the basis of this proposal, the Impairment Committee determines the impairment.
Active management of past due loans enables potential problem loans to be identified at an early stage. If an individual assessment identifies an increased risk, the Restructuring & Recovery department will supervise the client. Increased credit risk occurs in the following situations:– If clients fail to meet their payment obligations (for
amounts > €250);– If clients report difficulties in meeting future payments,
e.g. because of a divorce, unemployment, etc.;– In the event of a default (see Section 2.1.3.1); – For business clients, in the event of a significant
decrease of turnover, breach of one or more covenants, a debt service coverage ratio < 1, etc.
The primary goal of the Restructuring & Recovery department is to migrate clients back to accounts with regular status (i.e. not under the supervision of Restructuring & Recovery) by reducing their credit risk. The aim is to do this in accordance with the loan agreements made with these clients, but forbearance measures are applied if necessary. More information on forborne exposures can be found in Section 2.2.
2.1.3 Credit risk measurementWe have developed internal models for measuring and monitoring credit risk for the majority of the loan portfolio. These internal models are also used to determine the required capital that has to be set aside for absorbing unexpected credit losses. For this reason, the models, the use of these models and the model governance have to adhere to strict requirements set out in the Capital Requirements Regulation (CRR).
The CRR distinguishes three approaches for determining the required capital for credit risk: the standardised approach (SA), the foundation internal ratings-based (F-IRB) approach, and the advanced internal ratings-based (A-IRB) approach.
The standardised approach prescribes a set of rules for determining the required capital based on various characteristics such as client type, loan type, collateral type, and external rating. Under F-IRB, banks are allowed to use internal estimates of the probability of default (PD) in determining the required capital. The credit conversion factors for determining the exposure at default (EAD) and the loss given default (LGD) are prescribed. Under A-IRB banks are allowed to use own estimates for PD, EAD and LGD. The PD is defined as the likelihood that a client will default within one year, the EAD is defined as the bank’s expected exposure at the time a client defaults, and the LGD is the expected loss percentage in the event that a client defaults. As a result, A-IRB is more risk-sensitive than F-IRB and SA.
We have approval from DNB to determine and report the required regulatory capital for a large proportion of our loan portfolio using internal ratings-based (IRB) methods. For these models, we have a model governance framework in place. As part of this, the performance of the models is periodically monitored, and these models are also periodically validated against independent models.
Risk management 107
As mentioned above, part of the portfolio is capitalised using the A-IRB and F-IRB methods. More specifically, the retail and non-retail exposures are capitalised under A-IRB and F-IRB, respectively. The retail portfolio comprises four sub-portfolios with the following exposures:– Mortgage exposures;– Qualifying revolving retail exposures up to €40,000;– Other retail exposures up to €2 million;– Small and medium-sized enterprises (SMEs) with total
exposures up to €1 million.
The PD models are mostly based on behavioural aspects of the client and the LGD models on the underlying collateral. For the capital calculations a so-called downturn LGD is applied, i.e. the expected loss at default during an economic downturn. Estimation of the EAD is based on the limit and credit utilisation.
The non-retail portfolio comprises four sub-portfolios with the following exposures:– Exposures to corporate clients; – Exposures exceeding €2,000,000 (excluding residential
mortgages) to natural persons;– Commercial real estate exposures;– Exposures to holding companies that are clients with
non-controlling interests and shareholdings.
For the first two sub-portfolios an internal PD model has been developed that uses behavioural and other client characteristics to estimate the PD. For commercial real estate exposures and exposures to holding companies the SA method has been used for capital calculations since the first half of 2018; prior to this the F-IRB method was used for these exposures.
IRB equity portfolioThe IRB equity portfolio includes our own positions in equities in the investment portfolio, subordinated receivables, non-controlling interests and shareholdings which appear on the company statement of financial position of Van Lanschot. We use the simple risk-weighted method to calculate the risk-weighted assets for positions in shares. In this method, a specific risk weighting (190%, 290% or 370%) is assigned to each position, based on a number of characteristics. A risk weighting of 250% is applied for significant investments in financial institutions that are not deducted from equity because they fall below the regulatory threshold. Positions taken in shares and subordinated loans of wholly owned subsidiaries are excluded from IRB. These are reported using the SA method.
Other loans and advances The risk-weighted assets of the other portfolios, like the debt securities in our investment portfolio managed by the Treasury department (i.e. excluding retail, non-retail and equity), are calculated on the basis of the standardised approach.
2.1.3.1 Definition of default and credit-impaired assetsA financial asset is credit-impaired when one or more events that have a detrimental impact on the estimated future cash flows have occurred:
– A breach of contract such as a 90 days past due event;– Significant financial difficulty of the issuer or the
borrower and the inability to meet future payments;– Concession(s) granted to the borrower that the lender
would not otherwise consider, relating to the borrower’s financial difficulty (forbearance);
– A growing likelihood that the borrower will enter bankruptcy or other financial restructuring;
– The disappearance of an active market for that financial asset because of financial market difficulties;
– The purchase or origination of a financial asset at a deep discount that reflects the incurred credit loss.
It may not be possible to identify a single discrete event; instead the combined effect of several events may have caused financial assets to become impaired. All impaired assets are also classified as defaulted by Van Lanschot Kempen under CRR rules. Van Lanschot Kempen has implemented one definition that serves for all the different purposes.
2.2 Forborne exposuresA loan is regarded as forborne if the borrower is unable to meet its contractual obligations vis-à-vis the bank and the bank then decides to make a concession to the client by modifying the terms and conditions of the loan agreement. The objective of this modification is to enable the borrower to meet the renewed obligations, and it would not have been offered if those circumstances had not arisen. Forbearance actions may include one or more of the following measures:– Amendment of the original terms and conditions of the
loan agreement with which the client is unable to comply due to financial difficulties, with a view to restoring the client’s payment capacity;
– Full or partial refinancing of a forborne exposure.
The purpose of the measures taken in forbearance situations is to maximise the chance of restoring the borrower’s payment capacity and to minimise the risk of losses due to having to write off all or part of the loan. The measures must offer the client an appropriate and sustainable solution enabling them to comply with the original obligations arising from the credit agreement in due course.
Application of forbearance measures is exclusively reserved for the Restructuring & Recovery department, which pursues a policy based on general principles that it translates to match the specific situation of the individual client. Given the nature of these loans, the Restructuring & Recovery department carries out intensive credit management. Before any new arrangements are agreed, a detailed analysis is made of the client, their financial situation and the likelihood of income recovery. The outcome of this analysis may have consequences for the client’s review frequency and the size of any loan loss provision to be made. If the client qualifies for appropriate forbearance measures, a proposal will be drawn up and submitted to the competent assessor(s) for approval.
In practice, forbearance measures do not always have the desired effect – i.e. the recovery of the client’s payment capacity or an end to the process of declining payment capacity. This may, for example, be the result of a further deterioration in the client’s financial circumstances or the failure of those circumstances to improve as expected.
Risk management 108

Such cases will be reanalysed and a strategy determined. However, the principle is explicitly maintained that the forbearance measure must be appropriate, sustainable and effective. Any new arrangements agreed with the borrower must also meet these strict criteria.
A forbearance situation ends when the “non-performing” status has no longer been applied to the loan for a probation period of two years. The non-performing status must last a minimum of one year starting from the last forbearance measure. The client must moreover have made significant and regular payments of interest and/or principal during at least half of the probation period. After expiry of the two-year probation period, no payments by the borrower may be in arrears for more than 30 days. If this condition is not met, the probation period will start again from the date the client is no longer in arrears for more than 30 days.
The recording and monitoring of loans which are subject to forbearance are carried out by the Restructuring & Recovery department. Each quarter, and where appropriate more frequently for specific loans, an individual assessment is carried out of forborne exposures in relation to any provision made. In addition to this quarterly assessment (as part of the provisioning process), these loans are subject to extensive credit risk management, the intensity and frequency of which will as far as possible match the specific circumstances of the loan.
Tables 2.2.A through 2.2.E show the total volume of forborne exposures. We apply several types of forbearance measures (see Table 2.2.A). Following the decision to apply such a measure, a loan remains under the supervision of the Restructuring & Recovery department until the forbearance situation has ended.
Risk management 109
Table 2.2.A Types of forborne exposure 31/12/2018 31/12/2017
Total 69,731 98,254
Repayments/reviews temporarily reduced/suspended 44,077 60,990
Provision of (temporary) additional funding (emergency loan) 16,269 22,658
Temporary reduction in interest rate or loan is made interest-free 9,087 12,796
Conditional and/or partial forgiveness of the loan 299 1,810
Table 2.2.B Movements in forborne exposures 2018 2017
At 1 January 98,254 116,558
New forborne exposures 16,074 24,624
Additions and repayments –52,489 –69,920
Assets no longer designated as forborne exposures –1,099 –4,591
Impairments 8,992 31,582
At 31 December 69,731 98,254
Table 2.2.C Forborne exposures by collateral at 31/12/2018
Balance outstanding
Mortgage collateral
Commercial real estate
Financial collateral
Total primary collateral
Secondary collateral and
unsecured loans
Total 69,731 7,072 24,707 23,020 54,799 14,933
Mortgage loans 3,368 3,368 – – 3,368 –
Current accounts 30,049 – – 23,020 23,020 7,029
Loans 36,314 3,703 24,707 – 28,410 7,904
Additions and repayments are related to clients that have a forborne exposure in place.
Tables 2.2.C and 2.2.D provide an insight into the underlying collateral of forborne loans. This breakdown is
based on the collateral used under Basel regulations, for which collateral is based on market values. The value in the Total primary collateral column is the lower of the subscription value or the value of the collateral.

Risk management 110
Table 2.3 Breakdown of loan portfolio byentity (excluding impairments) 31/12/2018 31/12/2017
Limit Utilisation Limit Utilisation
Total 9,346,945 8,674,307 9,602,824 9,223,727
Van Lanschot 8,927,953 8,306,871 9,212,836 8,907,759
Kempen 212,069 212,069 203,559 203,559
Other 206,923 155,366 186,428 112,409
2.2.1 Write-off policyWe write off loans immediately if there is sufficient certainty about the loss.
2.3 Breakdown of the loan portfolioWe adopt a cautious approach to granting unsecured loans. Our loan book mainly consists of loans to Private Banking clients (primarily loans secured by residential real estate), as well as a number of commercial real estate loans and investment portfolios. The remainder of the loan portfolio comprises consumer loans and private customised financing (other loans), which are solely intended for clients who have placed substantial funds with us. The mortgage loans also include Kempen Dutch Inflation Fund, a fund that invests in leasehold contracts primarily in connection with Dutch
residential real estate to create an investment in long-term inflation-linked cash flows. The Corporate Banking loan portfolio is being purposely run down. Corporate Banking loans are secured by real estate, receivables, and stocks and inventories.
New loan requests are assessed to determine if they are in line with our strategy and we adopt a conservative approach to granting them.
The credit risk concentration mainly lies with Van Lanschot. Our foreign subsidiaries grant few loans. The limits contain the revocable and irrevocable commitments and depend entirely on the collateral provided, and may change on a daily basis.
Table 2.2.E Forborne exposures by geographical area 31/12/2018 31/12/2017
Total 69,731 98,254
Netherlands 69,258 95,155
Belgium 101 1,347
Other 373 1,751
The geographical breakdown in Table 2.2.E is based on client locations.
Table 2.2.D Forborne exposures by collateral at 31/12/2017
Balance outstanding
Mortgage collateral
Commercial real estate
Financial collateral
Total primary collateral
Secondary collateral and
unsecured loans
Total 98,254 23,295 27,014 29,226 79,535 19,293
Mortgage loans 4,231 4,805 – – 4,805 –
Current accounts 44,978 – – 29,226 29,226 15,752
Loans 49,045 18,490 27,014 – 45,504 3,541
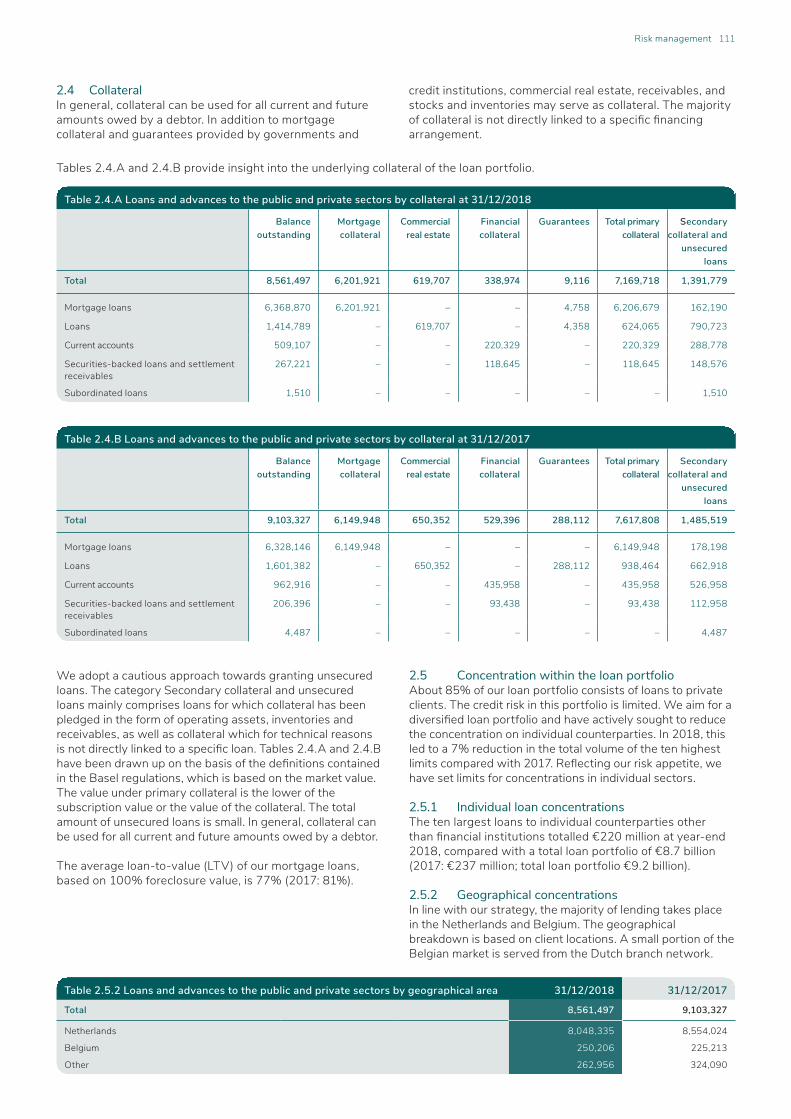
Risk management 111
We adopt a cautious approach towards granting unsecured loans. The category Secondary collateral and unsecured loans mainly comprises loans for which collateral has been pledged in the form of operating assets, inventories and receivables, as well as collateral which for technical reasons is not directly linked to a specific loan. Tables 2.4.A and 2.4.B have been drawn up on the basis of the definitions contained in the Basel regulations, which is based on the market value. The value under primary collateral is the lower of the subscription value or the value of the collateral. The total amount of unsecured loans is small. In general, collateral can be used for all current and future amounts owed by a debtor.
The average loan-to-value (LTV) of our mortgage loans, based on 100% foreclosure value, is 77% (2017: 81%).
2.5 Concentration within the loan portfolio About 85% of our loan portfolio consists of loans to private clients. The credit risk in this portfolio is limited. We aim for a diversified loan portfolio and have actively sought to reduce the concentration on individual counterparties. In 2018, this led to a 7% reduction in the total volume of the ten highest limits compared with 2017. Reflecting our risk appetite, we have set limits for concentrations in individual sectors.
2.5.1 Individual loan concentrationsThe ten largest loans to individual counterparties other than financial institutions totalled €220 million at year-end 2018, compared with a total loan portfolio of €8.7 billion (2017: €237 million; total loan portfolio €9.2 billion).
2.5.2 Geographical concentrationsIn line with our strategy, the majority of lending takes place in the Netherlands and Belgium. The geographical breakdown is based on client locations. A small portion of the Belgian market is served from the Dutch branch network.
Tables 2.4.A and 2.4.B provide insight into the underlying collateral of the loan portfolio.
Table 2.4.A Loans and advances to the public and private sectors by collateral at 31/12/2018
Balance outstanding
Mortgage collateral
Commercial real estate
Financial collateral
Guarantees Total primary collateral
Secondary collateral and
unsecured loans
Total 8,561,497 6,201,921 619,707 338,974 9,116 7,169,718 1,391,779
Mortgage loans 6,368,870 6,201,921 – – 4,758 6,206,679 162,190
Loans 1,414,789 – 619,707 – 4,358 624,065 790,723
Current accounts 509,107 – – 220,329 – 220,329 288,778
Securities-backed loans and settlement receivables
267,221 – – 118,645 – 118,645 148,576
Subordinated loans 1,510 – – – – – 1,510
Table 2.4.B Loans and advances to the public and private sectors by collateral at 31/12/2017
Balance outstanding
Mortgage collateral
Commercial real estate
Financial collateral
Guarantees Total primary collateral
Secondary collateral and
unsecured loans
Total 9,103,327 6,149,948 650,352 529,396 288,112 7,617,808 1,485,519
Mortgage loans 6,328,146 6,149,948 – – – 6,149,948 178,198
Loans 1,601,382 – 650,352 – 288,112 938,464 662,918
Current accounts 962,916 – – 435,958 – 435,958 526,958
Securities-backed loans and settlement receivables
206,396 – – 93,438 – 93,438 112,958
Subordinated loans 4,487 – – – – – 4,487
2.4 Collateral In general, collateral can be used for all current and future amounts owed by a debtor. In addition to mortgage collateral and guarantees provided by governments and
credit institutions, commercial real estate, receivables, and stocks and inventories may serve as collateral. The majority of collateral is not directly linked to a specific financing arrangement.
Table 2.5.2 Loans and advances to the public and private sectors by geographical area 31/12/2018 31/12/2017
Total 8,561,497 9,103,327
Netherlands 8,048,335 8,554,024
Belgium 250,206 225,213
Other 262,956 324,090

2.6 Encumbered and unencumbered assetsCertain items in the statement of financial position are classified as encumbered. Tables 2.6.A and 2.6.B provide insight into the financial assets treated as encumbered. These tables have been drawn up on the basis of carrying value.
Encumbered assets
Pledged as collateral:– Cash pledged to a counterparty bank or central clearing
party as security for obligations stemming from derivatives (CSA contracts);
– Investments in debt instruments pledged to DNB or counterparty banks in the context of repo transactions or for securities and derivatives clearing purposes;
– Securitised mortgage loans and receivables underlying debt instruments which have been pledged as collateral to DNB for transaction settlements or have been placed with institutional investors in the form of securitisation notes or covered bonds.
Other:– Statutory reserve deposits with central banks;– Reserve accounts of the Courtine and Covered Bond
entities to which we have no access.
Unencumbered assets
Eligible as collateral:– Investments in debt instruments which appear on the
ECB eligible list of marketable assets but are not classed as encumbered at the reporting date;
– Securitised mortgage loans and advances underlying debt instruments which are held by us and which appear on the ECB eligible list of marketable assets but are not classified as encumbered at the reporting date.
Not eligible as collateral:– All other cash and cash equivalents and balances at
central banks;– All other receivables from banks;– Debt and equity instruments which do not appear on
the ECB eligible list of marketable assets;– Securitised mortgage loans and advances underlying debt
instruments which are held by us and which do not appear on the ECB eligible list of marketable assets;
– All other loans and advances.
Risk management 112
Table 2.6.A Encumbered and unencumbered assets Encumbered assets Unencumbered assets 31/12/2018
Pledged as collateral
Other Eligible as collateral
Not eligible as collateral
Total
Total 2,356,409 33,319 1,838,506 8,855,683 13,083,916
Cash and cash equivalents and balances at central banks – 12,783 – 1,394,080 1,406,863
Due from banks 152,288 20,535 – 366,357 539,180
Financial assets at fair value through profit or loss – – 61,391 157,192 218,583
Financial assets at fair value through other comprehensive income 121,065 – 1,391,945 290,574 1,803,584
Loans and advances to the public and private sectors 1,753,444 – 160,573 6,647,480 8,561,497
Other financial assets at amortised cost 329,612 – 224,597 – 554,209
Table 2.6.B Encumbered and unencumbered assets Encumbered assets Unencumbered assets 31/12/2017
Pledged as collateral
Other Eligible as collateral
Not eligible as collateral
Total
Total 2,745,376 44,138 2,180,463 8,807,163 13,777,140
Cash and cash equivalents and balances at central banks – 12,877 – 1,819,874 1,832,751
Due from banks 74,089 31,261 – 81,109 186,459
Financial assets designated at fair value through profit or loss – – 202,918 191,980 394,898
Available–for–sale investments 17,666 – 1,519,839 200,850 1,738,355
Held–to–maturity investments 267,605 – 253,744 – 521,349
Loans and advances to the public and private sectors 2,386,015 – 203,962 6,513,350 9,103,327

Risk management 113
2.7 NettingoffinancialassetsandliabilitiesTables 2.7.A and 2.7.B show the netting of financial assets and liabilities. The right to net derivatives is laid down in a master netting agreement. For information about the netting criteria, please see “Summary of significant accounting principles”.
2.8 ImpairmentsWe recognise a loss allowance for expected credit losses (ECL) on financial assets measured at amortised cost or fair value through profit or loss, as well as for financial guarantees and loan commitments. When there is no significant deterioration in credit risk since initial recognition, ECL is recognised based on a 12-month expected credit loss (Stage 1). When a significant increase in credit risk has occurred, ECL is recognised based on a lifetime ECL (Stage 2). For impaired loans (Stage 3), a lifetime ECL is recognised.
Expected loss measurementWe measure expected credit losses by using a sophisticated approach and an alternative approach. In both these approaches, ECL reflects an unbiased probability-weighted amount that is determined by evaluating a range of possible outcomes, the time value of money, and reasonable and verifiable information that is available without undue cost or effort at the reporting date about past events, current conditions and forecasts of future economic conditions. Both approaches calculate a 12-month and a lifetime ECL for the exposures of all three stages. After the risk stage determination in the stage calculation, the relevant ECL is assigned:– 12-month ECL for Stage 1; – Lifetime ECL for Stage 2 and Stage 3.
The key elements of the ECL calculation are:– PD: The probability of default is an estimate of the
likelihood of default over a given time horizon. A default may only happen at a certain time over the assessed period if the facility has not been previously derecognised and is still in the portfolio.
– EAD: The exposure at default is an estimate of the exposure at a future default date, taking into account expected changes in the exposure after the reporting date, including repayments of principal and interest, whether scheduled by contract or otherwise, expected drawdowns on committed facilities, and accrued interest from missed payments.
– LGD: The loss given default is an estimate of the loss arising in the event of a default occurring at a given time. It is based on the difference between the contractual cash flows due and those that the lender would expect to receive, including from the realisation of any collateral. It is usually expressed as a percentage of EAD.
– LGN: The loss given non-cure is an estimate of the loss arising in the event of a default without cure occurring at a given time. It is based on the difference between the contractual cash flows due and those that the lender would expect to receive, including from the realisation of any collateral.
In addition to these four key elements, we incorporate forward-looking information for the sophisticated approach. We identify macroeconomic variables and consider three macroeconomic scenarios in calculating ECL:– A base-case scenario;– An upside scenario;– A downside scenario.
Table 2.7.A Netting of financial assets and liabilities 31/12/2018
Gross
Gross in the statement of
financial position
Net in the statement of
financial position
Related amounts not netted in the
statement of financial position Net
Derivatives (assets) 378,730 46,011 332,719 7,279 325,440
Derivatives (liabilities) 515,327 46,011 469,316 7,279 462,037
Table 2.7.B Netting of financial assets and liabilities 31/12/2017
Gross
Gross in the statement of
financial position
Net in the statement of
financial position
Related amounts not netted in the
statement of financial position Net
Derivatives (assets) 490,222 167,964 322,258 48,441 273,817
Derivatives (liabilities) 486,380 167,964 318,417 48,441 269,976

Risk management 114
Model Macroeconomic variables
PD calibration – Gross domestic product (GDP)– Volume of exports (EXP)
Cure rate – Total investments (TI)– Private consumption (PC)– Residential real estate price (RREP)– Government consumption (GC)
LGN – Gross domestic product (GDP)– Residential real estate price (RREP)
These scenarios are associated with different PDs, EADs and losses given non-cures (LGNs). Macroeconomic scenarios are generated based on inputs from CBS, DNB and Van Lanschot Kempen’s economic experts.
The reported ECL (12-month or lifetime, depending on the stage) is a weighted average of ECLs per macroeconomic scenario. The table below shows the macroeconomic variables used for the sophisticated approach.
Significant deterioration in credit riskTo determine the deterioration in credit risk of a financial instrument since initial recognition, we compare the current risk of default at the reporting date with the risk of default on initial recognition.
To calculate the lifetime probability of default (LPD) at origination and the LPD at reporting date, we use four PD models: private individuals, small and medium-sized enterprises, corporates, and commercial real estate. If the increase in LPD exceeds the designated threshold, the exposure is transferred to Stage 2 and the lifetime ECL is calculated. We use the following thresholds for the different PD models:
Private investments 0.8Small and medium-sized enterprises 0.9Corporates 1.3Commercial real estate 0.9
A backstop is applied and financial instruments that are materially overdrawn and more than 30 days past due are transferred from Stage 1 to Stage 2. If the financial instrument is credit-impaired, it is transferred to Stage 3.
Financial instruments following sophisticated approachFor the majority of financial instruments included in the line item Loans and advances to the public and private sectors, including mortgage loans, loans, current accounts, subordinated loans and financial guarantees and loan commitments, we apply a sophisticated approach to calculate ECL. This approach uses an umbrella model that combines the following submodels:– Various models that provide the expected flow of
exposures to the default state;– A probability of default (PD) calibration model giving the
flow from performing to default; – A full prepayment model and amortisation model giving
the outflow from the portfolio of an entire exposure due to prepayment or contract expiration;
– A migration model providing flows from performing rating classes to other performing rating classes;
– A cure rate model giving the flow from default to performing classes and the non-cure state;
– Various product-level models that give the expected exposure at the moment a client goes into default;
– An amortisation model showing the contractual payments during the lifetime of a product and the part of the exposure flowing out of the portfolio due to partial prepayments;
– An exposure at default (EAD) model giving the exposure as a function of the limit or outstanding amount just before default;
– A product-level model evaluating the part of EAD that may be lost – the loss given loss (LGL) model;
– A discount factor to discount the loss from the moment of default to the moment of reporting.
Financial instruments following alternative approachWe apply an alternative approach for cash and cash equivalents, due from banks, debt instruments at amortised cost, debt instruments at fair value through other comprehensive income, and loans and security-backed loans issued by the Belgian branch and F. van Lanschot Bankiers (Schweiz) AG. The alternative approach comprises an investments model and a foreign loan model.
Investments modelThe investments model is applied to calculate the ECL for cash and cash equivalents, due from banks, debt instruments at amortised cost, and debt instruments at fair value through other comprehensive income. These financial instruments all have a low risk profile. All such exposures are assigned to Stage 1 as long as their external rating is investment grade. We use a simplified model to calculate 12-month ECL, using publicly available data for PD and LGD based on external ratings. If financial assets are downgraded below investment grade, these assets will be sold.
Foreign loans modelFor the loans and securitised loans issued by the Belgian branch and F. van Lanschot Bankiers (Schweiz) AG, we have developed a foreign loans model. These two portfolios fall outside the scope of the IRB models and no requirements on historical data have been set. The foreign loan model calculates ECL as the sum of future exposure discounted at the effective interest rate at recognition for non-revolving products and the current effective interest rate for revolving products.

Risk management 115
The loss allowance for ECL on financial instruments and the macroeconomic variables used as at 31 December 2018 are described in the following section.
2.9 LossallowanceforexpectedcreditlossUnder the new IFRS 9 standard, effective from 1 January 2018, we recognise a loss allowance for expected
credit losses (ECL) on financial instruments. We have calculated the ECL by using IFRS 9 models as at 31 December 2018. The table below shows the ECL loss allowances and the corresponding book values, categorised by balance sheet line item and ECL by stage, as at 1 January 2018 and 31 December 2018.
Loss allowances for ECL change over time for several reasons: the credit risk of financial instruments may significantly increase or decrease, financial instruments may become credit-impaired or new financial assets may be
originated. The following tables explain the changes in the loss allowances during the year and the loss allowance recognised in the statement of income.
Table 2.9 Loss allowance for expected credit loss
31/12/2018 01/01/2018
Book value (excluding impairments)
Expected credit loss Book value (excluding impairments)
Expected credit loss
Total 13,837,572 113,675 14,344,947 133,411
Cash and cash equivalents and balances at central banks
1,406,864 0 1,832,751 0
Due from banks 539,180 0 186,459 0
Financial assets at fair value through other comprehensive income 1,803,584 544 1,716,354 663
Loans and advances to the public and private sectors 9,295,388 112,811 9,839,368 131,520
Other financial assets at amortised cost 554,242 34 521,349 28
Financial guarantees and loan commitments 238,313 286 248,667 1,200
Movements in impairments of Financial assets at fair value through other comprehensive income
Stage 1 Stage 2 Stage 3 Total
At 1 January 2018 663 – – 663
Additions or releases without transfer –269 – – –269
New financial assets originated or purchased 150 – – 150
Total through profit or loss 544 – – 544
At 31 December 2018 544 – – 544
Movements in impairments of Loans and advances to the public and private sectors
Stage 1 Stage 2 Stage 3 Total
At 1 January 2018 4,390 12,186 114,944 131,520
Additions or releases without transfer –1,509 –3,676 –7,753 –12,938
Transfer to Stage 1 435 –5,278 –420 –5,263
Transfer to Stage 2 –607 7,403 –1,480 5,316
Transfer to Stage 3 –27 –2,014 7,503 5,462
New financial assets originated or purchased 1,009 – – 1,009
Total through profit or loss 3,691 8,621 112,794 125,105
Amounts written off – – –12,295 –12,295
At 31 December 2018 3,691 8,621 100,499 112,811
In 2018, there were no material recalibrations of PD, LGD, LGN or EAD.

Risk management 116
All financial instruments included in the line items Cash and cash equivalents and balances at central banks, Due from banks and Debt instruments at amortised cost are classified in Stage 1, and no transfers have taken place.
Credit qualityVan Lanschot Kempen allocates each exposure to a credit risk grade based on a variety of data that are determined to be predictive of the risk of default, and applying experienced
credit judgement. Credit risk grades are defined using qualitative and quantitative factors that are indicative of risk of default. These factors vary depending on the nature of the exposure and the type of borrower.
We use internally developed rating pools for the line items Loans and advances to the public and private sectors and Financial guarantees and loan commitments.
All financial instruments under the line items Cash and cash equivalents, Due from banks, Debt instruments at amortised cost and Debt instruments at fair value through
other comprehensive income are investment grade, which means their external rating is at least BBB. We use external ratings for these line items.
The credit quality of the line items Loans and advances to the public and private sectors and Financial guarantees and loan commitments is shown in the following tables.
Assessment of credit quality is based on our internal credit rating system and year-end stage classification. The amounts presented are gross of impairment allowances.
Movements in impairments of Financial guarantees and loan commitments
Stage 1 Stage 2 Stage 3 Total
At 1 January 2018 89 223 888 1,200
Additions or releases without transfer –52 –41 –806 –899
Transfer to Stage 1 35 –140 – –105
Transfer to Stage 2 –2 56 – 55
Transfer to Stage 3 – –0 0 0
New financial assets originated or purchased 36 – – 36
Total through profit or loss 106 98 82 286
At 31 December 2018 106 98 82 286
Credit grade Description
Investment grade Non-credit-impaired financial assets that are not placed under the supervision of the Restructuring & Recovery department, internal rating pool 1
Standard monitoring Non-credit-impaired financial assets that are not placed under the supervision of the Restructuring & Recovery department, internal rating pools 2 to 4
Special monitoring Non-credit-impaired financial assets that are placed under the supervision of the Restructuring & Recovery department, internal rating pools 1 to 4
Default Credit-impaired financial assets
Credit grade External rating
Investment grade AAA - BBB–
Standard monitoring BB+ - B–
Special monitoring CCC - C
Default DDD - D

Risk management 117
Credit quality of Loans and advances to the public and private sectors
Stage 1 Stage 2 Stage 3 Total
Credit grade
Investment grade 7,559,491 – – 7,559,491
Standard monitoring – 1,244,681 – 1,244,681
Special monitoring – 154,980 – 154,980
Default – – 336,236 336,236
Gross carrying amount 7,559,491 1,399,661 336,236 9,295,388
Loss allowance 3,691 8,621 100,499 112,811
Carrying amount 7,555,801 1,391,040 235,737 9,182,578
Credit quality of Financial guarantees and loan commitments Stage 1 Stage 2 Stage 3 Total
Credit grade
Investment grade 224,716 – – 224,716
Standard monitoring – 9,166 – 9,166
Special monitoring – 1,160 – 1,160
Default – – 3,271 3,271
Gross carrying amount 224,716 10,326 3,271 238,313
Loss allowance 106 98 82 286
Carrying amount 224,610 10,227 3,189 238,026
Macroeconomic variables As at 31 December 2018 As at 1 January 2018
2019 2020 2021 2018 2019 2020
Gross domestic product
Base-case scenario 2.80% 2.00% 2.00% 2.33% 3.53% 2.73%
Upside scenario 4.26% 3.46% 3.46% 3.81% 5.01% 4.21%
Downside scenario 0.16% –0.64% –0.64% –0.83% 0.37% –0.43%
Volume of export
Base-case scenario 2.94% 3.54% 3.84% 4.83% 5.63% 4.83%
Upside scenario 4.62% 5.22% 5.52% 7.35% 8.15% 7.35%
Downside scenario –0.08% 0.52% 0.82% –0.56% 0.24% –0.56%
Total investments
Base-case scenario 7.91% 6.11% 6.11% 4.03% 6.83% 4.03%
Upside scenario 17.28% 15.48% 15.48% 8.63% 11.43% 8.63%
Downside scenario –8.98% –10.78% –10.78% –5.80% –3.00% –5.80%
Private consumption
Base-case scenario 2.92% 1.92% 1.82% 2.28% 2.78% 2.28%
Upside scenario 4.00% 3.00% 2.90% 3.23% 3.73% 3.23%
Downside scenario 0.98% –0.02% –0.12% 0.23% 0.73% 0.23%
Residential real estate price
Base-case scenario 9.63% 6.13% 3.43% 4.70% 7.90% 6.00%
Upside scenario 12.70% 9.20% 6.50% 7.46% 10.66% 8.76%
Downside scenario 4.09% 0.59% –2.11% –1.20% 2.00% 0.10%
Government consumption
Base-case scenario 1.20% 2.60% 2.00% 2.71% 3.31% 2.71%
Upside scenario 1.19% 2.59% 1.99% 2.38% 2.98% 2.38%
Downside scenario 1.22% 2.62% 2.02% 3.40% 4.00% 3.40%
Macroeconomic variablesWe incorporate forward-looking information for the sophisticated approach. We use macroeconomic variables and consider three macroeconomic scenarios in calculating
ECL: a base scenario, an upside scenario, and a downside scenario. The table below shows the macroeconomic variables used for the sophisticated approach as at 1 January 2018 and 31 December 2018.

Risk management 118
Collateral credit-impaired financial instrumentsIn general, collateral can be used for all current and future amounts owed by a debtor. In addition to mortgage collateral and guarantees provided by governments and credit institutions, commercial real estate, receivables, and stocks and inventories may serve as collateral. The majority of collateral is not directly linked to a specific financing
arrangement. For credit-impaired financial assets, the Restructuring & Recovery account manager determines the liquidation or recovery value of the available collateral, based on the most recent valuation reports. The table below shows the collateral for financial assets considered credit-impaired.
3.2 Van Lanschot market risk: treasury To a limited degree, Van Lanschot Treasury is also exposed to market risk. These risks stem from its treasury activities (mainly foreign exchange exposure, comprising client transactions and own positions). The majority of transactions and positions in the statement of financial
position are denominated in euros. Exchange rate risk is managed within the required limits and an authorisation structure applies. Foreign exchange positions are shown in Table 3.2.B and include all cash, forward and option positions of the entities in scope of consolidation.
No impairment is recognised for credit-impaired financial instruments if the collateral is sufficient to cover the outstanding obligation. The total carrying amount of credit-impaired financial instruments for which there is no impairment recognised is €135.6 million.
3. Market riskMarket risk is the risk of loss as a result of changes in market variables, including interest rates, exchange rates and share prices. Other variables not directly observable in the market, such as volatility and correlations, can also influence the value of financial instruments. The market risk to which we are exposed can be divided into two components: the market risk to which Van Lanschot is exposed in respect of its necessary market maintenance and services to clients, and the market risk stemming from trading activities in institutional securities; this latter risk is concentrated at Kempen.
3.1 Kempen market risk: trading activities in securitiesOur trading activities in securities, mainly comprising equities and equity derivatives, are concentrated at Kempen. A governance structure has been created to facilitate effective risk management. The risks are managed using value at risk (VaR) limits as well as gross and net
limits. Daily stress tests provide information about changes in portfolio values in extreme market conditions and complement the VaR calculation. The VaR for the trading portfolios is computed daily, based on a one-day time horizon with a 97.5% confidence interval on one year of historical data. The continued validity of the assumptions underlying the VaR computation is regularly tested using back-testing. Other risks relating to derivatives are expressed in “the Greeks” (e.g. Delta, Vega, Rho) and are separately monitored on a daily basis or more frequently if necessary. Separate limits are in place for all risk drivers. VaR and other relevant risk parameters are reported to senior management (including two Executive Board members) on a daily basis. Lastly, market risks are also generated by investments in Kempen’s management book (€69.1 million; 2017: €61.3 million). These investments provide seed capital to newly launched Kempen Capital Management funds and are held with a trading intent. Financial markets were relatively calm in 2018, which led to generally lower levels of volatility. On the derivatives side, this resulted in lower VaR usage, with mostly constant trading volumes. That situation changed in the final two months of the year, however, as the markets became very volatile indeed and VaR usage reflected these swings.
Collateral for credit-impaired assets
Gross exposure Impairment Carrying amount Value of collateral
Loans and advances to public and private sectors 336,236 100,499 235,737 276,418
Financial guarantees and loan commitments 3,271 82 3,189 2,275
Table 3.1 VaR of Kempen trading activities 2018 2017
Derivatives-related Share-related Derivatives-related Share-related
VaR at 31 December 445 314 180 49
Highest VaR 576 439 474 233
Lowest VaR 169 55 56 49
Average VaR 293 144 144 140

Risk management 119
The capital adequacy requirement for exchange rate risk was €0.05 million at year-end 2018 (2017: €0.2 million). This amounts to 8% of the net open positions in each currency (2017: 8%).
In addition, some market risk exposure results from investments made in Van Lanschot’s management book. The current exposure in this portfolio is €20.2 million (2017: €30.1 million). Credit spread risk in the banking book (CSRBB) is the risk of volatility in earnings and/or equity, caused by spread movements in the swap curve, for banking book instruments that are classified at fair value.
For Van Lanschot, CSRBB is mainly concentrated in the investment and liquidity portfolios. CSRBB limits have been imposed on these portfolios, which are monitored by ALCO on a monthly basis.
3.3 Marketrisk:interestrateandshare-relatedinstrumentsWe use the maturity method to calculate the capital adequacy requirement in respect of the general risk on debt instruments in the trading portfolio. Share-related instruments are share instruments included under Financial assets from trading activities (see Table 3.3).
Weighting and requirements We use the standardised approach for all types of market risk. The market risk of interest rate derivatives is included under Market risk: interest rate-related instruments; the market risk of share-related derivatives is included under Market risk: share-related instruments; and the market risk of currency derivatives is included under Market risk: currency-related instruments.
4. Operational riskOperational risks are potential losses that result from inadequate or failed internal processes, systems, inadequate or incorrect human actions, external events and fraud. Within Van Lanschot Kempen, operational losses are classified using the operational loss event types as set out in the Basel framework. Managing operational risks is the responsibility of the line management (the first line of defence); this also includes the responsibility for information security and business continuity.
We have created a range of instruments for identifying, evaluating, monitoring and managing operational risks to support the bank’s management in their roles as risk owners.
– Operational risk appetite: This appetite defines the level of – quantitative and qualitative – operational risk we are willing to accept. Exceeding this appetite requires the attention of the Executive Board and will lead to additional mitigation measures as necessary.
– Risk identification and classification via risk self-assessments and scenario analysis:
• Risk self-assessment is a tool that allows line managers to systematically identify and assess risks so that steps can be taken to limit any unacceptable risks. Risk self-assessments are carried out, at tactical (department) level, on processes and on our most important programmes and projects. These assessments are re-performed periodically in order to reassess and update the existing operational risk level.
• Scenario analyses are used to enhance insight into our (prospective) operational risk profile and thus improve existing risk controls. The results of these analyses also serve as a means to provide insight into the adequacy of the Pillar 1 capital requirement vis-à-vis the operational risk profile.
Table 3.2.B Foreign exchange positions (€1,000) 31/12/2018 31/12/2017
Total –179 1,915
US dollar 79 1,450
Pound sterling 77 85
Swiss Franc –104 –31
Danish krone –501 –1
Other 270 412
Table 3.3 Market risk 31/12/2018 31/12/2017
Risk weighting Capital adequacy requirement
Risk weighting Capital adequacy requirement
Total 325,017 26,001 225,718 18,057
Market risk: interest-related instruments 229,589 18,367 147,155 11,772
Market risk: share-related instruments 94,804 7,584 76,675 6,134
Market risk: currency-related instruments 625 50 1,888 151
Table 3.2.A Exchange rate risk of treasury trading activities (total gross nominal foreign exchangeposition translated to €1,000)
2018 2017
At 31 December 99 1,794
Highest position 1,794 5,243
Lowest position 59 57
Average position 250 1,513

Risk management 120
– Risk response: Management is responsible for deciding how to treat the risk, and whether to mitigate, accept or transfer (insure) it:
• Action tracking: Action tracking is used to track progress made in the delivery of actions to mitigate identified risks, arising from risk self-assessments, analysis of incidents or complaints, findings by Group Audit and external regulators, and other relevant events;
• Control effectiveness monitoring: To ensure that the most important risks (the key risks) are mitigated sufficiently, key controls have been defined; these are assessed on a regular basis to determine their effectiveness.
• Risk insurance: To protect the organisation against major operational risk-related losses, we have taken out insurance policies that cover claims and losses resulting from the services offered. Broadly, these policies are a combination of fraud and professional liability insurance, directors’ liability insurance and various other liability and accident insurance policies. In 2016 a cyber risk policy was added to our insurance coverage. This policy provides liability and damage cover for cyber risk events.
– Risk monitoring: • Incident management: Risks that materialise
through an incident are registered in our database via the incident management process. For severe incidents, root cause analyses are carried out. The incidents database allows the systematic recording and analysis of losses resulting from operational risks. It contains information about losses incurred as a result of operational risks in prior years and forms the foundation of the operational risk management measurement system for Van Lanschot and Kempen. A total of 187 incidents entailing a loss of more than €1,000 were logged in the database in 2018 (2017: 156 incidents).
• Risk measurement: This is based on key risk indicators (early warnings), which highlight trends and/or provide prospective information about operational risks.
• Risk meetings: Periodical meetings with risk owners are held to monitor the development of the risk profile in relation to the risk appetite.
Information securityInformation security contributes to the protection of client and corporate information. Both automated and manual information processing are carried out. Taking the right measures on the basis of targeted risk analyses of business and IT processes ensures that both our client data and corporate data are adequately protected.
Business continuityBusiness continuity analyses are carried out as part of our business continuity management process in order to gain insight into critical processes and the resources that are needed to ensure continuity of service and address potential threats. Embedding business continuity management in the organisation is essential to give the bank sufficient resilience against the impact of an incident or disaster. Business continuity therefore has universal scope within the bank; it comprises policies, standards and procedures aimed at safeguarding the critical processes or enabling a restart within a specified timeframe in the event of a disaster. The objective is to keep any financial,
reputational and/or other material damage to a minimum, both for us and for our clients. Procedures are tested on a regular basis, with tests of fallback procedures and crisis governance carried out every year.
5. Settlement risk We are required to hold capital for financial transactions that are not settled within five days of the agreed deadline, if the difference between the agreed settlement price and the price at the reporting date could lead to a loss.
At year-end 2018, financial transactions totalling €171 million (2017: €227 million) had to be reported in the context of settlement risk.
6. CVA riskUnder the Capital Requirements Regulation (CRR), account must also be taken of the risk-weighted assets in relation to credit valuation adjustment (CVA), which must be adequate to cover the risk of a deterioration in the creditworthiness of the counterparty in an OTC derivatives transaction. This CVA capital adequacy requirement is additional to requirements applying to the risk-weighted assets in relation to the “regular” default risk. We use the SA method to calculate the capital requirement for CVA.
7. Strategic risk Strategic risk can be defined as the threat to our results or equity resulting from failure to respond (adequately) to changes in environmental factors, or from incorrect strategic decisions. Environmental factors include the actions of competitors, clients, potential market entrants and public authorities.
8. Interest rate riskInterest rate risk is the exposure of the banking book to adverse market interest rate movements. Adverse interest rate movements may impact a bank’s current and/or future earnings, capital and market value. Interest rate risks in non-banking book items are managed as part of market risk.
Our main source of interest rate risk is the interest maturity mismatch between mortgages and loans on the one hand and savings and other funding sources on the other. In general, assets have longer fixed-rate terms than liabilities, especially in the current low interest rate environment, in which clients show a distinct preference for long fixed-rate terms for mortgages. In measuring our interest rate risk exposure, we model client behaviour with respect to the prepayment patterns of mortgages and loans and the interest rate risk profiles of savings and current accounts. After the interest rate risk resulting from maturity mismatches, customer behaviour risk is our most important source of interest rate risk, as actually observed client behaviour may deviate from assumptions. Differences between assumed and actually observed client behaviour could have a material adverse impact on future results.
We manage interest rate risk according to our interest rate risk in the banking book (IRRBB) policy. Responsibility for IRRBB management has been delegated by the Executive Board to the Asset & Liability Committee (ALCO). We pursue a prudent interest rate risk policy that aims to mitigate the effect of prospective interest rate movements which could reduce future net interest income, while balancing the costs of hedging activities on current earnings.

Risk management 121
Essentially, then, we manage interest rate risk from both a long- and a short-term perspective. The short-term interest rate risk is addressed mainly from a net interest income perspective (delta net interest income, or ΔNII ). This involves an analysis of the interest income under a number of market interest rate scenarios, relative to the baseline scenario. In 2018, all ΔNII scenarios remained within risk
appetite limits. By December 2018, the most adverse scenario was one in which market rates fall by 100 basis points over the next twelve months, with Van Lanschot Kempen being unable to reduce savings rates sufficiently below the “natural floor” of zero per cent. Table 8.A shows the interest rate risk metrics.
The long-term interest rate risk is addressed by using the economic value approach, which looks at how movements in interest rates impact the value of the bank’s assets and liabilities. The main metric used in the economic value analysis is duration of equity. The duration of the bank’s equity indicates the net impact of parallel interest rate changes on its economic value. In 2018, duration of equity was controlled by ALCO within a bandwidth of two to three years. The duration of two years at year-end 2018 implies the economic value of equity would fall by €27.1 million if there were a parallel rise of 100 basis points in interest rates. In the event of a parallel fall in interest rates of 100 basis points, the value of equity would rise by €28.3 million. At year-end 2017, this sensitivity was €44.5 million. The full value of this impact cannot be directly linked to the statement of financial position or income statement, as economic value movements in our banking book are not necessarily reported through profit or loss or equity. Any value movements are expected to materialise over time in the income statement, if interest rates develop as indicated by forward rates and no corrective management actions are assumed.
In assessing interest rate risk, we aim to minimise the impact of differences in accounting classifications, as these should not result in different income statement impacts from rate changes. Hence, parallel yield curve shift scenarios have virtually no impact on the result on financial transactions, because all investments designated at fair value through profit or loss are hedged using derivatives (see Note 4, Derivatives), for which market value changes are represented under the result on financial transactions. Hedge accounting is applied to offset changes in the market value of derivatives that are used for hedging portfolios classified at amortised cost.
9. Liquidity riskThe main objective of our liquidity risk management is to ensure that the bank is able to maintain or generate sufficient cash resources to meet its payment obligations in full as they come due, on acceptable terms. As materialising liquidity risk could theoretically jeopardise a bank’s continuity, our tolerance for liquidity risk is classified as low. One of the key elements of our approach towards liquidity risk management is to maintain stakeholder confidence in the bank’s solidity at all times. The policy for measuring, managing and controlling liquidity risk within Van Lanschot Kempen is set out in our liquidity risk policy document, which is updated annually.
The main source of liquidity risk that we are exposed to relates to the share of client deposits in our funding base. Although client deposits have proven to be relatively price-inelastic and sticky over time, the withdrawable nature of such deposits poses potential outflow risks, especially for those deposits not covered by the deposit guarantee scheme (DGS).
The roll-over risk with respect to maturing capital market funding is becoming less substantial for us. This is mainly due to the run-off of the Corporate Banking loan book, which reduces the reliance on funding sources other than client deposits. We consider client deposits a natural and stable funding source.
To manage liquidity risks, we use a forward-looking liquidity risk framework that enables the comprehensive measurement, evaluation and calibration of indicators related to liquidity risk. The framework consists of the risk appetite statement, the liquidity buffer, monitoring and reporting, forecasting, funding planning and contingency planning.
Limits for liquidity risk are revised on an annual basis as part of the risk appetite statement. Limits set include, but are not limited to, levels of the liquidity coverage ratio, the net stable funding ratio and stress test survival periods, which are reported on a monthly basis to ALCO. The liquidity buffer is the main defensive element against liquidity risk, and the quality and size of the buffer are monitored frequently, together with in- and outflows in the client deposit base. Finally, each year we outline our capital and funding planning for a two to five-year horizon, both under regular circumstances in the capital and funding plan, and under potential future stress or emergency situations in the liquidity contingency plan, complemented by the recovery plan. In 2018, the funding ratio was 106.2% (2017: 100.5%).
Part of our liquidity and funding planning is scenario analysis, of which stress testing is a key element. By means of stress testing, we assess our resilience to a variety of adverse liquidity events – Van Lanschot Kempen-specific events, system-wide events, and a combination of these two.
9.1 Contractualmaturity Tables 9.1.A and 9.1.B show the assets and liabilities based on their remaining contractual terms to maturity at the reporting date, without taking behavioural aspects into account.
Table 8.A Interest rate risk metrics 31/12/2018 31/12/2017
Delta net interest income (ΔNII) –4.3% –3.4%
Duration of equity (years) 2 3

Risk management 122
These amounts correspond with the amounts included in the consolidated statement of financial position. Items with no maturity, such as equity instruments, assets and liabilities classified as held for sale and provisions, are presented separately.
Derivative liabilities are included on a net basis if cash flows are settled net. For other derivative liabilities the contractual gross cash flow payable is included.
As savings and current accounts do not have fixed terms, the balances of non-maturity instruments are presented within the withdrawable on demand category.
Due from banks and amounts due to banks include collateral delivered and received related to derivative transactions. Allocation of this collateral over the maturity buckets is conducted in accordance with the maturity classification of the derivative contracts.
1 Includes Property and equipment, Goodwill and other intangible assets, Tax assets and Other assets as presented in the consolidated statement of financial position.2 Includes Provision, Tax liabilities and Other liabilities as presented in the consolidated statement of financial position.
Table 9.1.A Contractual maturity of assets and liabilities at 31/12/2018
Withdrawable on demand
< 3 months 3 to 12 months
1 to 5 years More than 5 years
Sub-total Maturity not applicable
Total
Assets
Cash and cash equivalents and balances at central banks 1,406,864 – – – – 1,406,864 – 1,406,864
Financial assets from trading activities – – – – – – 62,468 62,468
Due from banks 104,659 1,881 274,307 90,308 68,025 539,180 – 539,180
Derivatives – 8,593 71,495 194,529 58,102 332,719 – 332,719
Financial assets at fair value through profit or loss 70,281 – 15,475 92,893 – 178,649 39,934 218,583
Financial assets at fair value through other comprehensive income – 160,596 298,103 946,555 398,330 1,803,584 – 1,803,584
Loans and advances to the public and private sectors 847,804 52,108 101,379 314,691 7,245,515 8,561,497 – 8,561,497
Other financial assets at amortised cost – – 122,416 431,792 – 554,209 – 554,209
Investments in associates using the equity method – – – – – – 54,071 54,071
Assets classified as held for sale – – – – – – 68,058 68,058
Other assets1 – 96,189 26,555 24,709 – 147,453 231,321 378,775
Total assets 2,429,609 319,366 909,730 2,095,479 7,769,971 13,524,155 455,852 13,980,007
Total assets excluding derivatives 2,429,609 310,774 838,235 1,900,950 7,711,869 13,191,436 455,852 13,647,288
Equity and liabilities
Financial liabilities from trading activities – 333 – – – 333 – 333
Due to banks 37,951 460 250,551 24,420 21,520 334,902 – 334,902
Public and private sector liabilities 8,611,831 75,948 83,702 236,066 83,392 9,090,939 – 9,090,939
Derivatives – 10,183 88,272 252,885 117,975 469,316 – 469,316
Financial liabilities at fair value through profit or loss – 14,285 145,879 599,668 180,530 940,361 – 940,361
Issued debt securities – – – 1,020,635 500,869 1,521,504 – 1,521,504
Liabilities held for sale – – – – – – 20,871 20,871
Other liabilities2 – 60,332 70,055 – – 130,387 29,725 160,112
Subordinated loans – – – – 173,473 173,473 – 173,473
Equity – – – – – – 1,268,195 1,268,195
Total equity and liabilities 8,649,783 161,541 638,458 2,133,675 1,077,759 12,661,215 1,318,792 13,980,007
Total equity and liabilities excluding derivatives 8,649,783 151,358 550,186 1,880,789 959,784 12,191,900 1,318,792 13,510,691
On-balance gap –6,220,174 157,825 271,272 –38,196 6,692,212 862,940 –862,940 –

Risk management 123
Table 9.1.B Contractual maturity of assets and liabilities at 31/12/2017
Withdrawable on demand
< 3 months 3 to 12 months
1 to 5 years More than 5 years
Sub-total Maturity not applicable
Total
Assets
Cash and cash equivalents and balances at central banks 1,832,751 – – – – 1,832,751 –
1,832,751
Financial assets from trading activities – – – – – – 38,234 38,234
Due from banks 40,145 99,089 – 36,263 10,962 186,459 – 186,459
Derivatives – 37,199 41,309 191,361 52,388 322,258 – 322,258
Financial assets at fair value through profit or loss – 9,089 5,055 212,481 23,743 250,368 144,530 394,898
Available-for-sale investments – 61,354 177,248 1,026,251 451,501 1,716,354 22,001 1,738,355
Held-to-maturity investments – – – 521,349 – 521,349 – 521,349
Loans and advances to the public and private sectors 1,261,194 10,797 35,101 217,139 7,579,096 9,103,327 – 9,103,327
Investments in associates using the equity method – – – – – – 70,390 70,390
Other assets1 – 105,712 38,056 25,228 – 168,996 281,857 450,853
Total assets 3,134,090 323,241 296,769 2,230,073 8,117,690 14,101,862 557,013 14,658,875
Total assets excluding derivatives 3,134,090 286,042 255,460 2,038,711 8,065,302 13,779,604 557,013
14,336,617
Equity and liabilities
Financial liabilities from trading activities – 1,899 – – – 1,899 – 1,899
Due to banks 46,163 55,482 – – – 101,645 – 101,645
Public and private sector liabilities 8,519,793 101,482 51,637 302,125 170,082 9,145,119 – 9,145,119
Derivatives – 34,077 30,484 171,762 82,094 318,417 – 318,417
Financial liabilities at fair value through profit or loss 417 2,172 73,989 686,561 208,314 971,453 – 971,453
Issued debt securities – – – 925,490 1,486,181 2,411,671 – 2,411,671
Other liabilities2 – 67,453 94,359 7,849 – 169,661 23,085 192,746
Subordinated loans – – – – 166,802 166,802 – 166,802
Equity – – – – – 1,349,123 1,349,123
Total equity and liabilities 8,566,373 262,564 250,471 2,093,787 2,113,472 13,286,667 1,372,208 14,658,875
Total equity and liabilities excluding derivatives 8,566,373 228,487 219,986 1,922,025 2,031,379 12,968,250 1,372,208 14,340,458
On-balance gap –5,432,283 60,677 46,298 136,286 6,004,217 815,195 –815,195 –
1 Includes Property and equipment, Goodwill and other intangible assets, Tax assets and Other assets as presented in the consolidated statement of financial position.2 Includes Provision, Tax liabilities and Other liabilities as presented in the consolidated statement of financial position.
Major differences can be seen in the gaps, because the assets comprise many long-term mortgage loans while the liabilities comprise many short-term deposits. Potential liquidity risks are addressed by means of monthly stress tests – discussed monthly in ALCO – that test the bank’s resilience to a variety of adverse liquidity events, and taking behavioural aspects into account.

Risk management 124
9.2 Contractualmaturitiesofundiscountedcashflowoffinancialliabilities
Tables 9.2.A and 9.2.B show liabilities by maturity based on contractual, undiscounted cash flows and including related future cash flows, such as interest payments. Repayments
which are subject to notice are treated as if notice were to be given immediately. However, we expect that many clients will not request repayment at the earliest possible date, and the tables below do not reflect the expected cash flows as indicated by our deposit retention history.
10. Securitisation riskWe treat securitisation as an asset class in our investment portfolio as well using it as a funding tool. We are not party to any synthetic securitisations and have no trading position in securitisations.
FundingWe do not structure securitisations for other entities and have no other role in our own securitisations other than as seller and servicer and, in some cases, back-to-back swap provider. As we use residential mortgage-backed securities (RMBS) only as one of the available funding tools (placed or retained), there is no obligation to use the originated mortgages in securitisation transactions. In cases when RMBS was used as a funding tool, no significant risk
transfer has been achieved since only the most senior notes were placed with investors. As these securitisations are accounted for as funding transactions, there is no recognition of gains on the sale/placement of the transactions. No hedges are used to mitigate the risk of retained RMBS, and the exposure of the underlying mortgages of retained and placed RMBS thus remain on our balance sheet. There are no liquidity risks connected to the RMBS transactions. The RMBS transactions are rated by Standard & Poor’s and Fitch Ratings. Retained RMBS can be used as collateral and form a contingent liquidity buffer.
InvestmentsPart of our liquidity investment portfolio is invested in RMBS. We invest only in the most senior tranches of RMBS
Table 9.2.A Contractual maturities of undiscounted cash flow of liabilities at 31/12/2018
Withdrawable on demand
< 3 months 3 to 12 months
1 to 5 years More than 5 years
Total
Financial liabilities from trading activities – 333 – – – 333
Due to banks 2,153 36,258 250,096 24,420 21,520 334,447
Public and private sector liabilities 8,650,343 63,444 97,941 243,156 102,221 9,157,105
Derivatives 333,349 10,035 15,998 49,842 60,091 469,316
Financial liabilities at fair value through profit or loss – 15,753 147,330 605,548 181,793 950,423
Issued debt securities – 6,250 2,374 1,049,877 517,500 1,576,001
Of which bond loans and notes – – – – – –
Of which covered bond – 6,250 1,375 1,029,125 517,500 1,554,250
Of which notes as part of securitisation transactions – – – – – –
Of which floating-rate notes – – 999 20,752 – 21,751
Subordinated loans – 956 8,954 39,639 253,268 302,818
Total undiscounted liabilities 8,985,845 133,029 522,692 2,012,482 1,136,393 12,790,442
Table 9.2.B Contractual maturities of undiscounted cash flow of liabilities at 31/12/2017
Withdrawable on demand
< 3 months 3 to 12 months
1 to 5 years More than 5 years
Total
Financial liabilities from trading activities – 1,899 – – – 1,899
Due to banks 9,529 26,234 1,810 40,310 24,840 102,723
Public and private sector liabilities 8,648,322 39,027 71,441 358,072 120,901 9,237,762
Derivatives 188,350 8,837 19,748 49,230 52,252 318,417
Financial liabilities at fair value through profit or loss – 5,437 78,563 695,270 212,282 991,553
Issued debt securities – 6,250 1,037,133 555,933 1,023,750 2,623,066
Of which bond loans and notes – – 595,026 – – 595,026
Of which covered bond – 6,250 1,375 530,500 1,023,750 1,561,875
Of which notes as part of securitisation transactions – – 439,563 – – 439,563
Of which floating-rate notes – – 1,168 25,433 – 26,601
Subordinated loans – 956 8,954 39,639 264,088 313,638
Total undiscounted liabilities 8,846,201 88,639 2,252,407 1,244,511 2,204,364 13,589,057

Risk management 125
transactions that qualify as high-quality liquid assets in assessing the liquidity coverage ratio. This means that the credit quality of the investments should have at least two ratings from an external credit assessment institution (ECAI).
As the investments are part of the liquidity buffer, they can be used as collateral, in repo transactions, or sold if necessary.
Risk exposures within the investment portfolio The credit risks of the investments are not hedged. Our investment portfolio as a whole is monitored by the Treasury and Credit Risk Approval departments on a daily basis.
ManagementInterest rate risk is limited, as RMBS are typically floating-rate notes. Interest rate risk is monitored at balance sheet level and includes the investment portfolio. We use the IRB methodology to calculate the total risk exposure of RMBS investments.
11. Compliance risk Van Lanschot Kempen and its subsidiaries fulfil a role as service providers to the public, a role that we can only play to the full if we enjoy the trust of every stakeholder. Our integrity and that of our employees forms the basis for that trust. The Compliance department provides a strong safeguard by ensuring that integrity is embedded in our operations, while the statutory and regulatory rules provide the framework. Within that framework, we have translated the main rules and regulations into requirements for processes and procedures. To enable these requirements to be met, Compliance organises regular training and awareness-raising sessions for staff, monitors compliance with the statutory and regulatory rules, and proposes improvements where necessary.
Failure to comply with the statutory and regulatory rules can lead to significant reputational or financial damage. The Compliance department, which reports directly to the Chairman of the Statutory Board, is responsible for ensuring that the bank’s boards, senior management and employees comply with regulations and legislation.
12. Financial reporting riskThe Statutory Board is responsible for devising and implementing an adequate system of internal control for our financial reporting. The system is designed to provide reasonable assurance as to the reliability of financial reporting and that the financial statements are prepared in accordance with generally accepted accounting principles and applicable legislation and regulations.
We have the following tools in place to manage financial reporting risks:– Periodic management reports and KPI dashboards,
accompanied by analysis of financial and non-financial figures and trends;
– A risk and control framework describing processes and procedures, and setting out primary controls such as authorisations and segregation of duties;
– The findings from the review of the functioning of the internal control system by Group Audit, which are discussed with the Executive Board, the Statutory Board, the Audit and Compliance Committee and the Supervisory Board;
– The Van Lanschot Kempen Accounting Manual, which sets out the principles we pursue with respect to financial accounting;
– Assessment and approval of the annual report by the Statutory Board and discussion of this by the Audit and Compliance Committee and by the Supervisory Board.
The Statutory Board states with reasonable assurance that the internal risk management and control systems for financial reporting are performed at an adequate level and that our financial reporting is free of material misstatement. The management teams of the relevant divisions have provided the Statutory Board with in-control statements on the extent of internal control, based on the results of testing procedures for the risk and control framework, the risks reported on a quarterly basis, the follow-up of these risks, and the incidents reported. Group Risk Management and Compliance have evaluated these statements.

Table 13.1.A Financial instruments at fair value at 31/12/2018
Level 1 Level 2 Level 3 Total
Assets
Financial assets from trading activities 58,119 3,877 472 62,468
Derivatives 42,640 279,941 10,138 332,719
Financial assets at fair value through profit or loss 156,658 40,782 21,143 218,583
Financial assets at fair value through other comprehensive income 1,803,584 – – 1,803,584
Total assets 2,061,001 324,600 31,753 2,417,354
Liabilities
Financial liabilities from trading activities 333 – – 333
Derivatives 39,879 420,796 8,641 469,316
Financial liabilities at fair value through profit or loss – 912,465 27,896 940,361
Total liabilities 40,212 1,333,261 36,537 1,410,010
Risk management 126
13. Fair value 13.1 FinancialassetsatfairvaluethroughprofitorlossA portion of the financial instruments are measured at fair value in the statement of financial position. Tables 13.1.A, 13.1.B and 13.1.C provide a breakdown of these instruments into three levels. The fair value is based either on quoted prices in active markets, inputs other than quoted prices that are observable in the market, or inputs based on data not observable in the market.
We have developed a policy on the criteria for allocating financial instruments recognised in the statement of financial position at fair value to each of the three levels. A review is carried out at the end of each reporting period to determine whether any changes have taken place in the hierarchy between the levels.
Level 1: Quoted prices in active marketsThe fair value of financial instruments traded in an active market is based on the price at the reporting date (market price). The bid price is applied for financial assets and the offer price for financial liabilities. Since these instruments are traded in an active market, their prices adequately reflect current and frequent market transactions between unrelated parties.
Level 2: Inputs observable in the marketsThe fair value of financial instruments not traded in an active market (e.g. over-the-counter financial derivatives) is established using cash flow and option valuation models. Using estimates, we make assumptions based on the market conditions (observable data) at the reporting date.
The estimated present value of future cash flows is used to determine the fair value of the other financial instruments. The fair value of interest rate swaps is calculated as the present value of estimated future cash flows. The discount rate is the same as the market interest rate at the reporting date for a similar instrument subject to the same conditions, taking into account collateral furnished under credit support annexes (CSAs).
The fair value of forward currency contracts is calculated by reference to forward exchange rates at the reporting date.
Estimates and judgements made are based on past experience as well as other factors, including expectations with respect to future events that could reasonably occur given current circumstances. Estimates and judgements are assessed on an ongoing basis.
Level3:SignificanceofunobservablemarketdataThe financial instruments in this category are assessed on an individual basis. Their valuation is based on the best estimate of management by reference to the most recent prices, prices of similar instruments and, to a not insignificant extent, information not observable in the market. Unobservable inputs may include volatility, correlation, seasonality and credit spreads. A valuation technique is used in which at least one input that has a significant effect on the instrument’s valuation is not based on observable market data. A significant effect on the instrument’s valuation is considered to be present when the unobservable input accounts for at least 10% of the total instrument’s fair value and exceeds a threshold of €50,000. The effect of fair value adjustments on the instrument’s valuation is included in the assessment.

Risk management 127
Table 13.1.B Financial instruments at fair value at 01/01/20181
Level 1 Level 2 Level 3 Total
Assets
Financial assets from trading activities 35,553 2,561 119 38,234
Derivatives 33,779 285,225 3,254 322,258
Financial assets at fair value through profit or loss 295,120 47,207 74,572 416,899
Financial assets at fair value through other comprehensive income 1,716,354 – – 1,716,354
Total assets 2,080,807 334,993 77,945 2,493,745
Liabilities
Financial liabilities from trading activities 1,882 – 17 1,899
Derivatives 33,113 284,929 375 318,417
Financial liabilities at fair value through profit or loss – 947,541 23,912 971,453
Total liabilities 34,995 1,232,471 24,303 1,291,769
Table 13.1.C Financial instruments at fair value at 31/12/2017
Level 1 Level 2 Level 3 Total
Assets
Financial assets from trading activities 35,553 2,561 119 38,234
Derivatives 33,779 285,225 3,254 322,258
Financial assets at fair value through profit or loss 295,120 47,207 52,571 394,898
Available-for-sale investments 1,716,354 – 22,001 1,738,355
Total assets 2,080,807 334,993 77,945 2,493,745
Liabilities
Financial liabilities from trading activities 1,882 – 17 1,899
Derivatives 33,113 284,929 375 318,417
Financial liabilities at fair value through profit or loss – 947,541 23,912 971,453
Total liabilities 34,995 1,232,471 24,303 1,291,769
1 This table includes the new presentation requirements related to the application of IFRS 9 as from 1 January 2018.
TransfersoffinancialassetsorliabilitiesbetweenlevelsWe have developed a policy document for the fair value hierarchy. This divides the variables used into observable and unobservable market inputs. If the unobservable input variables are significant, the instrument is classified as Level 3. An unobservable input variable is significant if the change in the fair value due to the application of the variable is greater than the set threshold values. Our policy is to recognise transfers into and out of fair value hierarchy levels at the end of the reporting period.
In 2018, our valuation technique remained unchanged, with non-observable input variables being assessed on significance. As a result of this assessment, some financial instruments included in Derivatives (assets and liabilities) and in Financial liabilities at fair value through profit or loss have been transferred from Level 2 to Level 3 and vice versa. The Derivatives receivables and payables and Financial liabilities at fair value through profit or loss were
transferred to Level 2 as a result of the input variables’ correlation and seasonality; the shorter remaining term to maturity of these financial instruments meant that these input variables qualified as non-significant, justifying a transfer to Level 2. In the case of Derivatives (assets), this entailed a transfer of €1.0 million from Level 2 to Level 3 and a transfer of €0.1 million from Level 3 to Level 2. In the case of Financial liabilities at fair value through profit or loss, it involved a transfer of €1.1 million from Level 3 to Level 2. The transfer of Derivatives (liabilities) includes a €4.1 million shift from Level 3 to Level 2.
Breakdownofmovementsinfinancialassetsand liabilitiesclassifiedunderLevel3 Tables 13.1.D and 13.1.E provide a breakdown of the movements in all financial assets and liabilities classified as Level 3 items and recognised at fair value in the statement of financial position.

Table 13.1.D Breakdown of movements in financial liabilities classified as Level 3 in 2018
At 1 January To statement of income
To equity1 Issues Settlements Transfers At 31 December
Assets
Financial assets from trading activities 119 –3 – 450 –95 – 472
Derivatives 3,254 –562 6,516 –7 938 10,138
Financial assets at fair value through profit or loss 74,572 184 – 404 –54,019 – 21,143
Total assets 77,945 –380 – 7,371 –54,121 938 31,753
Liabilities
Financial liabilities from trading activities 17 – – – –17 – –
Derivatives 375 930 – 4,552 –183 2,968 8,641
Financial liabilities at fair value through profit or loss 23,912 –666 – 4,650 – – 27,896
Total liabilities 24,303 263 – 9,202 –200 2,968 36,537
Total assets - liabilities 53,642 –644 – –1,832 –53,921 –2,030 –4,784
Table 13.1.E Breakdown of movements in financial liabilities classified as Level 3 in 2017
At 1 January To statement of income
To equity2 Issues Settlements Transfers At 31 December
Assets
Financial assets from trading activities 33 2 – 95 –11 – 119
Derivatives 4,085 90 – – –784 –138 3,254
Financial assets at fair value through profit or loss 5,311 –2,240 – 49,500 – –
52,571
Available-for-sale investments 39,423 9,165 –5,395 5,262 –26,455 – 22,001
Total assets 48,852 7,018 –5,395 54,858 –27,250 –138 77,945
Liabilities
Financial liabilities from trading activities 5 – – 17 –5 – 17
Derivatives 1,242 –343 – 143 –27 –641 375
Financial liabilities at fair value through profit or loss 32,825 1,029 – – – –9,942 23,912
Total liabilities 34,072 686 – 160 –32 –10,583 24,303
Total assets - liabilities 14,780 6,331 –5,395 54,698 –27,218 10,446 53,642
1 The changes in value recognised in equity are included in the statement of comprehensive income as Revaluation of financial assets at fair value through other comprehensive income.
2 The changes in value recognised in equity are included in the statement of comprehensive income as Revaluation of equity instruments and Revaluation of debt instruments.
Risk management 128
Table 13.1.F Fair value changes recognised in profit or loss of financial instruments classified as Level 3
2018 2017
Realised Unrealised Total Realised Unrealised Total
Net interest income 109 – 109 1,971 – 1,971
Income from securities and associates –3 –476 –479 6,502 –2,240 4,263
Result on financial transactions – –274 –274 – –596 –596
Impairments – – – 3,191 –2,497 694
Total 106 –750 –644 11,664 –5,333 6,331

Table 13.1.G Notes on fair value determination using unobservable market inputs (Level 3)
Fair value Valuation method Significance of observable market inputs2
Assets 31/12/2018 01/01/2018 31/12/2017
Financial assets from trading activities – Face valueShares, unlisted 472 119 119 – Net asset value – Net asset value
Derivatives
Structured product derivatives
– Options1 5,508 244 244 – Option model – Volatility – Correlation
– Equity swaps1 3,803 3,010 3,010 – Discounted cash flow model
– Option model
– Volatility– Correlation
– Equity forwards1 827 – – – Option model – Correlation
Financial assets at fair value through profit or loss Debt instruments: company cumprefs (shareholdings) (FVPL mandatory)1
7,042 10,850 – – Discounted cash flow model
– Interest rate– Discount rates
Shares, unlisted 7,437
1,905
2,783
1,976
54,435
7,013
528
1,746
52,571
–
–
–
– Net asset value
– Net asset value
– Net asset value
– Net asset value
– Most recent published net asset values of the underlying assets
– Kempen: Cost or lower market value– Net asset value– Market value– Multiple analyses of comparable
companies less a discount for illiquidity and company size based on EVCA guidelines
– Most recently known share price – EBITA– Issue or transfer price– Market price on final trading day– Face value less provisions
Available-for-sale investments
Debt instruments: company cumprefs (shareholdings)
– – 10,850 – Discounted cash flow model
– Interest rate– Discount rates
Shares, unlisted – – 1,864 – Net asset value – Most recent published net asset values of the underlying assets
– Kempen: Cost or lower market value
Shareholdings – – 7,013 – Net asset value – Net asset value– Market value
– – 528 – Net asset value – Multiple analyses of comparable companies less a discount for illiquidity and company size based on EVCA guidelines
– Most recently known share price– – 1,746 – Net asset value – EBITA
– Issue or transfer price– Market price on final trading day– Face value less provisions
Total assets 31,753 77,945 77,945
Liabilities
Financial liabilities from trading activities
Shares, unlisted – 17 17 – Net asset value – Net asset value – Face value
DerivativesStructured product derivatives
– Credit-linked swaps 2 183 183 – Discounted cash flow model
n/a
– Options1 7,111 – – – Option model – Volatility– Correlation
– Equity swaps1 1,528 48 48 – Discounted cash flow model
– Option model
– Volatility– Correlation
– Equity forwards – 143 143 – Option model – Correlation
Financial liabilities at fair value through profit or loss
Structured debt instruments1 27,896 23,912 23,912 – Discounted cash flow model
– Option model
– Volatility– Correlation
Total liabilities 36,537 24,303 24,303
Risk management 129
1 Please refer to Tables 13.1.H and 13.1.I for the range and sensitivity of these financial instruments. No range or sensitivity information is available for the other financial instruments.
2 The significance of unobservable market inputs only relates to 2018.

Table 13.1.H Notes on range and sensitivity of unobservable market inputs (Level 3) at 31/12/2018
Significant unobservable market inputs Range (weighted average)
Sensitivity
Assets
Derivatives
Structured product derivatives
– Options – Correlation –17% – 20% (1%) Total impact –€0.4m
– Volatility 10% – 13% (12%) Total impact €1.0m
– Equity swaps – Correlation –21% – 30% (2%) Total impact €0.0m
– Volatility 10% – 13% (12%) Total impact €0.2m
– Equity forwards – Correlation –10% – 12% (1%) Total impact –€0.1m
Financial assets at fair value through profit or loss
Debt instruments: company cumprefs (shareholdings)
– Interest rates –7% – 12% (9%) Change of 1%/change of €0.1m
– Discount rates –7% – 12% (9%) Change of 1%/change of €0.1m
Liabilities
Derivatives
Structured products derivatives
– Options – Correlation –21% – 30% (1%) Total impact €1.5m
– Volatility 10% – 13% (12%) Total impact €0.4m
– Equity swaps – Correlation –21% – 25% (2%) Total impact –€0.1m
– Volatility 9% – 13% (12%) Total impact €1.8m
Financial liabilities at fair value through profit or loss
Structured debt instruments – Correlation –19% – 25% (3%) Total impact €0.1m
– Volatility –9% – 13% (11%) Total impact €0.1m
Table 13.1.I Notes on range and sensitivity of unobservable market inputs (Level 3) at 31/12/2017
Significant unobservable market inputs Range (weighted average)
Sensitivity
Assets
Derivatives
Structured products derivatives
– Options – Volatility 8% – 18% (13%) Total impact €0.2 million
Available–for–sale investments
Debt instruments: company cumprefs (shareholdings)
– Interest rates –5% – 13% (9%) Change of 1%/change of €0.1m
– Discount rates –8% – 13% (9%) Change of 1%/change of €0.1m
Liabilities
Derivatives
Structured products derivatives
– Equity forwards – Correlation –9% – 9% (0%) Total impact €0.0 million
Risk management 130

Table 13.2 Financial instruments not recognised at fair value
31/12/2018 01/01/2018 31/12/2017 Level Valuation method Significant observable and unobservable market inputs
Fair value Carrying amount
Fair value Carrying amount
Fair value Carrying amount
Assets
Due from banks 538,910 539,180 186,461 186,459 186,461 186,459 2 Discounted cash flows using applicable money market rates
Interest rate and discount rate
Held-to-maturity investments
– – – – 552,183 521,349 1 Quoted prices in active markets
–
Loans and advances to the public and private sectors
8,794,997 8,561,497 9,291,007 9,092,207 9,291,007 9,103,327 3 Discounted cash flows using current market fees for comparable loans and taking into account the creditworthiness of the counterparty
Interest rate, discount rate and counterparty credit risk
Other financial assets at amortised cost
576,970 554,209 552,183 521,349 – – 1 Quoted prices in active markets
–
Liabilities
Due to banks 334,902 334,902 101,084 101,645 101,084 101,645 2 Discounted cash flows using applicable money market rates for liabilities
Interest rate and discount rate
Public and private sector liabilities
9,165,416 9,090,939 9,196,050 9,145,119 9,196,050 9,145,119 3 Discounted cash flows using applicable money market rates for liabilities with a comparable term to maturity, taking account of own credit risk
Interest rate, discount rate and own credit risk
Issued debt securities
1,532,823 1,521,504 2,445,114 2,411,671 2,445,114 2,411,671 1 Quoted prices in active markets
Interest rate and discount rate
Subordinated loans 184,108 173,473 225,634 173,620 225,634 166,802 3 Discounted cash flows using applicable money market rates for debt instruments with a comparable term to maturity, taking account of own credit risk
Interest rate, discount rate and own credit risk
Risk management 131
13.2 Financial instruments not recognised at fair valueTable 13.2 shows the carrying amount and fair value of financial instruments not recognised at fair value, with the exception of line items Cash and cash equivalents and balances at central banks, Other assets and Other liabilities. For these financial instruments the carrying amount is a reasonable approximation of the fair value.
The value of financial instruments not recognised at fair value is taken as the amount for which the instrument could be exchanged in a commercial transaction between willing parties, other than in a forced or liquidation sale. If there is an active market, we use the market value to determine the fair value. For financial instruments for which no market prices are available, the fair values shown in Table 13.2 are estimated on the basis of the present value or using other estimation or valuation methods.

Reconciliation with consolidated statement of cash flows 2018 2017 Movements
Cash and cash equivalents 1,406,864 1,832,751 –425,887
Due from banks, available on demand 104,659 40,145 64,515
Due to banks, available on demand –37,951 –46,163 8,212
Due from/to banks, available on demand, net 66,708 –6,018 72,726
Total 1,473,572 1,826,733 –353,161
1. Cash and cash equivalents and balances at central banks 31/12/2018 01/01/2018 31/12/2017
Total 1,406,864 1,832,751 1,832,751
Cash 38 43 43
Balances at central banks 1,283,903 1,724,927 1,724,927
Statutory reserve deposits at central banks 12,783 12,877 12,877
Amounts due from banks 110,139 94,903 94,903
Impairments –0 –0 –
Notestotheconsolidatedstatementoffinancialposition132
NOTES TO THE CONSOLIDATED STATEMENT OF FINANCIAL POSITION (€1,000)
Statutory reserve deposits comprise balances at central banks within the scope of the minimum reserves requirement. We cannot use these balances in our day-to-day operations.
2. Financial assets from trading activities 31/12/2018 01/01/2018 31/12/2017
Total 62,468 38,234 38,234
Debt instruments
Structured debt instruments 3,877 2,561 2,561
Total debt instruments 3,877 2,561 2,561
Equity instruments
Shares, listed 58,119 35,553 35,553
Shares, unlisted 472 119 119
Total equity instruments 58,590 35,673 35,673
Deposits include deposits to a total of €152.3 million (2017: €74.1 million) which serve as collateral for liabilities arising from derivatives transactions.
3. Due from banks 31/12/2018 01/01/2018 31/12/2017
Total 539,180 186,459 186,459
Deposits 172,824 135,352 135,352
Receivables arising from unsettled securities transactions 104,659 40,145 40,145
Reverse repo transactions 250,000 – –
Loans and advances 11,697 10,962 10,962
Impairments –0 –0 –

Notestotheconsolidatedstatementoffinancialposition133
4. Derivatives
At 31 December 2018 Asset Liability Contract amount
Total 332,719 469,316 12,396,497
Derivatives used for trading purposes
Currency derivatives 93 92 17,499
Equity derivatives 309 107 416
Client option positions 42,547 39,787 39,787
Total derivatives used for trading purposes 42,949 39,986 57,701
Derivatives used for hedge accounting purposes
Derivatives: fair value hedge accounting 56,804 56,580 2,844,430
Derivatives: portfolio fair value hedge accounting 1,077 36,341 2,380,000
Derivatives:cashflowhedgeaccounting – 18,247 100,000
Total derivatives used for hedge accounting purposes 57,881 111,168 5,324,430
Other derivatives
Economic hedges 4,766 6,085 243,547
Structured product derivatives 227,122 312,076 6,400,818
Total other derivatives 231,888 318,161 6,644,365
At 31 December 2017 Asset Liability Contract amount
Total 322,258 318,417 10,055,326
Derivatives used for trading purposes
Interest rate derivatives 397 1,047 30,468
Currency derivatives 212 200 9,080
Equity derivatives 1,143 – 62,468
Client option positions 33,567 32,913 33,391
Total derivatives used for trading purposes 35,320 34,159 135,407
Derivatives used for hedge accounting purposes
Derivatives: fair value hedge accounting 52,665 58,046 2,946,905
Derivatives: portfolio fair value hedge accounting 10,988 15,243 2,015,000
Derivatives:cashflowhedgeaccounting 663 14,131 100,000
Total derivatives used for hedge accounting purposes 64,316 87,421 5,061,905
Other derivatives
Economic hedges 11,300 24,972 524,576
Structured product derivatives 211,321 171,864 4,333,438
Total other derivatives 222,622 196,837 4,858,014
We use derivatives for both trading and hedging purposes.
Note 4, Derivatives shows both the positive and negative market values of the derivatives, as well as their notional values.
The following types of interest rate derivatives are used:– Interest rate swaps;– Interest rate options.
The following types of currency derivatives are used:– Currency options;– FX forwards.
The following types of equity derivatives are used:– Equity forwards;– Futures;– Long and short structured product options;– Equity swaps.
Inflation-linkedswapsandswaptionsarealsoused.

Notestotheconsolidatedstatementoffinancialposition134
Weuseinterestrateswapsandinflation–linkedswapsashedging instruments in our hedge accounting.
The total ineffectiveness of fair value hedges at year-end 2018 was €0.2 million (2017: €0.7 million), comprising €29.7 million in negative value changes in hedging instruments (2017: €3.2 million negative) and positive changes in the value of the hedged items of €29.5 million (2017: €3.9 million).
Ineffectiveness of derivatives for hedge accounting purposes
31/12/2018 01/01/2018 31/12/2017
Fair value Ineffective Fair value Ineffective Fair value Ineffective
Total –53,287 –221 –23,104 652 –23,104 652
Fair value hedge accounting model –1,031 49 –5,381 876 –5,381 876
Portfolio fair value hedge accounting model –35,264 –270 –4,255 –224 –4,255 –224
Cashflowhedgeaccountingmodel –18,247 – –13,468 – –13,468 –
Hedged items in cash flow hedge accounting by term at 31/12/2018
Within 1 year 1 to 3 years 3 to 5 years 5 years and longer
Total – – – –13,509
Cashinflow – – – –
Cashoutflow – – – –13,509
Hedged items in cash flow hedge accounting by term at 31/12/2017
Within 1 year 1 to 3 years 3 to 5 years 5 years and longer
Total – – – –9,825
Cashinflow – – – –
Cashoutflow – – – –9,825
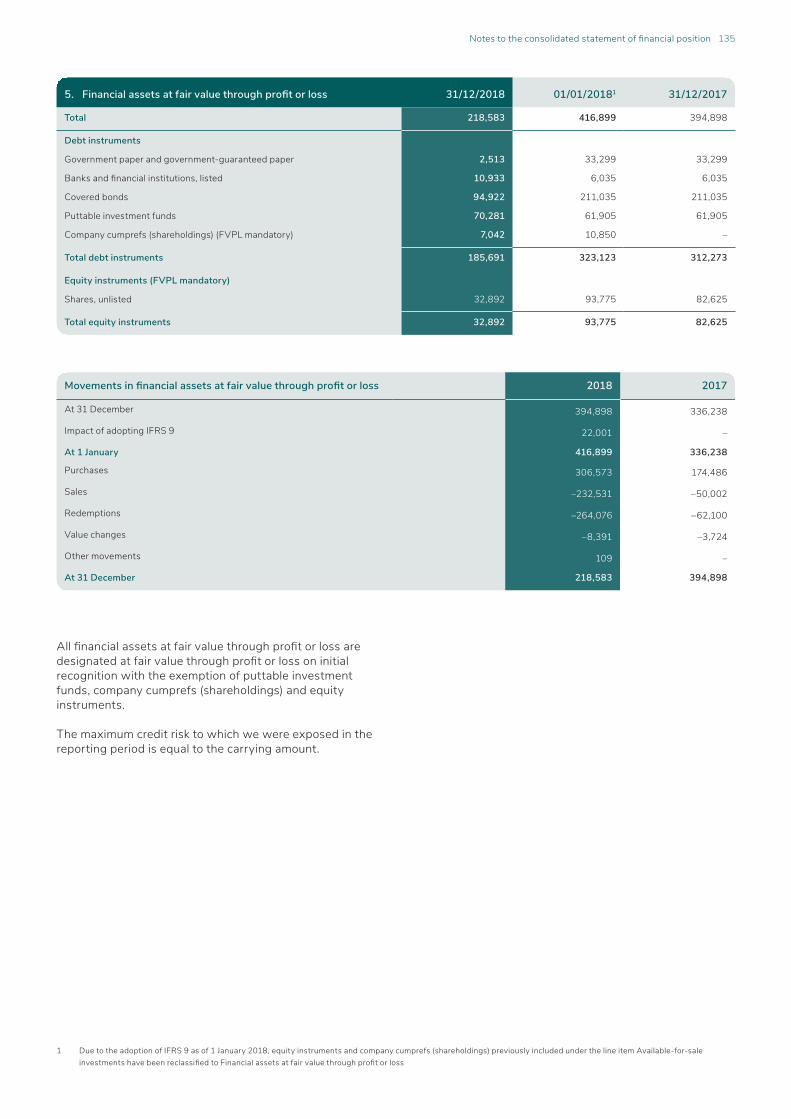
Notestotheconsolidatedstatementoffinancialposition135
Movements in financial assets at fair value through profit or loss 2018 2017
At 31 December 394,898 336,238
Impact of adopting IFRS 9 22,001 –
At 1 January 416,899 336,238
Purchases 306,573 174,486
Sales –232,531 –50,002
Redemptions –264,076 –62,100
Value changes –8,391 –3,724
Other movements 109 –
At 31 December 218,583 394,898
5. Financial assets at fair value through profit or loss 31/12/2018 01/01/20181 31/12/2017
Total 218,583 416,899 394,898
Debt instruments
Government paper and government-guaranteed paper 2,513 33,299 33,299
Banksandfinancialinstitutions,listed 10,933 6,035 6,035
Covered bonds 94,922 211,035 211,035
Puttable investment funds 70,281 61,905 61,905
Company cumprefs (shareholdings) (FVPL mandatory) 7,042 10,850 –
Total debt instruments 185,691 323,123 312,273
Equity instruments (FVPL mandatory)
Shares, unlisted 32,892 93,775 82,625
Total equity instruments 32,892 93,775 82,625
1 Due to the adoption of IFRS 9 as of 1 January 2018, equity instruments and company cumprefs (shareholdings) previously included under the line item Available-for-sale investmentshavebeenreclassifiedtoFinancialassetsatfairvaluethroughprofitorloss
Allfinancialassetsatfairvaluethroughprofitorlossaredesignatedatfairvaluethroughprofitorlossoninitialrecognition with the exemption of puttable investment funds, company cumprefs (shareholdings) and equity instruments.
The maximum credit risk to which we were exposed in the reporting period is equal to the carrying amount.

Notestotheconsolidatedstatementoffinancialposition136
6. Financial assets at fair value through other comprehensive income 31/12/2018 01/01/2018 31/12/2017
Fair value Face value Fair value Face value Fair value Face value
Total 1,803,584 1,798,601 1,716,354 1,703,564 – –
Debt instruments
Government paper and government- guaranteed paper 372,453 369,943 233,271 229,854 – –
Sovereign, supranationals and agencies (SSA) bonds 44,205 44,000 68,819 69,000 – –
Banksandfinancialinstitutions,listed 36,332 36,000 142,865 141,000 – –
Covered bonds 843,168 842,281 570,938 568,828 – –
Asset-backed securities 497,760 496,727 668,105 662,377 – –
Companies, listed 9,666 9,650 32,357 32,505 – –
Total debt instruments 1,803,584 1,798,601 1,716,354 1,703,564 – –
Movements in gross carrying amount of Financial assets at fair value through other comprehensive income Stage 1
At 1 January 1,703,564
Additions or releases without transfer –853,654
Newfinancialassetsoriginatedorpurchased 948,691
At 31 December 1,798,601
Movements in Financial assets at fair value through other comprehensive income 2018 2017
At 31 December – –
Impact of adopting IFRS 9 1,716,356 –
At 1 January 1,716,356 –
Purchases 1,001,047 –
Sales –579,312 –
Redemptions –329,760 –
Value changes –2,165 –
Other movements –2,582 –
At 31 December 1,803,585 –
Due to the adoption of IFRS 9 as of 1 January 2018, debt instruments excluding company cumprefs (shareholdings) previously included under the line item Available-for-sale investmentshavebeenreclassifiedtoFinancialassetsatfair value through other comprehensive income.
Thelossallowanceforfinancialassetsatfairvaluethroughother comprehensive income is recognised in Other comprehensive income and does not reduce the carrying amountofthefinancialasset.

Notestotheconsolidatedstatementoffinancialposition137
Movements in available-for-sale investments 2018 2017
At 1 January – 1,680,036
Purchases – 863,432
Sales – –626,765
Redemptions – –181,884
Share premium (discount) of debt instruments – –2,852
Value changes – 1,366
Impairments – 3,051
Other movements – 1,972
At 31 December – 1,738,355
8. Held-to-maturity investments 31/12/2018 01/01/2018 31/12/2017
Carrying amount Face value Carrying
amount Face value Carrying amount Face value
Total – – – – 521,349 490,000
Debt instruments
Government paper and government-guaranteed paper – – – – 324,723 300,000
Banksandfinancialinstitutions,listed – – – – 196,627 190,000
Total debt instruments – – – – 521,349 490,000
7. Available-for-sale investments 31/12/2018 01/01/2018 31/12/2017
Fair value Face value Fair value Face value Fair value Face value
Total – – – – 1,738,355 1,715,453
Debt instruments
Government paper and government-guaranteed paper – – – – 302,090 298,854
Banksandfinancialinstitutions,listed – – – – 142,865 141,000
Covered bonds – – – – 570,938 568,828
Asset-backed securities – – – – 668,105 662,377
Companies, listed – – – – 32,357 32,505
Company cumprefs (shareholdings) – – – – 10,850 11,889
Total debt instruments – – – – 1,727,204 1,715,453
Equity instruments
Shares, unlisted – – 1,864
Shareholdings – – 9,287
Total equity instruments – – 11,151
Due to the adoption of IFRS 9 as of 1 January 2018, debt instruments excluding company cumprefs (shareholdings) havebeenreclassifiedasFinancialassetsatfairvaluethrough other comprehensive income and equity instruments
andcompanycumprefs(shareholdings)reclassifiedasFinancialassetsatfairvaluethroughprofitorloss.

Notestotheconsolidatedstatementoffinancialposition138
Weacquirednofinancialornon-financialassetsduringtheyear through the seizure of collateral held as security (2017: nil). In general, the policy is to dispose of these assets within a reasonably short period. The proceeds are used to redeem the outstanding amount.
See “Risk management” (under 2, Credit risk) for more information about loans and advances to the public and private sectors.
1 Prior to the introduction of IFRS 9 the impairments on Current accounts were included under Other loans and advances.
Movements in gross carrying amount of Loans and advances to the public and private sectors
Stage 1 Stage 2 Stage 3 Total
At 1 January 7,762,425 1,684,215 392,728 9,839,368
Additions or releases without transfer –924,506 –290,088 –102,255 –1,316,850
Transfer to Stage 1 896,890 –882,587 –14,303 –
Transfer to Stage 2 –936,556 978,090 –41,534 –
Transfer to Stage 3 –23,926 –89,969 113,895 –
Newfinancialassetsoriginatedorpurchased 785,164 – – 785,164
Amounts written off – – –12,295 –12,295
At 31 December 7,559,491 1,399,661 336,236 9,295,388
Impairments 31/12/2018 01/01/2018 31/12/20171
Total –112,811 –131,520 –120,400
Mortgage loans –10,483 –14,082 –11,296
Current accounts –69,335 –74,639 –
Other loans and advances –32,994 –42,798 –109,103
9. Loans and advances to the public and private sectors 31/12/2018 01/01/2018 31/12/2017
Total 8,561,497 9,092,207 9,103,327
Mortgage loans 6,289,139 6,267,532 6,267,532
Loans 1,447,782 1,710,486 1,710,486
Current accounts 578,442 962,916 962,916
Securities-backed loans and settlement claims 267,221 206,396 206,396
Subordinated loans 1,510 4,487 4,487
Value adjustments fair value hedge accounting 90,212 71,911 71,911
Impairments –112,811 –131,520 –120,400
Movements in held-to-maturity investments 2018 2017
At 1 January – 513,438
Purchases – 14,976
Share premium (discount) of debt instruments – –7,065
At 31 December – 521,349
Due to the adoption of IFRS 9 as of 1 January 2018, these itemshavebeenreclassifiedunderthelineitemOtherfinancialassetsatamortisedcost.

Notestotheconsolidatedstatementoffinancialposition139
All associates valued using the equity method are unlisted investments; see “Disclosure of interests in other entities”.
10. Other financial assets at amortised cost 31/12/2018 01/01/2018 31/12/2017
Fair value Face value Fair value Face value Fair value Face value
Total 554,209 532,000 521,321 490,000 – –
Debt instruments
Government paper and government- guaranteed paper 318,043 300,000 324,723 300,000 – –
Banksandfinancialinstitutions,listed 236,200 232,000 196,627 190,000 – –
Impairments –34 – –28 – – –
Movements in gross carrying amount of Other financial assets at amortised cost Stage 1
At 1 January 490,000
Newfinancialassetsoriginatedorpurchased 42,000
At 31 December 532,000
Due to the adoption of IFRS 9 as of 1 January 2018, debt instruments previously included under the line item Held-to-maturityinvestmentshavebeenreclassifiedtoOtherfinancialassetsatamortisedcost.
11. Investments in associates using the equity method
Movements in investments in associates using the equity method 2018 2017
At 1 January 70,390 75,559
Acquisitions and contributions 9,609 27,147
Sales and repayments –25,407 –42,255
Income from associates 11,759 13,129
Impairments 783 –335
Dividend received –3,473 –3,833
Reclassificationofassetsclassifiedasheldforsale –7,882 –
Other movements –1,709 978
At 31 December 54,071 70,390
Movements in Other financial assets at amortised cost 2018 2017
At 31 December – –
Impact of adopting IFRS 9 521,349 –
At 1 January 521,349 –
Purchases 42,000 –
Value changes –34 –
Other movements –9,107 –
At 31 December 554,209 –
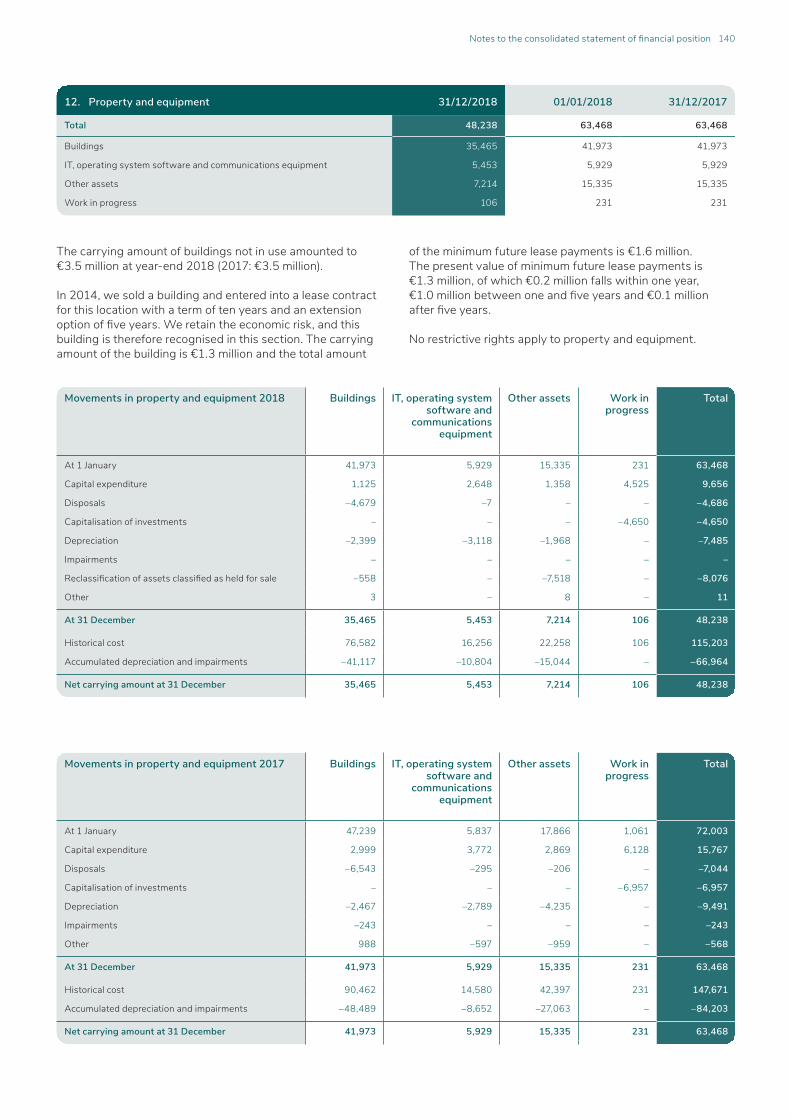
Notestotheconsolidatedstatementoffinancialposition140
Movements in property and equipment 2018 Buildings IT, operating system software and
communications equipment
Other assets Work in progress
Total
At 1 January 41,973 5,929 15,335 231 63,468
Capital expenditure 1,125 2,648 1,358 4,525 9,656
Disposals –4,679 –7 – – –4,686
Capitalisation of investments – – – –4,650 –4,650
Depreciation –2,399 –3,118 –1,968 – –7,485
Impairments – – – – –
Reclassificationofassetsclassifiedasheldforsale –558 – –7,518 – –8,076
Other 3 – 8 – 11
At 31 December 35,465 5,453 7,214 106 48,238
Historical cost 76,582 16,256 22,258 106 115,203
Accumulated depreciation and impairments –41,117 –10,804 –15,044 – –66,964
Net carrying amount at 31 December 35,465 5,453 7,214 106 48,238
Movements in property and equipment 2017 Buildings IT, operating system software and
communications equipment
Other assets Work in progress
Total
At 1 January 47,239 5,837 17,866 1,061 72,003
Capital expenditure 2,999 3,772 2,869 6,128 15,767
Disposals –6,543 –295 –206 – –7,044
Capitalisation of investments – – – –6,957 –6,957
Depreciation –2,467 –2,789 –4,235 – –9,491
Impairments –243 – – – –243
Other 988 –597 –959 – –568
At 31 December 41,973 5,929 15,335 231 63,468
Historical cost 90,462 14,580 42,397 231 147,671
Accumulated depreciation and impairments –48,489 –8,652 –27,063 – –84,203
Net carrying amount at 31 December 41,973 5,929 15,335 231 63,468
The carrying amount of buildings not in use amounted to €3.5 million at year-end 2018 (2017: €3.5 million).
In 2014, we sold a building and entered into a lease contract for this location with a term of ten years and an extension optionoffiveyears.Weretaintheeconomicrisk,andthisbuilding is therefore recognised in this section. The carrying amount of the building is €1.3 million and the total amount
of the minimum future lease payments is €1.6 million. The present value of minimum future lease payments is €1.3 million, of which €0.2 million falls within one year, €1.0millionbetweenoneandfiveyearsand€0.1millionafterfiveyears.
No restrictive rights apply to property and equipment.
12. Property and equipment 31/12/2018 01/01/2018 31/12/2017
Total 48,238 63,468 63,468
Buildings 35,465 41,973 41,973
IT, operating system software and communications equipment 5,453 5,929 5,929
Other assets 7,214 15,335 15,335
Work in progress 106 231 231

Notestotheconsolidatedstatementoffinancialposition141
The accumulated impairments on goodwill amounted to €53.0 million at 31 December 2018 (2017: €75.4 million) and have been deducted from the historical cost.
13. Goodwill and other intangible assets 31/12/2018 01/01/2018 31/12/2017
Total 183,083 218,389 218,389
Goodwill 130,247 154,981 154,981
Other intangible assets 52,836 63,408 63,408
Movements in goodwill and other intangible assets 2018
Goodwill Client bases Third-party distribution
channels
Brand names
Application software
Total
At 1 January 154,981 48,678 409 6,898 7,424 218,389
Additions – – – – 879 879
Disposals – – – – –160 –160
Amortisation – –6,398 –409 –767 –1,742 –9,315
Impairments – – – – –263 –263
Reclassificationofassetsclassifiedas held for sale –24,734 – – – – –24,734
Other – – – – –1,712 –1,712
At 31 December 130,247 42,280 – 6,131 4,426 183,083
Historical cost 130,247 106,084 4,899 15,330 65,487 322,047
Accumulated amortisation and impairments – –63,804 –4,899 –9,198 –61,063 –138,964
Net carrying amount at 31 December 130,247 42,280 – 6,132 4,424 183,083
Movements in goodwill and other intangible assets 2017
Goodwill Client bases Third-party distribution
channels
Brand names
Application software
Total
At 1 January 155,747 24,649 817 7,664 5,576 194,453
Additions 1,919 28,700 – – 5,623 36,242
Disposals –666 – – – –38 –704
Amortisation – –4,671 –408 –767 –2,796 –8,641
Impairments –2,019 – – – –1,563 –3,582
Other – – – – 622 622
At 31 December 154,981 48,678 409 6,898 7,424 218,389
Historical cost 154,981 106,084 4,899 15,330 78,064 359,358
Accumulated amortisation and impairments – –57,406 –4,490 –8,432 –70,640 –140,969
Net carrying amount at 31 December 154,981 48,678 409 6,898 7,424 218,389
Allocation of goodwill to CGUs (based on segments) 31/12/2018 31/12/2017
Total 130,247 154,981
Private Banking 1,695 1,695
Asset Management 49,292 49,292
Merchant Banking 76,293 76,293
Non-strategic investments 2,967 27,701

Notestotheconsolidatedstatementoffinancialposition142
In 2018, we performed impairment tests on the goodwill arising from acquisitions in earlier years. The tested goodwill was allocated to CGUs Private Banking, Asset Management, Merchant Banking and Non-strategic investments.
The recoverable amount of the CGUs is calculated on the basisofvalueinuse.ThiscalculationusescashflowprojectionsforeachCGUforafive-yearperiod.Theseprojections for each CGU are based on the current year and onthefinancialestimatesusedbymanagementtosetobjectives. Our growth target has been set at the long-term market growth rate of 1.0% for the period after the explicit projections per CGU. Management has compared the main assumptions against market forecasts and expectations.
Cashflowestimatesarebasedonourstrategicplansandpotential future trends. Events and factors that could have a significantimpactontheestimatesincludemarketexpectations, effects of mergers and acquisitions, competitive conditions, client behaviour and changes in the client base, cost structure, trends in interest rates and risks, andothercircumstancesspecifictotheindustryandsector.CashflowsarediscountedusingadiscountrateforeachCGUwhichreflectstherisk-freeinterestrate,supplementedwith a surcharge for the market risk exposure of each CGU.
The weighted average cost of capital (WACC) is used as thediscountrateforthecashflowsintheimpairmenttestfor non-strategic investments.
The impairment tests performed in 2018 did not result in goodwill impairments for CGUs Private Banking, Asset Management, Merchant Banking and Non-strategic investments. The model uses a baseline scenario. A sensitivity analysis was also performed, focusing particular attentiononadecreaseinnetprofit,achangeinthepay-out ratio and a further increase in the cost of equity. This analysis demonstrated that a deterioration in the variables did not lead to an impairment in the four CGUs in 2018.
An annual test is carried out for indications of impairment of otherintangibleassetswithafiniteusefullife.Forthelineitem Client bases, movements in the number of clients are assessed. For Third-party distribution channels, an assessment is carried out to determine whether the relationships with these parties still exist. The useful life tests carried out in 2018 provided no indication of a need for further examination, nor of impairments.
CGU % Discount rate before tax % Discount rate after tax %
2018 2017 2018 2017
Private Banking 9.5 9.1 7.4 7.1
Asset Management 9.9 11.1 7.8 8.7
Merchant Banking 8.7 7.8 6.9 6.1
Non-strategic investments 11.9 12.3 - 12.5 9.9 9.4 - 9.7
2019 2020 2021 2022 2023 2024-2033
Expected amortisation of intangible assets 6,994 6,708 6,567 6,126 5,267 21,173

Notestotheconsolidatedstatementoffinancialposition143
Movements in deferred tax assets 2018
Employee benefits
Property and
equipment
Derivatives Loss available
for set-off
Commission Other Total
At 31 December 3,122 2,593 3,275 15,639 128 471 25,228
Impact of adopting IFRS 9 – – – 1,478 – 3,465 4,943
At 1 January 3,122 2,593 3,275 17,117 128 3,937 30,172
Withdrawalsthroughprofitorloss – –317 – –6,426 – –383 –7,126
Additionsthroughprofitorloss 439 – – 1,190 75 – 1,704
Tax rate adjustments –180 26 – – – – –155
Total through profit or loss 258 –292 – –5,236 75 –383 –5,578
Directly from/to equity 28 – 208 – – –121 115
At 31 December 3,408 2,301 3,483 11,881 203 3,433 24,709
Movements in deferred tax assets 2017
Employee benefits
Property and
equipment
Derivatives Loss available
for set-off
Commission Other Total
At 1 January 4,262 2,448 3,628 28,489 79 1,004 39,910
Withdrawalsthroughprofitorloss –1,029 – – –12,850 – –533 –14,412
Additionsthroughprofitorloss – 145 – – 48 – 193
Total through profit or loss –1,029 145 – –12,850 48 –533 –14,218
Directly from/to equity –111 – –352 – – – –464
At 31 December 3,122 2,593 3,275 15,639 128 471 25,228
Tax losses to be offsetFinancial year
Amount Final year for offsetting
2012 31,239 2021
2013 – 2022
2014 – 2023
2015 6,992 Indefinitely
2016 4,360 Indefinitely
2017 736 Indefinitely
2018 4,198 Indefinitely
A proportion of the deferred tax assets depends on future taxableprofits.Taxlossesincurredcanbeoffsetagainsttaxableprofitsinfutureyears.Basedonthemostrecentforecast, it is likely that the existing tax losses can be offset well before expiry. The non-current portion of deferred tax
assets that is expected to be recovered or settled after more than 12 months amounts to €17,827. See Note 39, Income tax, for more information.
The total amount of tax losses is recognised as a deferred tax asset based on the prevailing tax rate. The tax loss for 2012 has an expiry date of 31 December 2021. The losses of 2015 through 2018 arose from the permanent establishment in Belgium. As Belgium does not apply a time limit for offsetting losses, they can be carried forward indefinitely.
14. Tax assets 31/12/2018 01/01/2018 31/12/2017
Total 25,941 31,669 26,719
Current tax assets 1,231 1,491 1,491
Deferred tax assets 24,709 30,179 25,228

Notestotheconsolidatedstatementoffinancialposition144
15. Assets classified as held for sale 31/12/2018 01/01/2018 31/12/2017
Total 68,058 – –
Cash and cash equivalents and balances at central banks 1,729 – –
Loans and advances to the public and private sectors 1,719 – –
Investments in associates using the equity method 9,956 – –
Property and equipment 8,127 – –
Goodwill and other intangible assets 29,465 – –
Other assets 17,062 – –
16. Other assets 31/12/2018 01/01/2018 31/12/2017
Total 121,513 142,277 142,277
Interest receivable 16,622 22,980 22,980
Commission receivable 53,629 58,268 58,268
Transitory items 36,280 38,814 38,814
Assets acquired through foreclosures 190 651 651
Inventories 785 4,825 4,825
Other 14,006 16,740 16,740
17. Financial liabilities from trading activities 31/12/2018 01/01/2018 31/12/2017
Total 333 1,899 1,899
Equity instruments
Shares, listed 333 1,882 1,882
Shares, unlisted – 17 17
Total equity instruments 333 1,899 1,899
On 12 December 2018, Van Lanschot Kempen announced that an agreement has been reached with funds under the management of Bencis about the sale of the stake in non-strategic interest AIO II BV (acquired in 2009 by Van Lanschot Kempen). AIO II BV is the holding company of pharmacy chain Medsen and wholesale chemist Ceban. The transaction is completed in February 2019. Due to this development,AIOIIisincludedinthestatementoffinancialpositionunderthelineitemAssetsandliabilitiesclassifiedas held for sale; the result is recognised in the income statement under Discontinued operations.
In the second half of 2018, Van Lanschot Chabot Mandema &Partnerswasclassifiedasheldforsale.On19February2019, Van Lanschot Kempen announced the sale to De Goudse Verzekeringen of its interest in Van Lanschot Chabot | Mandema & Partners. The proposed transaction is expectedtobecompletedinthefirsthalfof2019.Weplanto sell assets at a price which is reasonable considering their current fair value, as a result of which a sale is highly probable and expected to be completed within one year.
Assets acquired through foreclosures relate to property. We aim to convert these to cash as soon as practicable.
Inventories are related to the non-strategic investments.
The unrecognised losses are losses for which it is not probablethatfuturetaxableprofitwillbeavailableagainstwhich the unused tax losses can be utilised.
31/12/2018 31/12/2017
Unrecognised losses 24,167 23,682

Notestotheconsolidatedstatementoffinancialposition145
Allfinancialliabilitiesatfairvaluethroughprofitorlossaredesignatedatfairvaluethroughprofitorlossoninitialrecognition.
We have issued debt instruments which are managed on the basis of fair value. The fair value is paid to the issuer on maturity date. Management believes that valuation at fair valuethroughprofitorlossapplies,asthislargelyeliminatesor reduces inconsistencies in valuation and disclosure, and performance is assessed on the basis of fair value.Financialliabilitiesatfairvaluethroughprofitorlossincludenon-structureddebtinstrumentssuchasfloating-rate
notesandfixed-ratenotes,andstructureddebtinstrumentssuch as index guarantee notes and trigger notes. Our own credit risk in the reporting year increased by €1.0 million (2017:down€4.4million),reflectinganincreaseof €7.3 million on the back of the improvement in our own credit quality, a reduction of €6.3 million for the passage of time and for changes in the notional amount. The cumulative change in the fair value of Financial liabilities atfairvaluethroughprofitorlosswhichcanbeallocated to the changes in own credit risk amounted to a total increase of €14.3 million (2017: €13.3 million).
Issued debt securities comprise debt instruments with rates ofinterestthatareeitherfixedorvariable,insofarasnotsubordinated. None of these debt securities becomes payable on demand in 2019 (2018: €904 million).
Issued debt securities fell by €890.2 million relative to 2017 following the redemption of a €500.0 million senior unsecuredbondinthefirsthalfof2018andtheredemptionof €436.5 million on the notes as part of securitisation transactions in the second half of 2018.
Face value versus carrying amountThe value adjustment of debt securities as a result of hedge accounting is recognised under the line item Issued debt securities.
20. Financial liabilities at fair value through profit or loss 31/12/2018 01/01/2018 31/12/2017
Total 940,361 971,453 971,453
Unstructured debt instruments 142,021 258,498 258,498
Structured debt instruments 798,340 712,955 712,955
21. Issued debt securities 31/12/2018 01/01/2018 31/12/2017
Total 1,521,504 2,411,671 2,411,671
Bond loans and notes – 465,290 465,290
Covered bonds 1,493,179 1,491,850 1,491,850
Notes as part of securitisation transactions – 436,467 436,467
Floating-rate notes 18,898 22,134 22,134
Value adjustments fair value hedge accounting 9,427 –4,069 –4,069
19. Public and private sector liabilities 31/12/2018 01/01/2018 31/12/2017
Total 9,090,939 9,145,119 9,145,119
Savings 3,362,404 3,718,970 3,718,970
Deposits 231,472 228,567 228,567
Current accounts 5,130,131 4,831,497 4,831,497
Other client assets 365,808 365,239 365,239
Value adjustments fair value hedge accounting 1,123 845 845
18. Due to banks 31/12/2018 01/01/2018 31/12/2017
Total 334,902 101,645 101,645
Deposits 46,951 55,482 55,482
Repo transactions 250,000 – –
Payables arising from unsettled securities transactions 35,798 23,134 23,134
Loans and advances drawn 2,153 23,029 23,029

Notestotheconsolidatedstatementoffinancialposition146
Compared with 2017, provisions increased by €5.9 million, mainly due to the provision for restructuring.
We operate a number of employee schemes under which participantsreceivepaymentsorbenefitsaftertheyretire.Specifically,thereisapensionschemeandadiscountscheme for mortgage interest rates, as well as a long–servicebenefitsscheme.
Thefollowingdefinedbenefitschemeswerevaluedforthepurposeofthe2018financialstatements:– Van Lanschot Kempen employees were eligible for
discounted mortgage interest rates. Entitlement to this discount continued beyond retirement from active service.
– Thelong–servicebenefitsdependonthenumberofyears of service.
– Bothadefinedcontributionschemeandadefinedbenefitschemeareinplaceforemployeesworkingatthe Belgian branch. The pensionable salary for the definedbenefitschemeistakenastheaveragebasicsalaryoverthelastfiveyearsofservice.Thepensioncapital is insured with UKZT (Uitgesteld Kapitaal Zonder Tegenverzekering). The accompanying term life assuranceisfundedfromriskpremiums.Thedefinedcontribution pension plans have been set up according totheBelgianmethodofdefinedcontributionsbutdonotfulfilallthecriteriaofadefinedcontributionpensionplanaccordingtoIAS19.Forthisreason,thedefinedcontributionpensionplansaretreatedasadefinedbenefitplanintheconsolidatedfinancialstatements.
– Kempen operates an average salary scheme under which 1.875% of the pensionable salary – salary less state pension offset, with an annual ceiling of €40,571 – is accrued for each year of service and which is based on a retirement age of 68. The surviving dependants’ pension is insured on a risk basis.
– The pension plans of F. van Lanschot Bankiers (Schweiz) have been set up according to the Swiss method of definedcontributionsbutdonotfulfilallthecriteriaofadefinedcontributionpensionplanaccordingtoIAS19.For this reason, the Swiss pension plans are treated as definedbenefitplansintheconsolidatedfinancialstatements.
The pension schemes have been placed with insurers and a pension institution, which are responsible for the pension administration, risk insurance and communication of legal documents to employees who are scheme members. Decisions on and changes to pension scheme content are taken by an internal pensions committee. Where applicable, in the Netherlands the Works Council is consulted for its opinion and/or consent.
Only within a Kempen pension scheme, plan assets fund the obligations (i.e. the scheme is funded). The other schemes are unfunded; payments in any year are made directly by the company.
The obligations are calculated using the projected unit credit method.
22. Provisions 31/12/2018 01/01/2018 31/12/2017
Total 28,965 24,284 23,084
Provisions for pensions 15,313 14,545 14,545
Provision for employee discounts 112 177 177
Provisionforlong-servicebenefits 2,352 2,322 2,322
Provision for restructuring 6,356 66 66
Provision for interest rate derivatives recovery framework 1,025 2,064 2,064
Provisionforfinancialguaranteesandloancommitments 286 1,200 –
Other provisions 3,520 3,910 3,910
Face value versus carrying amount of issued debt securities at 31/12/2017
Face value Value adjustments fair value hedge
accounting
Premium/discount Carrying amount
Total 2,426,011 –4,069 –10,271 2,411,671
Bond loans and notes 467,614 1,599 –2,324 466,889
Covered bonds 1,500,000 –5,668 –8,150 1,486,181
Notes as part of securitisation transactions 436,467 – – 436,467
Floating-rate notes 21,930 – 204 22,134
Face value versus carrying amount of issued debt securities at 31/12/2018
Face value Value adjustments fair value hedge
accounting
Premium/discount Carrying amount
Total 1,518,755 9,427 –6,678 1,521,504
Covered bond 1,500,000 9,427 –6,821 1,502,606
Floating-rate notes 18,755 – 143 18,898

Notestotheconsolidatedstatementoffinancialposition147
At 31 December 2018, the weighted average duration of the definedbenefitobligationwas23.5years(2017:24.6years).
Movements in defined benefit obligations for pension scheme 2018 2017
Definedbenefitobligationsat1January 207,094 199,811
Current service costs 5,899 5,871
Interest costs 3,580 3,644
Members' contributions 1,242 774
Financial assumptions –3,811 3,010
Grossbenefits –2,034 –2,689
Transfers 1,111 –990
Changed assumptions 262 –2,337
Defined benefit obligations at 31 December 213,343 207,094
Movements in defined benefit obligations for early retirement scheme 2018 2017
Definedbenefitobligationsat1January 83 18
Current service costs – 74
Grossbenefits –25 –9
Defined benefit obligations at 31 December 58 83
Movements in defined benefit obligations for employee discount scheme 2018 2017
Definedbenefitobligationsat1January 177 4,100
Current service costs 9 56
Interest costs 2 15
Financial assumptions –66 –688
Grossbenefits –10 –84
Discontinuation – –3,222
Defined benefit obligations at 31 December 112 177
Obligations/assets included in the statement of financial position by scheme at 31/12/2018
Pensions Early retirement Employee discounts
Long-service benefits
Definedbenefitobligations 213,343 58 112 2,352
Fair value of plan assets 198,088 – – –
Surplus/deficit –15,255 –58 –112 –2,352
Obligation at year-end –15,255 –58 –112 –2,352
Obligations/assets included in the statement of financial position by scheme at 31/12/2017
Pensions Early retirement Employee discounts
Long-service benefits
Definedbenefitobligations 207,094 83 177 2,322
Fair value of plan assets 192,632 – – –
Surplus/deficit –14,462 –83 –177 –2,322
Obligation at year-end –14,462 –83 –177 –2,322

Notestotheconsolidatedstatementoffinancialposition148
Movements in fair value of pension plan assets 2018 2017
Fair value at 1 January 192,632 187,526
Expected return on plan assets 3,442 3,506
Financial assumptions –3,548 120
Employer's contribution 5,776 5,218
Employees' contribution 300 229
Grossbenefits –1,833 –2,492
Transfers 1,317 –1,477
Fair value at 31 December 198,088 192,632
Actual return on plan assets –105 3,627
Current service costs of pensions included in statement of income 2018 2017
Current service costs 5,898 5,871
Net interest income 3,580 3,644
Expected return on plan assets –3,442 –3,506
Net costs 6,036 6,008
Current service costs of early retirement included in statement of income 2018 2017
Current service costs – 74
Grossbenefits –25 –9
Net costs –25 65
Current service costs of employee discounts included in statement of income 2018 2017
Current service costs 9 56
Net interest income 2 15
Net costs 11 71
Current service costs of long-service benefits included in statement of income 2018 2017
Current service costs 143 162
Net interest income 28 23
Financial assumptions –21 –46
Net costs 150 139
Movements in defined benefit obligations for long-service benefits scheme 2018 2017
Definedbenefitobligationsat1January 2,322 2,317
Current service costs 143 162
Interest costs 28 23
Financial assumptions –21 –46
Grossbenefits –120 –134
Defined benefit obligations at 31 December 2,352 2,322

Notestotheconsolidatedstatementoffinancialposition149
At each reporting date, an asset/liability matching study is carried out by the pension fund’s asset manager, in which the consequences of the strategic investment policies are analysed. The strategic investment policies of the pension fund are bound by the maximum investment risk.
The maximum investment risk is linked to a strategic asset mixcomprising73%fixedincomeand27%equityincomeinvestments, with a duration match of 75%. A bandwidth of 5% is in place. The other investment category consists of funds managed by an external pension fund manager.
Themostsignificantactuarialassumptionsmadeatthereportingdateareasfollows:
The mortality rate is based on publicly available mortality tables for the relevant countries. For the calculations at 31 December 2018, the following mortality tables were used:– Kempen: the mortality tables as published by the Dutch
Association of Actuaries (Prognosetafel 2018);– Belgian branch: the mortality table as published by the
Institute of Actuaries in Belgium (MR/FR) with an age correction of -3 years.
– F. van Lanschot Bankiers (Schweiz): the mortality table as published by BVG (BVG 2015 GT).
For Kempen, a reduction of ten basis points in the actuarial interest rate will lead to an increase of 2.5% in the pension
obligations and a rise of 3.7% in the current service costs in the statement of income.
For the Belgian branch, a reduction of 50 basis points in the actuarial interest rate will lead to an increase of 6.8% in the pension obligations and a rise of 50 basis points in the actuarial interest rate will lead to a decrease of 6.1% in the pension obligations.
For F. van Lanschot Bankiers (Schweiz), a reduction of 50 basis points in the actuarial interest rate will lead to an increase of 9.2% in the pension obligations and a rise of 50 basis points in the actuarial interest rate will lead to a decrease of 8.0% in the pension obligations.
Assumptions 2018 2017
Actuarial interest rate pension 0.8% – 2.1% 0.65% – 1.8%
Actuarial interest rate employee discounts 1.2% 0.9%
Actuarialinterestratelong-servicebenefits 1.3% – 1.4% 1.1% – 1.2%
Expected return on investments 0.8% – 2.1% 0.65% – 1.8%
Priceinflation 1.75% – 2.0% 1.75% – 2.0%
General salary increase 1.00% – 1.75% 1.0% – 1.8%
Retirement age 64–68 years 64 – 67 years
History of movements in pension scheme gains and losses
2018 2017 2016 2015 2014
Definedbenefitobligations 213,343 207,094 199,811 167,276 168,771
Fair value of plan assets 198,088 192,632 187,526 157,030 160,993
Surplus/deficit –15,255 –14,462 –12,285 –10,246 –7,778
Actuarial gains/losses on obligations –3,811 3,010 13,484 –5,627 –267,278
Actuarial gains/losses on investments –3,548 120 16,734 –8,377 140,542
Plan assets by investment category 31/12/2018 31/12/2017
Fair value Percentage Fair value Percentage
Total 198,088 100 192,632 100
Fixed income 125,668 63 118,198 61
Equities 33,097 17 41,642 22
Mixed funds 1,686 1 1,715 1
Real estate 6,657 3 6,419 3
Cash and cash instruments –830 0 –848 0
Other 31,809 16 25,507 13

Notestotheconsolidatedstatementoffinancialposition150
Other provisions include provisions made for various legal claims. An amount of €0.8 million has an expected maturity of one year or longer.
Provision for restructuring 2018 2017
At 1 January 66 630
Withdrawals –1,216 –601
Additions 7,506 37
At 31 December 6,356 66
Provision for interest rate derivatives recovery framework 2018 2017
At 1 January 2,064 8,853
Release –1,040 –8,517
Additions – 1,728
At 31 December 1,025 2,064
Other provisions 2018 2017
At 1 January 3,910 5,844
Withdrawals related to acquisitions/consolidation base –399 –
Withdrawals –865 –2,997
Release –942 –312
Additions 1,780 1,462
Other changes 36 –86
At 31 December 3,520 3,910
23. Tax liabilities 31/12/2018 01/01/2018 31/12/2017
Total 5,764 13,007 12,841
Current tax liabilities 2,222 4,992 4,992
Deferred tax liabilities 3,542 8,015 7,849
Expected contributions for 2019 Pension obligations Employee discounts Long-service benefits scheme
Total 6,243 7 179
Expected employer's contributions 4,762 7 179
Expected employees' contributions 1,481 – –

Notestotheconsolidatedstatementoffinancialposition151
Movements in deferred tax liabilities 2017 Property and equipment
Intangible assets
Investment portfolio
Other Total
At 1 January 312 2,821 2,201 – 5,334
Withdrawalsthroughprofitorloss –678 – – – –678
Additionsthroughprofitorloss 1,240 1,031 – 92 2,363
Tax rate adjustments – – – – –
Total through profit or loss 562 1,031 – 92 1,685
Directly from/to equity – – 860 –30 831
At 31 December 873 3,852 3,061 63 7,849
24. Liabilities classified as held for sale 31/12/2018 01/01/2018 31/12/2017
Total 20,871 – –
Provisions 284 – –
Other liabilities 20,587 – –
See Note 39, Income tax, for more information.
Formoreinformation,seeNote15,Assetsclassifiedasheldforsale.
Other liabilities comprise income received to be credited to future periods and amounts payable such as accrued interest, payables, suspense accounts and unsettled items.
25. Other liabilities 31/12/2018 01/01/2018 31/12/2017
Total 125,383 156,820 156,820
Interest payable 24,943 31,007 31,007
Other accruals and deferred income 58,034 62,944 62,944
Other 42,407 62,869 62,869
Movements in deferred tax liabilities 2018 Property and equipment
Intangible assets
Investment portfolio
Other Total
At 31 December 873 3,852 3,061 63 7,849
Impact of adopting IFRS 9 – – 166 – 166
At 1 January 873 3,852 3,227 63 8,015
Withdrawalsthroughprofitorloss – –793 – – –793
Additionsthroughprofitorloss 736 – – – 736
Tax rate adjustments 23 –471 – – –448
Total through profit or loss 760 –1,264 – – –504
Directly from/to equity – – –4,017 48 –3,969
At 31 December 1,633 2,588 –790 111 3,542
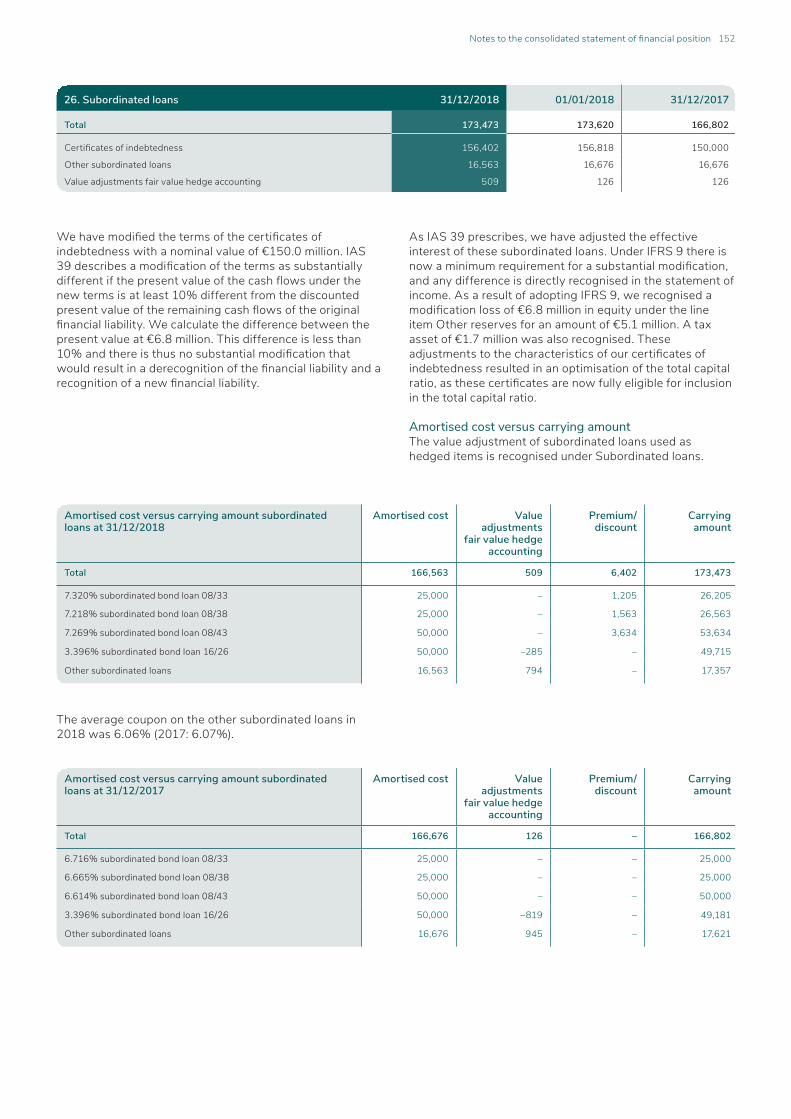
Notestotheconsolidatedstatementoffinancialposition152
The average coupon on the other subordinated loans in 2018 was 6.06% (2017: 6.07%).
Amortised cost versus carrying amount subordinated loans at 31/12/2018
Amortised cost Value adjustments
fair value hedge accounting
Premium/discount
Carrying amount
Total 166,563 509 6,402 173,473
7.320% subordinated bond loan 08/33 25,000 – 1,205 26,205
7.218% subordinated bond loan 08/38 25,000 – 1,563 26,563
7.269% subordinated bond loan 08/43 50,000 – 3,634 53,634
3.396% subordinated bond loan 16/26 50,000 –285 – 49,715
Other subordinated loans 16,563 794 – 17,357
Amortised cost versus carrying amount subordinated loans at 31/12/2017
Amortised cost Value adjustments
fair value hedge accounting
Premium/discount
Carrying amount
Total 166,676 126 – 166,802
6.716% subordinated bond loan 08/33 25,000 – – 25,000
6.665% subordinated bond loan 08/38 25,000 – – 25,000
6.614% subordinated bond loan 08/43 50,000 – – 50,000
3.396% subordinated bond loan 16/26 50,000 –819 – 49,181
Other subordinated loans 16,676 945 – 17,621
Wehavemodifiedthetermsofthecertificatesofindebtedness with a nominal value of €150.0 million. IAS 39describesamodificationofthetermsassubstantiallydifferentifthepresentvalueofthecashflowsunderthenew terms is at least 10% different from the discounted presentvalueoftheremainingcashflowsoftheoriginalfinancialliability.Wecalculatethedifferencebetweenthepresent value at €6.8 million. This difference is less than 10%andthereisthusnosubstantialmodificationthatwouldresultinaderecognitionofthefinancialliabilityandarecognitionofanewfinancialliability.
As IAS 39 prescribes, we have adjusted the effective interest of these subordinated loans. Under IFRS 9 there is nowaminimumrequirementforasubstantialmodification,and any difference is directly recognised in the statement of income. As a result of adopting IFRS 9, we recognised a modificationlossof€6.8millioninequityunderthelineitem Other reserves for an amount of €5.1 million. A tax asset of €1.7 million was also recognised. These adjustmentstothecharacteristicsofourcertificatesofindebtedness resulted in an optimisation of the total capital ratio,asthesecertificatesarenowfullyeligibleforinclusionin the total capital ratio.
Amortised cost versus carrying amountThe value adjustment of subordinated loans used as hedged items is recognised under Subordinated loans.
26. Subordinated loans 31/12/2018 01/01/2018 31/12/2017
Total 173,473 173,620 166,802
Certificatesofindebtedness 156,402 156,818 150,000
Other subordinated loans 16,563 16,676 16,676
Value adjustments fair value hedge accounting 509 126 126

Notestotheconsolidatedstatementoffinancialposition153
27. Total equity 31/12/2018 01/01/2018 31/12/2017
Total 1,268,195 1,334,742 1,349,124
Equity attributable to shareholder
Issuedsharecapital 40,000 40,000 40,000
Sharepremiumreserve 216,149 277,674 277,674
Revaluationreserve –3,065 9,682 14,013
Actuarialresultsondefinedbenefitschemes –17,591 –17,885 –17,885
Currencytranslationreserve 104 1,602 1,602
Cashflowhedgereserve –13,509 –9,825 –9,825
Owncreditriskreserve –11,394 –9,966 –
Retainedearnings 970,657 937,687 937,773
Otherreserves 925,203 911,296 925,678
Undistributedprofit(attributabletoshareholder) 74,631 89,508 89,508
Total equity attributable to shareholder 1,255,982 1,318,478 1,332,860
Equity attributable to non-controlling interests
Non-controllinginterests 6,529 10,827 10,827
Undistributedprofitattributabletonon-controllinginterests 5,684 5,437 5,437
Total equity attributable to non-controlling interests 12,213 16,264 16,264
Theauthorisedsharecapitalis€100millionandconsists of1,000,000sharesatanominalvalueof€100pershare. At31December2017and31December2018therewere400,000sharesinissue.
DuringthefinancialyearVanLanschotKempenNVconditionallygranted55,890depositaryreceiptsforClassAsharesinVanLanschotKempenNV.Formoreinformationonshare-basedpayments,seeNote35,Staffcosts.
Nooptionrightshavebeengrantedsince2008.Bytheendof2018,boardmembersheldatotalof187,080sharesanddepositaryreceiptsforsharesinVanLanschotKempenNV.Awardsofunconditionalsharesanddepositaryreceiptstostaffarelinkedtoperformanceandemploymentcontracts.FormoreinformationaboutsharesandoptionsschemesforstaffandtheStatutoryBoard,seepage56.

Notestotheconsolidatedstatementoffinancialposition154
Movements in reserves 2018
Revaluation reserve of available-for-sale
investments
Revalua- tion
reserve financial
assets at fair value
through other
compre- hensive income
Actuarial results on
defined benefit
schemes
Currency translation
reserve
Cash flow hedge
reserve
Own credit risk
reserve
Retained earnings
Total
Equity instruments
Debt instruments
At 31 December 4,828 9,185 – –17,885 1,602 –9,825 – 937,773 925,678
ImpactofadoptingIFRS9 –4,828 –9,185 9,682 – – – –9,966 –86 –14,382
At 1 January – – 9,682 –17,885 1,602 –9,825 –9,966 937,687 911,296
Netchangesinfairvalue – – –9,951 – – –3,684 – – –13,635
Realisedgains/lossesthroughprofitorloss – – –2,731 – – – – – –2,731
Netimpairment toprofitorloss – – –65 – – – – – –65
Valuechangeown creditrisk – – – – – – –2,198 – –2,198
Profitappropriation – – – – – – – 29,827 29,827
Shareplans – – – – – – – 3,271 3,271
Actuarial results – – – 294 – – – – 294
Toretainedearnings – – – – – – 770 –770 –
Otherchanges – – – – –1,499 – – 642 -857
At 31 December – – –3,064 –17,591 104 –13,509 –11,394 970,658 925,203
Tax effects – – 3,985 –91 – 208 733 – 4,835
Movements in reserves 2017
Revaluation reserve of available-for-sale
investments
Actuarial results on
defined benefit
schemes
Currency translation
reserve
Cash flow hedge
reserve
Retained earnings
Total
Equity instruments
Debt instruments
At 1 January 13,517 6,732 –16,625 2,257 –10,883 921,216 921,216
Netchangesinfairvalue –7,778 7,258 – – 1,057 – 537
Realisedgains/lossesthroughprofitorloss
–911 –4,805 – – – – –5,716
Profitappropriation – – – – – 16,380 16,380
Shareplans – – – – – –1,720 –1,720
Actuarial results – – –542 – – – –542
Toretainedearnings – – –718 – – 718 –
Otherchanges – – – –655 – 1,180 524
At 31 December 4,828 9,185 –17,885 1,602 –9,825 937,773 925,678
Tax effects – –860 38 – –352 – –1,175
In2018,thedividendfor2017wassetat€149.08pershare.
In2017,thedividendfor2016wassetat€123.28pershare.

Notestotheconsolidatedstatementoffinancialposition155
Nature and purpose of other reservesShare premium reserve:CoversamountspaidtoVanLanschotKempenbyshareholderabovethenominalvalueofpurchasedshares. Revaluation reserve: CoversmovementsinthefairvalueofFVOCIinvestments.
Actuarial results on defined benefit schemes:Coversactuarialgainsandlossesonrevaluationofinvestmentsanddefinedbenefitobligations.Theactuarialgainsandlossesrelatedtoashortfallinminimumperformanceondefinedcontributionplanassets,requiredunderBelgianandSwisslaw,arealsoincluded.
Currency translation reserve:Thisreserve(whichisnotavailableforfreedistribution)coverscurrencyexchangedifferencesresultingfromthevaluationofinvestmentsingroupcompaniesattheprevailingexchangerateinsofarasthecurrencyrateriskisnothedged.
Own credit risk reserve:Coversthechangesin VanLanschotKempen’sowncreditriskoffinancialliabilities atfairvaluethroughprofitorloss.
Cash flow hedge reserve:Coverstheshareinthegainor lossonhedginginstrumentsinacashflowhedgethathas beendesignatedasaneffectivehedge.
Retained earnings: Coverspastprofitsaddedtoequityandchangesinconnectionwiththesharescheme.
Forseveralgroupcompanies,guaranteesof€225.6million(2017:€150.1million)havebeenissued.Itisimpossibletopredictwhether,whenandhowmuchofthesecontingentliabilitieswillbeclaimed.
Thefollowingmovementsarerelatedtothegrosscarryingamountofthecontingentliabilitiesandtheirrevocablecommitments.
28. Contingent liabilities 31/12/2018 01/01/2018 31/12/2017
Total 134,449 122,189 122,189
Guarantees,etc. 134,449 122,189 122,189
29. Irrevocable commitments 31/12/2018 01/01/2018 31/12/2017
Total 853,276 861,342 861,342
Unused credit facilities 815,157 814,030 814,030
Other 38,119 47,312 47,312
Movements in gross carrying amount of guarantees and loan commitments Stage 1 Stage 2 Stage 3 Total
At 1 January 230,844 14,133 3,690 248,667
Additionsorreleaseswithouttransfer –349,114 –5,277 –1,729 –356,120
TransfertoStage1 7,757 –7,532 –225 –
TransfertoStage2 –9,050 9,050 – –
TransfertoStage3 –1,487 –48 1,535 –
Newfinancialassetsoriginatedorpurchased 345,766 – – 345,766
At 31 December 224,716 10,326 3,271 238,313

Notestotheconsolidatedstatementoffinancialposition156
Contractual maturity of contingent items at 31/12/2018
Withdrawable on demand
< 3 months 3 to 12 months
1 to 5 years More than 5 years
Total
Total 644 121,340 11,574 12,238 841,930 987,725
Guarantees 644 3,370 11,083 7,803 111,549 134,449
Unused credit facilities – 117,970 491 1,466 695,230 815,157
Otherirrevocablecommitments – – – 2,969 35,150 38,119
Contractual maturity of contingent items at 31/12/2017
Withdrawable on demand
< 3 months 3 to 12 months
1 to 5 years More than 5 years
Total
Total 722 119,384 5,708 23,016 834,700 983,530
Guarantees 722 3,234 4,444 13,610 100,179 122,189
Unused credit facilities – 116,150 1,264 6,428 690,188 814,030
Otherirrevocablecommitments – – – 2,978 44,334 47,312
Thefollowingtablesshowthecontingentitems(contingentliabilitiesandirrevocablecommitments)basedontheirremainingcontractualtermstomaturityatthereportingdate.
Foreachtransactionthatwehaveguaranteed,themaximumguaranteedamountisincludedintherelevanttermbucket.Foreachobligationarisingfromanirrevocablecommitment,thecommittedamountisclassifiedintherelevanttermbucket.

Notes to the consolidated statement of income 157
NOTES TO THE CONSOLIDATED STATEMENT OF INCOME (€1,000)
In2018,interestresultwas€20.6millionlowerthanin2017.Thedecreasewastheoutcomeoflowerinterestincomeduetotherun-offoftheCorporateBanking loanportfolioandtherepricingofthePrivateBanking loanportfolio.
Theinterestresultonloanssubjecttoimpairmentwas€11.1million(2017:€4.1million).
30. Net interest income 2018 2017
Total interest income 304,344 340,051
Interestincomeoncashequivalents 103 124
Interestincomeonbanksandprivatesector 238,356 258,108
Interestincomeonfinancialassetsatfairvaluethroughothercomprehensiveincome 5,040 –
Interestincomeonotherfinancialassetsatamortisedcost 8,485 –
Interestincomeonavailable-for-saleinvestments – 7,423
Interestincomeonheld-to-maturityinvestments – 10,238
Interest income calculated using the effective interest method 251,985 275,893
Interestincomeonfinancialassetsatfairvaluethroughprofitorloss 2,192 4,654
Interestincomeonderivatives 45,262 56,905
Other interest income 4,904 2,599
Other interest income 52,359 64,158
Interest expense 2018 2017
Total interest expense 129,131 144,202
Interestexpenseonbalancesatcentralbanks 5,855 5,455
Interestexpenseonbanksandprivatesector 27,755 31,519
Interestexpenseonissueddebtsecurities 23,333 31,039
Interestexpenseonsubordinatedloans 9,575 8,306
Interest expense calculated using the effective interest method 66,518 76,319
Interestexpenseonderivatives 61,084 67,574
Otherinterestexpense 1,528 308
Other interest expense 62,612 67,882
Net interest income 175,213 195,849
31. Income from securities and associates 2018 2017
Total 31,323 37,029
Incomefromassociatesusingtheequitymethod 14,171 12,949
Realisedresultofassociatesusingtheequitymethod 14,557 11,125
Realisedandunrealisedgains/lossesoninvestmentsatfairvaluethroughprofitorloss 2,410 3,567
Realisedresultofavailable-for-saleequityinstruments – 7,408
Dividendreceivedonavailable-for-saleequityinstruments – 3,450
Othergainsonsales 184 –1,470

Otherincomecomprisesnetsalesandcostofsalesfromnon-strategicinvestmentsarisingfromdebtconversion.Incertaincases,whereacompanyhasnotbeenabletorepayacorporateloangrantedbyVanLanschotKempen,theloanhasbeenconvertedintoashareholding,thusgivingthecompanytimetorecover.Weaimtosellanysharesinnon-strategicinvestmentsinduecourse.
Comparedwith2017,resultonfinancialtransactionswasdownby€14.9million,€5.5millionofwhichwasdue tohigherunrealisedlossesonderivativesunderhedgeaccounting.Thebalanceoflossesoneconomichedgesandgainsonfinancialassetsatfairvaluethroughprofitorlosscamein€4.1millionhigher.Thisbalancereflectstherevaluationresultcausedbychangesincapitalmarket yieldsinthemarked-to-marketportfolioandanumberofderivativespositions.
Comparedwith2017,commissionincomewasupby €26.3million.Theincreasewasprimarilyduetohighermanagementcommissions(€15.9million)drivenbyinflows,AuMfromtheacquisitionofUBS‘swealthmanagementactivitiesintheNetherlands,andpartlyoffsetbynegativemarketperformance.CorporateFinanceandEquityCapitalMarketscommissionscamein€19.0millionhigherduetoincreaseddealflowatMerchantBanking.
Notes to the consolidated statement of income 158
32. Net commission income 2018 2017
Total 293,247 266,986
Securities commissions 25,131 33,082
Managementcommissions 213,416 197,557
Cash transactions and funds transfer commissions 7,663 9,100
CorporateFinanceandEquityCapitalMarketscommissions 38,125 19,116
Other commissions 8,913 8,131
33. Result on financial transactions 2018 2017
Total –805 14,127
Gains/lossesonsecuritiestrading –662 –408
Gains/lossesoncurrencytrading 8,007 7,860
Gains/lossesonderivativesunderhedgeaccounting –4,684 830
Gains/lossesontradingderivatives 600 3,120
Realisedgainsonfinancialassetsatfairvaluethroughother comprehensiveincome 3,764 –
Realisedgainsonavailable-for-saledebtinstruments – 6,407
Gains/lossesoneconomichedges/hedgeaccountingnotapplied –29,037 19,929
Gains/lossesonfinancialassetsandliabilitiesatfairvaluethroughprofitorloss 21,207 –23,610
34. Other income 2018 2017
Total 7,304 8,548
Net sales 11,020 12,020
Cost of sales –3,716 –3,472

Staffcostswereup€17.4million.TheincreaseinsalariesandwageswaspartlyduetohighercostsassociatedwiththeacquisitionofUBS’swealthmanagementactivitiesintheNetherlandsandtogeneralsalaryincreases.TheriseinothersocialsecuritycostswasmainlycausedbyahighercontributiontotheDutchgovernment’ssectorfund.Changestostaffmortgagearrangementshadresultedinaone-offpositiveeffectin2017.Asthiseffectwasnotpresentin2018,otherstaffcostswerehigher. In2018,share-basedpaymentsinVanLanschotKempenNVsharesadded€5.3milliontoequity(2017:€4.9million).Ofthetotalexpensesarisingfromshare-basedpayments, €2.7millionisincludedinSalariesandwages(2017: €2.5million);thisamountincludestheprofit-sharingplan.Pensioncostsfordefinedcontributionschemesinclude €1.1millionforStatutoryBoardmembers(2017:€0.7million).
ThedepositaryreceiptsforClassAVanLanschotKempenNVshareswillbegrantedin2019onthesecondtradingdayafterthereleaseofVanLanschotKempenNV’sannualfiguresfor2018.
AstheparticipantsintheKempenManagement InvestmentPlanpaythefairvalueoftheequityinstruments,noexpensesrelatedtothisareincludedinstaffcosts.
Theaveragenumberofstaffin2018was1,843 (2017:1,878),or1,747infull-timeequivalents (2017:1,779),asshownbelow:
UnconditionaloptionsinVanLanschotKempenNVcanbeexercisedtwiceayearintheopenperiodafterthereleaseoftheinterimandfull-yearfigures.Nooptionrightswereexercisedin2017or2018.
35. Staff costs 2018 2017
Total 263,724 246,343
Salariesandwages 192,332 180,904
Pensioncostsfordefinedcontributionschemes 18,324 18,062
Pensioncostsfordefinedbenefitschemes 6,976 5,846
Other social security costs 22,181 19,448
Share-basedpaymentsforvariableremuneration 4,510 6,493
Other staff costs 19,401 15,590
Notes to the consolidated statement of income 159
Average FTEs 2018 2017
Total 1,747 1,779
Netherlands 1,553 1,580
Belgium 141 143
Other 53 56
Unconditional options Van Lanschot Kempen NV granted to staff
2018 2017
Number of options Weighted-average exercise price (€)
Number of options Weighted-average exercise price (€)
At 1 January 6,679 73.53 10,721 65.05
Expiredoptions –6,679 73.53 –4,042 51.04
At 31 December – n/a 6,679 73.53
Conditional depositary receipts for shares in Van Lanschot Kempen NV granted to staff (excluding Statutory Board) 2018 2017
At 1 January 308,770 453,119
Granted 55,890 52,227
Vested –136,495 –181,520
Forfeitedrights –5,234 –15,057
At 31 December 222,930 308,770

ConditionaldepositaryreceiptsforsharesinVanLanschotKempenNVaregrantedtostaffbothunderthevariableremunerationpolicyforidentifiedstaffandthelong-termshareplan(LTP).
Thefairvalueisdeterminedbasedonthevolume-weighteddaypricefordepositaryreceiptsforClassAsharesofVanLanschotKempenNVonthesecondtradingdayafterreleaseofVanLanschotKempenNV’sannualfigures.Thefairvalueisequaltothesharepricelessdiscountedvalueofexpecteddividends.DepositaryreceiptsgrantedinsharesVanLanschotKempenNVin2018hadafairvalueof€24.16(2017:€18.94).
In2018,10,587conditionaldepositaryreceiptsforsharesofVanLanschotKempenNVweregrantedundertheLTPtoanumberofseniormanagersotherthanmembersoftheStatutoryBoard(2017:7,960).
Long-term share plan Thelong-termshareplanallowsustoawardvariableremunerationtocertainkeyemployees,includingidentifiedstaff.ItoffersaspecialtypeofvariableremunerationinwhichthetotalvariablepaytakestheformofdepositaryreceiptsforClassAVanLanschotKempenNVshares.Forthe2011-14LTP,50%oftheVanLanschotKempenNVshareswereawardedconditionallyoveraperiodofthreeyearsand50%overaperiodoffiveyears.AsfromLTP2015,60%oftheVanLanschotKempenNVsharesareawardedimmediatelyandunconditionally,while40%areawardedconditionallyoveraperiodofthreeyears.
Conditionaldepositaryreceiptsforshareswillvestif:(i) VanLanschotKempen’sfinancialpositionallowsthisin
theyearofvesting;(ii) Riskshavebeenreviewedandnomaterial,unforeseen
riskshaveoccurred;and(iii)TheindividualhasnotleftVanLanschotKempeninthe
threeorfive-yearperiod.
Conditionalvariableremunerationcanbereviseddownifsopromptedbyrisksandperformancesidentifiedlater(malus).
Employeesdonotreceiveanydividendsduringthe vestingperiod.Ifanemployeeceasestobeemployedby VanLanschotKempenwithinthisperiod,theirrightswill beforfeited,exceptinlimitedcircumstancesjudgedon anindividualbasis.
Apart(around50%)oftheconditionallyawardeddepositaryreceiptsisusedtopayincometax.
Share-based payments Kempen Management Investment Plan (MIP)UnderthetermsoftheMIP,selectedKempenstaffinvestindirectlyviadepositaryreceiptsinKempensharesandKempen’sprofit-sharingcertificates.KempenissuedthesetoKempenManagementInvesteringsplanCoöperatiefUS(CoöperatieMIP),acooperativewithtwomembers,StichtingAdministratiekantoorKempenManagementInvesteringsplan(StichtingMIP)andVanLanschot,withStichtingMIPholdingvirtuallyallmembershiprights.StichtingMIPissuesdepositaryreceiptstoselectedstaff,whopaytheirissuepriceandreceivetheindirectrightofbeneficialownershipoftheunderlyingKempensharesandprofit-sharingcertificates.AnydividendsKempenpaysontheordinarysharesownedbyCoöperatieMIPandprofit-sharingrightsontheprofit-sharingcertificatesaredistributedtoCoöperatieMIP,whichinturndistributestheprofitstoitsmembers:StichtingMIPandVanLanschot.StichtingMIPwillsubsequentlypayoutitsshareoftheprofitstotheindividualstaffmembers,proratatheirholdingofdepositaryreceipts;formoreinformation,see“Disclosureofinterestsinotherentities”.
Individualstafffinancetheissuepriceentirelyfrom theirownmeansandarenotfinanciallysupportedby VanLanschotKempeninanyway.
Notes to the consolidated statement of income 160
36. Other administrative expenses 2018 2017
Total 162,043 168,481
Accommodationexpenses 20,078 20,353
Marketingandcommunication 13,746 13,937
Officeexpenses 5,990 6,889
ITexpenses 63,240 65,528
Externalauditors'fees 3,066 3,160
Consultancy fees 18,705 15,748
Travelandhotelfees 3,665 3,736
Informationproviders'fees 13,714 12,835
Externalserviceprovidercharges 6,331 6,019
Other 13,507 20,276
Consultancyfeesrelatetoadvisoryservices (businessconsultancy,tax)andtheimplementation andmaintenanceofsoftwareandhardware.

Feeschargedbytheexternalindependentauditors(andtheirnetworkofoffices)canbebrokendownasfollows:
ThisisasummaryoftheservicesrenderedbyourauditorPricewaterhouseCoopersAccountantsNV:– Financialstatementsaudit;– Financialstatementsauditforfundsmanaged
byKempen;– Statutoryauditsofcontrolledandrelatedentities;– Assuranceengagementrelatingtothesustainability
informationintheannualreport;– Auditoftheregulatoryreturnstobesubmittedto DeNederlandscheBank;
– AssuranceengagementF.vanLanschotBankiers(Schweiz);
– ISAE3402reportonKempenCapitalManagement,PrivateBankingandDGS;
– Non–auditassuranceengagementsonsafeguardingclientassets;
– Non–auditassuranceengagementoncostpricemodels.
Fees charged by external independent auditors 2018 Auditor PwC Other auditors Total auditors
Total 2,876 190 3,066
Financialstatementsauditfee 1,464 83 1,547
Feeforotherauditservices 659 – 659
FinancialstatementsauditfeeforfundsmanagedbyKempen 627 – 627
Other non-audit assurance fees 127 106 233
Fees charged by external independent auditors 2017 Auditor PwC Other auditors Total auditors
Total 2,982 177 3,160
Financialstatementsauditfee 1,640 – 1,640
Feeforotherauditservices 814 – 814
FinancialstatementsauditfeeforfundsmanagedbyKempen 506 – 506
Other non-audit assurance fees 23 177 201
37. Depreciation and amortisation 2018 2017
Total 14,427 14,166
Buildings 2,399 2,429
IT,operatingsystemsoftwareandcommunicationsequipment 3,118 2,791
Applicationsoftware 1,742 2,796
Intangibleassetsarisingfromacquisitions 7,573 5,845
Resultsondisposalsofpropertyandequipment –2,373 –1,862
Otherdepreciationandamortisation 1,968 2,166
Notes to the consolidated statement of income 161

Thistaxamountconsistsofthetaxexpenseforthefinancialyearontheoperatingresultasdisclosedinthestatementofincome,alsoallowingforanytaxrelieffacilities.Whendeterminingthetaxamount,wehaveappliedcurrentlyexistingtaxrules.Changesintheeffectivetaxrateweremainlyduetotheequityholdingexemptionandnon-deductiblecosts.In2017,theeffectivetaxalsochangedduetothestatutorytaxratechangeinBelgium.
Notes to the consolidated statement of income 162
39. Income tax 2018 2017
Operatingprofitbeforetaxfromcontinuingoperations 79,504 105,010
Profitbeforetaxfromdiscontinuedoperations 16,275 15,504
Total gross result 95,779 120,514
PrevailingtaxrateintheNetherlands 25% 25%
Taxoncontinuingoperations 12,086 22,129
Taxondiscontinuedoperations 3,378 3,440
Total tax 15,464 25,569
Expectedtax 23,945 30,129
Increase/decrease in tax payable due to
Tax-free income from securities and associates –9,649 –9,277
Non-deductibleimpairments – 229
Non-deductiblecosts 2,092 2,318
Non-deductiblelosses –228 91
Adjustmentstotaxesforpriorfinancialyears –239 168
Impactofforeigntaxratedifferences –146 –43
Release deferred tax assets –82 1,814
Otherchanges –229 141
Total increase/decrease –8,481 –4,560
Total tax 15,464 25,569
38. Impairments 2018 2017
Total impairments –13,416 –11,461
Cashandcashequivalentsandbalancesatcentralbanks 0 –
Duefrombanks –0 –
Financialassetsatfairvaluethroughothercomprehensiveincome –119 –
Loansandadvancestothepublicandprivatesectors –11,709 –11,875
Otherfinancialassetsatamortisedcost 5 –
Financialguaranteesandloancommitments –913 –
Impairment of financial instruments –12,737 –11,875
Available-for-saleinvestments – –3,051
Investmentsinassociatesusingtheequitymethod –892 335
Propertyandequipment – 243
Goodwillandintangibleassets 263 2,796
Assetsacquiredthroughforeclosures –50 92
Other impairments –679 414

Thebreakdownofdeferredassetsandliabilitiesisasfollows:
Deferred tax assets 2018 2017
Total 5,578 14,218
Employeebenefits –258 1,029
Commissions –75 –48
Propertyandequipment 292 –145
Tax-losscarry-forwards 5,236 12,850
Other 383 533
Deferred tax liabilities 2018 2017
Total –504 1,685
Propertyandequipment 760 562
Intangibleassets –1,264 1,031
Other – 92
Notes to the consolidated statement of income 163
40. Net profit from discontinued operations 2018 2017
Net interest income –377 –469
Income from securities and associates 276 665
Other income 45,108 44,577
Total income from operating activities 45,007 44,773
Staff costs 17,286 16,642
Otheradministrativecosts 9,481 10,045
Depreciationandamortisation 1,965 1,796
Impairments – 786
Total expenses 28,732 29,269
Operating profit before tax 16,275 15,504
Income tax 3,378 3,440
Net profit 12,897 12,064
Formoreinformation,seeNote15,Assetsclassifiedasheldforsale.
Key income tax components 2018 2017
Total 15,464 25,569
Standard tax 10,775 9,541
Income/expensefromforeigntaxratedifferences –146 –43
Income/expensefromchangesindeferredtaxassets 14 5,578 14,218
Income/expensefromdeferredtaxliabilities 23 –504 1,685
Income/expensefromprior-yearadjustments –239 168

Notes to the consolidated statement of income 164
Tocalculateearningspershare,thenumberofsharesconsistssolelyoftheweightedaveragenumberofsharesinissue.
41. Earnings per share 2018 2017
Net result 80,315 94,945
Shareofnon-controllinginterests –5,684 –5,437
Net result for calculation of earnings per share 74,631 89,508
Netresultforcalculationofearningspersharefromcontinuingoperations 61,734 77,444
Netresultforcalculationofearningspersharefromdiscontinuedoperations 12,897 12,064
Weightedaveragenumberofsharesinissue 400,000 400,000
Earningspershare(€) 186,58 223.77
Earningspersharefromcontinuingoperations(€) 154,34 193,61
Earningspersharefromdiscontinuedoperations(€) 32,24 30,16
Proposeddividendpershare(€) 149,94 149.08

Related parties 165
For transactions with key management personnel, see “Remuneration of the Statutory and Supervisory Boards”.
The Executive Board comprises our key management personnel and is responsible for implementing our strategy and managing our four core activities. The Board is made up of the Chairman of the Van Lanschot Kempen Statutory Board, the Van Lanschot Kempen CFO/CRO, the Van Lanschot Kempen COO and the members of the management team with responsibility for our core activities Private Banking, Asset Management and Merchant Banking.
RELATED PARTIES
Remuneration of Executive Board 2018 2017
Total 6,510 5,540
Fixed salary, amount in cash 2,961 2,999
Fixed salary, amount in shares of Van Lanschot Kempen NV1 1,949 1,225
Fixed payment for pension and disability insurance costs 1,600 985
Deferred variable pay for previous years, cash – 98
Deferred variable pay for previous years, shares – 234
Affiliates 2018 2017
Income Expenses Income Expenses
Stichting Pensioenfonds F. van Lanschot 950 – 941 –
1 Expenses recognised under IFRS-EU accounting for Van Lanschot Kempen NV shares differ due to the treatment under IFRS 2. For 2018, expenses under IFRS amounted to €1.993.
Parties with significant influence in Van Lanschot KempenOn the basis of regulatory guidelines, management has decided that entities with a shareholding of at least 5% in Van Lanschot Kempen are parties with significant influence in Van Lanschot Kempen.
At year-end 2018 and 2017, there were no income, charges or amounts payable or receivable to/from parties with significant influence in Van Lanschot Kempen.
Van Lanschot Kempen did not grant any guarantees in 2018 or 2017, and neither were impairments recognised for receivables.
For transactions in associates, see “Disclosures of interest in other entities”.

Disclosure of interests in other entities 166
Consolidated structured entities controlled by Van Lanschot KempenIn the consolidated statement of financial position we consolidate structured entities. These are designed in such a way that the voting rights are not the dominant factor in deciding who controls the entity, and the relevant activities are governed by contractual arrangements. Van Lanschot Kempen is exposed to substantially all of the risk of the structured entity and thereby controls it. Therefore these structured entities do not qualify as a transfer of financial assets and are not derecognised from our statement of financial position.
We consolidate the following structured entities:– Courtine RMBS 2013-I BV– Lunet RMBS 2013-I BV– Van Lanschot Kempen Conditional Pass-Through
Covered Bond Company BV
Courtine RMBS 2013-I BVOn 1 August 2013, we finalised the Courtine RMBS 2013-I transaction, involving Dutch home mortgages to an amount of €862.6 million. Repayments totalling €60.7 million were received in 2017. The facility for topping up the pool with mortgages was ended in 2016. The credit risk was not transferred and Van Lanschot Kempen purchased the debt instruments itself. Senior Class A2 notes are eligible for use as collateral with DNB. The transaction therefore supports the bank’s liquidity management and our role in the structure is that of pool servicer. The way the structure is set up, Van Lanschot Kempen does not have access to all liquidities of the Courtine RMBS 2013-I entity. At year-end 2018, the liquidity to which Van Lanschot Kempen had no access amounted to €12.8 million (2017: €12.8 million). Van Lanschot Kempen is also not able to sell the securitised loans to third parties. The structure does not impose any other restrictions on Van Lanschot Kempen.
Key judgements and assumptionsWe rely on key judgements and assumptions when determining control and significant influence. We have included these under the headings “Basis of consolidation” and “Summary of significant accounting policies”.
Interests in subsidiariesThe consolidated statement of financial position and statement of income comprise subsidiaries and entities in which Van Lanschot Kempen has control, but excludes the names of relatively minor subsidiaries and entities.
DISCLOSURE OF INTERESTS IN OTHER ENTITIES
Subsidiaries (%) 2018 2017F. van Lanschot Bankiers (Schweiz) AG 100 100
Kempen & Co NV 98 96
Van Lanschot Participaties BV 100 100
Quion 17 BV 100 100
AIO II BV 72 72
Allshare BV 97 97
Holowell Holding BV 90 90
No restrictions apply between Van Lanschot and its subsidiaries.

The Courtine transaction is a traditional securitisation. A characteristic of a traditional securitisation is that the beneficial title to the securitised receivables is transferred to an entity for securitisation purposes, which subsequently issues securities. The securities issued create a payment obligation for the securitisation entities rather than for Van Lanschot Kempen.
Lunet RMBS 2013-I BVThe Lunet RMBS 2013-I securitisation transaction, which became active in 2013, was redeemed on 28 December 2018, the first call date (FORD).
Conditional pass-through covered bond programme (CPTCB) Van Lanschot Kempen established a CPTCB programme in March 2015. Investors have a dual recourse claim: initially against Van Lanschot Kempen, and, in the event of the bank’s failure, against a pool of cover assets. In April 2015 the bank launched the first bond loan of €500 million (maturity of seven years: coupon of 0.275%).
The second bond loan of €500 million was placed in March 2016 (maturity of seven years: coupon of 0.375%) and the third bond loan of €500 million was placed in February 2017 (maturity of ten years: coupon of 0.875%). All loans were placed with institutional investors.
The tables below show the total amounts of the mortgage loans involved in each securitisation transaction.
Disclosure of interests in other entities 167
Securitised loans at 31/12/2018Fair value Carrying
amountStage 1 Stage 2 Stage 3 Impairments
Total 2,322,251 2,213,905 1,941,492 269,985 2,427 409
Courtine RMBS 2013-I BV 478,648 460,461 390,018 68,016 2,427 409
Covered bond programme 1,843,603 1,753,444 1,551,474 201,970 – –
Securitised loans at 31/12/2017Fair value Carrying
amountNeither past
due nor impaired loans
Past due loans Impaired loans Impairments
Total 3,138,782 3,068,977 3,065,356 1,257 2,363 285
Courtine RMBS 2013-I BV 538,286 526,314 524,682 520 1,112 285
Lunet RMBS 2013-I BV 663,424 648,670 648,420 – 250 –
Covered bond programme 1,937,073 1,893,993 1,892,254 737 1,001 –
Van Lanschot Kempen provides no financial or other support to the securitisation entities, and has no intention of providing such support.
Courtine RMBS 2013-I BVFitch
RatingsStandard &
Poor'sOriginal
principalDate of
securitisationPrincipal at
31/12/2018First call
option dateContractual
maturity date
Spread
Total 862,600 469,573
Senior Class A1 175,000 01/08/2013 – 26/09/2019 26/09/2050 1.15%
Senior Class A2 AAA AAA 370,000 01/08/2013 160,573 26/09/2019 26/09/2050 2.15%
Mezzanine Class B AAA AA+ 81,500 01/08/2013 81,500 26/09/2019 26/09/2050 0.00%
Mezzanine Class C 112,000 01/08/2013 112,000 26/09/2019 26/09/2050 0.00%
Junior Class D 115,500 01/08/2013 115,500 26/09/2019 26/09/2050 0.00%
Subordinated Class E 8,600 01/08/2013 – 26/09/2019 26/09/2050 0.00%

Non-consolidated structured entitiesAsset-backed securities (RMBS) are classified as financial assets at fair value through other comprehensive income. These RMBS investments are structured entities. We do not consolidate these because Van Lanschot Kempen is not exposed to substantially all of the risk of the structured entity. The table below shows Van Lanschot Kempen’s investments in non-consolidated structured entities and the total income from these investments. The Investments column shows the carrying value as recognised in the consolidated statement of financial position.
Van Lanschot Kempen has no other interests in non-consolidated structured entities such as commitments, guarantees, provisions, derivatives or other obligations. The maximum exposure to non-consolidated structured entities is equal to the acquisition cost and amounted to €501.3 million at 31 December 2018 (2017: €668.9 million).
Van Lanschot Kempen provides no financial or other support to non-consolidated structured entities, and has no intention of providing such support
Disclosure of interests in other entities 168
Non-controlling interests 31/12/2018 31/12/2017
Total 12,213 16,264
Kempen MIP 5,103 13,631
Consolidated investment funds 38 12
Consolidated shareholdings 7,072 2,621
Non-consolidated structured entities 2018Interest income Comprehensive
incomeTotal income Investments
Total 1,856 –2,549 –693 497,760
Asset-backed securities 1,856 –2,549 –693 497,760
Non-consolidated structured entities 2017Interest income Comprehensive
incomeTotal income Investments
Total 2,659 3,090 5,749 668,105
Asset-backed securities 2,659 3,090 5,749 668,105
Non-controlling interestsThe consolidated statement of financial position and statement of income include a number of non-controlling interests; a list of non-controlling interests in Van Lanschot Kempen subsidiaries is provided below.
Van Lanschot Kempen’s minority interests are recognised under non-controlling interests as part of equity.

Disclosure of interests in other entities 169
Kempen Management Investment Plan (MIP) Before the Kempen Management Investment Plan (MIP) was implemented in 2010, all Kempen shares were held by Van Lanschot NV. These shares were all converted into Class A ordinary shares following the implementation of the MIP. At the same time, within the scope of this implementation, Kempen issued 1,658,671 new Class B ordinary shares to Coöperatie MIP in exchange for a total purchase price of €15.0 million.
In 2013, the MIP’s structure changed, with Class A ordinary shares converted to ordinary shares and Class B shares to ordinary shares and profit-sharing certificates.
Coöperatie MIP has two members, Stichting MIP and Van Lanschot, which hold the membership rights issued by Coöperatie MIP, with Van Lanschot’s membership being legally required. Stichting MIP issued depositary receipts for its membership right in Coöperatie MIP to selected Kempen employees who accepted the offer to invest in the MIP. The total purchase price of the depositary receipts amounted to €15.0 million.
In 2018, Kempen employees who owned depositary receipts in MIP were offered a one-time opportunity to exchange (a part of) their depositary receipts for certificates for Van Lanschot Kempen shares with the same fair value.
Several employees decided to accept this offer, exchanging a total of 6,649 depositary receipts. At 31 December 2018, there were 15,000 depositary receipts in issue, i.e. 100% of the total available underlying depositary receipts under MIP.
Coöperatie MIP has granted Van Lanschot a call option to acquire the outstanding shares and profit-sharing certificates in MIP held by Coöperatie MIP. This call option may be exercised at any time during a three-month period starting on 1 January of every fifth year following the implementation of the MIP, the first of which started on 1 January 2016. Van Lanschot has the right to exercise the call option in the event of undesired outcomes with regard to the MIP or other unexpected circumstances. Therefore, the execution of the call option is designated as a contingent settlement alternative. As a contingent settlement alternative at 31 December 2018 is considered unlikely, the MIP is treated as a share-based payment transaction settled in equity instruments. Van Lanschot decided not to exercise the call option in the MIP in 2016, but to continue the MIP with a few adjustments to the return profile and governance structure. The earliest period in which Van Lanschot can exercise its call option will be from January to March 2021.
Movements in Non-controlling interests
2018 2017
Non-controlling interests
Undistributed profit attributable to non-controlling
interests
Total Non-controlling interests
Undistributed profit attributable to non-controlling
interests
Total
At 1 January 10,827 5,437 16,264 9,391 4,065 13,456
Profit appropriation 4,542 –4,542 – 3,393 –3,393 –
Dividend – –895 –895 – –672 –672
Result for the reporting period – 5,684 5,684 – 5,437 5,437
Other changes –8,840 – –8,840 –1,957 – –1,957
At 31 December 6,529 5,684 12,213 10,827 5,437 16,264
Kempen MIP 31/12/2018 31/12/2017
Number of depositary receipts issued 4,799 12,741
Legally required contribution by Van Lanschot Kempen (€) 100 100

Consolidated investmentsWe consolidate three investments in which non-controlling minority interests of third parties are included. These non-controlling interests of third parties in consolidated investments include minority stakes in AIO II BV of Breda, the Netherlands (28.40%), in Holowell Holding BV of Tholen, the Netherlands (9.77%), and in Allshare BV of Hoofddorp, the Netherlands (2.95%).
The table below provides aggregated information on consolidated investments.
Disclosure of interests in other entities 170
Financial information for Kempen MIP 31/12/2018 31/12/2017
Total assets 15,965 16,054
Total liabilities – –
Equity attributable to shareholders 10,862 2,423
Equity attributable to non-controlling interests 5,103 13,631
Total income from operating activities 965 1,054
Total expenses – –
Taxes – –
Net income 965 1,054
Of which attributable to shareholders 656 159
Of which attributable to non-controlling interests 309 895
Financial information consolidated investments 31/12/2018 31/12/2017
Total assets 49,400 42,670
Total liabilities 36,523 50,186
Equity attributable to shareholders 5,805 –10,137
Equity attributable to non-controlling interests 7,072 2,621
Total income from operating activities 52,126 53,149
Total expenses 34,142 38,691
Taxes 3,521 3,810
Net income 14,464 10,647
Of which attributable to shareholders 9,305 6,104
Of which attributable to non-controlling interests 5,158 4,544

Associates
Investments in associates using the equity methodAs part of our investment policy, we invest in medium-sized companies in the Netherlands, only holding minority of interests of between 20% and 49%. These investments are classified as investments in associates using the equity method.
The table below shows the largest investments in associates based on the carrying amount (excluding Van Lanschot Chabot Mandema & Partners, which is classified as held for sale).
Disclosure of interests in other entities 171
Name Activities Head office Interest
Bolster Investments Coöperatief UA
Bolster is a long-term investor specialising in taking minority shareholdings of 20-50% in private companies and pursuing a flexible, long-term investment horizon, allowing its companies portfolio to realise their long-term growth potential.
Amsterdam 29.75%
Fire Safety Holding BV (Gerco) Gerco is the Dutch market leader in the field of fire compartmentation of buildings.
Schoonhoven 42.50%
Marfo Food Group Holding BV Marfo creates and prepares fresh frozen meals for airlines, hospitals, care homes, detention centres and remote locations.
Lelystad 37.50%
Movares Group BV Movares provides engineering and consultancy services in the fields of mobility, infrastructure, spatial planning and transport systems.
Utrecht 36.30%
OGD Beheer BV OGD provides ICT services to medium-sized and large companies, public and semi-public and non-profit organisations. Its services include service management, outsourcing, software development and ICT training.
Delft 32.20%
Ploeger Oxbo Holding BV Ploeger Oxbo develops, manufactures and sells a wide range of specialist harvesting equipment to customers across the world.
Roosendaal 11.87%
Quint Wellington Redwood Holding1 BV
Quint is an independent consultancy focusing on the strategic management, sourcing and outsourcing, and implementation of IT-related processes in organisations.
Amstelveen 18.25%
Software Huis Holland BV (Kraan Bouwcomputing)
Kraan Bouwcomputing provides a wide range of software products for the construction and real estate sectors.
Rotterdam 49.00%
Tecnotion Investment BV Tecnotion designs, produces and sells linear motors across the world, to the semiconductor, electronics, LCD, automotive and robotics industries among others.
Almelo 37.98%
1 Not in any way linked to Wellington Management Group LLP.

Aggregated financial information of associates for which Van Lanschot Kempen applies the equity method
31/12/2018 31/12/2017
Associates, equity method
Attributable to Van Lanschot Kempen
Associates, equity method
Attributable to Van Lanschot Kempen
Total 134,451 54,071 224,500 70,390
Current assets 132,049 45,461 190,623 55,453
Non-current assets 385,906 89,198 276,243 94,586
Current liabilities –90,040 –25,562 –124,918 –42,408
Non-current liabilities –293,464 –54,296 –117,449 –37,511
Goodwill 7,653 5,851
Impairments –6,496 –7,356
Other –1,887 1,775
Other financial information
Dividend received 3,473 3,833
Income from operational activities 10,683 21,932
Share of net income 11,759 13,129
Unrecognised share of losses 3,517 3,207
Comprehensive income – –
The table below shows the income and expenses that we report in the statement of income and the positions included in the statement of financial position, as well as guarantees issued at year-end in respect of these entities.
Disclosure of interests in other entities 172
Transactions with associates using the equity method 31/12/2018 31/12/2017
Income 7 267
Expenses 30 –
Amount receivable 850 1,375
Amount payable 1,142 642
Guarantees 29 29
Loans granted to entities in which we exercise significant influence but do not have decisive control are granted on market terms and secured on collateral provided. No impairments were applied to the receivables in either 2018 or 2017.

Van Lanschot ParticipatiesInvestments using the equity method are managed by Van Lanschot Participaties, with the exception of our stakes in Bolster Investments Coöperatief. As part of its direct holdings, Van Lanschot Participaties issues subordinated loans and cumulative preference shares, while it also invests in a portfolio of equity funds. In addition, Van Lanschot Participaties is the controlling shareholder of a number of
stakes resulting from debt conversions and consolidated in the Van Lanschot Kempen accounts (note that this is not a core activity for Van Lanschot Participaties). The table below shows Van Lanschot Participaties’ financial impact on the consolidated statement of financial position and statement of income. The table does not include information about controlling interests.
Joint ventures in which Van Lanschot Kempen is a partner We have no joint ventures.
Disclosure of interests in other entities 173
Investment activity Item Carrying value
Interest Income from securities and
associates
Impairments Total
Direct investment Investment in associates using the equity method 37,938 – 9,832 783 10,615
Shareholdings Financial assets at fair value through profit or loss 7,042 768 – 109 877
Subordinated loans Loans and advances to the public and private sectors 1,510 157 – – 157
Fund investment Financial assets at fair value through profit or loss 7,429 – 2,114 – 2,114
Total 53,920 925 11,946 892 13,764

Commitments 174
Lease and rental agreementsWe have included the following operating lease payments in the statement of income under Other administrative expenses.
We expect to include the following minimum payments for contractually agreed lease and rental agreements over the next few years.
The remaining terms of the lease and rental agreements range between one month and ten years.
COMMITMENTS
Lease and rental agreements 2018 2017
Total 17,759 16,070
Minimum lease payments 5,259 5,531
Rent 12,500 10,539
Future payments for lease and rental agreements 31/12/2018 31/12/2017
Total 86,317 84,149
Within 1 year 16,198 15,738
1 to 5 years 44,835 39,239
More than 5 years 25,284 29,173
Commitments (€ million) 31/12/2018 31/12/2017
Rent
Rent for buildings (including service fees and rent for parking spaces) 77.7 75.1
Future lease payments
Car lease costs 7.8 8.6
Lease costs for copying equipment 0.8 0.4

Commitments 175
Other commitments
IT contracts In the past, Van Lanschot Kempen entered into several IT contracts, e.g. for hiring services and capacity, and for licensing and maintenance of our systems. Our future contractual payment commitments for the new and existing IT contracts amount to €37.8 million, as shown below.
Early termination of these contracts could result in additional costs. Exit fees are linked to the remaining term of the contracts.
Future payments for IT contracts
Total 37,776
Within 1 year 9,517
1 to 5 years 21,432
More than 5 years 6,826

Segment information 176
Segmentation of our activities is based on operating segments, as our risk and return profile is chiefly affected by differences in our products and services. Internal cost allocation is based on use of services. Our activities break down into six operating segments, while intrasegment transactions are conducted on an arm’s length basis.
Private BankingPrivate Banking offers private clients and entrepreneurs a broad range of products in the private banking market, while also focusing on business professionals and executives, healthcare professionals, foundations and associations.
EviEvi, Van Lanschot Kempen’s online investments and savings coach, targets people just entering the wealth management market and Private Banking clients preferring an online service in the Netherlands and Belgium. Its activities also specifically target mass-affluent individuals and Millennials.
Asset ManagementA specialist asset manager, Asset Management focuses on a range of investment strategies while also offering fiduciary services to domestic and international institutional clients such as pension funds and insurers.
Merchant BankingMerchant Banking offers specialist services including equities research and trading, mergers & acquisitions services, structured investment activities, capital market transactions and debt advisory services to institutional investors, corporates, financial institutions and public and semi-public entities.
Corporate BankingA team of experts within Corporate Banking is engaged in managing and winding down the real estate and SME loan portfolios not linked to Private Banking clients.
Other activitiesThese comprise activities in the fields of interest rate, market and liquidity risk management, staff departments, as well as the activities of Van Lanschot Participaties/Bolster and consolidated investments.
SEGMENT INFORMATION

Segment information 177
Operating segments in 2018 (€ million)
Private Banking Evi
Asset Management
Merchant Banking
Corporate Banking
Other activities Total
Statement of income
Net interest income 137.7 2.5 –0.0 –0.0 21.6 13.5 175.2
Income from securities and associates – – –0.2 – – 31.5 31.3
Net commission income 127.0 4.4 100.0 58.0 1.9 1.9 293.2
Profit on financial transactions 1.1 – –0.0 1.0 – –2.8 –0.8
Other income – – – – – 7.3 7.3
Total income from operating activities 265.7 6.9 99.8 58.9 23.5 51.4 506.3
Staff costs 105.7 4.2 45.8 26.3 1.0 80.7 263.7
Other administrative expenses 67.2 9.1 23.8 9.1 0.5 52.3 162.0
Allocated internal expenses 61.5 2.9 12.8 9.9 9.9 –97.1 –
Depreciation and amortisation 5.8 0.0 1.0 0.0 – 7.6 14.4
Impairments –2.9 0.0 – –0.0 –10.6 0.1 –13.4
Total expenses 237.4 16.2 83.4 45.3 0.8 43.7 426.8
Operating result before tax 28.4 –9.3 16.3 13.6 22.7 7.8 79.5
Operating result of discontinued operations before tax – – – – – 16.3 16.3
Operating segments in 2017 (€ million)
Private Banking Evi
Asset Management
Merchant Banking
Corporate Banking
Other activities Total
Statement of income
Net interest income 151.4 3.3 –0.0 0.0 33.1 8.0 195.9
Income from securities and associates
– – –1.2 – – 38.3 37.0
Net commission income 124.5 4.5 92.5 41.7 2.6 1.1 267.0
Profit on financial transactions 1.0 – –0.1 4.5 – 8.7 14.1
Other income – – – – – 8.5 8.5
Total income from operating activities 276.9 7.9 91.2 46.2 35.8 64.6 522.5
Staff costs 97.6 4.6 39.6 23.4 5.7 75.4 246.3
Other administrative expenses 71.6 7.9 21.9 8.0 2.3 56.9 168.5
Allocated internal expenses 57.9 7.0 10.9 9.2 12.1 –97.0 –
Depreciation and amortisation 4.4 0.0 0.6 0.0 – 9.1 14.2
Impairments –3.2 0.0 – – –6.0 –2.3 –11.5
Total expenses 228.3 19.5 73.0 40.6 14.0 42.1 417.5
Operating result before tax 48.6 –11.6 18.2 5.6 21.7 22.5 105.0
Operating result of discontinued operations before tax – – – – – 15.5 15.5

The tables below give additional information on the geographical spread of income from operations.
1 Other than financial instruments, deferred tax assets and post-employment assets.
Geographical segments in 2018 (€ million)
Netherlands Belgium Other Total
Statement of income
Total income from operating activities 450.0 30.5 25.8 506.3
Of which income from other segments –4.2 3.6 0.6 –
Statement of financial position
Due from banks 158.3 – – 158.3
Investments in associates using the equity method 54.1 – – 54.1
Total non-current assets1 212.4 – – 212.4
Geographical segments in 2017 (€ million)
Netherlands Belgium Other Total
Statement of income
Total income from operating activities 464.2 32.0 26.3 522.5
Of which income from other segments –6.9 5.8 1.2 –
Statement of financial position
Due from banks 47.2 – – 47.2
Investments in associates using the equity method 70.4 – – 70.4
Total non–current assets1 117.6 – – 117.6
Segment information 178

Segment information 179
Country-by-country reporting on a consolidated basis at 31 December 2018
Country Name of mainsubsidiary
Nature of activities
Average number of
staff (FTEs)
Total income from
operating activities
(€ million)
Operatingresult before
tax(€ million)
Income tax(€ million)
Government subsidies
(€ million)
Total 1,747 506.3 79.5 12.1 –
Netherlands Van Lanschot NV Wealth management 1,553 450.0 83.2 12.6 –
Belgium Van Lanschot NV branch
Wealth management 141 30.5 –5.3 –1.3 –
Switzerland F. van Lanschot Bankiers (Schweiz) AG
Wealth management
24 11.2 0.8 0.2 –
United Kingdom(England)
Kempen Capital Management NV branch
Asset management
14 6.3 0.3 0.3 –
United Kingdom (Scotland)
Kempen Capital Management (UK) Ltd
Asset management
9 5.3 0.4 0.1 –
United States Kempen & Co USA Inc.
Securities trading and research distribution 6 3.0 0.5 0.2 –
France Kempen Capital Management NV branch
Asset management
– – –0.4 – –
Country-by-country reporting on a consolidated basis at 31 December 2017
Country Name of mainsubsidiary
Nature of activities
Average number of
staff (FTEs)
Total income from
operating activities
(€ million)
Operatingresult before
tax(€ million)
Income tax(€ million)
Government subsidies
(€ million)
Total 1,779 522.5 105.0 22.1 –
Netherlands Van Lanschot NV Wealth management 1,580 464.2 102.1 19.3 –
Belgium Van Lanschot NV branch
Wealth management 143 32.0 –0.6 1.9 –
Switzerland F. van Lanschot Bankiers (Schweiz) AG
Wealth management
23 11.4 1.4 0.4 –
United Kingdom(England)
Kempen Capital Management NV branch
Asset management
20 7.2 0.3 0.1 –
United Kingdom (Scotland)
Kempen Capital Management (UK) Ltd
Asset management
8 5.2 1.8 0.3 –
United States Kempen & Co USA Inc.
Securities trading and research distribution 5 2.6 0.1 0.1 –
France Kempen Capital Management NV branch
Asset management
– – –0.1 – –

Company statement of financial position at 31 December 2018 180
31/12/2018 01/01/20181 31/12/2017
Assets
Cash and cash equivalents and balances at central banks 1 1,329,842 1,754,724 1,754,724
Government paper eligible for central bank refinancing 2 692,560 659,234 659,234
Due from banks 3 451,939 210,891 210,891
Loans and advances to the public and private sectors 4 8,568,397 9,034,501 9,045,505
Debt instruments 5 2,242,741 2,570,642 2,570,671
Equity instruments 6 23,542 83,379 83,379
Investments in group companies 7 235,449 336,571 336,688
Investments in associates using the equity method 8 25,707 17,116 17,116
Goodwill and other intangible assets 9 174,145 182,157 182,157
Property and equipment 10 43,641 50,046 50,046
Other assets 11 66,963 64,256 59,305
Derivatives 12 78,367 119,367 119,367
Accrued assets 11 111,379 176,716 176,716
Total assets 14,044,673 15,259,599 15,265,797
Liabilities
Due to banks 13 627,187 336,846 336,846
Public and private sector liabilities 14 9,197,804 10,142,490 10,142,490
Issued debt securities 15 2,491,729 2,966,575 2,966,575
Other liabilities 16 36,464 72,734 72,734
Derivatives 12 151,642 117,922 117,922
Accrued liabilities 16 88,944 107,056 107,056
Provisions 17 21,448 23,879 22,514
Subordinated loans 18 173,473 173,620 166,802
Total liabilities 12,788,691 13,941,122 13,932,938
Issued share capital 40,000 40,000 40,000
Share premium reserve 216,149 277,674 277,674
Revaluation reserve -3,065 9,681 14,012
Reserves required by law 29,442 36,446 36,446
Other reserves 898,825 865,169 875,220
Undistributed profit attributable to shareholder 74,631 89,508 89,508
Equity attributable to shareholder 1,255,982 1,318,478 1,332,860
Total equity 19 1,255,982 1,318,478 1,332,860
Total equity and liabilities 14,044,673 15,259,599 15,265,797
Contingent liabilities 20 359,628 272,555 272,555
Irrevocable commitments 21 849,353 819,584 819,584
1,208,981 1,092,139 1,092,139
COMPANY STATEMENT OF FINANCIAL POSITION AT 31 DECEMBER 2018Before profit appropriation (€1,000)
The number beside each item refers to the Notes to the company statement of financial position.
1 The company statement of financial position reflects new presentation requirements related to the application of IFRS 9 as from 1 January 2018.

2018 2017
Income from operating activities
Interest income 298,959 349,461
Interest expense 142,893 174,360
Net interest income 23 156,066 175,101
Income from associates using the equity method 3,693 –362
Other income from securities and associates 59,140 64,377
Income from securities and associates 24 62,833 64,015
Commission income 147,023 143,180
Commission expense 17,652 18,272
Net commission income 25 129,371 124,907
Result on financial transactions 26 536 11,004
Total income from operating activities 348,805 375,027
Expenses
Staff costs 27 173,454 165,044
Other administrative expenses 28 97,002 107,435
Staff costs and other administrative expenses 270,455 272,478
Depreciation and amortisation 29 12,429 11,196
Operating expenses 282,885 283,674
Impairments of financial instruments –14,193 –11,656
Other impairments 263 175
Impairments 30 –13,930 –11,481
Total expenses 268,954 272,193
Operating profit before tax 79,851 102,834
Income tax 31 5,220 13,327
Net result 74,631 89,508
COMPANY STATEMENT OF INCOME FOR 2018 (€1,000)
The number beside each item refers to the Notes to the company statement of income.
Company statement of income for 2018 181

Share capital Share premium
reserve
Revaluation reserves
Reserves required by
law
Other reserves
Undistributed profit
Total equity attributable to
shareholder
At 31 December 2017 40,000 277,674 14,012 36,446 875,220 89,508 1,332,860
Impact of adopting IFRS 9 – – –4,331 – –10,051 – –14,382
At 1 January 40,000 277,674 9,681 36,446 865,169 89,508 1,318,478
Net profit (statement of income) – – – – – 74,631 74,631
Total other comprehensive income – – –12,746 –1,499 –5,588 – –19,833
Total comprehensive income – – –12,746 –1,499 –5,588 74,631 54,798
Share plans – – – – 3,271 – 3,271
To other reserves – – – – 29,827 –29,827 –
To reserves required by law – – – –5,505 5,505 – –
Dividends/Capital return – –61,526 – – – –59,680 –121,206
Other changes – – – – 641 – 641
At 31 December 40,000 216,148 –3,065 29,442 898,825 74,631 1,255,982
COMPANY STATEMENT OF CHANGES IN EQUITY IN 2018 Before profit appropriation (€1,000)
Company statement of changes in equity in 2018 182

Share capital Share premium
reserve
Revaluation reserves
Reserves required by
law
Other reserves
Undistributed profit
Total equity attributable
to shareholder
At 1 January 40,000 318,521 20,249 35,413 860,553 65,735 1,340,470
Net profit (statement of income) - - - - - 89,508 89,508
Total other comprehensive income - - -6,237 -655 515 - -6,377
Total comprehensive income - - -6,237 -655 515 89,508 83,131
Share plans - - - - -1,720 - -1,720
To other reserves - - - - 16,380 -16,380 -
To reserves required by law - - - 1,688 -1,688 - -
Dividends/Capital return - -40,847 - - - -49,355 -90,202
Other changes - - - - 1,180 - 1,180
At 31 December 40,000 277,674 14,012 36,446 875,220 89,508 1,332,860
COMPANY STATEMENT OF CHANGES IN EQUITY IN 2017 (€1,000)
Company financial statements: basis of preparationThe company financial statements of Van Lanschot NV (formerly F. van Lanschot Bankiers NV) have been prepared in accordance with the legal requirements as set out in Part 9, Book 2 of the Dutch Civil Code. We have availed ourselves of the option offered in Article 362(8), Book 2 of the Dutch Civil Code to apply the same accounting principles in the company financial statements that apply to the consolidated financial statements (including the accounting principles for the presentation of financial instruments as equity or liabilities). The line items Investments in group companies and Investments in associates are exceptions to this general rule; these are accounted for using the equity method.
The company financial statements are denominated in euros, Van Lanschot’s functional and reporting currency. All amounts are in thousands of euros unless otherwise stated. The totals may not always match the sum of the individual values due to rounding.
Company statement of changes in equity in 2017 183

Company financial statements: basis of preparation 184
31/12/2017 01/01/2018
Carrying amount Remeasurements Carrying amount
Assets
Cash and cash equivalents and balances at central banks 1,754,724 –0 1,754,724
Government paper eligible for central bank refinancing 659,234 – 659,234
Due from banks 210,891 –0 210,891
Loans and advances to the public and private sectors 9,045,505 –11,004 9,034,501
Debt instruments 2,570,671 –28 2,570,642
Equity instruments 83,379 – 83,379
Investments in group companies 336,688 –116 336,571
Investments in associates using the equity method 17,116 – 17,116
Goodwill and other intangible assets 182,157 – 182,157
Property and equipment 50,046 – 50,046
Other assets 59,305 4,951 64,256
Derivatives 119,367 – 119,367
Accrued assets 176,716 – 176,716
Total assets 15,265,797 –6,198 15,259,599
Liabilities
Due to banks 336,846 – 336,846
Public and private sector liabilities 10,142,490 – 10,142,490
Issued debt securities 2,966,575 – 2,966,575
Other liabilities 72,734 – 72,734
Derivatives 117,922 – 117,922
Accrued liabilities 107,056 – 107,056
Provisions 22,514 1,366 23,879
Subordinated loans 166,802 6,818 173,620
Total liabilities 13,932,938 8,184 13,941,122
Issued share capital 40,000 – 40,000
Share premium reserve 277,674 – 277,674
Revaluation reserve 14,012 –4,331 9,681
Reserves required by law 36,446 – 36,446
Other reserves 875,220 –10,051 865,169
Undistributed profit attributable to shareholder 89,508 – 89,508
Equity attributable to shareholder 1,332,860 –14,382 1,318,478
Total equity and liabilities 15,265,797 –6,198 15,259,599
The following table provides information on the impact of adopting IFRS 9 as of 1 January 2018.
Debt instruments previously classified at amortised cost but which fail the SPPI testWe hold notes of our own securitisation transaction that failed to meet the SPPI test requirement for amortised cost classification under IFRS 9. As a result, these instruments, which amounted to €309 million, have been reclassified from debt instruments at amortised cost to debt instruments at fair value from the date of initial application of IFRS 9.
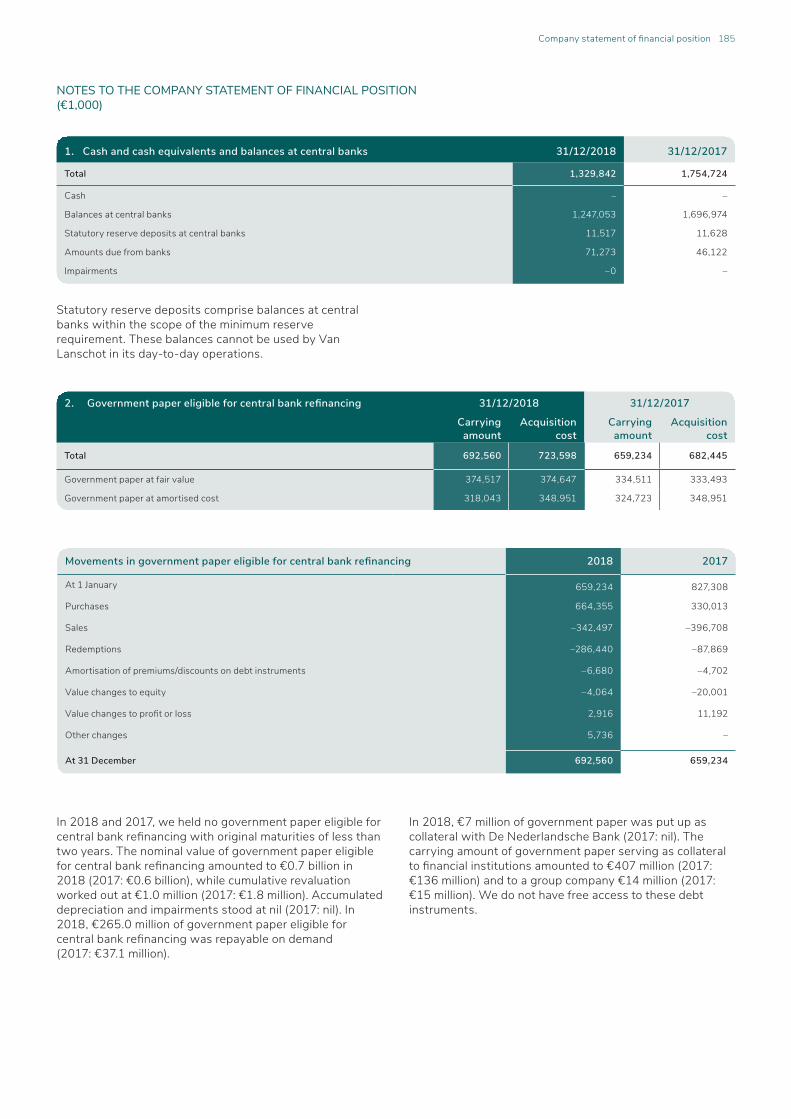
1. Cash and cash equivalents and balances at central banks 31/12/2018 31/12/2017
Total 1,329,842 1,754,724
Cash – –
Balances at central banks 1,247,053 1,696,974
Statutory reserve deposits at central banks 11,517 11,628
Amounts due from banks 71,273 46,122
Impairments –0 –
NOTES TO THE COMPANY STATEMENT OF FINANCIAL POSITION (€1,000)
Statutory reserve deposits comprise balances at central banks within the scope of the minimum reserve requirement. These balances cannot be used by Van Lanschot in its day-to-day operations.
In 2018 and 2017, we held no government paper eligible for central bank refinancing with original maturities of less than two years. The nominal value of government paper eligible for central bank refinancing amounted to €0.7 billion in 2018 (2017: €0.6 billion), while cumulative revaluation worked out at €1.0 million (2017: €1.8 million). Accumulated depreciation and impairments stood at nil (2017: nil). In 2018, €265.0 million of government paper eligible for central bank refinancing was repayable on demand (2017: €37.1 million).
In 2018, €7 million of government paper was put up as collateral with De Nederlandsche Bank (2017: nil). The carrying amount of government paper serving as collateral to financial institutions amounted to €407 million (2017: €136 million) and to a group company €14 million (2017: €15 million). We do not have free access to these debt instruments.
2. Government paper eligible for central bank refinancing 31/12/2018 31/12/2017
Carrying amount
Acquisition cost
Carrying amount
Acquisition cost
Total 692,560 723,598 659,234 682,445
Government paper at fair value 374,517 374,647 334,511 333,493
Government paper at amortised cost 318,043 348,951 324,723 348,951
Movements in government paper eligible for central bank refinancing 2018 2017
At 1 January 659,234 827,308
Purchases 664,355 330,013
Sales –342,497 –396,708
Redemptions –286,440 –87,869
Amortisation of premiums/discounts on debt instruments –6,680 –4,702
Value changes to equity –4,064 –20,001
Value changes to profit or loss 2,916 11,192
Other changes 5,736 –
At 31 December 692,560 659,234
Company statement of financial position 185

Company statement of financial position 186
3. Due from banks 31/12/2018 31/12/2017
Total 451,939 210,891
Payable on demand 9,452 4,011
Reverse repos 250,000 –
Other receivables 192,488 206,880
Impairments –0 –
4. Loans and advances to the public and private sectors 31/12/2018 31/12/2017
Total 8,568,397 9,045,505
Mortgage loans 5,547,173 5,525,032
Loans 2,183,186 2,412,080
Current accounts 829,791 1,137,053
Securities-backed loans and settlement receivables 86,382 82,083
Value adjustment fair value hedge accounting 31,299 7,841
Impairments –109,433 –118,584
The line item Due from banks comprises deposits to the value of €56.5 million (2017: €47.5 million) serving as collateral for obligations arising from derivatives transactions.
Receivables from group companies account for €125.0 million of this item (2017: €123.4 million).
The credit risk in the company financial statements is similar to that described in the consolidated financial statements. For more information, see Risk Management, subsection 2, Credit risk.
Please refer to the consolidated financial statements’ Summary of significant accounting principles for a more in-depth review of the criteria and the way in which we determine impairments and the write-down of loans and advances to the public and private sectors.
Receivables from group companies account for €996.6 million of this item (2017: €889.6 million).

Company statement of financial position 187
5. Debt instruments 31/12/2018 31/12/2017
Carrying amount
Purchase price
Carrying amount
Purchase price
Total 2,242,741 2,253,130 2,570,671 2,579,543
Debt instruments at fair value 1,845,986 1,844,816 1,631,334 1,613,173
Debt instruments at amortised cost 396,755 408,314 939,336 966,370
6. Equity instruments 31/12/2018 31/12/2017
Fair valuePurchase
price Fair valuePurchase
price
Total 23,542 34,339 83,379 92,438
Listed shares 848 845 32 25
Unlisted shares 22,694 33,494 83,347 92,413
Movements in debt instruments 2018 2017
At 31 December 2,570,671 2,517,286
Impact of adopting IFRS 9 –28 –
At 1 January 2,570,642 2,517,286
Purchases 656,866 643,771
Sales –369,097 –237,387
Redemptions –616,039 –374,826
Amortisation of premiums/discounts on debt instruments 12,215 15,782
Value changes to equity –2,213 10,369
Value changes to profit or loss –3,899 –4,324
Impairments – –
Other changes –5,735 –
At 31 December 2,242,741 2,570,671
Movements in equity instruments 2018 2017
At 1 January 83,379 33,236
Purchases 11,766 59,595
Sales –69,130 –10,560
Value changes to equity – –5,393
Value changes to profit or loss –2,474 6,549
Impairments – –48
At 31 December 23,542 83,379
The cumulative revaluation amounted to €1.1 million in 2018 (2017: €7.1 million). Accumulated depreciation and impairment was nil (2017: nil). The nominal value of these debt instruments amounted to €2.2 billion in 2018 (2017: €2.6 billion). In 2019, €787.5 million will be available on demand (2018: €977.6 million). Receivables from group companies account for €469.6 million of this item (2017: €742.7 million).
In 2018, there were no debt instruments serving as collateral to De Nederlandsche Bank (2017: €73 million).
The carrying amount of debt instruments serving as collateral to financial institutions amounted to €96 million (2017: €87 million) and €63 million for a group company (2017: €31 million). We do not have free access to these debt instruments.
For reverse repo transactions, we received debt instruments with a market value of €250 million, which are available to us for encumbrance.
The cumulative revaluation of equity instruments worked out at €0.0 million in 2018 (2017: €1.6 million). Cumulative impairments came to €0.1 million (2017: €0.1 million).
We purchased 94.40% of these shares (2017: 99.89%), with the intention to hold them for an indefinite period.

Movements in investments in group companies 2018 2017
At 31 December 336,688 446,550
Impact of adopting IFRS 9 –116 –
At 1 January 336,571 446,550
Purchases 10,802 11,916
Sales –9,600 –
Share premium (re)payment – –23,300
Liquidation – –4,848
Share of profit/(loss) 60,168 56,624
Revaluations –4,847 –6,483
Dividend received –160,443 –145,534
Other changes 2,798 1,762
At 31 December 235,449 336,688
Name Head office Interest
F.van Lanschot Bankiers (Schweiz) AG Zürich 100%
Kempen & Co NV Amsterdam 98%
Van Lanschot Participaties BV Amsterdam 100%
Van Lanschot Invest NV Antwerpen 100%
BV Beheer- en Beleggingsmaatschappij Orthenstraat 's-Hertogenbosch 100%
NNE BV 's-Hertogenbosch 100%
BV Foton, Maatschappij tot beheer van industrie- en handelsondernemingen 's-Hertogenbosch 100%
BV Beleggingsmaatschappij De Gevulde Trom 's-Hertogenbosch 100%
Sapphire Investments BV Amsterdam 100%
Bolster Feeder Fund Coöperatief UA Amsterdam 100%
Lesalanda BV Amsterdam 100%
Beheers en Beleggings Compagnie Silva Ducis BV 's-Hertogenbosch 100%
Van Lanschot Mezzaninefonds II BV 's-Hertogenbosch 100%
Vakan BV Amsterdam 100%
Quion 17 BV Capelle aan den IJssel 100%
Efima Hypotheken BV 's-Hertogenbosch 100%
LansOG Beheer BV 's-Hertogenbosch 100%
Investments in group companies are measured in accordance with the equity method of accounting, with the share in the profit of these interests recognised under Income from securities and associates in the company statement of income.
Cumulative revaluations of investments in group companies amounted to nil in 2018 (2017: €3.2 million). Accumulated impairments stood at nil (2017: nil).
Entities in which Van Lanschot NV exercises control: Courtine RMBS 2013-I BV Lunet RMBS 2013-I BV Van Lanschot Conditional Pass-Through Covered Bond Company BV
All investments in group companies are unlisted holdings.
Van Lanschot NV has issued undertakings pursuant to Article 403, Book 2 of the Dutch Civil Code to Kempen & Co NV.
Company statement of financial position 188
7. Investments in group companies 31/12/2018 31/12/2017
Total 235,449 336,688
Subsidiaries – credit institutions 19,246 19,846
Other subsidiaries 216,204 316,842

Movements in investments in associates 2018 2017
At 1 January 17,116 7,677
Purchases 6,331 9,800
Sales –590 –
Share of profit/(loss) 3,693 –362
Dividends received –843 –
At 31 December 25,707 17,116
Investments in associates are measured in accordance with the equity method of accounting, with the share in the profit of these interests recognised under Share of profit/(loss) in the company statement of income.
Cumulative revaluations of the investments in associates was nil in 2018 (2017: nil). Accumulated depreciation and impairments also stood at nil (2017: nil).
Van Lanschot Chabot Mandema & Partners and Bolster Investments Coöperatief UA are unlisted interests.
8. Investments in associates using the equity method 31/12/2018 31/12/2017
Total 25,707 17,116
Investments in associates 25,707 17,116
Company statement of financial position 189
Name Head office Interest
Van Lanschot Chabot Mandema & Partners 's-Hertogenbosch 49.00%
Bolster Investments Coöperatief UA Amsterdam 29.75%

Movements in goodwill and other intangible assets 2017 Goodwill Brands Other intangible
assets
Total
At 1 January 125,584 7,665 26,079 159,329
Additions 1,695 – 27,623 29,318
Amortisation – –767 –6,345 –7,111
Other – – 621 621
At 31 December 127,280 6,899 47,979 182,157
Historical cost 127,280 15,330 176,450 319,059
Accumulated amortisation and impairments – –8,432 –128,471 –136,902
Net carrying amount at 31 December 127,280 6,899 47,979 182,157
Company statement of financial position 190
9. Goodwill and other intangible assets 31/12/2018 31/12/2017
Total 174,145 182,157
Goodwill 127,280 127,280
Brands 6,132 6,899
Other intangible assets 40,733 47,979
Movements in goodwill and other intangible assets 2018 Goodwill Brands Other intangible
assets
Total
At 1 January 127,280 6,899 47,979 182,157
Additions – – 855 855
Disposals – – –136 –136
Amortisation – –767 –7,702 –8,468
Impairments – – –263 –263
At 31 December 127,280 6,132 40,733 174,145
Historical cost 127,280 15,330 165,586 308,196
Accumulated amortisation and impairments – –9,198 –124,853 –134,051
Net carrying amount at 31 December 127,280 6,132 40,733 174,145
The goodwill shown above represents goodwill arising from acquisitions. For the impairment test, this goodwill is allocated to the relevant cash-generating units. Additional information is included in Note 13 to the consolidated financial statements.

10. Property and equipment 31/12/2018 31/12/2017
Total 43,641 50,046
Buildings 33,215 38,514
Other property and equipment 10,320 11,300
Work in progress 106 231
Movements in property and equipment 2018 Buildings Other property and
equipment
Work in progress
Total
At 1 January 38,514 11,300 231 50,046
Capital expenditure 964 3,139 4,525 8,628
Disposals –4,045 –7 – –4,052
Capitalisation of investments – – –4,650 –4,650
Depreciation –2,221 –4,113 – –6,334
Impairments – – – –
Other 3 – – 3
At 31 December 33,215 10,320 106 43,641
Historical cost 71,784 22,998 106 94,888
Accumulated depreciation and impairments –38,569 –12,679 – –51,248
Net carrying amount at 31 December 33,215 10,320 106 43,641
Movements in property and equipment 2017 Buildings Other property and
equipment
Work in progress
Total
At 1 January 43,013 9,458 1,061 53,531
Capital expenditure 2,886 3,957 6,128 12,971
Disposals –6,125 – – –6,125
Capitalisation of investments – – –6,957 –6,957
Depreciation –2,214 –3,733 – –5,947
Impairments –36 – – –36
Other 990 1,619 – 2,609
At 31 December 38,514 11,300 231 50,046
Historical cost 88,819 64,991 231 154,042
Accumulated depreciation and impairments –50,305 –53,691 – –103,996
Net carrying amount at 31 December 38,514 11,300 231 50,045
Company statement of financial position 191
Buildings break down into real estate in own use (€29.7 million; 2017: €35.0 million) and real estate not in own use (€3.5 million; 2017: €3.5 million). Our policy is to sell over time any real estate no longer in own use.
Other property and equipment comprises information technology, furniture and fixtures, and communications and safety equipment. For more information about property and equipment, please refer to the consolidated financial statements’ Summary of significant accounting principles.

11. Other assets and accrued assetsOther assets relate to current tax assets (2018: €0.1 million, 2017: €1.1 million), deferred tax assets (2018: €22.9 million; 2017: €24.5 million) and amounts receivable, such as debtors, suspense accounts and intercompany assets.
Accrued assets relate to interest receivables, commission receivables and transitory items.
All current receivables fall due in less than one year. The fair value of the receivables approximates the carrying amount due to their short-term nature and the fact that provisions for bad debt are recognised, where necessary.
Liabilities to group companies accounted for €368.1 million of this item (2017: €321.1 million).
We use derivatives for both trading and hedging purposes. This note shows both the positive and negative market values of the derivatives, as well as their notional values.
The following types of derivatives are used: interest rate, inflation-linked, currency and equity derivatives, as well as forward contracts.
Company statement of financial position 192
12. Derivatives
At 31 December 2018 Assets Liabilities Contract amount
Total 78,367 151,642 6,274,986
Derivatives used for trading purposes 37,495 37,495 37,495
Derivatives used for hedge accounting purposes 23,290 62,492 4,928,750
Other derivatives 17,583 51,655 1,308,741
At 31 December 2017 Assets Liabilities Contract amount
Total 119,367 117,922 6,390,628
Derivatives used for trading purposes 35,630 35,136 127,025
Derivatives used for hedge accounting purposes 36,598 41,077 4,687,750
Other derivatives 47,138 41,709 1,575,853
13. Due to banks 31/12/2018 31/12/2017
Total 627,187 336,846
Liabilities withdrawable on demand 360,019 310,668
Repo transactions 250,000 –
Other liabilities 17,168 26,178
Savings include all deposit and savings accounts held by private individuals and not-for-profit organisations.
Liabilities to group companies accounted for €556.0 million of this item (2017: €1,368.9 million); of this amount, €460.5 million relates to the deemed loan to the SPVs (2017: €1,175.0 million).
14. Public and private sector liabilities 31/12/2018 31/12/2017
Total 9,197,804 10,142,490
Savings
Savings withdrawable on demand 1,446,571 1,827,002
Savings not withdrawable on demand 120,546 148,185
Total savings 1,567,117 1,975,186
Other public and private sector liabilities
Other public and private sector liabilities withdrawable on demand 6,697,929 6,512,613
Other public and private sector liabilities not withdrawable on demand 932,759 1,654,691
Total other public and private sector liabilities 7,630,687 8,167,304

Movements in issued debt securities 2018 2017
At 1 January 2,966,575 2,495,468
Purchases 169,182 772,715
Sales –1,549 –64,145
Redemptions –659,568 –220,067
Amortisation of premiums/discounts on debt instruments 3,593 –27
Other changes 13,496 –17,369
At 31 December 2,491,729 2,966,575
This item consists of debt instruments with rates of interest that are either fixed or variable, in so far as not subordinated. In 2019, €175.7 million of these debt securities become payable on demand (2018: €619.6 million). The discount on issued debt securities amounted to €6.7 million (2017: €10.3 million) and is included in the item’s carrying value.
Liabilities to group companies accounted for €29.9 million of this item (2017: €19.9 million).
16. Other liabilities and accrued liabilitiesOther liabilities relate to current tax liabilities (2018: €1.6 million; 2017: €2.9 million) and amounts payable such as creditors, suspense accounts and intercompany obligations.
Accrued liabilities relate to interest payable and other accruals.
All current liabilities fall due in less than one year. The fair value of the current liabilities approximates the book value due to their short-term nature
The pension provision is a long-term obligation we have entered into on behalf of employees in our offices in the Netherlands and Belgium. We operate both defined benefit and defined contribution schemes. For more information about these schemes, please refer to Note 22, Provisions, in the consolidated financial statements.
The tax provision is taken for assets whose value in the statement of financial position temporarily diverges from its value for tax purposes. This provision is generally of a long-term nature. For more information about the tax provision, please refer to Note 23, Tax liabilities, in the consolidated financial statements.
Other provisions comprise provisions taken for restructuring, the jubilee benefits scheme, the interest rate derivatives recovery framework, employee discounts, financial guarantees, and all other provisions. These provisions are 70% long-term and 30% short-term. For more information about other provisions, please refer to Note 22, Provisions, in the consolidated financial statements.
15. Issued debt securities 31/12/2018 31/12/2017
Total 2,491,729 2,966,575
Listed debt securities 1,814,551 2,203,009
Unlisted debt securities 677,179 763,566
17. Provisions 31/12/2018 31/12/2017
Total 21,448 22,514
Pension provision 9,042 9,044
Tax provision 2,002 6,744
Other provisions 10,404 6,725
Company statement of financial position 193

Company statement of financial position 194
Movements in subordinated loans 2018 2017
At 31 December 166,802 167,218
Impact of adopting IFRS 9 6,818 –
At 1 January 173,620 167,218
Redemptions –113 –113
Amortisation of premiums/discounts on debt instruments –416 –
Other changes 382 –303
At 31 December 173,473 166,802
18. Subordinated loans 31/12/2018 31/12/2017
Total 173,473 166,802
7.320% subordinated bond loan 08/33 26,205 25,000
7.218% subordinated bond loan 08/38 26,563 25,000
7.269% subordinated bond loan 08/43 53,634 50,000
3.396% subordinated bond loan 16/26 49,715 49,181
6.020% subordinated bond loan 04/24 16,676 16,827
Other subordinated loans 680 794
Subordinated loans provide solvency capital for Van Lanschot NV. Holders of our subordinated loans have a position in our capital structure between senior claims and share capital. This implies that, in the event of liquidation or bankruptcy, a holder of a subordinated bond will only be repaid after all senior claims have been settled. Depending on the instrument’s terms and conditions, early repayment (at its nominal amount) may take place at the optional redemption date and all subsequent interest payment dates.
Interest paid on subordinated loans amounted to €9.6 million (2017: €8.3 million).
The reserves required by law comprise a reserve in the amount of the share in the positive income from associates of €27.3 million (2017: €33.0 million), a reserve for currency translation differences on associates of €0.1 million (2017: €1.6 million) and a reserve required under the Articles of Association from subsidiaries of €2.1 million (2017: €1.9 million).
Tax effects on changes in the revaluation reserves worked out at €4.0 million positive in 2018 (2017: €0.9 million negative).
The liability capital comprises equity and subordinated loans, which are accounted for under non-current liabilities. At year-end 2018, the liability capital amounted to €1,429.5 million (2017: €1,499.7 million).
19. Equity 31/12/2018 31/12/2017
Total 1,255,982 1,332,860
Equity attributable to shareholder
Issued share capital 40,000 40,000
Share premium reserve 216,149 277,674
Revaluation reserve –3,065 14,012
Actuarial results on defined benefit pension scheme –17,591 –17,885
Cash flow hedge reserve –13,509 –9,825
Own credit risk reserve –11,394 –
Reserves required by law 29,442 36,446
Freely available reserves 941,319 902,929
Other reserves 925,203 925,678
Undistributed profit attributable to shareholder 74,631 89,508
Total equity attributable to shareholder 1,255,982 1,332,860

Company statement of financial position 195
Distributable items 31/12/2018 31/12/2017
Other reserves incl. retained earnings 925,203 925,678
Revaluation reserve –3,065 14,012
Actuarial results on defined benefit pension scheme –17,591 –17,885
Cash flow hedge reserve –13,509 –9,825
Own credit risk reserve –11,394 –
Reserves required by law 29,442 36,446
Freely available reserves 941,319 902,930
Share premium reserve 216,149 277,674
Total distributable items 1,157,468 1,180,605
20. Contingent liabilitiesThis item relates to guarantees (2018: €359.6 million; 2017: €272.6 million).
In 2018, we issued guarantees for a number of group companies in the amount of €225.7 million (2017: €150.9 million).
21. Irrevocable commitments 31/12/2018 31/12/2017
Total 849,353 819,584
Unused credit facilities 814,644 793,251
Other irrevocable commitments 34,709 26,334

22. Other notes to the statement of financial position
Foreign currency balance converted to eurosThe sum of assets in foreign currencies converted to euros amounted to €729.6 million (2017: €128.6 million) and the sum of liabilities in foreign currencies to €729.5 million (2017: €126.6 million).
Contractual maturity of assets and liabilitiesThe tables below show the assets and liabilities based on their remaining contractual terms to maturity at the reporting date, without taking behavioural aspects into account. These amounts reconcile with the values disclosed in the company statement of financial position.
Company statement of financial position 196
Contractual maturity of assets and liabilities at 31/12/2018
Withdrawable on demand
< 3 months ≥ 3 months < 1 years
≥ 1 years < 5 years
≥ 5 years Total
Assets
Due from banks 9,452 105,956 270,221 11,769 54,542 451,939
Loans and advances to the public and private sectors 1,520,594 51,708 80,665 390,522 6,524,907 8,568,397
Total assets 1,530,046 157,665 350,886 402,291 6,579,449 9,020,336
Liabilities
Due to banks 360,019 5,304 255,484 – 6,380 627,187
Public and private sector liabilities 8,269,894 71,104 538,679 234,735 83,392 9,197,804
Issued debt securities – 17,539 158,130 1,639,465 676,595 2,491,729
Subordinated loans – – – – 173,473 173,473
Total liabilities 8,629,913 93,947 952,293 1,874,200 939,840 12,490,193
Contractual maturity of assets and liabilities at 31/12/2017
Withdrawable on demand
< 3 months ≥ 3 months < 1 years
≥ 1 years < 5 years
≥ 5 years Total
Assets
Due from banks 4,011 176,623 17,296 2,000 10,962 210,891
Loans and advances to the public and private sectors 1,476,956 10,527 33,525 316,055 7,208,441 9,045,505
Total assets 1,480,967 187,150 50,821 318,055 7,219,403 9,256,396
Liabilities
Due to banks 310,668 17,613 8,565 – – 336,846
Public and private sector liabilities 8,409,224 46,061 1,218,057 299,067 170,082 10,142,490
Issued debt securities 417 2,172 73,989 1,195,502 1,694,495 2,966,575
Subordinated loans – – – – 166,802 166,802
Total liabilities 8,720,309 65,846 1,300,611 1,494,569 2,031,379 13,612,713

Company statement of financial position 197
Financial instruments at fair value at 31/12/2017
Fair value determination using listed market prices
Fair value determination using
observable market inputs
Fair value determination using
non-observable market inputs
Total
Assets
Government paper eligible for central bank refinancing 334,511 – – 334,511
Debt instruments 1,631,334 – – 1,631,334
Equity instruments 32 30,053 53,294 83,379
Derivatives (receivables) 34,089 85,278 – 119,367
Total assets 1,999,966 115,331 53,294 2,168,592
Liabilities
Issued debt securities – 965,999 24,778 990,777
Other liabilities 105 – 17 121
Derivatives (liabilities) 34,089 83,833 – 117,922
Total liabilities 34,194 1,049,832 24,794 1,108,820
Financial instruments at fair value at 31/12/2018
Fair value determination using listed market prices
Fair value determination using
observable market inputs
Fair value determination using
non-observable market inputs
Total
Assets
Government paper eligible for central bank refinancing 374,517 – – 374,517
Debt instruments 1,536,986 – 309,000 1,845,986
Equity instruments 848 18,791 3,903 23,542
Derivatives (receivables) 37,495 40,873 – 78,367
Total assets 1,949,845 59,664 312,903 2,322,412
Liabilities
Issued debt securities – 940,109 27,896 968,004
Other liabilities 333 – – 333
Derivatives (liabilities) 37,495 114,147 – 151,642
Total liabilities 37,828 1,054,256 27,896 1,119,979
Financial instruments measured at fair valueThe tables below show financial instruments designated at fair value through profit or loss. For a review of valuation models and techniques and for information about these instruments, see Risk management, Section 13, Fair value.
The table below shows value changes recognised in profit or loss and in the revaluation reserve of financial instruments designated at fair value.
Value changes of financial instruments designated at fair value
2018 2017
Item Value changes recognised in profit or loss
Value changes to revaluation
reserve
Total value changes
Value changes recognised in profit or loss
Value changes to revaluation
reserve
Total value changes
Government paper eligible for central bank refinancing 2,916 –4,064 –1,148 11,192 –20,001 –8,809
Debt instruments –3,899 –2,241 –6,140 –4,324 10,369 6,045
Equity instruments –2,474 – –2,474 6,549 –5,393 1,156
Derivatives –30,513 – –30,513 22,383 – 22,383
Issued debt securities 24,176 – 24,176 –19,413 – –19,413
Total –9,793 –6,305 –16,098 16,387 –15,025 1,362

Company statement of financial position 198
Financial instruments not recognised at fair valueThe table below shows the nominal and fair value of financial instruments not recognised at fair value, with the exception of financial instruments where the nominal value is a reasonable approximation of the fair value. The value of financial instruments not recognised at fair value is taken as the amount for which the instrument could be exchanged in a commercial transaction between willing parties, other than in a forced or liquidation sale. If there is an active market, we use the market value to determine the fair value. For financial instruments for which no market prices are available, the fair values shown in the table are estimated on the basis of the present value or other estimation or valuation methods.
Commitments not recognised in the statement of financial positionWe have entered into contracts for buildings – including service fees and rent for any parking spaces – as well as car lease and computer lease contracts. In the statement of income under Other administrative expenses, we have included an amount of €12.7 million. The remaining terms of the lease and rental agreements range between one month and ten years. The total of future minimum lease and rent payments amounts to €73.3 million, of which €12.0 million within one year, €37.8 million between one and five years, and €23.4 million after five years.
In the past, Van Lanschot entered into several IT contracts e.g. for hiring services and capacity, and for licensing and maintenance of our systems. Our future contractual payment commitments for new and existing IT contracts amount to €37.8 million, of which €9.5 million within one year, €21.4 million between one and five years, and €6.8 million after five years.
Financial instruments not recognised at fair value
2018 2017
Fair value Carrying amount
Fair value Carrying amount
Valued using Valuation method
Assets
Government paper eligible for central bank refinancing
335,285 318,043 346,517 324,723 Listed market prices Listed market prices
Due from banks 451,396 451,939 211,135 210,891 Observable market inputs
Discounted cash flows using applicable money market rates
Loans and advances to the public and private sectors
8,899,146 8,568,397 9,242,258 9,045,505 Unobservable market inputs
Discounted cash flows using current market fees for comparable loans and taking into account the creditworthiness of the counterparty
Debt instruments
– Other debt instruments at amortised cost
241,685 236,166 205,666 196,627 Listed market prices Listed market prices
162,777 160,589 757,793 742,710 Unobservable market inputs
Discount model
Liabilities
Due to banks 626,993 627,187 336,958 336,846 Observable market inputs
Discounted cash flows using applicable money market rates for liabilities
Public and private sector liabilities 9,253,033 9,197,804 10,400,363 10,142,490 Unobservable market inputs
Discounted cash flows using applicable money market rates for liabilities with a comparable term to maturity, taking account of own credit risk
Issued debt securities 1,532,911 1,523,724 2,005,384 1,975,798 Listed market prices Quoted prices in active markets
Subordinated loans 184,108 173,473 225,634 166,802 Unobservable market inputs
Discounted cash flows using applicable money market rates for liabilities with a comparable term to maturity, taking account of own credit risk

23. Net interest income 2018 2017
Total interest income 298,959 349,461
Interest income on cash equivalents 103 124
Interest income on banks and private sector 234,727 245,138
Interest income on debt instruments 16,879 48,592
Interest income on derivatives 42,116 53,096
Other interest income 5,134 2,512
25. Net commission income 2018 2017
Total 129,371 124,907
Securities commissions 9,152 12,030
Management commissions 109,665 100,457
Cash transactions and funds transfer commissions 7,646 9,079
Corporate Finance and Equity Capital Markets commissions 31 448
Other commissions 2,877 2,893
26. Result on financial transactions 2018 2017
Total 536 11,004
Gains/losses on securities trading –1,103 –1,650
Gains/losses on currency trading 7,181 7,199
Gains/losses on derivatives under hedge accounting –221 652
Gains/losses on trading derivatives 83 –139
Realised gains on debt instruments 3,764 6,407
Gains/losses on economic hedges – hedge accounting not applied –30,374 22,146
Gains/losses on financial assets and liabilities at fair value through profit or loss 21,207 –23,610
Interest expense 2018 2017
Total interest expense 142,893 174,360
Interest expense on balances at central banks 5,855 5,455
Interest expense on banks and private sector 54,203 77,584
Interest expense on issued debt securities 17,641 27,270
Interest expense on subordinated loans 9,575 8,306
Interest expense on derivatives 49,483 52,373
Other interest expense 6,136 3,372
Company statement of income 199
24. Income from securities and associatesThis item includes the income realised by associates, securities and other income related to associates and securities.
NOTES TO THE COMPANY STATEMENT OF INCOME (€1,000)

Company statement of income 200
2018 2017
Total 173,454 165,044
Salaries and wages 124,010 119,882
Pension costs 17,562 16,977
Other social security costs 15,690 14,078
Other staff costs 16,191 14,107
27. Staff costsThe average number of staff in 2018 was 1,328 (2017: 1,366), or 1,251 in full-time equivalents (2017: 1,286). Of these, 136 were employed outside the Netherlands (2017: 139).
28. Other administrative expensesOther administrative expenses comprise IT expenses, accommodation expenses, costs of marketing and communication, consultancy fees, office expenses and other administrative expenses.
For more information about our external auditors’ fees, please refer to Note 36, Other administrative expenses, in the consolidated financial statements.
29. Depreciation and amortisationThis item includes the depreciation and amortisation on buildings, IT, operating system software and communications equipment, application software, intangible assets arising from acquisitions, results on disposals of property and equipment, and other depreciation and amortisation.
30. ImpairmentsThis item comprises the balance of the recognised impairments and reversals of such impairments.
31. Income taxThis tax amount consists of the tax expense for the financial year on the operating result as disclosed in the statement of income, also allowing for any tax relief facilities. We have applied currently existing tax rules to determine the tax amount. The effective tax rate amounts to 6.5% (2017: 13.0%). Changes in the effective tax rate were mainly due to the equity holding exemption and non-deductible costs. In 2017, the effective tax also changed due to the statutory tax rate change in Belgium.
Van Lanschot NV is part of a fiscal unity for taxes, for corporate income tax as well as for VAT.
2018 2017Operating profit before tax 79,851 102,834
Prevailing tax rate in the Netherlands 25% 25%
Expected tax 19,963 25,709
Increase/decrease in tax payable due to:
Tax-free income from securities and associates -15,733 -15,970
Non-deductible costs 1,441 1,800
Adjustments to taxes for prior financial years -214 183
Impact of foreign tax differences -242 -52
Movements in deferred taxes -34 1,630
Other changes 41 26
-14,743 -12,382
Total tax 5,220 13,327

Profit appropriation 201
PROFIT APPROPRIATION
If the annual general meeting approves the dividend proposal as included in these financial statements, the appropriation of net result will be as follows:
Profit appropriation 2018 2017
Total 74,631 89,508
Addition to/withdrawal from reserves 14,657 29,845
Dividend on shares 59,974 59,663

Remuneration of the Statutory and Supervisory Boards 202
The total remuneration related to 2018, consisting of fixed salary, pension and disability insurance, amounted to €1,538,000 for Karl Guha (2017: €1,263,000); €994,000 for Constant Korthout (2017: €830,000); €994,000 for Arjan Huisman (2017: €830,000); and €994,000 for Richard Bruens (2017: €830,000).
For further details of remuneration received in 2018, see “Remuneration” on page 57.
REMUNERATION OF THE STATUTORY AND SUPERVISORY BOARDS
1 Expenses recognised under IFRS-EU accounting for Van Lanschot Kempen NV shares differ due to treatment under IFRS 2. For 2018, expenses under IFRS for Karl Guha amounted to €404, for Constant Korthout to €324, Arjan Huisman to €324, and for Richard Bruens to €324. A proportion of fixed salary is paid in the form of Van Lanschot Kempen NV shares. Karl Guha received 15,165 shares in two tranches (2017: 11,058 shares) and the other members of the Statutory Board each received 8,493 shares (2017: 9,830 shares). The number of shares granted in tranche 1 is based on the average share price for the first four trading days of 2018 (€26.28; 2017: €20.35); for tranche 2 the average share price is €24.53. IFRS takes the share price at grant date as the basis for recognition. This price for tranche 1 amounted to €26.28 (2017: €20.35) and the price for tranche 2 amounted to €24.53.
2 As of 2015, the remuneration of the Statutory Board was changed and variable pay was ended as part of the new remuneration policy. The table “Remuneration of Statutory Board” in the Remuneration section on page 58 of the directors’ report does not show variable remuneration payable in shares of Van Lanschot Kempen NV awarded. IFRS, as adopted within the European Union, prescribes that the costs of deferred variable share-based compensation should be spread over the period within which the relevant activities were performed. The vesting period for shares of Van Lanschot Kempen NV conditionally awarded in the 2014 financial year was 2015 to 2017; the shares vest in equal portions.
Total direct compensation of the individual members of the Statutory Board in 2018
Fixed salary, amount in cash
Fixed salary, amount in shares of
Van Lanschot Kempen NV1
Total fixed salary Deferred variable pay for previous years, shares of
Van Lanschot Kempen NV2
Total 2,087 1,323 3,410 –
Karl Guha 773 387 1,160 –
Constant Korthout 438 312 750 –
Arjan Huisman 438 312 750 –
Richard Bruens 438 312 750 –
Total direct compensation of the individual members of the Statutory Board in 2017
Fixed salary, amount in cash
Fixed salary, amount in shares of
Van Lanschot Kempen NV1
Total fixed salary Deferred variable pay for previous years, shares of
Van Lanschot Kempen NV2
Total 2,111 825 2,936 136
Karl Guha 779 225 1,004 34
Constant Korthout 444 200 644 34
Arjan Huisman 444 200 644 34
Richard Bruens 444 200 644 34
Pension and disability insurance costs for the individual members of the Statutory Board 2018 2017
Total 1,110 681
Karl Guha 378 225
Constant Korthout 244 152
Arjan Huisman 244 152
Richard Bruens 244 152

Remuneration of the Statutory and Supervisory Boards 203
No advances or guarantees have been granted to members of the Statutory Board. No impairments or write-offs have occurred on loans granted to Statutory Board members.
At 31 December 2018, the members of the Statutory Board held no options for depositary receipts for shares of Van Lanschot Kempen NV.
Number of depositary receipts for shares of Van Lanschot Kempen NV held by Statutory Board members in 2018
At 1 January Bought/awarded Sold/post-employment At 31 December
Total 154,677 32,403 – 187,080
Karl Guha 43,124 9,378 – 52,502
Constant Korthout 45,326 7,675 – 53,001
Arjan Huisman 24,939 7,675 – 32,614
Richard Bruens 41,288 7,675 – 48,963
Loans to Statutory Board members at 31 December 2018
At 31 December Repaid Interest Collateral
Total 1,988 349
Constant Korthout 357 93 2.30% Mortgage
150 – 1.90% Mortgage
Arjan Huisman 80 230 Floating Mortgage
Richard Bruens 537 18 1.90% Mortgage
600 – 1.90% Mortgage
264 8 1.90% Mortgage
Loans to Statutory Board members at 31 December 2017
At 31 December Repaid Interest Collateral
Total 2,336 245
Constant Korthout 450 – 2.30% Mortgage
150 – 1.90% Mortgage
Arjan Huisman – 220 1.40% Mortgage
310 – Floating Mortgage
Richard Bruens 554 17 1.90% Mortgage
600 – 1.90% Mortgage
272 8 1.90% Mortgage
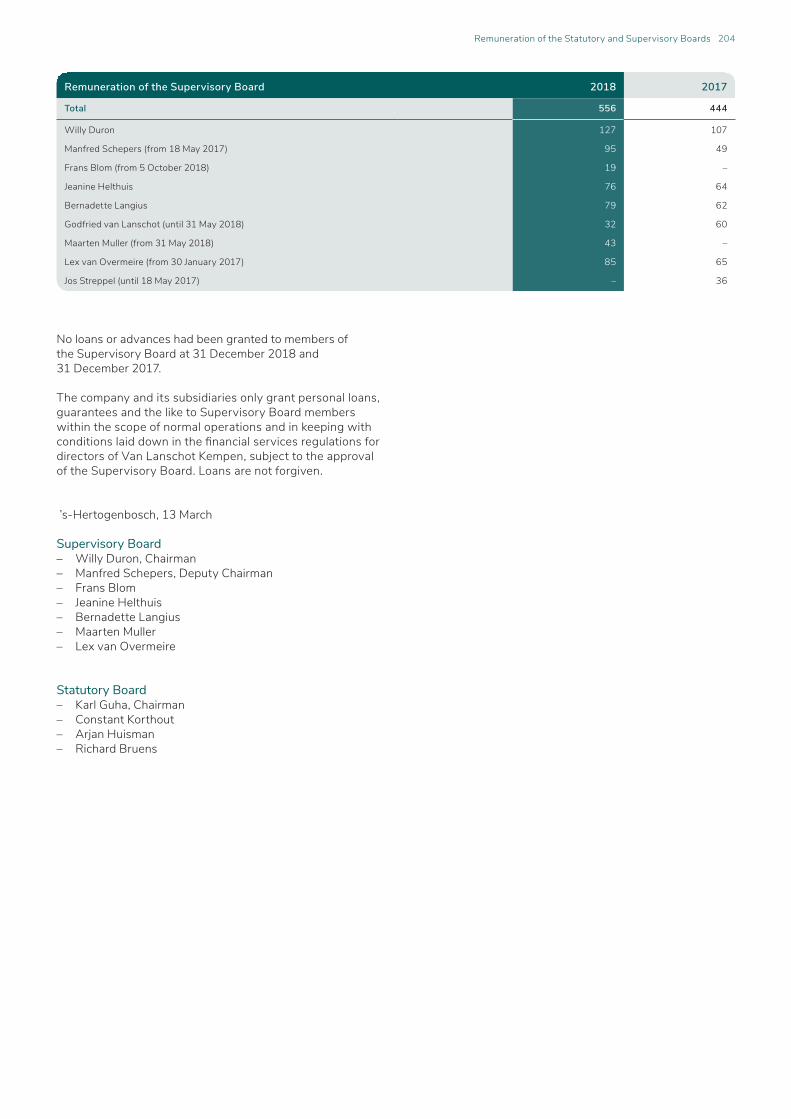
No loans or advances had been granted to members of the Supervisory Board at 31 December 2018 and 31 December 2017.
The company and its subsidiaries only grant personal loans, guarantees and the like to Supervisory Board members within the scope of normal operations and in keeping with conditions laid down in the financial services regulations for directors of Van Lanschot Kempen, subject to the approval of the Supervisory Board. Loans are not forgiven. ’s-Hertogenbosch, 13 March
Supervisory Board– Willy Duron, Chairman– Manfred Schepers, Deputy Chairman– Frans Blom– Jeanine Helthuis– Bernadette Langius– Maarten Muller– Lex van Overmeire
Statutory Board– Karl Guha, Chairman– Constant Korthout– Arjan Huisman– Richard Bruens
Remuneration of the Supervisory Board 2018 2017
Total 556 444
Willy Duron 127 107
Manfred Schepers (from 18 May 2017) 95 49
Frans Blom (from 5 October 2018) 19 –
Jeanine Helthuis 76 64
Bernadette Langius 79 62
Godfried van Lanschot (until 31 May 2018) 32 60
Maarten Muller (from 31 May 2018) 43 –
Lex van Overmeire (from 30 January 2017) 85 65
Jos Streppel (until 18 May 2017) – 36
Remuneration of the Statutory and Supervisory Boards 204

There have been no significant events since the reporting date that affect the relevance of information provided in the 2018 financial statements.
EVENTS AFTER THE REPORTING PERIOD
Events after the reporting period 205

Other information

To: the general meeting and supervisory board of Van Lanschot N.V.
Report on the financial statements 2018
Our opinionIn our opinion:• Van Lanschot N.V.’s consolidated financial statements give
a true and fair view of the financial position of the Group as at 31 December 2018 and of its result and cash flows for the year then ended in accordance with International Financial Reporting Standards as adopted by the European Union (EU-IFRS) and with Part 9 of Book 2 of the Dutch Civil Code;
• Van Lanschot N.V.’s company financial statements give a true and fair view of the financial position of the Company as at 31 December 2018 and of its result for the year then ended in accordance with Part 9 of Book 2 of the Dutch Civil Code.
What we have auditedWe have audited the accompanying financial statements 2018 of Van Lanschot N.V., Den Bosch (‘the Company’). The financial statements include the consolidated financial statements of Van Lanschot N.V. together with its subsidiaries (‘the Group’) and the company financial statements.
The consolidated financial statements comprise:• the consolidated statement of financial position at 31
December 2018;• the following statements for 2018: the consolidated
statement of income, the consolidated statement of comprehensive income, the consolidated statement of changes in equity and the consolidated statement of cash flows; and
• the notes, comprising significant accounting policies and other explanatory information.
The company financial statements comprise:• the company statement of financial position at 31
December 2018;• the company statement of income for 2018; and• the notes, comprising the accounting policies applied
and other explanatory information.
The financial reporting framework that has been applied in the preparation of the financial statements is EU-IFRS and the relevant provisions of Part 9 of Book 2 of the Dutch Civil Code for the consolidated financial statements and Part 9 of Book 2 of the Dutch Civil Code for the company financial statements.
The basis for our opinionWe conducted our audit in accordance with Dutch law, including the Dutch Standards on Auditing. We have further described our responsibilities under those standards in the section ‘Our responsibilities for the audit of the financial statements’ of our report.
We believe that the audit evidence we have obtained is sufficient and appropriate to provide a basis for our opinion.
IndependenceWe are independent of Van Lanschot N.V. in accordance with the European Regulation on specific requirements regarding statutory audit of public-interest entities, the ‘Wet toezicht accountantsorganisaties’ (Wta – Audit firms supervision act), the ‘Verordening inzake de onafhankelijkheid van accountants bij assuranceopdrachten’ (ViO – Code of Ethics for Professional Accountants, a regulation with respect to independence) and other relevant independence requirements in the Netherlands. Furthermore, we have complied with the ‘Verordening gedrags- en beroepsregels accountants’ (VGBA – Code of Ethics for Professional Accountants, a regulation with respect to rules of professional conduct). Our audit approach
Overview and contextVan Lanschot N.V. is a Dutch wealth management institution operating in the segments private banking, online investments and savings platform Evi, asset management, merchant banking, corporate banking and other activities. The Group is comprised of several components and therefore we considered our group audit scope and approach as set out in the section ‘The scope of our group audit’. We paid specific attention to the areas of focus driven by the operations of the Group, as set out below.
As part of designing our audit, we determined materiality and assessed the risks of material misstatement in the financial statements. In particular, we considered where the executive board made important judgements, for example, in respect of significant accounting estimates that involved making assumptions and considering future events that are inherently uncertain. In the section ‘Summary of significant accounting policies’, subsection ‘Significant accounting judgements and estimates’ on page 91 of the financial statements the Company describes the areas of judgement in applying accounting policies and the key sources of estimation uncertainty. Of the judgements and estimates mentioned in this section we considered the impairments of financial assets (of which impairment of loans and advances to the public and private sectors is part) and the determination of fair value of financial instruments as most significant for the financial year 2018. Given the significant estimation uncertainty and significance of both the impact on the organisation and the Group results of the implementation of the new accounting standard IFRS 9, we consider the following matters key audit matters, as set forth in the key audit matter section of this report: the impairment of loans and advances to the public and private sectors and the valuation of financial instruments at fair value.
The various IT change initiatives (such as the outsourcing of operational activities to third parties, the large scale phasing out of legacy computer systems, the optimisation of the regulatory reporting tool and the realisation of a one control
INDEPENDENT AUDITOR’S REPORT
Independent auditor's report 207

documentation environment across the Group) bring inherent operational and reputation risks that could also have an indirect and direct impact on the business and financial reporting processes of the Group.
As these change initiatives may affect systems, processes and the effectiveness of controls they could affect the financial statements and our audit. Therefore, we also included this as part of the key audit matter reliability and continuity of IT systems.
Other areas of focus in our audit of the financial statements, but that were not considered to be key audit matters, were the implementation of new accounting standards (e.g. IFRS 9, 15 and 16), goodwill, deferred tax assets, share-based payments, intended sale of participation AIO II (note 15 in the financial statements) and non-financial information.
As in all of our audits, we also addressed the risk of management override of internal controls, including evaluating whether there was evidence of bias by the executive board that may represent a risk of material misstatement due to fraud and non-compliances with laws and regulations.
As part of our responsibility, we ensured that the audit teams at both group and component level included the appropriate skills and competences, which are needed for the audit of a wealth management organisation with banking operations. We therefore also included specialists in the areas of IT, accounting and valuation of financial instruments, fraud, employee benefits and taxation in our team.
The outline of our audit approach was as follows:
Independent auditor's report 208
Materiality– Overall materiality: €4.7 million.
Audit scope– We conducted audit work primarily in the Netherlands.– Site visits were conducted to Belgium and Switzerland.– Audit coverage: 98.2% of consolidated revenue, 99.2% of consolidated total assets and
95.2% of consolidated profit before tax.
Key audit matters– Impairments of loans and advances to the public and private sectors.– Fair value measurement of financial instruments.– Reliability and continuity of IT systems.
Overall Group materiality €4.7 million (2017: €6.025 million).
Basis for determining materiality We used our professional judgement to determine overall materiality. As a basis for our judgement we used 5% of profit before tax from both continuing and discontinued operations.
Rationale for benchmark applied We used profit before tax as the primary benchmark, a generally accepted auditing practice, based on our analysis of the common information needs of users of the financial statements. On this basis, we believe that profit before tax is an important metric for the financial performance of the Company. We included both profit before tax from continuing and discontinued operations in our benchmark. The profit before tax resulting from discontinued operations relates to the component AIO II B.V. which is intended to be divested in 2019.
Component materiality To each component in our audit scope, we, based on our judgement, allocate materiality that is less than our overall group materiality. The range of materiality allocated across components was between €1.0 million and €4.7 million. Certain components were audited to a local statutory audit materiality that was also less than our overall group materiality.
MaterialityThe scope of our audit is influenced by the application of materiality, which is further explained in the section ‘Our responsibilities for the audit of the financial statements’.
Based on our professional judgement, we determined certain quantitative thresholds for materiality, including the overall materiality for the financial statements as a whole as
set out in the table below. These, together with qualitative considerations, helped us to determine the nature, timing and extent of our audit procedures on the individual financial statement line items and disclosures and to evaluate the effect of identified misstatements, both individually and in aggregate, on the financial statements as a whole and on our opinion.

Independent auditor's report 209
We also take misstatements and/or possible misstatements into account that, in our judgement, are material for qualitative reasons.
We agreed with the supervisory board that we would report to them misstatements identified during our audit above €235 thousand (2017: €300 thousand) as well as misstatements below that amount that, in our view, warranted reporting for qualitative reasons.
The scope of our group auditVan Lanschot N.V. is the parent company of a group of entities. The financial information of this Group is included in the consolidated financial statements of Van Lanschot N.V.
We tailored the scope of our audit in such a way to ensure that we performed sufficient work to be able to give an opinion on the financial statements as a whole, taking into account the management structure of the Group, the nature of operations of its components, the accounting processes and controls, and the markets in which the components of the Group operate. In establishing the overall group audit strategy and plan, we determined the type of work required to be performed at component level by the Group engagement team and by each component auditor.
The group audit primarily focused on the significant components: Van Lanschot N.V., Kempen & Co N.V., Van Lanschot Belgian Branch, F. van Lanschot Bankiers (Schweiz) AG, Van Lanschot Participaties B.V. and AIO II B.V. As these components were individually financially significant to the Group, they were subject to audits of their complete financial information.
Additionally, we selected one component (Quion 17 B.V.) for which audit procedures were performed to achieve appropriate coverage on financial line items in the consolidated financial statements.
In total, in performing these procedures, we achieved the following coverage on the financial line items:
None of the remaining components represented more than 1% of total group revenue or total group assets. For those remaining components we performed, among other things, analytical procedures to corroborate our assessment that there were no significant risks of material misstatements within those components.
For the components Van Lanschot Belgian Branch, F. van Lanschot Bankiers (Schweiz) AG and AIO II B.V. we instructed component auditors that are familiar with the local laws and regulations to perform the audit work. For the other significant components, the group audit team performed the work.
Where component auditors performed the work, we determined the level of involvement we needed to obtain from their audit work to be able to conclude whether
sufficient appropriate audit evidence as a basis for our opinion on the consolidated financial statements as a whole is obtained. We issued instructions to the component audit teams in our audit scope and these instructions included amongst others our risk analysis, the expected materiality to be applied and requested scope of the work to be performed by them. We explained to the component audit teams the structure of the Group, the main developments that are relevant for the component auditors, the risks identified, the materiality levels to be applied and our global audit approach. We had individual calls with each of the in-scope component audit teams during the year including upon conclusion of their work. During these calls, we discussed the significant accounting and audit issues identified by the component auditors, the reports of the component auditors, the findings of their procedures and other matters and developments, which could be of relevance for the consolidated financial statements.
The group engagement team visits the most significant component teams and local management. Therefore, the group audit team visited the Belgian and Swiss components given the significance of these components to the Group’s financial information as a whole. On a rotational basis we review a selection of working papers of component auditors. For this year, we reviewed a selection of working papers of the Belgian component.
The group engagement team performed the audit work on the Group consolidation, financial statement disclosures and a number of complex items at the head office. These included derivative financial instruments, hedge accounting and the impairments of loans and advances to the public and private sectors (including the implementation of the new IFRS 9 accounting standard).
The Company has outsourced part of its IT activities, its mortgage administration services and its treasury software. In our assessment of these service providers, we made use of the ISAE 3402 Type 2 report from reliable independent auditors. In this context, for the ISAE 3402 for the outsourced mortgage administration services, we have been involved in planning the ISAE 3402 work by the service provider auditors. For all ISAE 3402 work, we discussed progress and interim findings of the audit and, finally, evaluated the ISAE 3402 assurance reports once they were finalised. Based on these procedures performed, we conclude that in the context of our audit of the financial statements of the Company, we could rely on the ISAE 3402 Type 2 assurance reports.
By performing the procedures above at components, combined with additional procedures at group level, we have been able to obtain sufficient and appropriate audit evidence on the Group’s financial information, as a whole, to provide a basis for our opinion on the financial statements.
Key audit mattersKey audit matters are those matters that, in our professional judgement, were of most significance in the audit of the financial statements. We have communicated the key audit matters to the executive board and the supervisory board. The key audit matters are not a comprehensive reflection of all matters identified by our audit and that we discussed. In this section, we describe the key audit matters and include a summary of the audit procedures we performed on those matters.
Revenue 98.2%
Total assets 99.2%
Profit before tax 95.2%

Independent auditor's report 210
Key audit matter Our audit work and observations
Impairments of loans and advances to the public and private sectorsSee note 9 to the financial statements for the disclosures of loans and advances to the public and private sectors including impairments, the paragraph ‘Impairments’ of the summary of significant accounting principles and subsection 2.8 and 2.9 of the risk management paragraph containing the disclosures in view of credit risk.
The gross loans and advances to the public and private sectors amount to €8,561 million, the total impairment as at 31 December 2018 amounts to €112.8 million.
As at 1 January 2018, the Company has adopted accounting standard IFRS 9 and moved from an incurred loss model to an expected credit loss (ECL) model resulting in an impact on the impairment of loans and advances to public and private sectors of €11.1 million, which has been recognised in the opening balance of retained earnings.
Three-stage expected credit loss impairment modelIn connection with the implementation of the new accounting standard IFRS 9 ‘Financial instruments’ as from 1 January 2018, the Company implemented a three-stage expected credit loss impairment model consisting of:– stage 1 (gross carrying amount €7,559 million, impairment €3.7
million): recognition of allowances measured at an amount equal to the 12 month expected credit losses of the financial assets (loans and advances to the public and private sectors);
– stage 2 (gross carrying amount €1,400 million, impairment €8.6 million): recognition of allowances measured at an amount equal to the lifetime expected credit losses for financial assets for which credit risk has significantly increased since initial recognition, but that are not credit-impaired; and
– stage 3 (gross carrying amount €336 million, impairment €100.5 million): financial assets that are credit-impaired.
The Company determines loan impairments in stage 1, and 2 on a modelled basis. For stage 3 exposures, a loan by loan impairment is determined on which a model overlay is applied to account for macro-economic variables and forward-looking information.
Model methodology and inputsFor the modelled loan impairments the Company utilises the point in time probability of default (PD), the loss given default (LGD) and the exposure at default (EAD) models for the majority of the loan portfolio. The critical data elements as input for these models are retrieved from the core banking source systems. Three global macro-economic scenarios are incorporated into these models and the probability of the scenarios is weighted in order to determine the expected credit losses. When specific macro-economic exposures are not sufficiently covered by the models or when data limitations or other inherent model limitations are identified, a top-level adjustment is made.
Stage 3 – specific impairment allowanceFor each individually impaired loan the Company determines an impairment allowance based on the most likely scenario taking into account timely identification of impairment triggers, expected future cash flows, discount rates and the value and recoverability of the corresponding collateral. This impairment allowance is the neutral scenario (baseline). A model overlay is applied to calculate for alternative scenarios and the impact of macro-economic variables and forward-looking information. The final ECL is a weighted average over scaled ECLs under the neutral and alternative scenarios.
Control design and operation effectivenessWe evaluated the design and tested the operating effectiveness of key controls in the following areas:– credit management process to assess the loan quality classification to
identify impaired loans;– implementation of a new definition of default;– input controls and data lineage in respect of the critical data elements;– the governance over the development, validation, calibration and
implementation of the impairment models;– the completeness and accuracy of the transfer of data from underlying
source systems to the expected loss calculations;– the review and approval process that management has in place for
stage transfers between reporting periods;– the review and approval process that management has in place for the
outputs of the impairment models, and the top level adjustments that are applied to the model outputs; and
– the valuation of future cash flows and existence and valuation of collateral, based on the appropriate use of key parameters for the stage 3 - specific impairment allowance.
Based on the testing of controls, we determined that it was appropriate to place reliance on the above controls for the purpose of our audit.
Assessment of model-based impairmentsWith support of our internal valuation experts we performed the following procedures on the model-based impairments:– evaluation of the reasonableness of the applied model methodology
in line with IFRS-EU;– evaluation of the macro-economic scenarios and macro-economic
variables applied;– testing the input data and data lineage in respect of the critical data
elements;– challenging management on the reasonableness of their provided
explanations and evidence supporting the key model parameters;– reperformance of the key tests per model on initial calibration and
continued model monitoring performance in view of model validation;– assessment of the dashboard covering the outcomes of the model
performance as at 31 December 2018; and– assessment of stage transfers as at 31 December 2018.
Based on the above we assessed the methodology and inputs to be in line with market and industry practice.
Assessment of stage 3 – specific impairment allowance (baseline scenario)Considering the inherent estimation risk of individually impaired loans (stage 3), we performed risk-based sample testing and selected samples from both the whole loan portfolio as well as from the stage 3 – specific impaired loans population and analysed the latest developments at the borrower and considered whether the key judgements applied in the impairment allowance are acceptable for both the balance as at 1 January 2018 and 31 December 2018.
We substantively tested for a risk-based sample of the loans and advances the judgemental elements including:– classification as a performing or non-performing loan based on the
(non-)existence of triggering events;– nature and accuracy of the expected future cash flows with reference
to the current economic performance, the assumptions most commonly used in the industry, and a comparison with external evidence or historical trends;
We addressed the key audit matters in the context of our audit of the financial statements as a whole, and in forming our opinion thereon. We do not provide separate opinions on these matters or on specific elements of the financial statements. Any comments or observations we made on the results of our procedures should be read in this context.
These key audit matters are in line with our prior year’s auditor’s report, as they relate to the operations of the bank, except for the inclusion of IFRS 9 in the key audit matter related to impairments of loans and advances to the public and private sectors since the new standard replaced IAS 39.

Judgements and estimation uncertaintyThe judgements and estimation uncertainty in the impairment allowance of loans and advances is primarily linked to the following aspects:– the identification of impaired loans including the assessment for
which loans credit risk has significantly (de)/increased since inception (stage transfers);
– the determination of the future cash flows based on the appropriate use of key parameters (such as forward-looking information) and the valuation of the recoverable collateral for the specific loan by loan (stage 3) impairment allowance. Furthermore the probability weighting of each impairment scenario in this category is inherently subjective in nature;
– the assumptions regarding the PDs, LGDs and EADs applied including the assumptions applied in overlay models in the model based impairment allowances (stages 1 and 2); and
– any top side adjustments that management applies across the model based impairment allowances (stages 1 and 2).
Given the illustrated complexity, judgements and the impact it may have on the results, this area is subject to risk of material misstatement. Therefore, we consider this area as a key audit matter in our audit.
– the accuracy of the applied discount rate with reference to external sources; and
– the valuation of the corresponding collateral (for example using appraisal reports and/or other information) with support of our valuation experts, with reference to industry standards and the inspection of legal agreements and supporting documentation to confirm the existence and legal right to collateral.
We found that management’s judgement is supported by available evidence.
Finally, we assessed the main areas of judgement and estimates are disclosed in the financial statements in line with the requirements of the IFRS 9 standard as included in EU-IFRS.
Fair value measurement of financial instrumentsSee notes 2, 4, 5, 6, 7, 17, and 20 to the financial statements for the disclosures of the financial instruments valued at fair value and subsection 13 of the risk management paragraph in the financial statements: ‘fair value’ that contains the fair valuation policies, its disclosures and the split of financial instruments to level 1, 2 and 3.
The total asset value of financial instruments measured at fair value as at 31 December 2018 amounts to €2,417 million and the total liability value amounts to €1,410 million.
The fair value measurement of financial instruments consists of:– financial assets and liabilities from trading activities;– derivatives;– financial assets and liabilities at fair value through profit or loss; and– financial assets at fair value through other comprehensive income.
Level 1 financial instruments (€2,061 million assets, €40 million liabilities)For financial instruments traded in active markets and for which observable market prices or other market information is available (level 1), there is limited judgement involved in determining the fair value of these instruments.
Level 2 and 3 financial instruments (€356 million assets, €1,370 million liabilities)However, when directly observable market prices or other market information are not available the fair value is subject to (significant) judgement. Fair value of financial instruments significantly affects the measurement of profit and loss and disclosures of financial risks in the financial statements.
The fair value of such financial instruments is determined using either proxy valuations (level 2) or valuation techniques (such as discounted cash flow models and option valuation models) (level 3) in which judgements made by management and the use of assumptions and estimates such as market prices, credit spreads, (amongst others CVA/DVA) yield curves, correlations and volatilities are important factors.
Due to the magnitude of financial instruments measured at fair value, the migration to the new treasury system Ambit, the complexity of the valuation techniques used and the judgements applied by management’s measurement of such financial instruments (level 2 and level 3 financial instruments), this area is subject to risk of material misstatement. Therefore, we determined this to be a key audit matter for our audit.
We evaluated the design and tested the operating effectiveness of the internal controls with respect to the governance over the applied valuation models, the financial instrument deal capturing process, the source data management and the valuation of financial instruments.
We determined that we could rely on these controls for the purpose of our audit.For each type of level 2 and 3 financial instruments we tested, with support of our valuation specialists, the outcome of management’s valuation process as follows:– testing the appropriateness of the settings within the applied
valuation models used with market practices;– comparing on a sample basis the observable input data with
independent data sources and externally available market data (where available), which included assumptions and estimates such as market prices, credit spreads, (amongst others CVA/DVA) yield curves, correlations and volatilities;
– evaluating the inputs and models used in determining the unobservable inputs via independent sources where available;
– independently re-performing, on a sample basis, the valuation using our own valuation tools and with external data sources where available; and
– assessing the appropriateness of the classification as either level 1, level 2 or 3.
We found that management’s outcome of the models and classification used for the fair value of the level 2 and 3 financial instruments fell within a reasonable and acceptable range of outcomes.
We assessed the completeness and accuracy of the disclosures relating to the level 1, level 2 and 3 financial instruments measured at fair value and verified compliance with disclosure requirements from EU IFRS.
Independent auditor's report 211

Reliability and continuity of IT systemsThe Group relies on the reliability and continuity of information technology (IT) systems for its operational, regulatory and financial reporting processes.
The Goup’s accounting and reporting processes are heavily dependent on IT general controls (ITGCs) that establish and preserve the ongoing integrity of the system access rights and restrictions intended in the design of internal control.
The Group is executing a significant number of IT projects and implementing cybersecurity measures to continue to meet the high reporting standards and expectations from stakeholders relating to operating effectiveness, efficiency, cybersecurity and data quality. In this way the Group is accommodating the ongoing regulatory changes imposed to the banking industry. These projects result to changes in several of the Group’s control activities related to financial reporting. This could increase the risk of material misstatement in financial reporting.For 2018 the IT related implementation for IFRS 9 and the migration to a new treasury system are considered the most significant IT projects that were completed during the year.
Deficiencies in ITGCs as such could have a pervasive impact across the Company’s internal control framework. Also the outsourcing to third party service providers is considered an additional focus area to our audit as this brings extra complexity to the IT environment. Through the period of change, there is an increased risk that ITGCs are not operating as intended. Therefore, we identified the reliability and continuity of information technology of the Company as a key audit matter.
As part of our audit, our efforts were focused on:– entity level controls over information technology in the IT
organisation, including IT governance, IT risk management and cybersecurity management;
– governance over the strategic IT transformational projects including vendor risk and third party assurance;
– for the outsourced activities relevant to our audit scope, we reviewed service level agreements and ISAE 3402 Type 2 reports where we have evaluated the scope of these reports, the outcomes and impact on our audit procedures;
– management of access to programs and data, including user access to the network, access to and authorisations within applications, privileged access rights to applications, databases and operating systems;
– management of changes to applications and IT infrastructure, including the change management process and the implementation of changes in the production systems; and
– computer operations, including batch monitoring, back-up and recovery and incident management.
The IT projects related to the implementation of IFRS 9 and the new treasury systems were part of our audit procedures as described in the first and second key audit matters above. The ITGCs as described above were also tested for these.
We focused on the ITGCs to the extent relevant for the purpose of our audit of the financial statements.
Our audit procedures indicate that we could place reliance on these controls for the purpose of our audit.
Independent auditor's report 212
Report on the other information included in the annual reportIn addition to the financial statements and our auditor’s report thereon, the annual report contains other information that consists of:– About Van Lanschot Kempen– Strategy– Business themes– Progress report– Report of the supervisory board– Corporate governance– Executive and Supervisory Boards– Reconciliation of IFRS and management reporting– Other information, including the other information
pursuant to Part 9 of Book 2 of the Dutch Civil Code.
Based on the procedures performed as set out below, we conclude that the other information:– is consistent with the financial statements and does not
contain material misstatements;– contains the information that is required by Part 9 of
Book 2 of the Dutch Civil Code.
We have read the other information. Based on our knowledge and understanding obtained in our audit of the financial statements or otherwise, we have considered whether the other information contains material misstatements.
By performing our procedures, we comply with the requirements of Part 9 of Book 2 of the Dutch Civil Code and the Dutch Standard 720. The scope of such procedures was substantially less than the scope of those performed in our audit of the financial statements.
The executive board is responsible for the preparation of the other information, including the report of the executive board (consisting of Our strategy, Our business themes and Progress report) and the other information in accordance with Part 9 of Book 2 of the Dutch Civil Code.
Report on other legal and regulatory requirements
Our appointmentWe were appointed on 13 May 2015 as auditor of Van Lanschot N.V. by the general meeting following a recommendation by the supervisory board. Our appointment has been renewed annually by shareholders representing a total period of uninterrupted engagement appointment of three years.
No prohibited non-audit servicesTo the best of our knowledge and belief, we have not provided prohibited non-audit services as referred to in article 5(1) of the European Regulation on specific requirements regarding statutory audit of public-interest entities.
Services renderedThe services, in addition to the audit, that we have provided to the Company and its controlled entities, for the period to which our statutory audit relates, are disclosed in note 36 to the financial statements.

Independent auditor's report 213
Responsibilities for the financial statements and the audit Responsibilities of the executive board and the supervi-sory board for the financial statementsThe executive board is responsible for:– the preparation and fair presentation of the financial
statements in accordance with EU-IFRS and with Part 9 of Book 2 of the Dutch Civil Code; and for
– such internal control as the executive board determines is necessary to enable the preparation of the financial statements that are free from material misstatement, whether due to fraud or error.
As part of the preparation of the financial statements, the executive board is responsible for assessing the Company’s ability to continue as a going concern. Based on the financial reporting frameworks mentioned, the executive board should prepare the financial statements using the going-concern basis of accounting unless the executive board either intends to liquidate the Company or to cease operations, or has no realistic alternative but to do so. The executive board should disclose events and circumstances that may cast significant doubt on the Company’s ability to continue as a going concern in the financial statements.
The supervisory board is responsible for overseeing the Company’s financial reporting process.
Our responsibilities for the audit of the financial statementsOur responsibility is to plan and perform an audit engagement in a manner that allows us to obtain sufficient and appropriate audit evidence to provide a basis for our opinion. Our audit opinion aims to provide reasonable assurance about whether the financial statements are free from material misstatement. Reasonable assurance is a high but not absolute level of assurance, which makes it possible that we may not detect all misstatements. Misstatements may arise due to fraud or error. They are considered to be material if, individually or in the aggregate, they could reasonably be expected to influence the economic decisions of users taken on the basis of the financial statements.
Materiality affects the nature, timing and extent of our audit procedures and the evaluation of the effect of identified misstatements on our opinion.
A more detailed description of our responsibilities is set out in the appendix to our report.
Amsterdam, 12 March 2019
PricewaterhouseCoopers Accountants N.V.
Original has been signed byR.E.H.M. van Adrichem RA

Appendix to the auditor’s report on the financial statements 2018 of Van Lanschot Kempen NV 214
APPENDIX TO OUR AUDITOR’S REPORT ON THE FINANCIAL STATEMENTS 2018 OF VAN LANSCHOT N.V.
In addition to what is included in our auditor’s report, we have further set out in this appendix our responsibilities for the audit of the financial statements and explained what an audit involves.
The auditor’s responsibilities for the audit of the financial statementsWe have exercised professional judgement and have maintained professional scepticism throughout the audit in accordance with Dutch Standards on Auditing, ethical requirements and independence requirements. Our objectives are to obtain reasonable assurance about whether the financial statements as a whole are free from material misstatement, whether due to fraud or error. Our audit consisted, among other things, of the following:– Identifying and assessing the risks of material
misstatement of the financial statements, whether due to fraud or error, designing and performing audit procedures responsive to those risks, and obtaining audit evidence that is sufficient and appropriate to provide a basis for our opinion. The risk of not detecting a material misstatement resulting from fraud is higher than for one resulting from error, as fraud may involve collusion, forgery, intentional omissions, misrepresentations, or the intentional override of internal control.
– Obtaining an understanding of internal control relevant to the audit in order to design audit procedures that are appropriate in the circumstances, but not for the purpose of expressing an opinion on the effectiveness of the Company’s internal control.
– Evaluating the appropriateness of accounting policies used and the reasonableness of accounting estimates and related disclosures made by the executive board.
– Concluding on the appropriateness of the executive board’s use of the going-concern basis of accounting, and based on the audit evidence obtained, concluding whether a material uncertainty exists related to events and/or conditions that may cast significant doubt on the Company’s ability to continue as a going concern. If we conclude that a material uncertainty exists, we are required to draw attention in our auditor’s report to the related disclosures in the financial statements or, if such disclosures are inadequate, to modify our opinion. Our conclusions are based on the audit evidence obtained up to the date of our auditor’s report and are made in the context of our opinion on the financial statements as a whole. However, future events or conditions may cause the Company to cease to continue as a going concern.
– Evaluating the overall presentation, structure and content of the financial statements, including the disclosures, and evaluating whether the financial statements represent the underlying transactions and events in a manner that achieves fair presentation.
Considering our ultimate responsibility for the opinion on the consolidated financial statements, we are responsible for the direction, supervision and performance of the group audit. In this context, we have determined the nature and extent of the audit procedures for components of the Group to ensure that we performed enough work to be able to give an opinion on the financial statements as a whole. Determining factors are the geographic structure of the Group, the significance and/or risk profile of group entities or activities, the accounting processes and controls, and the industry in which the Group operates. On this basis, we selected group entities for which an audit or review of financial information or specific balances was considered necessary. We communicated with the supervisory board regarding, among other matters, the planned scope and timing of the audit and significant audit findings, including any significant deficiencies in internal control that we identify during our audit. In this respect, we also issued an additional report to the audit and compliance committee in accordance with article 11 of the EU Regulation on specific requirements regarding statutory audit of public-interest entities. The information included in this additional report is consistent with our audit opinion in this auditor’s report.
We provide the supervisory board with a statement that we have complied with relevant ethical requirements regarding independence, and to communicate with them all relationships and other matters that may reasonably be thought to bear on our independence, and where applicable, related safeguards.
From the matters communicated with the supervisory board, we determine those matters that were of most significance in the audit of the financial statements of the current period and are therefore the key audit matters. We describe these matters in our auditor’s report unless law or regulation precludes public disclosure about the matter or when, in extremely rare circumstances, not communicating the matter is in the public interest.

PROFIT APPROPRIATION
Profit appropriation 215
Articles of Association on profit appropriation Profit is appropriated in accordance with Article 28 of the Articles of Association. This article states that profit is at the disposal of the General Meeting (Article 28 (1)).
Distributions may only be made if equity exceeds the issued and paid-up share capital, plus the reserves required by law (Article 28 (2)).
Profit is distributed after adoption of the financial statements, which should prove that such distribution is justified (Article 23 (3)).
With due observance of Article 28 (2), the General Meeting can decide to distribute from a reserve it is not required to keep under the law (Article 28 (5)).

Advanced internal ratings-based approach (A-IRB)The most sophisticated credit risk measurement technique. Under A-IRB, a bank is allowed to develop its own models, based on direct or indirect observations, to estimate parameters for calculating risk-weighted assets. Credit risk under A-IRB is determined by using internal input for probability of default (PD), loss given default (LGD), exposure at default (EAD) and maturity (M).
Amortised costThe amount for which financial assets or liabilities are initially recognised less redemptions, plus or minus accumulated depreciation/amortisation using the effective interest rate method for the difference between the original amount and the amount at maturity date, less impairments or amounts not received.
Assets under administration (AuA)Assets which are entrusted by clients to Van Lanschot Kempen purely for custody or for which solely administrative services are performed. Clients take their own investment decisions, over which Van Lanschot Kempen has no influence.
Assets under discretionary managementClient assets entrusted to Van Lanschot Kempen under a discretionary management agreement, irrespective of whether these assets are held in investment funds, deposits, structured products (Van Lanschot Kempen index guarantee contracts) or cash.
Assets under management (AuM)Assets deposited with Van Lanschot Kempen by clients, breaking down into assets under discretionary management and assets under non-discretionary management.
Assets under monitoring & guidanceClient assets that are only subject to monitoring, plus minor advisory and related services. Clients make their own investment decisions and Van Lanschot Kempen has little or no influence on the management of these assets.
Assets under non-discretionary managementClient assets held for clients by Van Lanschot Kempen, irrespective of whether these assets are held in investment funds, deposits, structured products (index guarantee contracts) or cash, with either a Van Lanschot Kempen investment adviser advising the client on investment policy or clients making their own investment decisions without Van Lanschot Kempen’s input.
Assets under screening (AuS)The part of the assets under management that are screened for sustainability issues.
Basel IIIThe new framework drawn up by the Basel Committee on Banking Supervision, which introduces a stricter definition of capital and several new ratios and buffers with which banks must comply. The gradual transition from Basel II to Basel III is taking place over a period of five years and started in 2014.
Basel III leverage ratio (LR)The leverage ratio represents the relationship between total assets plus contingent items and the Basel III Tier 1 capital. It is calculated in accordance with the Delegated Act.
Basel IVThe reform of Basel III, commonly referred to as "Basel IV", involves the final calibration and design of capital output floors, based on revised standardised approaches. It also includes reforms of the IRB approach and the standardised approach for credit and operational risk.
Capital conservation bufferUnder CRD IV, Van Lanschot Kempen is required to maintain Common Equity Tier 1 capital equivalent to 2.5 times total risk exposure as a capital conservation buffer. If an institution fails to maintain this capital conservation buffer, it will be restricted in making discretionary distributions.
Carried interest arrangementA carried interest arrangement relates primarily to private equity fund managers who are given the opportunity to obtain a stake in a company acquired. This arrangement is financed by a subordinated loan or by cumulative preference shares that do not participate in any surplus profits. The manager holds ordinary shares and participates in any surplus profits.
Cash flow hedges (hedge accounting)Instruments to hedge the exposure to fluctuations in cash flows of assets, liabilities or future transactions, arising as a result of interest rate changes and/or inflation.
Client option positionsClients are unable to buy or sell share options directly on the stock exchange. Van Lanschot Kempen purchases or sells on behalf of these clients and covers this with offsetting transactions on the stock exchange. Such receivables and payables are recognised under Derivatives.
Combined buffer requirementsFrom 2016, subject to transitional provisions, institutions are required to maintain capital buffers in addition to the own funds requirements contained in the Capital Requirements Regulation (CRR). For Van Lanschot Kempen, the combined buffer requirement consists of the capital conservation buffer extended by the institution-specific countercyclical capital buffer. The G-SII buffer, O-SII buffer and systemic risk buffer are not applicable to Van Lanschot Kempen.
Common Equity Tier 1 (CET1) capitalAlso referred to as core capital. Common Equity Tier 1 CET1 capital encompasses a bank’s share capital, share premium and other reserves, adjusted for deductions as specified by regulators, such as goodwill, deferred tax assets and IRB shortfall.
Common Equity Tier 1 (CET1) ratioCommon Equity Tier 1 capital as a percentage of total risk-weighted assets.
GLOSSARY
Glossary 216

Contingent liabilitiesAll commitments arising from transactions for which the bank has given a guarantee to third parties.
Countercyclical capital bufferCET1 capital equivalent to the total risk exposure amount (calculated in accordance with the CRR) multiplied by the weighted average of the countercyclical buffer rates. The countercyclical buffer rates are set by the designated authority in each member state on a quarterly basis. The buffer is determined by calculating the weighted average of the countercyclical buffer rates that apply in the jurisdictions of the relevant credit exposures.
Credit-linked swapsSwaps where variable interest payments linked to Euribor, possibly with a lower or upper limit, are exchanged for credit guarantees in respect of a third party. The counterparty is obliged to pay out if the third party is no longer able to meet its payment obligations. The contract will identify specific payment-triggering events.
Credit riskThe risk that loans are not repaid, not fully repaid or not repaid on time.
Credit support annex (CSA)Forming part of an international swaps and derivatives agreement (ISDA), a CSA regulates credit support (collateral) for obligations resulting from derivatives.
Credit valuation adjustment (CVA)An adjustment made on the valuation of derivatives transactions with a counterparty, reflecting the current market value of counterparty credit risk.
Currency optionsCurrency options grant their buyer the right, but not the obligation, to buy or sell a quantity of a certain currency at a pre-determined exchange rate during or at the end of a pre-determined period. The currency option constitutes an obligation for the seller. Van Lanschot Kempen’s currency options mainly relate to client transactions covered by offsetting transactions in the markets.
De Nederlandsche Bank (DNB)The Dutch central bank. dnb.nl/en
Defined benefit schemeA pension scheme other than a defined contribution scheme (see below). In a defined benefit scheme, the company has the constructive obligation to make up any deficit in the scheme. This does not have to be based on any legal requirements, but may be simply on the basis of an historical intention on the part of the company to make up any deficits.
Defined contribution schemeA scheme in which the company makes agreed contributions to a separate entity (a pension fund) to secure pension rights. The company is not obliged, either legally or effectively, to pay additional contributions if the pension fund does not have enough assets to cover all of its current and future obligations.
Depositary receipts for shares (DRS)Depositary receipts for shares have no voting rights, but do entitle their holders to profits.
DerivativesFinancial assets whose value derives from the value of other financial assets, indices or other variables. Van Lanschot Kempen holds both derivatives whose size (face value), conditions and prices are determined between Van Lanschot Kempen and its counterparties (OTC derivatives), and standardised derivatives traded on established markets.
Discounted cash flow (DCF)A method to value an investment by estimating future cash flows, taking account of the time value of money.
Duration of equityA measure of the interest rate sensitivity of equity that reflects the impact on equity of a 1% parallel shift in the interest curve.
Dutch Authority for the Financial Markets (AFM)The Dutch regulator for financial institutions in the Netherlands. afm.nl/en
Economic hedgesDerivatives used to manage risks without applying hedge accounting, carried at fair value. At Van Lanschot Kempen, these primarily take the shape of interest rate derivatives.
Effective interest rateThe rate that discounts estimated cash flows to the net carrying amount of the financial asset over the life of an instrument, or, where appropriate, over a shorter period.
Efficiency ratioOperating expenses excluding impairments and result from the sale of public and private sector loans and advances, as a percentage of income from operating activities.
EngagementA sustainability strategy that seeks to persuade companies, fund managers, borrowers and other stakeholders through active dialogue that their sustainability policies should be made compatible with international treaties and conventions.
Expected loss (EL)Expected loss on loans, expressed in the formula EL=PD*EAD*LGD.
Exposure at default (EAD) BaselExposure at the time of a client’s default, also referred to as net exposure.
Exposure at default (EAD) IFRS 9The exposure at default is an estimate of the exposure at a future default date, taking into account expected changes in the exposure after the reporting date, including repayments of principal and interest, whether scheduled by contract or otherwise, expected drawdowns on committed facilities, and accrued interest from missed payments.
Fair value hedges (hedge accounting)A portfolio of fair value hedges comprises one or more swaps concluded to cover the changes in fair value resulting from changes in interest rates, of debt securities and available-for-sale investments, for example. Hedge relations are typically exact hedges, involving debt securities and available-for-sale investments with fixed rates and terms being offset by swaps with exactly the same terms and fixed interest rates.
Glossary 217

Fiduciary managementHolding assets as a trustee or in another fiduciary role for individuals, trusts, pension providers and other institutions. These assets are not included in the consolidated financial statements because they are not Van Lanschot Kempen’s assets.
FitchCredit rating agency. fitchratings.com
ForbearanceMaking a concession regarding the terms and conditions of a loan agreement due to actual or anticipated financial difficulties which prevent a client from meeting its obligations vis-à-vis Van Lanschot Kempen. The concession enables the client to meet the revised obligations. This may also include the whole or partial refinancing of the existing loan.
Forum EthibelA Belgian consultancy in the field of corporate social responsibility (CSR) and socially responsible investment (SRI). forumethibel.org
ForwardsContractual obligations to purchase or sell goods or financial assets at a future date at a pre-determined price. Forward contracts are customised contracts traded on the OTC markets.
Foundation internal ratings-based approach (F-IRB)An advanced credit risk measurement technique. Under F-IRB, a bank is allowed to develop its own models, based on direct or indirect observations, to estimate parameters for calculating risk-weighted assets. Credit risk under F-IRB is determined by using internal input for probability of default (PD). In contrast to A-IRB, the loss given default (LGD) is included, based on prescribed values.
Funding ratioThe ratio between public and private sector liabilities and total loans and advances (excluding bank borrowing and lending). FuturesContractual obligations to purchase or sell goods or financial assets at a future date at a pre-agreed price. Futures are standardised contracts traded on organised markets, with stock exchanges acting as intermediaries and requiring daily settlement in cash and/or deposits of collateral. Van Lanschot Kempen has a number of futures on share indices on its books, partly for own use and partly for clients, for offsetting transactions in the markets.
General meetingThe body formed by voting shareholders and others with voting rights.
Global Reporting Initiative (GRI)An independent organisation which develops guidelines for sustainability reports. Van Lanschot Kempen’s integrated annual report is based on GRI. globalreporting.org
Gross exposure The value at which receivables are recognised in the consolidated statement of financial position, with the exception of derivatives. Gross exposure is calculated on the basis of an add-on percentage of the nominal value (fixed percentages in accordance with the Financial Supervision Act) and the positive replacement value.
HedgeProtection of a financial position – against interest rate risks in particular – by means of a financial instrument (typically a derivative).
IFRIC (International Financial Reporting Interpretations Committee) The interpretative body of the International Accounting Standards Board (IASB). IFRIC interprets the application of International Financial Reporting Standards (IFRS) to ensure consistent accounting practices throughout the world and provide guidance on reporting issues not specifically addressed in IFRS.
ImpairmentAmount charged to the result for possible losses on non-performing or irrecoverable loans and advances. Alternatively, an impairment test may suggest lower asset values, if fair values have dipped below carrying amounts and/or the fair value of investments and associates have moved below cost.
Institutional Investors Group on Climate Change (IIGCC)A European collaborative platform for institutional investors in relation to climate change.
Interest rate optionAn agreement between a buyer and a seller, under which the seller guarantees the buyer a maximum interest rate (cap) or minimum interest rate (floor) for a fixed term.
Interest rate riskThe risk that profit and equity are impacted by changes in interest rates, in particular in the event of an intentional or unintentional mismatch in the terms of funds lent and borrowed.
Interest rate swapsA contract in which two parties exchange interest payments for a pre-agreed period and a notional principal amount, while not swapping the face value. An interest rate swap typically involves exchanging fixed-rate cash flows for floating-rate cash flows in the same currency, with the floating rate based on a benchmark interest rate (usually Euribor).
Internal capital adequacy assessment process (ICAAP) Strategies and procedures designed for the bank’s continuous assessment as to whether the amount, composition and distribution of its equity still reconcile with the size and nature of its current and potential future risks.
Internal ratings-based approach (IRB)An advanced approach used to calculate credit risk. Van Lanschot Kempen applies both the foundation internal ratings-based (F-IRB) and advanced internal ratings-based (A-IRB) approaches. In this report, IRB refers to both internal ratings-based models approaches.
Glossary 218

International Financial Reporting Standards (IFRS)Accounting and reporting standards drawn up by the International Accounting Standards Board. These standards have been adopted by the European Union and have been applied by us from the 2005 financial year.
Irrevocable commitmentsAll obligations resulting from irrevocable commitments that could result in loans being granted.
KCMKempen Capital Management NV
KempenKempen & Co NV
Level 1: Quoted prices in active marketsThe fair value of financial instruments traded in an active market is based on the price at the reporting date (market price). The bid price is applied for financial assets and the offer price for financial liabilities. Since these instruments are traded in an active market, their prices adequately reflect current and frequent market transactions between unrelated parties.
Level 2: Inputs observable in the marketsThe fair value of financial instruments not traded in active markets (e.g. over-the-counter financial derivatives) is established using cash flow and option valuation models. On the basis of its estimates, Van Lanschot Kempen selects a number of methods and makes assumptions based on the market conditions (observable data) at the reporting date.
Level 3: Significance of unobservable market dataThe financial assets in this category have been assessed on an individual basis. Their valuation is based on management’s best estimate by reference to the most recent prices, prices of similar instruments and, to a not insignificant extent, information not observable in the market.
Liquidity coverage ratio (LCR)The LCR represents the ratio between high-quality liquid assets and the balance of cash outflows and cash inflows in the next 30 days.
Liquidity riskThe risk that the bank has insufficient liquid assets available to meet current liabilities in the short term.
Loss given default (LGD) BaselAn estimate of the loss for Van Lanschot Kempen after liquidation of the received collateral.
Loss given default (LGD) IFRS 9The loss given default is an estimate of the loss arising in the event of a default occurring at a given time. It is based on the difference between the contractual cash flows due and those that the lender would expect to receive, including from the realisation of any collateral. It is typically expressed as a percentage of EAD.
Market riskThe risk that the value of a financial position changes due to movements in stock exchange prices, foreign exchange and/or interest rates.
MSCIA global equity index by Morgan Stanley Capital International, typically used as a standard benchmark.
MSCI ESG ResearchA data provider specialising in non-financial investment information. Van Lanschot Kempen has used the services of MSCI ESG Research for its sustainable investment process since 2015. msci.com/research/esg-research
Net stable funding ratio (NSFR)The relationship between available stable funding and the required amount of stable funding.
Non-performing loansLoans are classed as non-performing if they meet one or more of the following criteria: 1) significant limit overrun for a period of more than 90 days; 2) a probability of default of 1; 3) a provision has been taken; 4) forborne exposures for which the two-year probation period has not started.
Operational riskThe risk of direct or indirect losses as a result of inadequate or defective internal processes and systems, inadequate or defective human acts, or external events.
Net Promoter Score (NPS)The NPS provides information on client loyalty and the number of promoters of the organisation. The score lies within a range of -100 to 100 points, the higher the better. The formula is as follows: NPS = % promoters - % detractors. Promoters give the organisation a score of 9 or 10, whereas detractors award a score of between 0 and 6.
Non-controlling interestsNon-controlling interests in entities that are fully consolidated by Van Lanschot Kempen.
Probability of default (PD) BaselThe likelihood that a client will default within one year.
Probability of default (PD) IFRS 9 The probability of default is an estimate of the likelihood of default over a given time horizon. A default may only happen at a certain time during the assessed period if the facility has not been previously derecognised and is still in the portfolio.
Proxy votingKempen regards it as its fiduciary responsibility to vote at shareholder meetings for its own (Kempen) funds and – at the request of clients – for discretionary mandates. Its proxy voting policy describes how it fulfils this responsibility. kempen.nl/proxyvoting
Residential mortgage-backed securities (RMBS)Securities backed by residential mortgages. A provider of residential mortgages (typically a bank) will sell these on to a separate entity, a special purpose vehicle (SPV). To finance the mortgages, the SPV will then issue securities called RMBS, which are secured by the mortgages.
Glossary 219

Risk-weighted assets (RWA)The assets of a financial institution after being adjusted by a weighting factor, set by its regulators, that reflects the relative risk attached to the relevant assets. Risk-weighted assets are used to calculate the minimum amount of capital the institution needs to hold. CRR/CRD IV uses the term “total risk exposure amount” instead of RWA, but for now we follow common usage.
Settlement riskThe risk for financial transactions that are not settled within five days of the agreed deadline if the difference between the agreed settlement price and the price at the reporting date could lead to a loss.
ShortfallThe difference between the calculated expected loss (EL) and the provision made for a loan for which the capital adequacy requirement is calculated using the IRB method. If the calculated EL exceeds the provision made, the difference must be deducted from Common Equity Tier 1 capital.
SolvencyThe bank’s buffer capital expressed as a percentage of risk-weighted assets.
Standard & Poor’sCredit rating agency. spratings.com
Standardised approach (SA)A method used under Basel to measure operational, market and credit risks, based on a standardised approach, in which risk weightings are prescribed by the regulators.
Strategic riskCurrent or future threats to the bank’s results or equity resulting from not or inadequately responding to changes in the environment and/or from taking incorrect strategic decisions. This is a part of the business risk.
Structured productsSynthetic investment instruments specially created to meet specific needs that cannot be met by the standardised financial assets available in the markets.
Sustainable Development Goals (SDGs)In 2015, the United Nations set out the Sustainable Development Goals (SDGs) for 2030: a set of 17 highly ambitious goals relating to climate, poverty, healthcare, education and other challenges.
Tier 1 capital ratioThe ratio between total Tier 1 capital and risk-weighted assets.
Total capital ratioThe percentage of a bank’s capital adequacy, calculated by dividing qualifying capital by the risk-weighted assets as defined by the Bank for International Settlements (BIS).
Total Tier 1 capitalTotal Tier 1 capital of the bank includes share capital, share premium and other reserves, adjusted for certain deductions set by the regulator, such as goodwill and shortfall.
Total Tier 2 capitalCapital instruments and subordinated loans may be designated Tier 2 capital under certain conditions.
Value at risk (VaR)Statistical analysis of historical market trends and volatilities, used to estimate the likelihood that a portfolio’s losses will exceed a certain amount.
Van Lanschot KempenVan Lanschot N.V. and its subsidiaries
Van Lanschot Kempen NVVan Lanschot Kempen NV
Weighted average cost of capital (WACC)A measure of the average cost of a company’s capital, in which debt and equity are proportionally weighted.
Wft (Financial Supervision Act)Wft governs the supervision of the financial sector in the Netherlands.
Wholesale fundingA type of funding, in addition to savings and deposits, used by banks to fund operations and manage risks.
Glossary 220

Text and editingVan Lanschot Kempen NVVicky Hampton Copy & Content
DesignCapital Advertising
DtpJARGO design
PhotographyCover: Bert Teunissen
English translation and editingAnita Graafland, Tom Scott
HeadquartersVan Lanschot NVHooge Steenweg 295211 JN ’s-HertogenboschTelephone +31 (0)20 354 45 [email protected]/en’s-Hertogenbosch Trade Register no. 16038212
We welcome your views and opinions – please see ourcontact details above.
This annual report was published on 14 March 2019.


![Integrated Turfgrass Management [Compatibiliteitsmodus] · Van Lanschot Bankiers - Deloitte NGF AGRONOMIE Workshops Workshops ––––november 2015: 1november 2015: 1 eeee ronderonde](https://static.fdocuments.us/doc/165x107/5f6b7e61a5542e37ce6d8f95/integrated-turfgrass-management-compatibiliteitsmodus-van-lanschot-bankiers-.jpg)


