VALVE -Et MKEIMINTG FOR PROVEYENT OF CAPrAL PRO,,n-S
106
VALVE -Et MKEIMINTG FOR El V PROVEYENT OF CAPrAL PRO,,n - S Prepared by GERH MOUS JOH•NNES VAN ZYL Supervisor PROF. L PRETORDUS A dissertation submitted in partial fulfillment of the requirements for the degree of MAGISTER PH1LOSPHIAE ON ENGINEERONG MANAGEMENT FACULTY OF ENGINEERING RAND AFRIKAANS UNIVERSITY May 1999
Transcript of VALVE -Et MKEIMINTG FOR PROVEYENT OF CAPrAL PRO,,n-S

VALVE -Et MKEIMINTG FOR El V PROVEYENT OF CAPrAL PRO,,n -S
Prepared by
GERH MOUS JOH•NNES VAN ZYL
Supervisor
PROF. L PRETORDUS
A dissertation submitted in partial fulfillment of the requirements for the degree of
MAGISTER PH1LOSPHIAE ON ENGINEERONG MANAGEMENT
FACULTY OF ENGINEERING
RAND AFRIKAANS UNIVERSITY
May 1999

VA LUE ENGINEERING
Management Summary
To achieve growth, most corporations invest a large portion of their turnover in
new business ventures or in expanding current operations. These initiatives
imply capital and thus a return is essential in order to ensure survival.
Research indicates that capital projects seldom realize their full potential. The
value that is released by a project is often unacceptably lower than the value that
was initially forecast and for which the board granted approval. Furthermore, a
number of projects achieved radical improvement within a relatively short
period of time, when they embarked on an initiative focusing on improving the
project. This indicates that, due to the relatively low cost and the rather large
prize at stake, it is imperative to investigate and actively seek improvement
potential.
Value Engineering proves to be a methodology capable of unleashing these
otherwise hidden opportunities. Three basic steps describe the value engineering
process:
analysis to understand the project;
design to find the optimum or a better solution; and
the implementation thereof.
Before a team can embark on an improvement initiative an initiation study will
determine the target, required focus of the exercise and set up an enabled team.
This study also describes the integration of value engineering with the existing
processes using a case study. In order for value engineering to work, skilled
members are required, the initiative has to be timed and complement the existing
processes.

VALUE ENGINEERING
Bestuursopso II ming
Die meeste maatskappye investeer groot gedeeltes van hul omset ten einde groei
te bewerkstellig. Maatskappye se oorlewing is afhanklik van goeie opbrengste
op hierdie beleggings as gevolg van die relatief groot investerings.
Navorsing het getoon dat die voile potensiaal van die moontlike waarde wat deur
hierdie beleggings ontsluit kan word, dikwels nie realiseer nie. Na-
implementeringstudies toon dat die uiteindelike waarde wat deur 'n projek
realiseer word dikwels teleurstellend is in vergelyking met dit wat voorspel is en
wat deur die mad goedgekeur is. Verder het 'n aantal gevallestudies getoon dat
projekte radikale verbetering bewerkstellig het deur 'n gefokusde oefening voor
inbedryfstelling te loods.
Waarde-ingenieurwese word deur hierdie verhandeling voorgestel as 'n
moontlike tegniek om hierdie verbeteringsgeleenthede te ontsluit. Drie basiese
stappe beskryf die proses:
analises ten einde die besigheid en sy dinamika te verstaan;
ontwerp ten einde 'n beter oplossing te vind; en
die implementering van hierdie verbeterings.
Voordat 'n span kan afskop met 'n verbeteringsoefening moet 'n inisiasie-studie
geloods word om die geskikte verbeteringsdoelwit en fokus van die studie te
bepaal. Verder word spanne saamgestel, opgelei en belyn in hierdie fase.
Die integrasie van waarde-ingenieurswese met bestaande prosesse en
organisasies word ook bespreek aan die hand van 'n gevallestudie. Die
tydsberekening en vestiging van kundigheid word bespreek.

VALUE ENGINEE ING
Acknowledgements
I would like to thank the following:
My Creator for making everything possible;
my wife Madelein for her support;
my father Johannes for teaching me the basics of businesses;
Prof. Leon Pretoruis for his guidance;
Dr. Mellet Moll for his encouragement and mentorship;
Ernst Venter for his trust and sponsorship;
Danie Mouton, Petrus de Jager, Marita Welgemoed for their stimulation and inputs;
Bain Barnard for his assistance in finalising the manuscript;
Matie Von Wielligh, Vlam Oosthuizen and their teams for trusting us to interfere in their
projects; and
lastly an idiosyncratic thanks to Microsoft for shift-F7 and F7.
- iv -

VALUE ENGINEERING
TABLE OF CONTENTS
1 PART ONE - INTRODUCTION
1.1 OBJECTIVE 1
1.2 RESEARCH APPROACH 2
1.3 THE DILEMMAS OF CAPITAL PROJECTS 4
1.3.1 Under performance of projects 5
1.3.2 Indications of hidden value 6
1.3.3 Why project teams tend not to create maximum value 10 1.4 CLOSURE 14
2 PART TWO — FUNDAMENTALS 16
2.1 OBJECTIVE 16 2.2 CAPITAL PROJECTS 17
2.2.1 Systems engineering 18
2.2.2 Feasibility study 21 2.3 VALUE ENGINEERING 27
2.3.1 Definition of value 27
2.3.2 Definition of value improvement 29
2.3.3 Definition of value engineering 32
2.3.4 Value engineering fundamentals 34 2.4 CONCLUSION 40
3 PART THREE — MASTER PLAN 41
3.1 OBJECTIVE 41
3.2 BASIC PRINCIPLES 42
3.2.1 Scope of the initiation phase 43
3.2.2 Net potential benefit 44
3.2.3 Value creation target 45 3.3 INITIATION PROCESS 48
3.3.1 Business case review 49
3.3.2 Case for change 54
3.3.3 Target setting 60
3.3.4 Plan to capture value 62 3.4 CONCLUSION 65
4 PART FOUR — INTEGRATION 66
4.1 OBJECTIVE 66 4.2 INTEGRATION 67
4.2.1 Do it right the first time 68 4.3 TIMING OF THE INTERVENTION 68
4.3.1 Team's ability to improve 69
4.3.2 Willingness to change 69
4.3.3 Total cost of intervention 70
4.3.4 Logical intervention points 72 4.4 INTEGRATION WITH PROJECT MANAGEMENT 74
4.4.1 Integration of the intervention 74
4.4.2 Integration of 'do it right the first time' 75 4.5 ORGANISING FOR VALUE ENGINEERING 75
4.5.1 Training of value engineers 76 4.6 CONCLUSION 79
- v -

VALUE ENGINEERING
5 PART FIVE — CLOSURE 80
5.1 OBJECTIVE 80 5.2 OVERVIEW 81 5.3 CONTRIBUTION 81 5.4 FUTURE RESEARCH 82
6 REFERENCES 84
LIST OF FIGURES AND TABLES PART ONE
Figure 1-1: Organization of the research 2 Figure 1-2: Styles of thinking [10] 3 Figure 1-3: Illustration of project team's focus vs. performance 6 Figure 1-4: Iscor Heavy Minerals improvement 7 Figure 1-5: Kamoto improvement 8 Figure 1-6: McKinsey case studies 9 Figure 1-7: Degrees of freedom 11 Figure 1-8: Build on an unrefined case 11 Figure 1-9: Lack of integration 12 Figure 1-10: Distinguish between functionality and cost. 13 Figure 1-11: Multiple outcomes 14 Figure 1-12: Value and measurement not aligned 14
Table 1-1: Performance of capital projects [9] 5 Table 1-2: Items indicating hidden opportunity. [31] 9
LIST OF FIGURES AND TABLES PART TWO
Figure 2-1: Part two, Fundamentals 16 Figure 2-2: Process to establish capital projects [29] 19 Figure 2-3: Iterations of feasibility study 20 Figure 2-4: Future cash flows of the business [13] 24 Figure 2-5: Definition of value 28 Figure 2-6: Value as a distribution of possible outcomes 29 Figure 2-7: Focuses for value improvement 30 Figure 2-8: Improve the outcome 31 Figure 2-9: Value engineering and capital projects 33 Figure 2-10: Value engineering fundamentals 34 Figure 2-11: Operational value drivers 37 Figure 2-12: Value engineering master plan 39
Table 2-1: Accuracy and cost of study 20 Table 2-2: Guideline for bankable document 22
- vi -

VALUE ENGINEERING
LIST OF FIGURES AND TABLES PART THREE
Figure 3-1: Part three, Master plan 41
Figure 3-2: Decision point 43
Figure 3-3: Initiation phase scope 44
Figure 3-4: Potential benefit vs. cost to capture benefit 45
Figure 3-5: Price cost squeeze 46
Figure 3-6: Cost curve change over time 46
Figure 3-7: Staircase to insanely great 47
Figure 3-8: Inputs, activities and outputs 48
Figure 3-9: Initiation process 49 Figure 3-10: Process to establish capital projects [29] 50
Figure 3-11: Review project initiation 51 Figure 3-12: Review economic evaluation 51
Figure 3-13: Review business engineering 52
Figure 3-14: Review process engineering 53
Figure 3-15: Review detail engineering 53
Figure 3-16: Review planning 54
Figure 3-17: Initiation process 55
Figure 3-18: Cost of intervention drivers 60
Figure 3-19: Target setting 61
Figure 3-20: Initiation process 62 Figure 3-21: Intervention organisation 63 Figure 3-22: Value engineering master plan 64
LIST OF FIGURES AND TABLES PART FOUR
Figure 4-1: Part Four, Integration 66 Figure 4-2: Project team capability 70 Figure 4-3: Cost of intervention drivers 71 Figure 4-4: Cost of intervention 71 Figure 4-5: Process maturity levels [26] 73 Figure 4-6: Logical points for a value engineering intervention 73 Figure 4-7: Project Management steps. 74 Figure 4-8: Value Engineering initiation study organisation 75 Figure 4-9: Value Engineering Intervention organisation 76 Figure 4-10: Project team adjusted for value engineering 76 Figure 4-11: Skill transfer to project teams 77 Figure 4-12: Certification system 78
Table 4-1: Training program 78
LIST OF FIGURES AND TABLES PART FIVE
Figure 5- 1: Part Five, Closure 80
Figure 5-2: Value drivers 83 Figure 5-3: Methodologies and business drivers 83
- vii -

VALUE ENGINEERING
UST OF ACRONYMS
Capex Capital expenditure
BFS Bankable Feasibility Study
FAST Function Analysis System Technique
IHM Iscor Heavy Minerals
IRR Internal Rate of Return
MIRR Modified Internal Rate of Return
NPV Net Present Value
Opex Operating expenditure
PI Profitability Index
PMBOK Project Management Body of Knowledge PPI Producer Price Index SAMI Systematic Analysis Methods and Innovations SAVE Society of American Value Engineers VE Value Engineering
WACC Weighted Average Cost of Capital
WBS Work Breakdown Structure

I Part One - llntroducUon
"Fools you are to say you learn by experience. I prefer to profit by others'
mistakes and avoid the price of my own."
Otto van Bismark-Sch6nhausen
1.1 Objective
The "objective of this dissertation is to introduce the reader to the application of
value engineering principles on capital projects.
This dissertation indicates that problems exist with the creation of businesses by
means of capital projects and that value engineering or any other method capable
of successfully improving capital projects is required. It is therefor indicated that
capital projects cannot afford not to investigate or consider an improvement
initiative.
The theory or fundamentals to rectify the problems are discussed. The reader is
introduced to a typical process used to improve the value of a capital project by
means of value engineering. Since a methodology is of no value until it is
actually used, the establishment of value engineering within a corporation, using
Iscor Mining as a case study, is discussed.
The intention with this dissertation is not to replace current project management
processes or to be a complete methodology on how to manage and create capital
projects. It merely identifies an issue and proposes a process as an addition to
current processes rectifying this lack-of-value' issue.
- 1 -

Why ? What ? How ?
When/ Who ? Final remarks
required byqtrowitur
FUNDAMENTALS what is value ?
what is improvement ? what is aloe engineering?
MASTER PLAN Understating the business Case for change
Target Analysis. design, implementation
Part Fcur-
INTEGRATION integrating value engineering with the Incur process ito tinting organisation & respon.vibilities
PART ONE - INTRODUCTION
The organisation of this research is illustrated in Figure 1-1.
Part one illustrates the dilemmas of capital projects and proposes value
engineering as a possible solution;
part two describes value engineering, discussing the fundamentals;
part three describes the Value engineering process that is followed;
part four discusses the integration of value engineering within an organisation
using Iscor Mining as a case study; and
part five contains final remarks.
Figure 1-1: Organization of the research
1.2 Research approach
Different sources of knowledge range from untested opinion (opposite can be
possible) to highly systematic and proven styles of thinking (true in all cases).
Leibniz describes that knowledge can be based on two kinds of truths. Truth can
be based on reason or it can be based on facts [4 1].
- 2 -

Based on sufficient reasoning
Based on the principle of contradiction
Rationalism based on reason
Idealism Faith/ opinion
Based on case study
Empiricism Fact/ truth
Statistical analysis
Existentialism based on axioms
PART ONE - INTRO UCTION
Cooper classifies the styles of thinking using the two axes to describe the above
mentioned dimensions of research (see Figure 1-2), on what it is based and how
true it is [10].
The horizontal axis ranges from a highly idealistic interpretation on the one end
to empiricism on the other. The vertical axis ranges from rationalism on the one
end to existentialism on the other.
Figure 1-2: Styles of thinking [10]
The need for this research manifests itself in the successes of two re-engineering
projects [17,18]. The possibility of improvement opportunities and the need to
define a repeatable process, able to capture these hidden opportunities, became
evident. The need is therefor based on case studies, the bottom left group of
thinking styles (Figure 1-2).
This research was done by integrating the following three sources:
o Experience gained in re-engineering two Iscor projects (Iscor Heavy Minerals
and Kamoto);
o a methodology developed and used by a consulting group (McKinsey &
Company, Inc); and lastly
- 3 -

PART ONE - INTRODUCTION
relevant literature was drawn on to understand and complete this
methodology.
The integration of the three above-mentioned sources implies that the top left
(Figure 1-2) style of thinking was used. For this group it can be said that the
research is valid because it works and it will be regarded as truth until proven
otherwise [39].
1.3 The dilemmas of capital projects
It is often found that 'good' projects or business ventures do not result in good
businesses. Research has shown that in more than 50% of projects that were
completed within budget, time and specification, the end result was an under
performing business. It almost seems as if the ultimate purpose of the venture
was lost somewhere along the line [8].
Examples of this phenomenon are available both within Iscor and outside. In
Iscor the net value of two large projects was dramatically increased by redesigns
with a strong focus on improving value for the shareholders. Impressive results
were obtained: the projects' net value was increased by 60%` in one case and by
more than 100% in the other [17,18]. Outside of Iscor, five case studies (in
different industries) done by a consulting firm McKinsey & Company, Inc
indicated improvements of between 35% and 80% on the value of the projects
that were considered ready for implementation when it was decided to rethink
the whole project [7].
This illustrates that:
Although emphasis is placed on projects and the management thereof,
`good' projects do not necessarily result in good businesses; and
there is a possibility that projects are generally implemented with
uncaptured improvement opportunities.
- 4 -

PA T ONE - INTm ODUCTION
The possible reasons behind these dilemmas are discussed in this dissertation.
1.3.1 Under performance of projects
A large number of capital projects do not realise their promised potential. Table
1-1 shows that relatively few projects (18%) were not completed within budget
and 55% were implemented late. In a business sense 73% of the resulting
businesses under perform in production and in 86% of the cases the ventures'
market assumptions failed to realise.
Table 1-1: Performance of capital projects [9]
4- c.)„ ,P3ieFfig140-itik PROJECT EXECUTION Project cost 18% 18% 64% Completion time 55% 36% 9%
BUSINESS OPERATION Production & operating performance 73% 9% 18% Market projections 86% 14% 0%
This could indicate (as illustrated in Figure 1-3) that the areas of focus of the r
teams are generally in the wrong order and that cost, time, operations and then
market is the sequence of priority for the teams. The relatively low number of
under performance on cost could for example indicate that the team focuses on
cost and the high number of under performances on market projections indicate
that the teams are not focussing on this driver.
Although this could be in line with the value drivers of the business venture, the
energy and focus was still not on value or on creating an excellent business.
- 5 -

Number of under performances / area O
O O
Indication of project team's focus/ area
O
O O
Cost
Time Production
Market
Rel
ativ
e fo
cus o
f tea
m
aoue
uuop
ad lo
pun
jo i
z
ART ONE - INTRODUCTION
Figure 1-3: Illustration ofproject team's focus vs. performance
1.3.2 'Indications of hidden value
The aim of this paragraph is to indicate that, as a general rule, room for
improvement does exist. Success stories within Iscor and the experience of
McKinsey indicate improvements of not less than 35% [8,17,18].
Value engineering professionals have generated a list of items that indicate when
a project contains hidden value. A discussion of this list on the basis of some
large projects is presented.
A Iscor Heavy Minerals
Iscor Heavy Minerals is a R1,8 billion capital project comprising the mining of
Iscor's heavy mineral deposits and the beneficiation of these valuable minerals.
On completion this business will be capable of producing annually [17]:
250 000 ton Titania Slag;
145 000 ton Pig Iron;
45 000 ton Zircon;
20 000 ton Rutile; and
5 000 ton Leucoxene.
Ilmenite is a composite of titanium and iron and will be smelted to produce a
high-grade titania slag and high purity iron. Titania slag is used to produce a
- 6 -

Iscor Heavy Minerals
Base case Improvement Gap Target
90 499 158
251
c 600 0 400
200 c4
0
o Iscor Heavy Minerals improved their project NPV with R 158 m
PART ONE - INTRO UCTION
white pigment for the paint, plastic and paper industries and the pig iron is
preferentially used in the high quality metal casting industry. Rutile and
leucoxene are used to produce welding rods and pigment. Zircon is used mainly
in the ceramics and refractory industries [17].
The net present value of this project was calculated to be R 251 million, before a
project team commenced an improvement initiative. The project value was
improved to R409 million over a period of less than 12 months.
Figure 1-4: Iscor Heavy Minerals improvement
B Kamoto
Kamoto, the property of Gecamines, is a copper and cobalt mine in the southern
part of the Democratic Republic of Congo. After a cave-in in the early 1990's,
the mine is currently barely operating. Iscor did a feasibility study on the
prospect of rehabilitating the Kamoto mine and mining it in partnership with
Gecamines. A total of approximately US $100 million may be invested to
increase the current unsustainable production of 0.3 million ton per annum to a
sustainable 2 million ton per annum. [18].
The value for Iscor of this joint venture was calculated to be approximately
R36 million net present value with a high risk rating. A project team improved
this project over a period of less than six months to a net present value of
- 7 -

Kamoto
400
300
1 200 5 c4 100
0 Base case Improvement Gap Target
Kamoto is on the road to improve their project NPV with R324 m while lowering the risk and capital exposure
PA - T ONE - INTRODUCTION
R266 million. The risk rating and the peak funding requirements were also
improved during this exercise.
Figure 1-5: Kamoto improvement
McKinsey & Company, Inc experience
Five case studies done by McKinsey in different industries indicate radical
improvements of between 35 and 80% on projects "ready" for implementation.
The capital savings are in the order of 20 to 45 % and the contribution made by
revenue improvement and reduction of operating cost was between 20 and 35%
[7].
Figure 1-6 illustrates results of these case studies, the first column is the industry
the project operated within, followed by the initial capital that was required and
lastly the improvement that realised after a reengineering exercise.
- 8 -

30%, 20% 1 50 % chemicals (xl)
telecommunications (xl)
mining (x2)
building materials (xl)
35 %
(canx • opex = %NPV)
I S 600 m
S 300 m 15% , 20%
Industry Capital Improvement realized
80 % 45% , 35%
50% 30% 20%
S 1 500 m
S 1 400 m
PART ONE - INT ODUCTION
Figure 1-6: McKinsey case studies
Hidden value indicators
Table 1-2 shows a list, published by SAMI, which serves as an indicator of
where hidden improvement opportunities are likely to exist [31]. If these are
present in the project a value engineering exercise is likely to be a successful and
worthwhile exercise. This unedited list will indicate to the reader that there are
actually very few projects which will not benefit from a value engineering
exercise. The initiation phase of the Value Engineering exercise will discuss
techniques to estimate and assess the value enhancement potential in more
detail.
Table 1-2: Items indicating hidden opportunity [31]
1 Involves large expenditures or resources (staff or equipment).
2 Costs exceed budgeted amount.
3 Great complexity is noted in plans. (Often the more complex the plan, the more opportunity to improve value and performance.)
4 Potentially involves major resource impacts (staff or equipment).
5 Activity cycle is highly compressed.
6 Involves critical, exotic, hard-to-get or expensive resources (materials or staff) and / or requires sole-sourcing to obtain them.
7 Activity uses non-standard components such as specialized software, fasteners, unique sizes, computer equipment or other resources
8 Plans include use of specialized components that have comparable counterparts available off-the-shelf
9 Activities involve advancement in the state-of-the-art.
10 Involves status enhancement, new records (e.g., largest database, first time used), embellishment, special interest requirements, high viability, extensive political objectives,
- 9 -

PART ONE - INT 0 ,10) UCTION
or strong controversy
11 Highly skilled labor or time-consuming tasks are involved.
12 Items with poor service or cost history, or having high maintenance and staff operations, are proposed or used.
13 Plans have been in use or "on-the-shelf' for more than five years. (These activities, especially if they receive little or no changes in that period, are prone to losing touch with the present situation and overall mission objectives.)
14 Solutions are included in activity to solve problems or improve conditions unrelated to immediate cost. Examples are: reliability, aesthetics, noise, safety, risk protection, simplification, maintainability, standardization, time, quality, resource use (e. g., energy, limited staff or equipment), environmental factors, performance, or past history avoidance
15 Components or functions are identified in a Value Methodology FAST diagram as being a potential value mismatch.
16 Similar components or functions are being commonly submitted and accepted as Value Engineering Change Proposals.
17 Activity has repetitious components. Repetitious examples include: several organization units being formed and / or destroyed or awarding multiple contracts.
18 Activity has fallen behind the specified schedule. Such a condition often generates poor value situations in the effort to get the activity back on schedule.
19 Activities have been going on for a long period of time without extensive review or modification.
20 Issues involved are highly charged with diverse interests present. Such situations often have highly favored solutions, that may have been the best option once, but continue to be favored long after the value has declined below optimum.
21 Conditions have changed in the base assumptions used to make previous selections such that they are more costly, difficult to implement, and otherwise reduced in value.
1.3.3 Why project teams tend not to create maximum value
There are many possible reasons for the misalignment between intellectual effort
and value creation potential. This paragraph discusses the possible reasons why
value is not optimised, under the following headings:
Degrees of freedom;
building on assumptions;
lack of integration;
group think;
design for multiple outcome; and
measurements.
A Degrees of, reedom
As a project progresses towards completion, the knowledge and insight about the
project and the relevant environment increases. Ironically, but unavoidably, the
- 10 -

PART ONE - I TRODUCTION
openness to change decreases as designs are finalised. (see Figure 1-7) This
implies that the biggest decisions are made at a time when knowledge of the
project is at a minimum. The normal way of doing things thus often results in
these decisions staying unchanged and being implemented unchallenged [6].
Figure 1-7• Degrees of freedom
B wilding on assumptions
Going into the next level of detail without refining and optimising the previous
level means that the whole business could be designed around inaccurate
assumptions. If an assumption has been around for long enough and the next
layers have been built on it, those involved become unable to distinguish
between assumptions and facts. Designs must, as far as possible, be built on
facts obtained from analysis [6].
Figure 1-8: Build on an unrefined case

Exploration and business development
Financial analysts
Design engineers
Project engineers
Operational management
Feasibility Study
P T ONE MT 0 UCTION
Lack of integration
A project goes through a number of phases before it is finally operated as a
business. The teams involved often differ between these phases as illustrated in
Figure 1-9. Although a team normally succeeds in documenting all its findings
and designs, the fundamental reasons behind the decisions are often lost. During
one phase a team can find for example that a bridge over a river is required and
documents the specifications of this requirement. During the subsequent phases
it is possible that the need for the bridge no longer exists but the new team does
not understand the initial reasons behind the bridge and an unnecessary bridge
may be built.
A lack of tight integration between the different phases of the design process
implies that value-leaks occur in every hand-over.
Figure 1-9: Lack of integration
D Group-think
Whenever a group of people has been working together for a period of time they
tend to start thinking more and more in a similar manner about issues. The
- 12 -

Original business case
Function Value =
Cost
= Volkswagen
R 50 000
Outcome as specified by permanent project team
Function Value =
Cost
Porsche
R100 000
PART ONE - INTRODUCTION
adjusting power of disagreeing is to a certain extent lost as permanent project
team members tend to group-think.
A requirement for a function can for example evolve from an initial low
important need to occasionally travel from point A to B to a very specific need
for a Porsche at the end. (see Figure 1-10)
The team becomes unable to distinguish between functionality and cost, which
leads to a dilution of value.
Figure 1-10: Distinguish between functionality and cost.
E Designing for multiple outcomes
One official view of the environment, where the project and future business must
exist, is often defined. The designs are focussed on this one official view of the
future. As no provision is made in the design for worse or better than expected
outcomes, future value is lost as the project is unable to capture the benefit of
optimistic scenarios or survive in pessimistic scenarios.
The future must be seen as a number of possible outcomes as illustrated in
Figure 1-11. Designs will recognise the possibility of outcomes less or more
favourable.
- 13 -

PossimistIc business clatt$ (Ca*:
.Voad)
Optithigtic business data (14ighroad)
Value
Schedule Budget Specification
"Tell me how you measure me and I will tell you how I perform."
PART ONE - INT 0 UCTION
Figure 1-11: Multiple outcomes
F Measurement
The measurement of a project team's performance is often not aligned with the
real value of the final business as illustrated in Figure 1-12.
Figure 1- 12: Value and measurement not aligned
1.4 Closure
Part one indicates that there is a possibility that hidden opportunities within
capital projects exist and that capital projects often do not realise its full
potential. The possible reasons behind this dilemma have been discussed.
Part two discusses the creation of businesses by means of capital projects, and
the measuring and definitions of value. This forms the fundamentals of the
research. The fundamentals are required in order to address the described
dilemma.
- 14 -

PART ONE - INT ODUCTION
The potential of the hidden value has to be assessed in order to make an
informed decision regarding an initiative to capture this value. Part three
discusses a process to assess this hidden value.
-15-

MASTER PLAN Understanding the business
Case for change
Target Analysis. design. implementation
INTEGRATION integrating value engineering
with the Incur process Ito
tinting organisation &
responsibilities
CLOSURE what was the value of the
research ?
INTRODUCTION why value engineering is
required by growing
Companies ?
2 Part Two — Fundament as
"As a multiple of laws often only hampers justice, so a state is best governed when, with
few laws, these are rigidly administrated; in like manner, instead of the great number of
precepts of which logic is composed "
Rene Descartes
2.1 Objective
Part Two introduces the underlying fundamentals of value engineering as basis
for the case study in part four. It also provides a relevant literature overview of
value and systems engineering.
Figure 2-1: Part two, Fundamentals
- 16 -

PART TWO - FU MENIALS
In order to address the described dilemmas with capital projects it is necessary to
firstly understand capital projects. The generic process to establish a business
through capital projects is briefly discussed. These capital projects are discussed
in terms of:
The establishing methodology used (systems engineering); and
feasibility studies to assess the technical and economical workability of the
project.
Since value engineering is proposed as a possible solution to the dilemmas, the
fundamentals of value engineering are discussed in terms of the following:
Definition of value;
definition of value improvement;
definition of value engineering; and
the value engineering fundamentals.
2.2 Capital projects
Different industries use different processes for executing capital projects, but
apart from differences in terminology, all are conceptually similar. The process
starts with need identification, followed by different stages of design. It goes on
to operation and ends with the phase-out of the system [27,29].
This part briefly discusses the process for capital projects using systems
engineering as the underlying theory.
- 17 -

Exonoinie/ value evaluation
S optimization
PART TWO - FUNDAMENTALS
Figure 2-2: Process to establish capital projects [29]
The three iterations of the business-, process- and detail- engineering are called:
Potential study;
pre feasibility; and
feasibility study.
The only difference between these phases (illustrated in Figure 2-3) is the degree
of accuracy and the amount of money and time spent to complete the phase. The
output of the final phase, (feasibility study) is defined to the extent that a board
of directors representing investors or a commercial bank would consider the
project to be feasible and would be willing to supply the required funds.
- 19 -

PART TWO - FUNDAMENTALS
2.2.1 Systems engineering
"There is so much talk about the system. And so little understanding"
Robert M. Pirsig
Systems engineering is defined by Nicholas as "the science of designing
complex systems in their totality to ensure that the component subsystems
making up the system are designed, fitted together, checked and operated in the
most efficient way" [27].
In the context of value engineering it can be added that the ultimate and only
purpose of the system is to create value.
The process used by Iscor as set out in this dissertation, is illustrated in Figure 2-
2 [28]. After a potential business has been identified and initiated, a three phased
approach is used: business engineering; process engineering; and then detail
engineering. This process evaluates and optimises each step. Usually multiple
iterations of these phases are needed before approval can be obtained and the
construction project can begin. The economic evaluation forms the centre of the
process and directs and governs the system design towards its ultimate goal to
create value.
- 18 -

PART TWO - F NDAMENTALS
Figure 2-3: Iterations offeasibility study
The degree of accuracy prescribed by Iscor Mining and an indication of the
possible cost of the study are illustrated in Table 2-1.
Table 2-1: Accuracy and cost of study
Potential 60 — 75 % 0.1 — 0.3 %
Pre-feasibility 75 — 90 % 0.2 — 0.8 %
Feasibility 90 % 0.5 — 1.5 %
This paragraph described the essence of the process used by Iscor to establish a
business by means of capital projects that is of importance for this dissertation. It
is important since value engineering is an addition to this process. This process
is sufficiently documented and is used on every capital project within Iscor [2,3,
29]. Since the value of the project is addressed by value engineering, the next
paragraph addresses feasibility studies and the measuring of value in more
detail.
- 20 -

PART TWO - FUNDAMENTALS
2.2.2 Feasibility study
"Look beneath the surface: never let a thing's intrinsic qualities or worth
escape you.
Marcus Aurelius, Meditations
In order to answer the ultimate question of whether a project is feasible and
therefor whether it is going to create or destroy value, only the following two
questions have to be answered.
o Is it going to work as one foresees?
o Is it worth doing in terms of value?
This part briefly discusses answering the two questions at hand. Emphasis is
placed on the 'worth doing' question since it is felt that this issue is the most
relevant and the most neglected question. Although the answering of these
questions is addressed separately in this document, it must be seen as an
integrated process.
A Technical feasibility
To answer the question on whether a business is going to work as one foresees,
the technical feasibility of the business is assessed. The output of this study is
defined and proves the business to a level of detail and certainty where a typical
bank or investor would be willing to fund it.
This study defines the raw materials (the geology in the case of mining), the
market and the whole value chain with supporting processes to link the market
with the raw materials. Table 2-2 illustrates the typical chapters of a bankable
study as required by Iscor Mining.
-21-

ART TWO - FUNDAMENTALS
Table 2-2: Guideline for bankable document
1 Executive Summary 2 Introduction 3 Markets 4 Geology And Resources 5 Mining Rights And Permissions 6 Mining 7 Processing 8 Infrastructure Operational Concept 9 Integrated Environmental Management 10 Management And Human Resources 11 Implementation 12 Economic Evaluation 13 Ownership And Company Structure 14 Financing 15 Risk 16 Conclusions/Recommendations 17 Role Of Consultants / In-House Specialists 18 Appendices
The output of this phase is a bankable document describing and proving the
viability of the business to an acceptable level of accuracy. This study forms the
starting point from where an improvement initiative has to be launched. Value
Engineering has to improve on the design described during this study. Other
corporations could use other or similar approaches, but in the end a documented
design has to exist to be improved. The objective with this dissertation is to
focus on the improvement and not on the process used to design this business.
Economic feasibility
The economical evaluation of a capital project is used to consider the trade-offs
between cash out-flows in the form of capital and future cash in-flows in the
form of profit [6]. Economic analysis is a field of its own. This paragraph is an
introduction to the concepts with the aim to give a relevant overview to value
engineering on capital projects and is not a detailed discussion.
The reason for evaluating a project economically, is twofold:
o to answer the question of whether a business is worth having; and
o to compare and choose between different projects.
- 22 -

PART TWO - F NDAMENTALS
The result of the economic analysis is also useful as a base and metric for
improvements, hence the relevance for this dissertation.
In the United States top management is' expected and pressured by the board to
maximise shareholder value. In Europe weightings is given to a variety of
stakeholders for whom value must be maximised. These stakeholders include
customers, suppliers, workers, government, debt providers, and the society [11].
Whether the goal with a business should be to maximise value for the
shareholder and what claim other stakeholders should have on value, is an often-
debated issue. According to McKinsey & Company, Inc the shareholders will
maximise the value for the stakeholders in an attempt to maximise their own
value [11].
To regard the economic analysis described in this paragraph as the only metric
for the value and value improvement initiatives, implies that the underlying goal
is to maximise shareholder value.
Economic value as used in this dissertation is describe by Equation 2-1:
Equation 2-1: Value
Value = present value of the discounted, forecast future cash flow
To expand on this economic description of value the following are briefly
described in this paragraph:
The forecast of cash flows in real or nominal terms and different currencies;
(Value = present value of the discounted, forecast future cash flow)
the discounting of cash flows; and
(Value = present value of the discounted , forecast future cash flow)
the possible outputs.
(Value = present value of the discounted, forecast future cash flow)
-23-

Discount rate
Value
Tons
Pd"
—0.1 Revenue
T
-
Al lowance
IL Payable
. . —01 Work ing cap ital
Supporting
L process costs
Primary process coca
—
-
r; Expenditure
—41 Operating cost
—t1 Capital expenditure
--Pi Replacements
—Si Rebuilds
Forecasted cash flow streams over the expected life of the business
PART TWO - FUNDAMENTALS
Forecast cash flows
The different cash flows of the business have to be forecasted over the expected
life of the business as illustrated in an example in Figure 2-4. These cash flows
and the relationships between them form the core of economic analysis.
Historical data, benchmarking information, design criteria and other techniques
are used to forecast the different cash streams [20].
If these forecasts are expressed in terms of the worth of money of a specific year
it is called real terms. This cash flow stream takes the possible cyclical nature
of the price or cost into account but not escalations due to inflation [32].
Figure 2-4: Future cash flows of the business [13]
By adjusting this real cash flow by the appropriated inflation figure, it is
changed to nominal terms. The PPI (Producer Price Index) is normally used as
an estimate of the appropriate inflation.
Nominal cash flows are therefor described by Equation 2-2:
-24-

PART TWO -FUN AMENTALS
Equation 2-2: Cash flow in nominal terms
cash flow in nominal terms = cash flow in real terms * PP. Ifactor
Forecasted cash flow is often in different currencies. Exchange rates are used to
convert these different currencies to a common currency. The money stream has
to be adjusted with the appropriate inflation of that country before it is converted
to the new currency.
Converting cash flow to a common currency is illustrated in Equation 2-3.
Equation 2-3: Cash flow per currency
cash flow in currency A = cash flow in currency * exchange rate AVB
ii Discounted future cash flows
Economic analysis makes the trade-off between cash out-flows (investment) and
cash in-flows (profit in the form of revenue). In comparing cash flows occurring
at different times and over different periods, the interest paid on loans have to be
taken into account. This is called the cost of capital.
The cost of capital is calculated as a weighted-average cost of the different
source pools of capital of the larger company.
Cost of capital (WACC, weighted average cost of capital) is therefor described
by the following equation:
Equation 2-4: Cost of capital
cost of capital = (cost of debt capital * % of debt capital) + (cost of -owners
equity * % of owners equity)
The cost of capital is used to calculate the discount rate. The discount rate is
similar to the cost of capital but takes company risk and share volatility into
-25-

PART TWO - FUNDAMENTALS
account. The discount rate is used to express future cash flow streams in one
comparable value, called the net present value of the stream.
Discount rate is therefor described by the Equation 2-5.
Equation 2-5: Discount rate
discount rate = cost of capital + a percentage calculated using share volatility
and country profile
Net present value is then described by Equation 2-6.
Equation 2-6: Net present value
net present value = net future cash flows discounted at the appropriated
discount rate
iii Output of the feasibility study
Economic analysis consists of the gathering of data and making of forecasts.
These forecasts have to be checked, formally approved and placed under change
control procedure to ensure reliability and stability of the final answer.
The financial feasibility of a project can be expressed in various ways. Each one
of these indicators has some advantages and disadvantages. Normally the
different indicators will jointly be interpreted to make a decision. These
indicators are:
Net Present Value (NPV);
Payback Period;
Internal Rate of Return (IRR);
Profitability Index (PI); and
Modified Internal Rate of Return (MIRR).
-26-

P 1 T TWO - FUNDAMENTALS
Anyone of these indicators can be used to measure and manage the improvement
of the project. Net Present Value is, however, an excellent measurement for the
purpose of value engineering as expressed in the two studies described in
paragraph 1.3.2 [17,18].
2.3 Value Engineering
Value Engineering is proposed as a possible solution for the dilemmas described
in Part One of this dissertation. The fundamentals of value engineering have to
be applied on the capital projects described in the previous paragraph of this
dissertation. The fundamentals are discussed in terms of:
A definition for value;
discussion on improvement;
definition for value engineering; and
the success factors for a value engineering exercise.
2.3.1 Definition of value
To consider something to be valuable or of value implies that it is worth
something, desirable, and of some utility [14]. In the business sense value would
have a different meaning for the different stakeholders, but value as defined by
value engineering implies economic value for the shareholders.
Value for the purpose of value engineering is expressed as the desired function
divided by the cost to achieve this function. This equation is shown in Figure 2-
5 [1,38].
-27-

T Function
Output required to satisfy a customer requirement
Vahie = Cost
Capital and operating cost needed to achieve function
PART TWO - FUNDAMENTALS
Figure 2-5: Definition of value
The economic value of a project is calculated and expressed as discussed in
paragraph 2.2.2B. Net present value will be used in this document as an
indicator of the value of the project.
The value of a project is however not an exact figure, it is rather a distribution of
a number of possible outcomes.
A probability exists that a value of less than the estimated value will realise. This
represents the downside and can be indicated by the project exposure to risk. On
the upside there is also a probability that a value better than the estimate realises.
This is true regardless of the detail and caution involved during the feasibility
study.
In view of the value one must therefor move from a point estimate to an
expected value. The official value of the project is then only a point on the line
with a number of possible outcomes. The total picture as indicated in Figure 2-6
must be considered as the actual value in improving the value.
- 28 -

Realistic biiiittela:d ata (Base case)
?Ian "Br
pytitaistic,..buSitiess data (Hig164irii)
Pi 44 "c"
0
P T TWO - FUN AMENTALS
Figure 2-6: Value as a distribution of possible outcomes
Value
2.3.2 Definition of value improvement
Improving value implies that the project becomes more valuable as defined in
paragraph 2.2.2B. This is not always a cost cutting exercise. The net effects of
all the changes are calculated and trade-offs are made between the positives
(cash in-flow) and the negatives (cash out-flows).
The application of the value equation to describe improvement is illustrated in
Figure 2-7. Different situations would require different focuses for improving
the value.
- 29 -

Type A Type B Type E Type D Type E function up for function up for function up and cost down for the cost down and higher cost the same cost cost down same function function down
Pf
Function Value —
Cost
bb
Strategic importance
Performance
PART TWO - FUNDAMENTALS
Figure 2-7: Focuses for value improvement
However, since the value is not an exact figure but only an estimate of a number
of possible outcomes (discussed in paragraph 2.3.1), there is another dimension
of improvement to be considered.
Taking this dimension into account improvement can be achieved not only by
changing the mean of the distribution, but also by changing the shape or
skewness of the distribution [30]. From these four basic ways of improving the
expected outcome of the project can be defined. These are graphically illustrated
in Figure 2-8 as:
Pure improvement;
risk management;
budget cut; and
increased certainty.
If the value is improved without changing the shape of the probability
distribution the distribution, as a whole will have to be moved. This implies that
risks are not specifically addressed and that probability of capturing the benefit
of an upswing stays unchanged.
- 30 -

PART TWO - FUNDAMENTALS
The second improvement implies that the expected outcome stays unchanged,
but that the probability of the downside is improved. The risk of the project is
lowered. This makes the project more desirable and value is therefor improved.
A drive to cut a project budget can result in an increase in risk and a loss of the
ability exploit the possible benefit of an upswing. This is however regarded as
the third type of improvement as long as the negative effect is understood.
The fourth type of improvement is where changes improve the probability that
the project will realize the promised results, without actually changing these
results.
Figure 2-8: Improve the outcome
Pure improvement distribution as a
is when whole move
the value to the right
Risk management lowers the exposure to risk
A All
•
I,
-
A higher value with a higher risk and less optimistic possibilities is typically a budget cut.
A higher certainty to achieve the planned results
-31-

PART TWO - FUN AMENTALS
2.3.3 Definition of value engineering
A History of Value Engineering
Value Engineering had its origin during World War II, at General Electric, when
innovation was required because of material shortages. Some critical materials
were difficult to obtain and a great number of substitutions had to be made.
Harry Erlicker, a vice-president of General Electric, made the observation that
many times these changes resulted in lower costs and improved products. This
encouraged him to seek an approach to intentionally improve a product's value.
He assigned Lawrence D. Miles, a staff engineer, the task of finding a more
effective way to improve a product's value [24].
In 1947, Lawrence Miles and his team developed a step-by-step system, called
Value Analysis, to analyse a product's cost and function and to hunt out
unnecessary costs. As a result of substantial investment the new methodology,
Value Analysis, was developed, tested, and proven highly effective. However, it
wasn't until 1952 that value analysis began its growth throughout industry [24].
Value Engineering is therefor not something new, it comprises no complex or
new techniques it is merely an effective utilisation of common theories
unleashing and organising the mind's power in creativity.
Value engineering for capital projects
This document describes the application of the value engineering methodology
to the development of capital projects, including expansion of existing
businesses (brownfields) and new ventures (greenfields). Value engineering
principles and processes can, however, also be applied for the optimization of
existing businesses. The fundamentals and techniques are similar as illustrated
in Figure 2-9.
- 32 -

Value engineering
Using value engineering to radically improve designed projects
Using value engineering to optimize current operations
Using value engineering to design optimal capital project
PART TWO - FUNDAMENTALS
Figure 2-9: Value engineering and capital projects
During the life cycle of a project this method is applied in two ways:
Doing it right the first time:
Applying value engineering principles and techniques as an integral part of
designing a business. This implies that the 'optimal' business is designed from
the start.
Formal redesign:
Doing a formal redesign and value optimization exercise at some point during
the project life cycle.
Both applications are needed, but the better the first one is applied the less
reason for the second.
-33-

Collaboration V Commitment Creativity
Value focus Targets
Process Techniques Tools
Value engineering applied successfully to improve capital projects
PART TWO - FUNDAMENTALS
2.3.4 Value engineering fundamentals
"I have long believed in the principle that you should endeavour to keep things
simple in business. To me simplicity makes profits and complexity reduces
them."
Patrick Meaney
This paragraph discusses the factors required to make a value engineering
initiative successful.
This paragraph describes the three fundamentals of value engineering (illustrated
in Figure 2-10) in terms of:
The culture required for success;
the strategy that must be followed; and
the structure required for value engineering.
Figure 2-10: Value engineering fundamentals
- 34 -

PART TWO - FUNDAMENTALS
Culture
"People are able to do what needs to be done."
Jay Hall
The success of the exercise depends on the team's ability and willingness to
improve the project. Jay Hall defines competence as a sustained capacity for
meeting demands in a committed and creative way [16]. This model is used to
describe the required culture for a successful value engineering exercise.
The three dimensions discussed are:
Collaboration;
commitment; and
creativity.
Collaboration
Jay Hall defines collaboration as a genuine working together towards a shared
goal [16]. Collaboration is required to release the commitment and creativity into
the improvement initiative on the project.
Collaboration is required for success. For value engineering this implies:
Management support exists;
the team working as one towards the focused goal; and
a willingness and a belief in the ability to achieve the set targets among team
members.
ii Commitment
The extent to which the team members are committed to achieve the
improvement will have an influence on the outcome.
Commitment towards the goal is required; for value engineering it implies:
-35-

PART TWO - FUND MENTALS
Energy and a drive to achieve improvement within a time limit exists; ("lets
do it now")
the culture is to evaluate and test assumptions; ("don't assume, evaluate")
and
it is not easily accepted that something can't be done or that something is the
best option; ("rigorous evaluation")
iii Creativity
"The uncreative mind can spot wrong answers, but it takes a creative mind to
spot wrong questions."
Anthony Jay, Management and Machiavelli
In our mind we are all caught in paradigms which define boundaries for our
minds. Our brain doesn't allow us to' break and think outside these boundaries.
Even if the situation changes the mind often doesn't allow us to see the available
alternatives and the old familiar solutions will be used [12].
Although improvement can be achieved within paradigms, real improvement
often requires the breaking of paradigms. To achieve success, it is required to
think and look for solutions outside the boundaries of the mind. Creativity is
used to stimulate the breaking of paradigms and therefor the finding of better
solutions outside the obvious. The quality and value of improvement ideas is
directly proportional to the degree of creativity among those involved [38].
Creativity and breaking of paradigms should be embedded in the culture and
should be regarded as the right thing to do among the value engineering team
members. The following techniques can be used to assist the finding of creative
solutions [12,34]:
Involvement of outsiders;
brainstorming, lateral thinking; and
six thinking hats techniques.
-36-

PART TWO - FUNDAMENTALS
B Strategy The strategy of the value engineering exercise is defined in terms of:
The required focus on value; and
the required target for the exercise.
Value focus The project team has to focus on optimizing the value of the project, all actions
are directed to contribute to this goal. This goal becomes not only the most
important, but also the only goal.
Using the equation in Figure 2-11 the focus areas for value improvement can be
grouped into the following groupings [26,22]:
optimize function (quality, speed and flexibility);
hunt out lazy capital;
manage risk don't kill it with capital; and
minimize waste.
Figure 2-11: Operational value drivers
FUNCTIONAL PERFORMANCE
VALUE COST
F(QUALITY; VOLUME; FLEXIBILITY)
F(EXPENDITURE; RISK; WASTE)
ii Set target
It is required that a target to aim for exists. In the design stage of a business this
is achieved by adapting a design to cost philosophy. For a value improvement
exercise a target based on facts have to be determined and formally approved [3].
- 37 -

PA T TWO - FUNDAMENTALS
The second important requirement is that this target has to be stretching and
difficult to achieve. A target where the team knows beforehand how they are
going to achieve would not result in the required frame of mind [15].
Structure The previous paragraphs discussed the need for a specific value focus, creativity
and energy. All these are of no value if it is not converted into improvement. To
convert this into actual improvement a structured process is required. Tools and
techniques to support this process are discussed.
Value Engineering process
According to Moll, the four generic engineering phases that can be distinguished
are [25]:
Analysis;
design;
implementation; and
operation.
Applying these generic engineering phases the master plan for a value
engineering exercise consists of three basis steps:
getting the facts or analysis;
finding the best solution or design; and
including the change in the plans or implementation.
Multiple cycles of these three steps are repeated on all the design levels. An
integral part of the value engineering process should be the tracking and
communication of progress against the set targets. The study is preceded by an
initiation phase which determines the project's 'need to change', and 'ability to
change' and fixes the targets. (see Figure 2-12)
- 38 -

Multiple cycles until
target is achieved (Business, process and engineering level)
• T change our business >
V ANALYSIS gelling the facts
DESIGN find the optimum
TRACKING
INITIATION preparing for value engineering
PART TWO - FUN MENT LS
Figure 2-12: Value engineering master plan
ii Tools and techniques for value engineering
As one can expect from a structured process tools, standard forms and
techniques are required in executing the process.
The following techniques are of importance: (see Appendix A)
Function Analysis System Technique (FAST );
Numeric Evaluation;
Redundancy Analysis; and
Cost to Function Analysis.
(the following literature has more detail on these techniques: Stringer [33] )
The following tools support the process [36]: (see Appendix B)
Idea Management tools; and
Idea Evaluation Supporting tools.
The following standards can be used [36]:
Value Engineering declaration (VE1);
Value Engineering idea capturing form (VE2); and
Value Engineering idea scoping form (VE3).
-39-

PART TWO - FUNDAMENTALS
2.4 Conclusion
Part one indicated that there is a possibility that hidden opportunities within
capital projects exist and that capital projects often do not realise its full
potential.
Part two briefly discusses the creation of a business by means of a capital project
within Iscor. The system approach and feasibility studies were addressed. This
is of importance for this dissertation as this is the carrier of the dilemmas
discussed in Part one.
Value Engineering is proposed as a possible solution to the dilemmas. The
definition of value, improvement and value engineering have been discussed.
The three dimensions essential to ensure successful improvement; culture,
strategy and structure have been discussed.
Part three will describe the process to initiate and conduct a value engineering
initiative on a capital project.
- 40 -

Part two
FUNDAMENTALS what is value 1
what is improvement ?
what is value engineering ?
INTEGRATION integrating value engineering
with the Ism. process Ito
tinting organisation &
re.sponsibilities
Why ?
INTRODUCTION Irby value engineering Is
required by growing
Companies ?
What ? How ?
;;;; the MY
When/ Who ? Final remarks
3 Part Three — Master Man
"We shall not cease from exploration
And the end of all our exploration
Will be to arrive where we started
And know the place for the first time"
TS Eliot, Four Quartets
3.1 Objective
Part three introduces the reader to the master plan for a value engineering
exercise on a capital project. The objective with a master plan is to provide a
methodology that can be used to unleash the hidden value discussed in Part one.
(see Figure 3-1)
Figure 3-1: Part three, Master plan
- 41 -

PART THREE — MASTER PLAN
The master plan for value engineering consists of the following four steps (see
Figure 2-12):
Initiation study
analysis;
design; and
implementation.
The initiation phase of a value engineering exercise is done to scope the value
improvement opportunities and to decide on the best option to capture this value.
The initiation phase determines the necessity for a value engineering exercise as
well as plan and prepare for the exercise if it is required. This dissertation
focuses on the fundamentals and the process to initiate a value engineering
exercise. All the preparation and planning that have to precede the actual
exercise are discussed.
Analysis, design and implementation are the steps following the initiation phase.
Analysis is done to completely understand the business and to serve as a lead to
improve this value of the project. One can only improve what one fully
understands. The objective with the design phase is to find the optimum design
for the business and to achieve the targets set during the initiation. The objective
with the implementation phase is to ensure that the improvement becomes part
of the new design. These three steps are only briefly discussed as they are
considered as detail outside the scope of this dissertation.
3.2 asic Principles
The initiation phase leads to a point where a decision on the value enhancement
of the project can be made. (see illustration Figure 3-2) To make an informed
decision the following questions have to be answered during the initiation phase:
Is there a need to change? (need to change);
Can the project be improved? (potential to change);
To what extent should the project be improved? (improvement target);
- 42 -

Process redesign
Detail engineering redesign
Process redesign
b001:03 1 Pere.r . .r*: 00i0.:-
i-.::Pitiii.4.64if40Pir**iii3
44 IA, 4001 4W4'. N.V3( ',
si. udy
Need to change Ability to change Target
Organization Plan
PART T TREE — MASTER PLAN
Who should be involved? (organisation);
How should the project be improved? (plan); and
What should the timing be? (when to start, when to stop).
The principles of the initiation is discussed in terms of:
Scope of the initiation study;
net potential benefit; and
the definition of a 'good' enough project.
Figure 3-2: Decision point
3.2.1 Scope of the initiation phase
Capital projects are often seen as the provision of plant or technical equipment
that can be improved by value engineering. A request to conduct a value
engineering exercise on an already defined scoped is often received, only to find
that it is of limited value, because of the limited scope [6]. Although it is possible
that the improvement potential is within the scope of the technical equipment, it
is important to fundamentally understand the role and dynamics within the
bigger picture of the business and its environment.
- 43 -

The TOTAL value chain of the The full life cycle will be taken into Findings will be estimates and
project will be analysed: account should be regarded as the tip of
the iceberg
Raw materials • All project costs
Primary processes • CAPEX Risks
Market • OPEX Improvement opportunities
Extemal influences • Equity Potential value
PART THREE — fi ASTER PL A!
It is possible that the outcome of the initiation phase could be a recommendation
that the improvement exercise should focus on a specific process within the
value chain. The scope of the initiation phase, however, has to be the complete
value chain from the raw materials to the client and may even include an
understanding of the client's value chain. (see Figure 3-3, Value chain)
Since a project should be designed and optimised for its total anticipated
existence, the initiation phase of the value engineering exercise should consider
the full life cycle of the project within the scope (see Figure 3-3, total life cycle)
[27].
The broad scope of the initiation phase could lead to the studies never being
completed within an acceptable time limit. It is therefor important not to address
the different aspects in too much detail, but rather to scope and assess all aspects
within the limited available time. The output should be regarded as estimates
and not as exact answers. (see Figure 3-3, estimate)
Figure 3-3: Initiation phase scope
3.2.2 Net potential benefit
Value engineering studies cost money and sometimes imply delays in the
project. A full value engineering exercise might well be an overkill for a small
project or a project with little improvement potential. The value adding potential
- 44 -

PA T THREE — MASTER PLAN
has to be weighed against the cost of the exercise and the effect of the delay on
the project, as illustrated in Figure 3-4.
Figure 3-4: Potential benefit vs. cost to capture benefit
3.2.3 Value creation target
The drive with capital projects should be firstly to create value for the
stakeholders. As shown in this paragraph this drive for value should aim to
create exceptionally high value, not just to be adequate. This is not simply a
matter of high standards for the cyclical-commodity industries, it is a matter of
survival. As said by Jeremy Carter of McKinsey Incorporated: "Projects must
aim to be insanely great." Therefor anything less is not good enough [7].
A Adequate value creation target
Businesses within an industry improve their operations and in doing so decrease
their production cost over time. The price of commodities decreases in real
terms with time as indicated in Figure 3-5. This price decrease puts profit and
production costs under pressure [9]. A large capital project often takes up to three
years from commencement to become operational. Should the project`initially
aim to be in the middle of the production cost curve it is probable that, by the
time it starts production, it would be on the high cost end of the curve. If a
- 45 -

Time
Pri
ce, c
ost
rea
l te
rms
(Ran
d/ t
on)
price
A
Acceptable profit 1 Marginal
profits
cost
More playerS',,enter
market .
Cumulative production
Pro
duct
ion
cost
Player A Player B Player C E
Demand decrease
Cost curve at
the time of
initiation
Cost curve at
commissioning
PART TH EE — MASTER PL N
decrease in demand occurs or should some other low cost player enter the same
industry, the new venture could enter the market as a loser. (See Figure 3-6)
Figure 3-5: Price cost squeeze
Figure 3-6: Cost curve change over time
Adequate target Being 'insanely great' is not achieved just by complying to the standards
prescribed by the firm's growth strategies. It is attained by aiming for something
that is at that stage not obviously achievable or known to be achievable [15].
r
-46-

Yes
INSANELY > GREAT
Yes
Invest your money within a bank
Yes
Buy their shares
V V Find another Revisit the project project
Yes
Can you provide the needed growth within the cash flow remedies?
1No
Are you doing it better than the but competitors?
0
Did you cash in on all the floating ideas?
0
If destiny turns its back on you, would you survive?
0
7
P RT THREE — BASTE PLAN
Project teams often aim for easily achievable goals, thus resulting in
underperformance as indicated in part one.
As shown in Figure 3-7, being insanely great implies that the following hurdles
have been crossed:
The venture complies with the growth strategy of the firm within the specific
constraints existing at that point.
Should the venture not compare favourably with its competitors, it would
probably be better to buy their shares. The share price of a firm is often
undervalued.
The worst case scenario should still imply a small profit for the venture.
Before and during implementation a number of improvement ideas exist in
the minds of the team and other stakeholders. It's not normal for these ideas
to surface or receive the necessary attention, but to cross this hurdle all these
ideas have to be considered.
Figure 3-7: Staircase to insanely great
- 47 -

Need to change
Potential to change
Targets
Cost of delay of project
Fast track projects that
should not be delayed
Proposal for capturing full
value
INPUTS ACTIVITIES OUTPUTS
Financial model
Bankable feasibility to date
Market studies
Undocumented knowledge
Other
hiierviews ,end ,wo Fzy sessions
'StIlf12■ daiumentadon
hat-ifsceOario
112ncrarmantpu a
tiqpylth nr.:‘-sctir
available dais
P RT Tr aREE — MASTER PLAN
3.3 Initiation process
This paragraph describes the process to be followed during the initiation phase
of the value engineering exercise. The process described in this dissertation is
the result of reasoning using the experience gained on the two capital projects as
described in Part 1.
This phase utilises existing information about the project obtained from
documentation, interviews and work sessions to decide on the best option for a
value engineering exercise. The inputs, activities and outputs are illustrated in
Figure 3-8.
Figure 3-8: Inputs, activities and outputs
The process used during this phase is illustrated in Figure 3-9. It consists of the
following steps, which will be discussed in more detail:
Business case review (understanding the project);
determine case for change (should we improve);
setting targets(where to); and
planning to capture the value (how).
-48-

Understanding the business/ project
Business level
Process level
Value matrix
Value improvement Target
Proposal to capturing the potential
Case for Value engineering
Potential to change ?
Need to change ?
Cost of delay ?
PART THREE — M STIED PL N
Figure 3-9: Initiation process
3.3.1 Business ease review
The purpose of the business case review is to form a common understanding of
the project as a logical first step of the initiation phase [40]. This review can be
conducted in a work session or extracted from the available documentation, all
depending on the nature of the project and the teams involved.
The approach to be followed is based on the process of establishing capital
projects illustrated in Figure 3-10 [37].
- 49 -

Economic/ value evaluation optimization
conStIWOo.2:
PART THREE — MASTER PLAN
Figure 3-10: Process to establish capital projects [29]
A Review project initiation
The initiation phase of a business case review is aimed at understanding the
fundamental aims of the project. The process consists of a review of the
business case and the objectives and plan of the project. Figure 3-11 illustrates
the activities per process step and the resulting outputs.
- 50 -

Define case for Define project Review macro business change objectives project or action planning
- Define overall project objective
- Define sub- objectives
- Define goal decomposition
- Project objectives - Macro WBS and schedules
ACTIVITIES - Understand current reality
- Understand future intent
- Understand business strategy to move from reality to intent
OUTPUTS - Strategic intent
Identify financial parameters
Identify drivers
Review assumptions
ACTIVITIES - Review NPV and - Draw NPV and - Identify risks for uncon- IRR IRR trees trolable variables
- Link financial - Identify controllable - Derive assumptions for parameters to and uncontrollable uncontrollable variables project objectives variables - Set improvement targets
- Set improvement - Rate variables iro for controllable variables targets where risk and impact on where required required NPV/IRR
- Identify drivers where sensitivity is greatest
OUTPUTS - Improvement - Value tree - List of assumptions
targets - List of key risk areas
PART THREE— HASTE PLAN -
Figure 3-11: Review project initiation
B Review economic evaluation
The economic evaluation phase of a business case review is aimed at assessing
the feasibility of a project. The financial parameters are reviewed, the factors or
drivers are determined and assumptions and sensitivities are reviewed.
Figure 3-12 illustrates the activities per process step and the resulting outputs.
Figure 3-12: Review economic evaluation
- 51 -

PA TTI , EE — 11/1ASTE PLAN
Review business engineering
The business design phase of a business case review is aimed at reviewing the
strategy of the business that flows from the project. (Figure 3-13 illustrates the
activities per process step and the resulting outputs.)
Figure 3-13: Review business engineering
Analyse the business
Develop strategies environment
ACTIVITIES - Analyse the external environment of the business
- Analyse the competitive environment of the business (market, product competitors etc)
- Develop overall strategy - Develop functional
strategies (marketing, operations, logistics etc)
OUTPUTS - Business scenarios - List of value adding ideas and
strategies - Ranking of ideas and strategies
Review process engineering
The process design phase of a business case review is aimed at designing a value
chain for the proposed business, breaking it down into processes and
understanding the work that needs to be done in each process. (Figure 3-14
illustrates the activities per process step and the resulting outputs.)
- 52 -

Assign technical task teams to processes
Review technical requirements
- Identify outstanding issues per high level process
- Generate ideas for outstanding issues
- Assign responsibilities with the groups
- Current work status assessment - WBS to get to BFS stage - Incorporation of value adding ideas
to WBS
ACTIVITIES - Assign specialist groups to high level processes
- Set technical targets
OUTPUTS - Technical task teams
PART THREE — MASTER PLAN
Figure 3-14: Review process engineering
Identify
Decompose value
Identify individual
value chain chain into
requirements for processes each process
ACTIVITIES - Model the Macro flow of activities in the business:
- Identify the processes of the business
- Break these processes down into activities where required
- Use each process as a basis to identify requirements
OUTPUTS - Value chain - Key performance
areas
- Process model - Critical performance - indicators
- Identified technical requirements
- Identified commercial requirements - Value adding ideas
E Review detail engineering
The engineering design phase of a business case review is aimed at reviewing
the technical requirements of a project. (Figure 3-15 illustrates the activities per
process step and the resulting outputs.)
Figure 3-15: Review detail engineering
-53-

Develop Assign Assign action responsibilities target plan f dates
- WBS - Resource plans OUTPUTS
- Assign time schedule to WBS
- Compile plans for study items
- Compile scoping document/proposal
- Final scoping document
ACTIVITIES - Develop all WBS - Identify skill requirements
- Identify external roles to be contracted in for specific study areas
PART THREE — MASTER PLAN
Review planning The planning phase of a business case review is aimed at reviewing action plans
and the progress to date for the rest of the project. (Figure 3-16 illustrates the
activities per process step and the resulting outputs.)
Figure 3-16: Review planning
3.3.2 Case for change
Paragraph 3.3.1 discusses the business case review as the first step of the
initiation phase. This step is done to define a common understanding of the
business. The next step discussed in this paragraph is to determine the case for
change. (see Figure 3-9)
The purpose of the 'case for change' step is to assess whether the project is
required to improve and whether any improvement potential exists. This is
compared to the expected cost of the value engineering exercise.
- 54 -

Case for Vat*, e=1911w
Prxel-A. ;< i.rzp
tot*ofooptri,
Understanding the business/ project
Business level
Process level
Value matrix
Proposal to capturing the potential
Value improvement Target
P RT THREE — MASTER PLAN
Figure 3-17: Initiation process
This step utilises the output of the business case review and financial analysis. It
can also be facilitated in a work session. It is discussed in terms of:
Need to change;
potential to change; and
Cost of value engineering.
A Need to change
The purpose of assessing the 'need to change' is to determine, quantify and
describe why the project needs to improve. Paragraph 3.2.3 indicates when a
project should be regarded as good enough and absolutely no need for change
exists.
This paragraph focuses on the project risk and the quantification of the threats to
the project. Two related techniques, that can be used jointly or separately, are
described to quickly assess the need to change:
Expected risk analysis [4]; and
controllable vs. uncontrollable value drivers [37].
- 55 -

PART THREE — MASTER PLAN
Expected risk analysis To make a quick assessment of the risk, the expected risk of the project is
calculated. More advanced techniques like Monte Carlo analysis can be used
when time and cost allow it. [23]
For a more detailed discussion on risk management the reader is referred to
Bosman [5].
The expected value of a risk is calculated using Equation 3-1.
Equation 3-1: Expected risk
expected risk = impact of the risk when realised x the probability of being
realised.
The following three steps are used before the expected risk is calculated:
Step 1: Identify risks
The risks are grouped under the following headings:
Project risk;
implementation risk;
raw materials related risks (geology in the case of mining);
operational risks;
market and financial related risks.
Using groupings such as discussed above, risks can be identified by interviews
and work sessions.
Stcp2: Estimate impact
The effect of the risk is estimated and the negative value on the business, as
measured by Net Present Value, is calculated using the financial model.
- 56 -

PA T THREE — MASTER PLAN
The potential impact of a specific risk on, for example throughput per houi; can
be estimated in a work session or interviews. This impact is converted to Net
Present Value using the financial model.
Step 3: Estimate probability
The probability of the risk realising is estimated and expressed as a percentage.
This is done in a work session or interviews by estimating, for example, the
frequency of the occurrence.
ii Controllable and uncontrollable value drivers
By dividing the value drivers identified during the business case review (see
paragraph 3.3.1B) into controllable and uncontrollable drivers, an estimate can
be made of the potential drop in value that is not under control of the project.
This is a technique indicating and quantifying the possible downside of the
project.
B Ability to change
The 'ability to change' is calculated to assess and quantify the project's potential
to improve. This is done to compare it to the cost of a value engineering
exercise before deciding to continue with such an exercise.
One subjective and two quantitative techniques are discussed:
Subjective technique;
scoping; and
benchmarking.
Subjective technique
The subjective technique assesses the existence of indicators normally associated
with projects having improvement potential.
Historical information indicates improvements of between 10% and 80%. This
improvement is achieved on (see Part 1) [8,17,18,31,34,35]:
- 57 -

PART THREE — MASTER PLAN
Business level, 60% of the improvement;
process level, 30% of the improvement; and
detail engineering level, the remaining 10% of the improvement.
The following indicators should show where the potential of the project at hand
is on the above continuum of percentages [34].
Complexity
The more complex the project the more improvement potential exists.
Complexity often implies that the team had to focus on the complexity and was
unable to optimise each step as they proceeded. The following are possible
indicators:
Great complexity in the plans, processes and volume balances;
complex relations between the business drivers; and
complex relations between the business drivers and the market requirements.
Age of the assumptions
The age and extent to which the designs are based on assumptions that have
been around long enough to have become unchangeable rules. Indicators are:
The different levels of designs are based on information that have not
changed in more than five years;
conditions have changed in the base assumptions;
activities have been going on for a long period of time without extensive
review or modification.
Measuring of value
If 'measuring value' does not form an integral part of the approach to the project,
this implies that decisions are not based on value. This suggests that value is not
optimised. The extent to which the project members understand the role of their
sub-system and its contribution to value indicates the importance of value in the
design process.
- 58 -

PART THREE — MASTER PLAN
Creativity
The extent to which creativity was allowed in the design process of the different
levels of the business can suggest that improvement opportunities exist. The
following three levels of the use of creativity can be defined:
Creative ideas were not allowed;
creative ideas were allowed, but not seriously investigated;
creative ideas were evaluated economically and not just technically.
Changes in budget or schedule
An increase in budget price or schedule often implies that the original
assumption of where the optimum is, is no longer correct. The team's
knowledge about the project increased to a new level, creating uncaptured
potential.
ii Scoping
This technique is used to estimate the value adding potential of the five to ten
best improvement ideas identified during the business case review [37]. It is
important to focus this estimate on the value and not on the technical feasibility.
The possible advantages are estimated and the financial model, that was used to
determine the value of the project, is used to calculate the value of the
improvement idea.
iii Benchmarking
The third technique is benchmarking with associated industries. If another
business is doing it better, room for improvement exists and should be found.
Cost of value engineering
The cost of value engineering has to be estimated and weighed against the
potential improvement.
- 59 -

PART T EE — MASTE PLAN
The total cost of an intervention consists of the following:
(Figure 3-18)
The 'value engineering' cost or cost of executing the intervention process
and finding improvements;
the opportunity losses caused by a possible delay in the project; and
the cost of necessary rework, including possible contractual implications
resulting from changes.
The index of potential can be calculated using Equation 3-2.
Equation 3-2: Index of potential [34]
Index of potential = estimated improvement / estimated total cost
An index of potential less than ten indicates a possible cut-off point for not
continuing with the improvement exercise [34]. Consideration of all the factors,
especially the availability of resources, should however precede this decision.
Figure 3-18: Cost of intervention drivers
Cost to find improvement
Total cost of intervention
d Opportunity losses resulting from a possible delay
Rework resulting from changes
Cost resulting from contractual changes
3.3.3 Target setting
The improvement target for a value engineering exercise is set by interpreting
the results of the following: (See Figure 3-19)
Compliance with the requirements of the investor or mother company;
- 60 -

PA T THREE : — MASTER PLAN
the risk or worst scenario for the industry;
comparison with the best in the industry; and
value engineering experience.
Figure 3-19: Target setting
What the investor wants needed growth cash flow remedies
Project risks scenario planning risk analysis
Known potential benchmarking floating ideas
Value Engineering history 10- 80% improvement 15 - 45% on capital
A Investor requirements
A comparison of the results of the economic analysis and the fit of the project
within the growth strategy of the investor, gives an indication of whether the
investor would require improvement. It is important to take cash flow
constraints and competing projects into account.
B Project risks
The project should at least survive on a downswing or when a worst-case
scenario realizes. This is the second indication of what the improvement target
should be.
Known potential
`Known' potential can be identified by benchmarking within the industry and by
the interpretation of the improvement potential identified during the business
case review.
- 61 -

Proposal to capturing the potential
Understktiditigthe sinesSt,prejece;'
l3u:sine4"-leVej
P,rocesSlevel,
Velue .m a t ri
aSelfor, Value enginAerifig.. x
niferitiaitb
e Ned lo change- , of delay ?
PART THREE — MASTER PLAN
Value engineering history Value engineering case studies indicate improvements of between 10% and 80%
on the net present value of the project. This benchmark is the last indicator used
to decide on a target. (see paragraph 3.3.2)
3.3.4 Plan to capture value
Paragraph 3.3.1 discussed an approach to get an understanding of the business
by means of a business case review [37]. An approach to determine and quantify
the case for change was discussed in paragraph 3.3.2. This is of value as it
normally improves the collaboration and commitment of the team. Once an
understanding of the business and the case for change have been completed, an
improvement target can be set as discussed in paragraph 3.3.3.
As illustrated in Figure 3-20 a plan to capture the potential value and achieve the
set targets has to be defined.
Figure 3-20: Initiation process
This paragraph discusses a plan in terms of:
o The organisation; and
o the value engineering process.
- 62 -

Demand and direction
Manage improvement
Steering committee
Improvement project manager
(
Certified Value Engineer
Value engineering process support
Unit leaders (value engineer facilitators)
Tracking & scorekeeping
Facilitate & evaluate Track & communicate progress improvement in unit against target
P • T THREE — MASTER PLAN
A Organisation ■
A team dedicated to improving the value is required. The typical organisation
and responsibilities of this team is illustrated in Figure 3-21.
This team would report to a high level steering committee, that gives direction to
the team. A value engineering specialist gives support on the process and value
engineering methodology if required. Progress against the target is tracked and
communicated. A broad spectrum of people outside this organisation and
possibly outside the company may be involved in the study.
Provision must be made to prepare and brief the steering committee members on
their role in the exercise and to give the required training to the project team
members.
Figure 3-21: Intervention organisation
Value engineering process
After the initiation phase the remaining steps in the value engineering master
plan are: (see Figure 3-22)
Analysis;
design; and
implementation.
- 63 -

Multiple cycles until target is achieved (Business. process and engineering level)
INITIATION preparingfor value engineering
PART THREE— MASTER PLAN
Figure 3-22: Value engineering master plan
Analysis
Function analysis is the identification and description of functions followed by a
number of possible manipulations or techniques. This is done to obtain a clear
understanding of the business and its functions. Typical techniques are: (see
Appendix A)
Function identification;
Function Analysis System Technique;
Numerical method;
o Redundancy analysis; and
Cost to function analysis.
For a more detailed discussion on analysis the reader is referred to Stringer [33].
ii Design
Design is the combination of creativity, insight obtained during the analysis
phase and knowledge about the project in order to achieve improvement.
The last step in the design phase is the evaluation of the idea. (see Appendix B)
For a more detailed discussion on design the reader is referred to Utah
Department of Transport [34].
- 64 -

PA T THREE — MASTER PLAN
iii Implementation An idea with value adding potential is of no value to the project unless it is
formally approved and becomes part of the new plan and budget.
Implementation ensures that the improvement becomes part of the new design
following the required change control procedures.
iv Cycle and schedule Improvement can be achieved on business, process or engineering level as
defined during the business case review (see paragraph 3.3.1). The value on the
different levels is captured in different cycles each focusing on a specific level.
The target and the findings made during the initiation phase will determine the
relative emphasis on the following three cycle groupings:
Business level cycle;
process level cycle; and
detail engineering cycle.
3.4 Conclusion
Part two introduced value engineering as a proven technique and a possible
solution to the dilemmas described in Part one.
Part three introduced the reader to the master plan or methodology to be
followed. It focused on the process required for initiating a value engineering
study.
Part four will discuss the introduction of value engineering, using current Iscor
processes as a case study.
- 65 -

Part one
INTRODUCTION why value engineering is
required by growing
Companies ?
Part two
FUNDAMENTALS what it value ? what it improvement ? what it value engineering ?
MASTER PLAN Under.standing the business COSL fill change Target Analysis, design, implementation
Part three
Why ? What ? How ?
When/ Who ?
, GRAT1ON atitig vIdtte . enAjne riug .
iltatx, rn A
Final remarks
4 Part For e hltegraUon
"The old concepts and formulas are no longer adequate to express our modern outlook
The old bottles will no longer hold the new wine. The spiritual temple (management) of
the future, while it will be built largely of old well proven materials, will require new
ampler foundations in the light of the immense extensions of our intellectual horizons."
General JC Smuts, 1925, Holism and evaluation
4.1 Objective
Part Four discusses the integration of value engineering with the current
processes Iscor uses to establish a business. (see Figure 4-1) This is discussed to
serve as a case study for this research.
Figure 4-1: Part Four, Integration
The principles and methodology of Value Engineering are essential for creating
value and should be made compulsory on all capital projects. Due to the success
of value engineering the United States Congress passed a law in February 1996
- 66 -

PA T FOUR— INTEG ATION
that requires the "establishment of effective programs to apply the practice of
Value Engineering" [35]. Value Engineering will return our focus to creating
value by changing our views and decision making. This methodology should be
integrated in project management and become part of the current process of
establishing a business [19,21].
In order to introduce value engineering on projects, we must know when in the
project life cycle to do it (when), where and how to fit value engineering within
the project management processes (how) and what skills are required (who).
Integration is therefor discussed in terms of:
Timing;
integration with project management; and
organisation and establishment of skills.
4.2 Integration
Value engineering can be applied as an integral part of the design process ("Do it
right the first time") or as a focused intervention during the life of the project
("Value Engineering Intervention") as mentioned in part two of this document.
It is to be expected that as Value Engineering becomes established, the effect of
interventions will gradually become less and less dramatic until it vanishes
completely. This will happen because project teams will start to introduce value
engineering principles in their designs and will design optimal businesses from
the start. This is the ultimate goal of value engineering, but until this is
accomplished, the intervention must serve as an indispensable tool for a
company.
The intervention of a project also serves as a valuable tool for establishing these
principles in a company. Team members who experienced a successful
- 67 -

P RT FOUR — INTEGRATION
intervention process will tend to use the methods and principles intuitively on
their next assignment [17,18].
4.2.1 Do it right the first time
To establish a culture where projects are designed optimally from the start, value
has to become a way of life and the only goal. The following steps will
contribute towards this goal if they are made part of the normal way of doing
projects:
Establish a value culture and make the team aware of value as part of the
team's briefing;
measure and communicate value, value drivers, and any change in value
during the project;
design value by designing a function to a cost target; and
optimise all steps by way of mini-interventions directly after logical steps
(let's improve what we just did ); examples of logical steps are business
process, detailed engineering, conceptual design and other smaller steps.
4.3 Timi g of the intervention
For an intervention to be successful, timing is of the utmost importance. There
is no easy answer to the question of 'When is the best time for an intervention?'
It is however true that the success of an intervention depends on the timing and
on the stage where it is inserted within the current process.
This paragraph discusses timing and also aims to give the reader an insight into
the factors involved in making a project specific decision on when to intervene.
The ideal time for an intervention would be when:
The teams have obtained insight into and knowledge of the project, its
surroundings, and its value, (ability);
the stakeholders' willingness to change is not frustratingly low (willingness);
and
the cost of changing is lower than the benefit of the intervention.
- 68 -

PART FOUR — INTEGRATION
The benefit expected from an intervention can be described by the following
Equation 4-1, which is used to describe the advantages and disadvantages of
conducting an intervention at a specific time [31].
Equation 4-1: Intervention benefit
intervention benefit = f(ability, willingness) — cost of change
4.3.11 Team's ability to improve
A team's ability to improve can be related to the members' knowledge about the
project. It is therefor a fact that for a fixed team the ability to improve will
increase with time, being at an all time low at the beginning of the project.
As shown in Figure 4-2 knowledge of the project increases over time as the
project progresses towards completion. This implies, as illustrated by Equation
4-2, that this factor favours the study to be later in the project.
Equation 4-2: Intervention benefit: Ability
intervention benefit = f(ability, willingness) — cost of change
4.3.2 Willingness to change
The willingness to change determines the team members' ability to perceive
improvements. (see Equation 4-3) A team that is completely satisfied with its
project will only see improvement opportunities with great difficulty. This can
be managed, but managing it becomes much more difficult after board approval
of the project. This factor is graphically presented in Figure 4-2, that shows
willingness to change decreasing as designs are finalised, with a radical decrease
once board approval has been obtained.
This factor favours the study to be earlier in the project.
- 69 -

> ) Feasibility Implementation Operation
phase Project Potential study
initiation phase
Pre-feasibility phase
Capability indicators
Willingness
Suitable for
interventions
Board
approval
Ability
Project steps
PART FOUR — INTEGRATION
Equation 4-3: Intervention benefit: Willingness
intervention benefit =f(ability, willingness) — cost of change
Figure 4-2: Project team capability
4.3.3 Total cost of intervention
The total cost of a value engineering intervention is the next factor influencing
the timing of the exercise (see Equation 4-4). It comprises the following as
illustrated in Figure 4-3. (refer to paragraph 3.3.2C)
The 'value engineering' cost or cost of executing the intervention process
and finding improvements;
the opportunity cost of a possible delay in the project; and
the cost of necessary rework, including possible contractual implications
resulting from changes.
Equation 4-4: Intervention benefit: Cost of change
intervention benefit = f(ability, willingness) — cost of change
- 70 -

<1
Cost to find improvement
Opportunity cost due to delay
Feasibility phase
Pre-feasibility phase
Project Potential study initiation phase
)
Implementation Operation
Rework cost
Project steps
Suitable for
interventions
Cost of intervention
PART FOUR — I TEGRATION
Figure 4-3: Cost of intervention drivers
Cost to fmd improvement
Total cost of intervention
Opportunity losses resulting from a possible delay
Rework resulting from changes
Cost resulting from contractual changes
All three these costs increase as the project progresses towards completion as
illustrated in Figure 4-4. From this it is clear the cost factor favour the timing of
the value engineering exercise to be as early in the project life cycle as possible.
Figure 4-4: Cost of intervention
- 71 -

PART FOUR — INTEG ATION
Cost is often confused with the 'willingness to change' when teams use rework
and cost of delay to justify unwillingness on their side. Before the start of project
execution the cost of change is normally orders of magnitudes smaller than the
benefits to be obtained. A Colorado based company, SAMI, reported a return on
investment for value engineering exercises exceeding $1000 for every dollar
invested [31] .
In almost every case in which value engineering is applied, the money saved will
be many times the cost of a value engineering study. "A general rule of thumb
states that expected savings should exceed the expected study and
implementation costs by a factor of ten." [34]
Cost can be quantified and compared to the possible improvements once it is
identified and evaluated. Cost should therefor never be used as a reason not to do
an intervention; it should rather be used to decide whether an idea is feasible and
whether it should be implemented. It is never too late to consider improvement,
although the earlier it is done the cheaper it will be (and the greater the degree of
freedom is).
4.3.4 Logical intervention points
According to Figure 4-5 (adapted from Moll [26]) it is logical that improvement
can occur only after something has been defined and is understood (managed).
In essence this means that something to improve, or a base from where to
improve, exists. The team members should at least understand the dynamics of
the venture and the environment in which it functions.
- 72 -

TIRE
CHAOTIC
L
IMPROVED 4
L
OPTIMISED
DEFINED
MANAGED
Project steps
Project
Potential study Pre-feasibility Feasibility Implementation Operation initiation phase phase phase
Logical points
ART FOUR — INTEGRATION
Figure 4-5: Process maturity levels [26]
Taking all factors into account, logical points of intervention exist as indicated in
Figure 4-6. During the life of the project one or more of these interventions can
be formally conducted.
Logical point 1: as final step of the initiation.
Logical point 2: as final step of the potential phase.
Logical point 3: as final step of the pre-feasibility phase.
Logical point 4: as final step of the feasibility phase.
At the logical point 4, the need for a value engineering intervention (value
engineering initiation study) has to be assessed before the project is presented to
the board for approval.
Figure 4-6: Logical points for a value engineering intervention
- 73 -

PART FOUR — INTEGRATION
4.4 Integration with project management
This paragraph discusses the integration of value engineering with the project
management philosophy used by Iscor. [28] This philosophy comprises four
basic steps as illustrated in Figure 4-7.
Figure 4-7• Project Management steps.
Project Project Project initiation planning execution
Project closing
In theory these project management steps are applied during each of the phases
illustrated in Figure 4-6 (for example after a business is initiated)
A project is initiated and approval to conduct a potential study is obtained;
this potential study is planned in detail;
the project is executed according to the plan; and
finally the project is closed with a possible proposal to proceed with the next
step. In this case a pre-feasibility study could again be initiated.
Hence, these four steps will be followed to complete a:
potential study;
pre-feasibility study;
feasibility study; and
implementation of the business.
4.4.1 Integration of the intervention
Applying the rules discussed in paragraph 4.3.4 (Logical intervention points)
value engineering intervention has to be introduced as part of the project closing,
as the final step of each phase: potential, pre-feasibility and feasibility study. In
practice this would mean that a value engineering initiation study (discussed in
part three) has to become part of the project management closing procedure. (the
- 74 -

PART FOUR — INTEG ATION
fourth step of the process illustrated in Figure 4-7) Depending on the outcome
of this study appropriate re-engineering would then follow.
4.4.2 ffntegration of 'do it right the first time'
As discussed earlier, value engineering should also become an integral part of
the design process. In practice this implies that 'establishing of a value culture'
has to become part of the project initiation step and that 'measuring of value' has
to become part of a supporting process for the planning and execution of project
management steps. (paragraph 4.2.1, Do it right the first time)
4.5 Organising for Value Engineering
The organisation and the required training for value engineering are discussed in
this paragraph.
The staffing of the project should be done to have somebody to:
take responsibility for the required functions; (ownership)
ensure a value focus (value champion); and
ensure, where appropriate, that the required process is followed (value
engineering methodology champion).
The organisation requirements for: The value engineering initiation study is
illustrated in Figure 4-8; the intervention exercise is illustrated in Figure 4-9; and
conducting a project with value engineering principles is illustrated in Figure 4-
10.
Figure 4-8: Value Engineering initiation study organisation
Management team
(
Project team
Certified Value Engineer
- 75 -

Steering committee
Demand and direction
Manage improvement
• Value engineering process support
Unit leaders (value engineer facilitators)
Tracking & scorekeeping
Facilitate & evaluate Track & communicate progress improvement in unit against target
Improvement project manager
(
Certified Value Engineer
1
Project manager
Project Steering committee
Unit leaders
Value guardian
PART FOUR — INTEGRATION
Figure 4-9: Value Engineering Intervention organisation
Figure 4-10: Project team adjusted for value engineering
4.5.1 Training of value engineers
Capturing the maximum value for Iscor on the various growth projects, requires
skilled personnel. These skilled people should combine insight with knowledge
of the theory, for which this document can form the basis. These skills are only
complete and useful once they are honed by practice.
Paragraph 4.5.1 discusses the establishment of these skills within Iscor in terms
of
The phased approach to transfer of skills;
certification of the acquired and developed skills; and
a training program.
- 76 -

Project team members role in
The role of value engineering value engineering
consultants
Phase I
Establish and train a core team
Deploy on available projects
Phase 2
Transfer skills to project
teams
Formal training of project
members
Phase 3
Maintain a core team (value
engineering center of excellence)
A T FOUR — ONTEG ATION
A Transfer of skills
A phased approach is proposed to firstly establish these skills in a core team and
secondly to transfer these skills with training and experience on projects until
team members are capable of running improvement initiatives with limited help.
(see Figure 4-11)
The phased approach is based on the principle that a core team is trained and
deployed with the following three goals in mind:
Capture value on the growth projects;
add value to the current value engineering methodology; and
transfer the skills to the wider Iscor.
The last phase would require a small team to form and maintain a centre of
excellence for value engineering.
Figure 4-11: Skill transfer to project teams
B Certification
To measure and manage the skill base, a certification system is to be used. The
team members will be certified according to their value engineering capabilities
as illustrated in Figure 4-12. Formal value engineering training, applicable
practical exposure and certain key people management skills will be required for
certification.
- 77 -

Capable of maintaining the methodology and coaching/training of certified value engineers....
Setup and manage an improvement project...
value engineer consultant
certified value engineer
value engineer facilitator
Facilitate on an improvement project....
PA F T FOUR — INTEGRATION
Figure 4-12: Certification system
Training A training program should consist of theoretical training and the practical
application thereof. Since the success of an exercise is based on team work and
human behavior the personality characteristics of the value engineer is of great
importance.
Table 4-1 illustrates a typical training program for the three levels of
certification.
Table 4-1: Training program
4.10e o7gifieerino:
,..'09iligl*t
Cety I v .ext ip t.
alue', steer oijicator
opna retliodatoik: X X X
' ''P'. aAge;113.4401en X X X X X
lilydel*Oiri,C,'
.,, a0.eiat: in . ici:e.IS , •
X X
'f4eklitafjont, X X X Projcdt management X X
Ot,1001Y
@
IFI4pilifliW 't4100; engindeijng...e*roise
X X X
6Ortifild
aitiiiiiti4 o ' stu- -7
X X
Sc4ieekefetiiri -gi& reporting . '. '
X X X
Interpretaiiod5of ; #4.atici0 iiO4:4 .
X X
,Perscitialitjt . , Ocii4i..0010040., ,
Team 1)140 ::‘ X X X Coach X Driver 1 X X . c*Itived iitiei riiund X X X
70:011$00:00: X X X
- 78 -

ART FOUL — INTEGRATION
4.6 Conclusion
Where Part two and Part three have focused on introducing and explaining value
engineering as a possible solution to the dilemmas described in Part one, Part
four has described when and how to institute the principles in a corporation such
as Iscor, Mining.
- 79 -

Part one
INTRODUCTION why value engineering is
required by growing
Companies ?
Part two
FUNDAMENTALS what is value 7
what is improvement ? what is value engineering ?
art three
MASTER PLAN Understanding the business Case for change
Target Analysis, design. implementation //
Part Four
INTEGRATION integrating value engineering with the Imp process lie !bran organisation responsibilities
Why ?
What ? How ?
When/ Who ? Final remarks
5-- Part Rive e aosure
" We look at it and we do not see it"
Lao-tzu, 6th century B.0
5.1 Objective
As a closure to this dissertation, Part Five provides a summary of the most
significant conclusions.
Figure 5- 1: Part Five, Closure
The closure is discussed in terms of:
An overview of the dissertation;
the contribution of the dissertation; and
possible future research.
- 80 -

PART FIVE— CLOSURE
5.2 Overview
Case studies indicated that projects seldom realize their full potential and that
projects often under perform in terms of value. Two case studies within Iscor
and [17,18] five case studies from McKinsey [7] indicate that the potential exists
to improve.
Value Engineering proves to be a suitable vehicle capable of capturing otherwise
hidden opportunities. Value Engineering can be introduced as an intervention
on the 'standard' capital project, radically improving the already designed
project or becoming an integral part of the process with the aim to design it
optimally from the start. In theory the more the latter is used the less the first
will be required.
Value Engineering consists of three steps: analysis, design and implementation.
The initiation phase sets the stage for these steps by defining a case for change,
sets a target and obtains a clear understanding of the project.
Due to the potential value of a value engineering exercise, it should be
introduced on all capital projects. The timing and place where it is introduced
within the current capital project processes are of importance.
5.3 Contribution
This dissertation has firstly illustrated the dilemmas with capital projects based
on the case studies and proposed value engineering as a possible solution.
Economic evaluation has been proposed as a means of measuring improvement.
The fundamentals and factors required for success have been defined based on
experience and theory. Lastly, the implementation of this process within a
corporation, using Iscor as an example, has been discussed.
- 81 -

PART FIVE — CLOSURE
5.4 Future research
According to Moll [26] function and cost as illustrated in Figure 5-2 can define
the value of a project or business. The value drivers can therefor be described as:
Volume;
quality;
flexibility;
expenditure;
waste; and
risk.
A number of theories and methodologies that address different aspects of these
value drivers exist, as illustrated in Figure 5-3 [22]. Consultants and managers
often choose one or two from this list and use it as a technique to solve all
problems.
Research to understand the different methodologies and when it should be used
or could be combined to address the specific needs of a business or project,
could be of value.
- 82 -

FUNCTIONAL PERFORMANCE
VALUE COST
F(QUALITY; VOLUME; FLEXIBILITY)
F(EXPENDITURE; RISK; WASTE)
QUALITY VOLUME FLEXIBILITY
EXPENDITURE RISK WASTE
P T FIVE — CLOSURE
Figure 5-2: Value drivers
Figure 5-3: Methodologies and business drivers
Quality Volume IFIertImfity •••.1NArperbliture Vaste
Tralue, EngineeriUg Ousiness P.rocess Re- engineering
x
;Iiheory . of constraints
x x
-Risk , management •
x
dotal Quality Management .;
x
Just in time , x x x
Lean production
x x
- 83 -

REFERENCES
References
1 ARHUR E, 1986, Value Engineering, Systematic Approach, William L. Kelley, Washington
2 BLANCHARD BS, 1991, System Engineering Management, John Wiley & Sons Inc.
3 BLANCHARD BS, 1992, Logistics Engineering and Management, Prentice-Hall.
4 BOSMAN S, KRUGER PS, Markovian Modeling in business risk analysis, South African journal of industrial engineering Vol 1, November 1998
5 BOSMAN S, 1998, A framework for managing risk in a changing business, Unpublished Ph.D.- thesis, University of Pretoria, South Africa.
6 ISCOR MINING, Business Engineering Experience, Consulting Services, Old Mutual Building, Hendrik Verwoerd drive, Centurion
7 CARTER J, VAN DIJK M, GIBSON K, Capital investments: How not to build the Titanic, McKinsey Quarterly Volume 4 September 1996
8 CARTER J, 1996 November, Presentation on Clean Sheet Capital Redesign, Unpublished
9 Continuous Improvement documentation, 1998 February, Performance of capital projects, Kloofsigpark, Centurion
10 COOPER DR, SCHINDER PS, 1998, Business research methods, McGraw-hill
11 COPELAND T, 1996, Valuation — Measuring and managing the Value of Companies, McKinsey & Company Inc. John Wiley & Sons.
12 DE BONO E, 1990, Lateral Thinking, Penguin books
13 ELS FC, 1999, Business Analysis documentation, Consulting Services, Old Mutual Building, Hendrik Verwoerd drive, Centurion
14 FOWLER FG, 1978, Pocket Oxford Dictionary, Sixth edition. Oxford University Press.
-84-

REFE ENCES
15 GOSS T, PASCALE R, 1993, The reinvention roller-coaster. Risking the present for a powerful future, Harvard Business Review November -November — December 1993
16 HALL J, 1996, The Competence Connection, The Woodlands, Texas
17 Iscor Heavy Minerals project documentation, Old Mutual Building, Hendrik Verwoerd drive, Centurion.
18 Kamoto project documentation, Old Mutual Building, Hendrik Verwoerd drive, Centurion.
19 KINNAN M, MARTIN JS, But we already do it, and other misunderstandings, Save International Conference Proceeding, May 1997
20 MAKRIDAKIS S. 1983. Forecasting, methods and applications/ 2" d ed, John Wiley & Sons Inc.
21 MARTIN JS, What's the difference?, Save International Conference Proceeding, May 1997
22 MELNYK SA, 1996. Operational management: A value driven approach, D. Irwin.
23 MILLER I, FREUND JE, 1985, Probability and statistics for Engineers, Prentice-Hall
24 MILES FOUNDATION, www. miles foundation. corn
25 MOLL CM, KRUGER PS, Using the business engineering approach in the development of a strategic management process for a large corporation: A Case Study, South African journal of industrial engineering Vol. 1, November 1998
26 MOLL CM, 1998, An Engineering approach to Business Transformation. Unpublished Ph.D.-thesis. University of Pretoria
27 NICHOLAS JM, 1990, Managing Business & Engineering Projects, Prentice-Hall
28 PMBOK, 1998, Project Management Body of Knowledge, Consulting Services, Old Mutual Building, Hendrik Verwoerd drive, Centurion
29 ISCOR MINING, Project management Consulting Services, Old Mutual Building, Hendrik Verwoerd drive, Centurion
30 RONALD EW, 1982, Introduction to statistics, Prentice-Hall
- 85 -

REFERENCES
31 SAMI, Introduction to value engineering, www. value -engineering. corn
32 STEPHEN J, KIRK AJ, 1995, Life Cycle Costing for Design Professionals, McGraw-Hill
33 STRINGER RA, Fundamentals workshop, VM Services (Pty) Ltd,4 Portman Place, Bryanston.
34 UDOT, Utah department of transport, www.utah.corn "-N
35 UNITED STATES LAW, General Federal Law requiring VE Applications, Public Law 104-106, National Defense Authorization Act For Fiscal Year 1996, Sec 36, Value Engineering, United Sates of America
36 VAN ZYL, 1999, Value Engineering Kamoto, Old Mutual Building, Hendrik Verwoerd drive, Centurion.
37 VENTER E, MOLL CM, 1997 December, Business case review, Hope Downs, Old Mutual Building, Hendrik Verwoerd drive, Centurion.
38 WILLIAM LK, 1986, You and Value Whatnot, William L. Kelley, Washington
39 YIN RK, 1989, Case Study Research, SAGE Publications Inc., London
40 FUREY TR, A Six-step Guide to Process Reengineering, Planning Review March April 1993
41 MAGEE B, 1998, The story of Philosophy, Dorling Kindersley Limited, London
7
- 86 -

APPENDDX A
Function analysis
111 Introduction
Functional analysis is discussed as a technique for understanding the core reasons for
procedures or components, finding better alternatives and improving fitness for purpose
in doing so.
An item or service is purchased because it will provide a certain function at an acceptable
cost. If it does not perform the intended function, it is of no use. Value can therefore not
be improved by reducing the cost of such an item. On the other hand, functions beyond
those that are needed are of little or no value to the user. Function analyses are used to
determine the functions that are required and helps to improve the required functionality
and to reduce the cost and unwanted functions [33].
It indicates possible low value areas for possible focus and helps to understand the
dynamics and purpose of items.
Function analysis is the identification and describing of functions followed by a number
of possible manipulations of these functions in order to achieve the required answer.
This appendix describes function analysis in terms of: (see Figure 1) [33,34,38]
Function identification;
FAST technique;
numerical method;
redundancy analysis; and
cost to function analysis.
- A 1 -

Function identification
FAST technique
Numeral [method
Redundancy
Lanalysis
relation & sequence
order of importance
redundant functions
Cost to function function value analysis
APPENIDOX A
Figure 1: Function analysis process
A.2 Identify fui ctions
The definition of functions should answer the two questions: "What does it do?" and
"On what is it doing it?" [34]
The description of a function should be clear and simple. Normally only two words, a
verb and a noun should be used to describe the function. The verb describes the action
that is required. (the verb could be: generate, support, control, restrain, pump, transmit
etc) The noun describes what is acted upon. (the noun could be: ore, waste, electricity,
temperature, force etc) This simple description of the functions is required to ensure
consistency and to avoid the combination of different functions. The real function should
be described and care must be taken not to describe the solution. The function of the bell
of an alarm could for example be to notify somebody and not to make a noise [33].
Functions can be defined on different levels. The function of an alarm can be to notify in
the case of an intrusion, while the lower level functions of the same alarm are to detect an
intruder and to make a noise. The higher level function of the alarm is then to protect
property. The rule of function analysis is to start at the highest function and the work
down to the lower functions [33].
Once the functions are defined they can be classified according to the following:
o Work or sell functions; and
o Basic or secondary functions.
- A 2 -
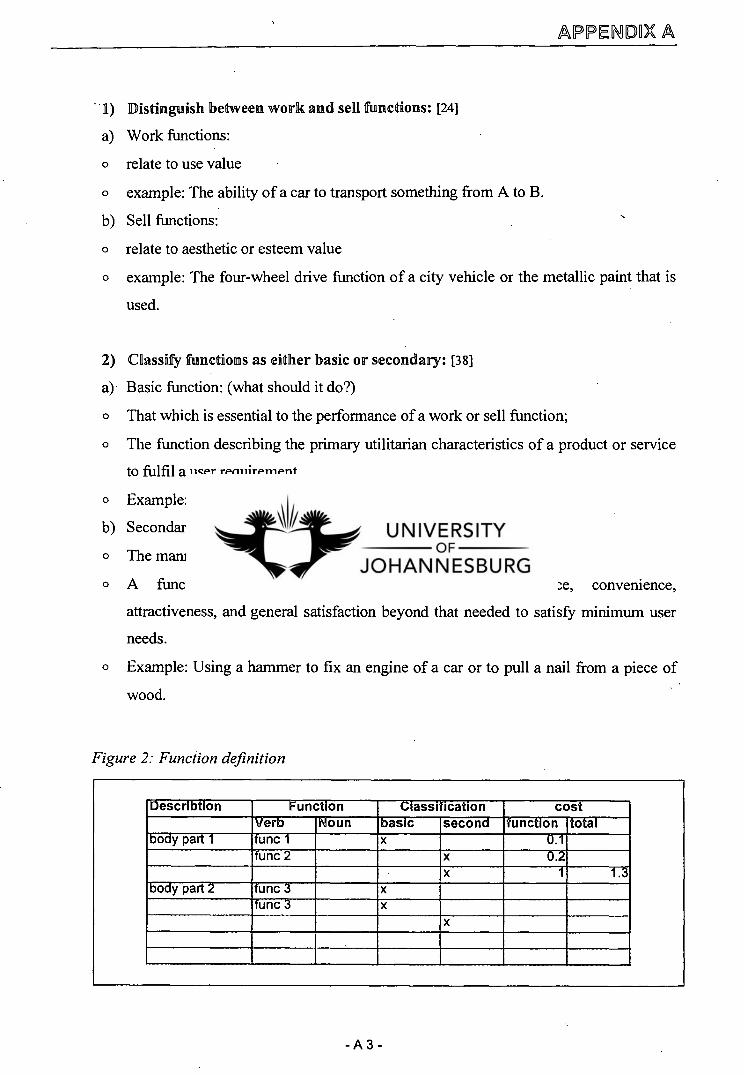
APPENDOX A
- 1) Distinguish between work and sell functions: [24]
a) Work functions:
relate to use value
example: The ability of a car to transport something from A to B.
b) Sell functions:
relate to aesthetic or esteem value
example: The four-wheel drive function of a city vehicle or the metallic paint that is
used.
2) Classify functions as either basic or secondary: [38]
a) Basic function: (what should it do?)
That which is essential to the performance of a work or sell function;
The function describing the primary utilitarian characteristics of a product or service
to fulfil a user requirement.
Example: Using a hammer to drive nails into a piece of wood.
b) Secondary function: (what else can it do?)
The manner in which the basic function was implemented;
A function indicating quality, dependability, performance, convenience,
attractiveness, and general satisfaction beyond that needed to satisfy minimum user
needs.
Example: Using a hammer to fix an engine of a car or to pull a nail from a piece of
wood.
Figure 2: Function definition
Describtion Function Classification cost Verb Noun basic second function total
body part 1 funs 1 x 0.1 func 2 x 0.2
x 1 1.3 body part 2 func 3 x
iunc 3 x
- A 3 -

APPENDIX A
A.3 Develop a FAST diagram
A technique called Function Analysis System Technique (FAST) was developed in 1964
to analyze and understand functions in dept. [3 1]
A FAST diagram can be compiled from documentation, but best results and
understanding are achieved when it is drawn up during a work session.
Determining what the team regards as the most general function starts the process. To
extend the diagram to the left the question 'Why?' is asked, the answer obtained is the
higher level function. Similarly the question 'How?' is asked to extend the diagram to
the right and obtain the lower level function. (See Figure 3)
"When we ask 'How' we are looking for solutions and moving to lower levels of
opportunity. When we ask 'Why' we are looking for reasons and moving to higher levels
of opportunity" Bytheway [31].
Figure 3: Directions in a FAST model
A.3.1 Nu
ericali method! 1:1
This technique was developed by Arthur E. Mudge to manage divergence in opinions
and is used to ensure focus on the important function [O.
- A 4 -

A
B
C
D
A is more important than
B and the difference
is major
, .11 D
Key 1 = minor difference 2 = medium difference 3 = major difference
Total
Total
Total
Total A
B
C
D
C
APPEND DC A
This method compares each function to all of the other functions determining the ranking
according to importance in doing so.
The following four steps explain this procedure: (see Figure 4)
Step 1: List functions in a matrix (eight to sixteen appear to be optimum)
Step 2: Compare importance and assign a weight according to the key to indicate the
magnitude of the difference.
Step 3: Add the score for each of the functions.
Figure 4: Numeral evaluation matrix
The findings of this technique are used to indicate order of importance for possible focus
points and to help differentiate between basic and secondary functions. The findings of
this technique can be graphically presented as indicated in Figure 5.
- A 5 -

APPERIMIX A
Figure 5: Presenting numeric evaluation
A.3.2 Redundancy analysis
This technique was developed by Frank Knox in 1965 to determine areas in which
redundant or duplicate functions occur, with the aim to reduce cost for the same
functionality and quality. [24]
After the functions has been identified and classified the following three steps are
followed:
Step 1: List the verbs and nouns onto a worksheet without duplication;
Step 2: List all the body parts onto worksheet using a unique reference index for each
part;
Step 3: Determine the areas of function duplication, by noting intersections with a high
level of symbol occurrence;
Step 4: Take a creative look at how to reduce the duplication.
-A6-

verb
noun cost 1 5 6
Function description verb + noun
a ,b
d Body parts
1
e f
g
APPENDDC A
Figure 6: Redundancy analysis
A.3.3 Cost to function analysis
The cost to function analysis is done to identify the high cost functions with the basic or
priority of the functions. [33]
After the function has been identified and classified the following 4 steps are followed:
Step 1: Determine cost of components (full life cycle cost);
Step 2: Allocate cost to functions;
Step 3: Determine total cost per function (all components);
Step 4: Investigate/interpret the relationships between cost and function;
- A 7 -

APPENDM
Idea Eva l uation
B.1 Introduction
Ideas are evaluated to answer the following two questions:
'Is it going to work technically ?'; and
'Is it worth doing?'
A highly motivated team having Ownership of the targets will evaluate the idea
rigorously, not accepting too easily that it is technical not feasible. This is very
important, since the truly great ideas often have a number of roadblocks where the
solution is not obvious. The truly motivated team will focus on the possible benefit of
the idea, using the size of the benefit in overcoming the roadblocks. It is therefore
advisable to calculate the possible benefits before the technical aspects are addressed. [15
& 16] The logic of this approach is that, should an idea be worth ten million rand, it
would be possible to overcome many technical problems that would have been insoluble
for an idea for which the benefit would be less than one million rand.
There is however one disadvantage of a highly motivated team that has to be guarded
against. Group-think and over-motivation could result in unfeasible ideas being found
feasible. It is therefore important that ideas are critically reviewed by a capable person,
possibly outside the group. The certified value engineer has a major role to play in this
aspect. [38]
The following aspects have to be addressed during the evaluation: [36]
a) Value:
calculate change in capital;
calculate change in operating cost;
calculate change in working capital;
calculate change in tax; and
calculate change in net value.
- B 1 -

APPENDIEX
b) Technical:
determine the reasons for the previous design;
what is the new design; and
what is the difference in technical terms;
c) Risk:
the risks of the old design; and
the risks of the new design.
d) Schedule:
how is it affecting the schedule;
Communication and a formal acceptance of the idea are required. The last step before the
improvement can be claimed is therefore the formal sign-off by the steering committee of
the improvement initiative and all the managers that were involved.
This appendix discuss idea evaluation by means of providing: [36]
An example of the typical idea evaluation form that can be used to communicate the
results and obtain approval; (paragraph B.2)
A typical spreadsheet that can be used to evaluate the positives and negatives of an
idea; (paragraph B.3) and
A spreadsheet used to estimate the net present value of cash stream without a detailed
model. (paragraph B.4)
-B2-

au-A-.424A-C714:4,6
APPENDEX
B.2 Idea capturing form, Example
Project name enptulliting from
VE 1 Rev. 0
Unit Idea No. Idea owner Plant 01 Name
SUMMARY OF IDEA (ATTACH SUPPORTING DOCUMENTATION) TITLE: EXPERT SYSTEM ON FLOTATION CIRCUIT AND CORRESPONDING CHANGES IN GRADE AND RECOVERY
CURRENT SITUATION: Regrind mill, secondary mills and extra flotation cells installed, but the expert system does not cover the flotation circuit. This leads to inefficient operation, which means that optimal grades and recoveries cannot be achieved.
REASON FOR CHANGE: With better control in the flotation circuit, recoveries will be increased. This allows an optimal recovery-grade ratio to be achieved, which will have a positive effect on the NPV of the expansion project.
NEW SOLUTION: By installing an expert system on the flotation circuit, the required level of control will be achieved.
BENEFITS: The optimal grade and recoveries will be achieved. This will result in more metal tonnes being produced with the same volume of ore. Producing a Zn grade of 55.5% reduces the risk of not achieving a Zn grade of 57%.
CAPEX (NPV): 8459,000 extra capital expense (R500,000 + 5.5% tax in 98/99 values to be installed in 99/2000)
OPEX (NPV): R7.423M extra operational expenses (including working capital and royalties) due to higher metal tonnes.
REVENUE (NPV): 818.042 million
TAX IMPLICATION (NPV): R5.984M extra tax due to higher revenue
RESULTING VALUE OF IDEA (NPV): R4.175 million RISK ASSESSMENT AND CONCERNS Rating Ili M L Previously proposed Zn grade of 57% seems hard to achieve. This idea lowers that risk considerably. Recovery of 87% is at low risk and seems very achievable
Low Low
SYNDICATION COMMENTS ADVICE: GO/STUDY/NO Manager Plant Unit leader: Plant Project leader VE financial modeller Mine Manager
PROJECT TEAM APPROVE REJECT
STEERING COMMITTEE APPROVE REJECT
- B 3 -

Revenue
Expenditure
Penalties 0
Treatment charges -25,808
Transport -6,624
Revenue tonnes 43,849
Ore deposit 0
Ore extraction 0
Feed grade 0
Volume 0
Higher recoveries 43,849
Revenue Price/grade
Operating cost
-32,432
Overheads -opex 0
Royalties -opex -358
Mine -opex 0
Plant -opex 0
Working capital -441
Expert system -460
0
-4601
0
1741
50000
40000
30000
20000
10000 -
Higher Treatment Transport Royalties - Working recoveries charges opex capital
Expert Extra tax Benefit system
Extra tax -5,984
APPENDRX
B.3 Idea impact analysis, Example
VE2 Idea 01 Idea value impact analysis Susifiess driver tqPv moo
Net value implication
Capital
Tax -5,984
-B4-

Net cash flow o 1
Real discount rate
10% Effective tax rate
0% 0% 0% 0% 0%
0% 0%
0%
APPENDIX
.4 Net Present Value Estimator
Present
1997198 1998/99 1999/00 2000/01 2001/02 2002/03 2003104 2004/05 value
1
2
3
4
5
8
7
8 Revenue
folia7"- „ Operating contribution :apical, • .• • Tax
Enter numbers as real numbers Enter savings as negative values Enter incremental costs as positive values
- B 5 -