Valuing the Queensland Museum/media/Documents/QM/About+Us/Corporate... · Total 800 1,174 100%...
36
Valuing the Queensland Museum A Contingent Valuation Study 2008
Transcript of Valuing the Queensland Museum/media/Documents/QM/About+Us/Corporate... · Total 800 1,174 100%...

Valuing the Queensland Museum
A Contingent Valuation Study 2008

Aim
• Public value of QM
• Valid and reliable methodology
• Process applicable to wider arts and cultural industry

Changing value of arts/museums
• Pre 1970 - arts for arts sake
• 1980s - economic benefits
• 1990s - social benefits
• 2000s - public good- creative/knowledge economy

Values
Institutional
cultural institutions & processes – create public trust, safe places & sociability
Intrinsic ‘enrich people’s lives’ – subjective intellectual, emotional & spiritual experiences
Instrumental
economic and social outcomes ‘knock-on’effects

Stakeholders
Professionals (arts/cultural industries)
Politicians& Policy Makers
Public (authorising environment)

Value matrixIntrinsic Instrumental Institutional
Public x x
Professionals x x
Politicians/ Policy makers
x
What to measure?Economic Values Cultural & Social Values
• Some market goods
• some $ value
• Non market goods
• No direct $ value

Economic value
Use value
Existence Option Bequest
Non use value
Directconsumption benefits

• Social
• Aesthetic• Spiritual • Historical• Symbolic • Authenticity
Cultural values:

Contingent Valuation Study
• Places an economic value on a public/cultural good
• Users and non-users• Hypothetical scenario• Willingness to pay – WTP• Economic modelling
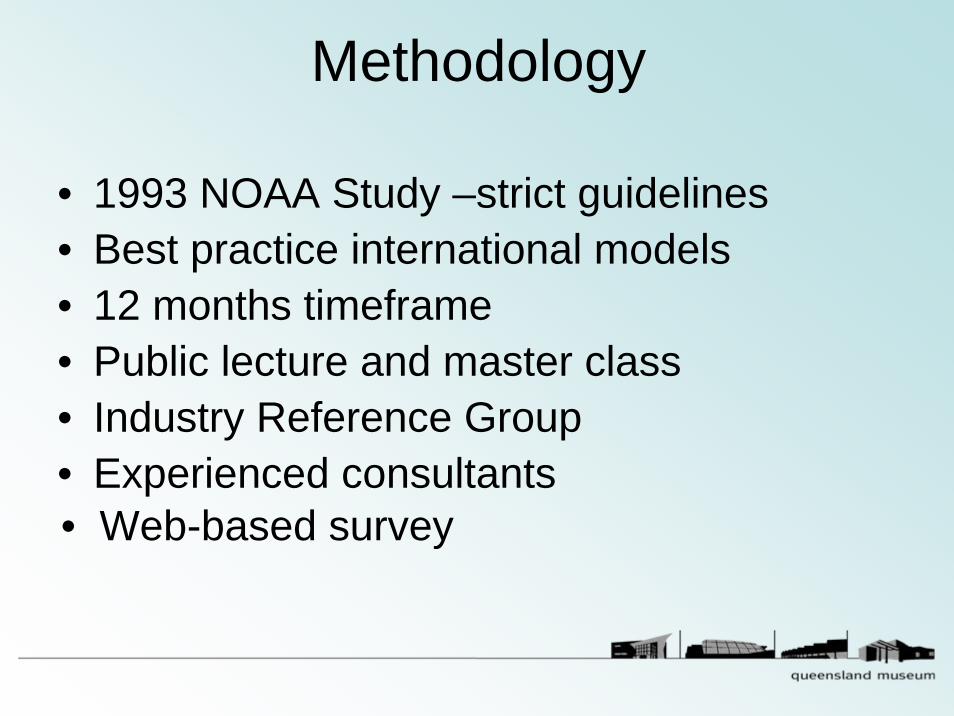
Methodology
• 1993 NOAA Study –strict guidelines• Best practice international models• 12 months timeframe• Public lecture and master class• Industry Reference Group• Experienced consultants• Web-based survey

Survey instrument• Leisure activities including museum visitation (1-2)• Attitudes to QM - campuses (3-16)
- products & services (17-23)• Setting the scenarios & qualitative benefits of QM (24)• WTP using 2 scenarios
- ongoing WTP for existing products & services (25-29)- one-off WTP for enhancements (30-34)
• Demographic and general attitudes & interests (35-44)

Survey sampleSample size/ geographical spread
Proposed Sample
Obtained sample
Obtained sample
(%)
Population %
Brisbane/Ipswich 300 545 46% 43%
Toowoomba 150 126 11% 3%
Townsville 200 208 18% 3%
Rest of Queensland 150 295 25% 51%
Total 800 1,174 100% 100%

Users and non-usersUsers and non-users of museums
TotalUnweighted scores
TotalWeighted scores
In the last 6 months 34% 36%
6 months to a year 22% 22%
More than a year ago 35% 33%
Never 6% 6%
Don’t know 3% 3%
Total 1,174 1,162

Interest in museumsInterest in museums in general CV CV
Weighted
I keep an eye out for special activities at museums and go when they interest me
50% 51%
I go generally to see what is there; I don’t go to see special exhibits or activities
26% 27%
I am not really interested in museums and I don’t go very often at all
24% 22%
Sample size 1,174 1,162

Awareness of QM campusesAwareness of QM
campuses QMSB Cobb+Co Museum TWRM MTQ
Know a lot about it 24% 6% 9% 9%
Know a little about it 53% 21% 35% 17%
Only know the name 18% 31% 32% 23%
Never heard of it 4% 40% 22% 49%
Not sure 1% 2% 1% 2%

Awareness by regionsAwareness of C+C Museum Total Brisbane
& Ipswich T’mba T’ville Rest of QLD
Know a lot about it 8% 4% 42% 0% 5%
Know a little about it 20% 21% 47% 6% 19%
Only know the name 30% 35% 11% 29% 29%
Never heard of it 40% 38% 0% 60% 45%
Not sure 2% 2% 0% 4% 2%
Total 1,174 545 126 208 295
Responses to museum visits
• Purpose of visits -7
• Personal and emotional responses -9
• Learning outcomes -9

Products and Services
• Web site• MDO Program• Scientific research• Publications• Inquiry Centre• Loans• Historic Research

Qualitative benefitsPerceptions of QM Strongly
Agree Agree Neither Disagree Strongly Disagree
Don’t Know
QM does important things for the people of Queensland 43% 49% 4% 0% 0% 3%
QM is not relevant to me and probably never will be 2% 9% 11% 45% 29% 4%
In the future, I might want to visit one of the museums or use one of QM’s services
35% 54% 6% 2% -% 3%
In years to come, people will think that QM achieved very little
3% 6% 13% 46% 27% 6%
I get personal benefit from things QM does 13% 37% 32% 10% 1% 7%
QM will leave an important legacy to future generations 48% 41% 6% 0% 0% 4%

Existing fundingWTP for existing QM services
Total Brisbane & Ipswich
T’mba T’ville Rest of QLD
Increasing the funds for QM 52% 53% 55% 58% 51%
Keeping the funds at the present level for QM 44% 43% 45% 40% 44%
Reducing the funds for QM 4% 3% 0% 2% 5%

How do you want to pay?
• Increase taxes - 39%
• Decrease other services – 61%
• Which services?• Health –hospital beds• Schools – classrooms• Roads – kms of new
roads• Tourism – marketing
campaigns• Prisons - beds

Why not increase funding?Reasons for not
increasing funds to QMTotal Brisbane &
IpswichT’mba T’ville Rest of
QLD
QM get enough funds at the moment 11% 6% 0% 13% 16%
I value QM but I personally cannot afford/do not want to pay more
24% 24% 12% 43% 23%
I value QM but other services are more important
40% 40% 60% 30% 39%
I don’t value QM enough to give it more funds 2% 3% 9% 3% 1%
I don’t know enough about it to decide 13% 11% 13% 8% 15%
Other 2% 3% 0% 2% 1%
No response 7% 12% 1% 1% 5%

Ballot 1 – increased WTP
Ballot 1 increased WTP Yes No No of respondents
Option A - an increase of $2 per adult per year 94% 6% 196
Option B - an increase of $4 per adult per year 82% 18% 209
Option C - an increase of $8 per adult per year 75% 25% 205
Total/overall result 84% 16% 610

WTP for recurrent fundingBallot 1 WTP for increased
recurrent funding Mean Lower Bound
Increased WTP for existing QM products and services $12.65 $8.23
Increase WTP ratio over currentfunding levels 2.9 2.3
Adult Population 3,176,068 3,176,068
Total Value of increased fundingbased on adult population $40 Million $26 Million
Dwellings/households 1,627,600 1,627,600
Total Value based on dwellings $21 Million $13 Million

WTP for additional servicesWTP for additional QM services
Total Brisbane & Ipswich
T’mba T’ville Rest of QLD
Increasing the funds for QM to provide more services
75% 78% 78% 80% 73%
Keeping the funds at the present level and not undertake new developments
21% 19% 22% 18% 22%
No response4% 3% 0% 2% 5%

Ballot 2- One-off levy for new developments
Ballot 2 WTP Yes No No of respondents
Option A - a one-off levy of $4 per adult 81% 19% 313
Option B - a one-off levy of $6 per adult 80% 20% 284
Option C – a one-off levy of $12 per adult 70% 30% 280
Total/overall result 77% 23% 877

WTP for new developmentsBallot 2 – one-off WTP for new QM developments Mean Lower
BoundEstimated one-off WTP values $16.43 $11.47
Adult Population 3,176,068 3,176,068
Total Value based on adult population $52 Million $36 Million
Dwellings/households 1,627,600 1,627,600
Total Value based on dwellings $27 Million $19 Million

Demographics -general attitudes and interests
• interest in museums generally 41% non users support increased funding59% frequent users
• recent visits 64% support across campuses for increased funding

Demographics -general attitudes and interests
• children in their household slightly less for preteen households at 46%
• different ages under 24s -37%; 45-55 -62%
• Gender males 56%, females 49%
• levels of education increased to 61% university
• work situations retired 60%, student 28%
• geographic locations consistent

Comments• 73 interesting survey – thank you for asking• Good for children and grandchildren• Alternative funding cut suggestions
• “I think museums do wonderful work …I have enjoyed special exhibitions at the Queensland Museum and thoroughly enjoyed my visit to Cobb+Co for research purposes. I don’t believe that everyone shares my positive view of museums however so I can’t agree with $12 per person tax.” (QM 2008 CVM Study respondent)

Validity measures• 1174 respondents reflect
demographic and geographic population
• Web survey 11.48 mins
• Easy to follow, interesting – 73 comments
• Clear nature of payment for increased funding
• Presented alternative choices and budget constraints
• Based on NOAA guidelines
• A pilot study
• External consultants and advisors
• Responses reflected economic theory
• Results comparable with international studies

Validity Measures
• Reflects the actual situation in Toowoomba
• Foundation raised $1.2million for NCF in Toowoomba community

Conclusion
• Calculate the public value of QM
• Valid and reliable methodology
• Process shared with the wider arts and cultural industry

Psychographic ProfilePsychological segment Previous 6
months6 to 12 months
More than 12 months Never
Practical and organised 26% 27% 40% 7%
Gregarious out & about 49% 22% 24% 5%
Individualistic out & about 37% 23% 35% 5%
Moderate & unhurried 37% 15% 28% 20%
Discerning & purposeful 42% 27% 27% 4%
Battlers 32% 15% 45% 8%
Conventional suburban 28% 17% 37% 18%
Self-contained, go with the flow 34% 26% 36% 4%
Social pleasure seekers 43% 25% 29% 3%

WTP by psychographic profilePsychological segment Increase
funds Keep as is Reduce funds
Practical and organised 60% 37% 3%
Gregarious out & about 44% 50% 6%
Individualistic out & about 52% 43% 5%
Moderate & unhurried 60% 32% 8%
Discerning & purposeful 59% 38% 3%
Battlers 49% 51% 0%
Conventional suburban 40% 53% 7%
Self-contained, go with the flow 62% 34% 4%
Social pleasure seekers 34% 66% 0%