
Valuing the Health Effects of Air Pollution from...
33
1 Valuing the Health Effects of Air Pollution from Agricultural Residue Burning Parmod Kumar 1 * and Surender Kumar 2 1 Institute for Social and Economic Change (ISEC), Nagarbhavi PO, Bangalore – 560072, India, Email: [email protected] 2 Department of Policy Studies, TERI University, 10, Intitutional Area, Vasant Kunj, New Delhi-110070, India, Email: [email protected] (*Corresponding author) Abstract This paper measures the value of health effects of air pollution for the Indian rural Punjab, where air pollution problem occurs from crop residue burning. Consumer choice model is used to get the monetary estimates of reduced air pollution level to the safe level. The paper uses data of 625 individuals collected from a household level survey conducted in three villages in Indian Punjab for 150 households. To obtain the monetary values, Tobit and Poisson models are used to estimate mitigation expenditure and workdays lost equations, respectively. Total annual welfare loss in terms of health damages due to air pollution caused by the burning of rice straw in rural Punjab amounts to 76 millions. If one also accounts for expenses on averting activities, productivity loss due to illness, monetary value of discomfort and utility and additional fertilizer, pesticides and irrigation, the losses would be much higher. Key Words: Air pollution, Residue burning, Mitigation expenditure, Workdays lost, Rural Punjab Jel Classification: Q510; Q520; Q530 Acknowledgement: This paper is part of a larger study, “Policy instruments to address air pollution issues in agriculture – Implications for Happy Seeder technology adoption in India. The project was funded by the Australian Council of International Agricultural Research (ACIAR).
-
Upload
phungthien -
Category
Documents
-
view
222 -
download
1
Transcript of Valuing the Health Effects of Air Pollution from...
1
Valuing the Health Effects of Air Pollution from Agricultural Residue Burning
Parmod Kumar1* and Surender Kumar2
1Institute for Social and Economic Change (ISEC), Nagarbhavi PO, Bangalore – 560072, India,
Email: [email protected]
2Department of Policy Studies, TERI University,
10, Intitutional Area, Vasant Kunj, New Delhi-110070, India,
Email: [email protected]
(*Corresponding author)
Abstract This paper measures the value of health effects of air pollution for the Indian rural Punjab, where air pollution problem occurs from crop residue burning. Consumer choice model is used to get the monetary estimates of reduced air pollution level to the safe level. The paper uses data of 625 individuals collected from a household level survey conducted in three villages in Indian Punjab for 150 households. To obtain the monetary values, Tobit and Poisson models are used to estimate mitigation expenditure and workdays lost equations, respectively. Total annual welfare loss in terms of health damages due to air pollution caused by the burning of rice straw in rural Punjab amounts to 76 millions. If one also accounts for expenses on averting activities, productivity loss due to illness, monetary value of discomfort and utility and additional fertilizer, pesticides and irrigation, the losses would be much higher. Key Words: Air pollution, Residue burning, Mitigation expenditure, Workdays lost, Rural Punjab Jel Classification: Q510; Q520; Q530 Acknowledgement: This paper is part of a larger study, “Policy instruments to address air pollution issues in agriculture – Implications for Happy Seeder technology adoption in India. The project was funded by the Australian Council of International Agricultural Research (ACIAR).

2
1 Introduction
Epidemiological studies show that the contamination of air quality increases adverse
health impacts (Ostro et al. 1995). Air pollution contributes to the respiratory diseases
like eye irritation, bronchitis, emphysema, asthma etc., which not only increases
individuals’ diseases mitigation expense but also affect their productivity at work. Most
of the studies valuing health impacts of air pollution remain confined to urban areas as air
pollution is considered mainly the problem of urban areas in developing countries.
Though health consequences from burning of agricultural residue are not fully
understood, relative short exposure may be more of a nuisance rather than a real health
hazard. Many of the components of agricultural smoke cause health problem under
certain conditions (Long et al, 1998). This paper attempts to measure the value of health
effects of air pollution for the rural Punjab, where air pollution problems happen from
crop residue burning.
The rice and wheat system (RWS) is one of the widely practiced cropping
systems in northern India. About 90-95 percent of the rice area is used under intensive
rice wheat system (RWS) in Punjab (Gadde et al. 2009). Widespread adoption of green
revolution technologies and high yielding variety of seeds increased both, crop as well as
crop residue. In the last few decades intensive mechanization of agriculture has been
occurring and combine1 harvesting is one such input, particularly in the RWS. Note that
in the RWS a short period of time is available between rice harvesting and wheat
plantation and any delay in planting adversely affects the wheat crop. This coupled with
combine harvesting compels the farmers to burn the residue to get rid of stubble left out
after the harvest. It is estimated that 22289 Gg of rice straw surplus is produced in India
each year out of which 13915 Gg is estimated to be burnt in the field. The two states
namely Punjab and Haryana alone contribute 48 percent of the total and are subject to
open field burning (Gadde et al. 2009). Burning of straw emits emission of trace gases
like CO2, CH4, CO, N2O, NOX, SO2 and large amount of particulates which cause adverse
1 The combine harvester, also called combine, is a machine that harvests grain crops. It combines into a single operation processes that previously required three separate operations, that is, reaping, binding and threshing.

3
impacts on human health. It is estimated that India annually emits 144719 Mg of total
particulate matter from open field burning of rice straw (Gadde et al. 2009).
There are many studies in developed countries that estimate the value of adverse
health effects of air pollution (Gerking and Linda1986, Dockery et al. 1993, Schwartz,
1993, Pope et al. 1995 etc). Similar evidences are available from India and other
developing countries (e.g., Cropper et al. 1997, Kumar and Rao 2001, Murty et al. 2003,
Gupta 2008, Chestnut et al. 1997, Alberini and Krupnick 2000). These studies used either
household health production model or damage function or cost of illness approaches to
estimate the monetary value of health damage caused due to ambient air pollution.
Cropper et al (1997) using dose-response model find that a 100-µg/m3 increase in
total suspended particulate matter (TSPM) leads to 2.3 percent increase in trauma deaths
in Delhi. Kumar and Rao (2001) estimated the household health production function
using data of working individuals of the residential complex of Panipat Thermal Power
Station in Haryana, India and find that individual willingness to pay varies between 12
to 53 per month for improving the air quality to WHO standards. Using a similar model,
Murty et al (2003) observed that a representative household gains about 2086 and 950
per annum due to reduced morbidity from reduction of air pollution to the safe level in
Delhi and Kolkata, respectively. Similarly, Gupta (2008) estimates aggregate benefits of
the magnitude of 225 million per year reducing air pollution to the safe level for the
city of Kanpur, India. Note that theses studies are restricted to measure the monetary
value of reducing urban air pollution to the safe level since air pollution has been
considered mainly the problem of urban areas. In the present study, we use a similar
consumer choice model to get the monetary estimates of reduced air pollution level to the
safe level for the rural Punjab.
We use data of 625 individuals collected from a household level survey conducted
in three villages, namely Dhanouri, Ajnoda Kalan and Simro of Patiala district of Punjab
for 150 households. To get the monetary values we estimate two equations: one with
mitigation expenditure and the other with workdays lost as dependent variables. Tobit
and Poisson models are found to be suitable for estimating mitigation expenditure and
workdays lost equations, respectively. We find that total annual welfare loss in terms of

4
health damages due to air pollution caused by the burning of rice straw in rural Punjab
amounts to 76 millions.
The paper is organized as follows: Section 2 presents the ambient air quality
levels in the study villages during the period when harvesting of rice takes place. Section
3 gives details of the design of the household survey and analyzes the households’
behavior. Section 4 presents some details of the agricultural output (productivity) among
the selected households and some health indicators. Section 5 describes the theoretical
model and estimation strategy. The results are discussed in Section 6 while last Section
concludes the Paper.
2 Ambient Air Quality Level in Study Area
In Punjab, it is common practice to openly burn agricultural residues in fields after
harvesting crops by mechanical harvesters. Central and State Pollution Control Boards
have been monitoring the ambient air quality for certain Indian cities for the last two
decades. Monitoring of ambient air quality in rural areas is very sporadic and purpose
specific. Given the severity of the problem, the Punjab Pollution Control Board (PPCB)
conducted air pollution monitoring in three villages of Patiala districts, namely Dhanouri,
Simro and Ajnoda Kalan during November 1-3, 2006. Patiala is one of the agriculturally
leading districts of Punjab which is rich in crops like rice and wheat. When monitoring
was done in these designated villages, it was ensured that some burning of rice straw was
happening in the fields of these villages. Monitoring stations for the sites were planned
keeping in view the metrological conditions and environmental settings in terms of
habited and non-habited areas and following parameters were monitored: metrological
parameters (temperature, humidity, wind speed and wind direction), particulate matters
(PM2.5, PM10, TSPM), gaseous pollutants (SO2, NOX, NH3, CO, Ozone, THC, TC and
BTX) and heavy metals.2
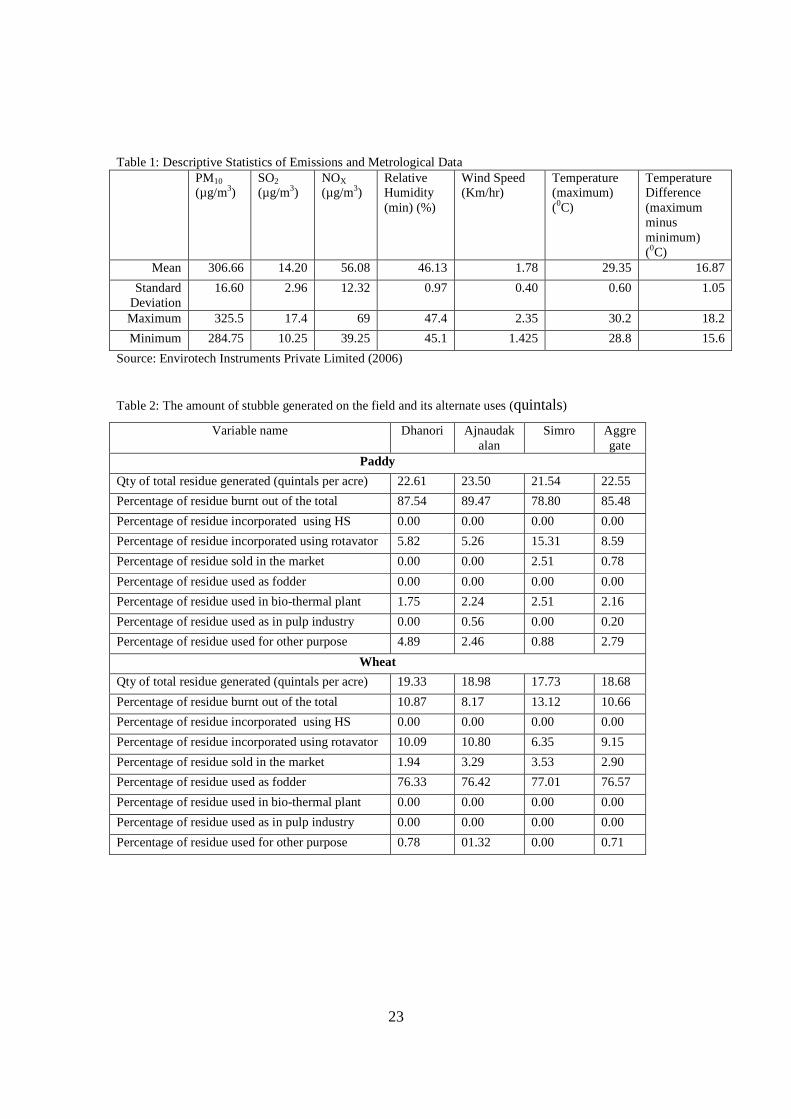
Descriptive statistics of some of the important pollutants and metrological
parameters is given in Table 1. The statistics shows that gaseous pollutants such as SO2
2 For details, please see the report prepared by Envirotech Instruments Private Limited (2006) on ‘Air Pollution Discharged from the Burning of Crop Residue in Agriculture Fields of Punjab’ for Punjab State Pollution Control Board.
5
and NOX were within the safe limits put under National Ambient Air Quality Standards
(NAAQS) and particulate matters either were measured in terms of SPM, PM10 or PM2.5
and they cross the limits set by the NAAQS3. In the study area all the particulates
followed same pattern in whatever terms they are measured. The hourly peak values
ranged between 300-350 and 24 hours average concentration ranged between 200-300
µg/m3. The ratio between peak and average values was found to be about 1.2, indicating
almost uniform concentration over the monitoring period. The contribution of the burning
to PM10 concentration appeared to be around 100-200 µg/m3. In all the three monitoring
sites, the difference in humidity and temperature levels was negligible and the wind speed
was found to be in the range of 0 -3.6 Km/hr. Low wind speed coupled with low wind
direction fluctuation implies that the impact of polluting activities remain confined to its
close vicinity.
3 Household Survey Design and Data
To measure the economic cost of pollution, we needed data on other socio-economic-
health indicators in addition to pollutant exited by paddy waste burning in the
environment. The health indicators during and after the period of burning, measures
adopted by people in the periphery to cope with the situation and other socio, agriculture,
income and expenditure parameters were not collected by the PPCB survey. In order to
further work on the economic cost, we resurveyed the same villages where PPCB
conducted its exercise of measuring air pollutant before and after the burning. This
exercise assumes that the findings of the PPCB exercise are still valid and no significant
change has occurred neither in the incidences of burning nor in the pollutant emitted into
the air by the exercise of burning in those areas.
Looking at some of the household and agricultural characteristics, the Nabha
Tehsil under Patiala District has a total population of 251326 with 75.33 percent of it
confined in the rural sector and 24.67 percent in the urban sector. Out of operated area
26,395 acres of land is under wheat and 28,359 acres of land is under rice crop in the
Nabha Tehsil . Data on the health status and socio-economic variables of households for
3 CPCB has defined the NAAQS implying the safe level of pollutants for residential, rural and other areas as follows: SO2 60 and 80, NOX 60 and 80 and PM10 60 and 100 µg/m3 as annual and 24 hours averages, respectively.

6
this exercise were collected through a household survey conducted for this study for the
above mentioned three villages in the month of May 2009 and is based on the recall
memory. Selection of households in the respective villages was based on stratified
random sampling.
The selection of villages was purposive as has been documented above. After
selecting the villages, a list of all households including those who were cultivators,
agricultural labourers and those who were working in the other formal or informal sectors
like regular government or private services, self business and pension holders was
worked out. Stratification was done for the cultivating households in terms of marginal
farmers (≤ 2.5 acres); small farmers (2.51 to 5.0 acres), medium farmers (5.01 to 10.0
acres) and large farmers (above 10.0 acres). The farmers were selected on the basis of
stratified random sampling method. From each village, approximately 10 farmers were
selected for each category. Thus, total 40 farmers were selected from each village and
120 farmers were selected from all the three villages. In addition to cultivating
households, a total number of 10 landless labourers were selected from every village.
Thus total 30 numbers of agricultural labourers were selected from all the three villages.
Therefore, the aggregate sample consists of a total number of 150 households surveyed
for this exercise.
The questionnaire used for the household survey had twelve sections seeking
detailed information on various aspects of inputs-outputs used by the farmers for
agricultural practices, disposal of crop residues and socio-economic characteristics.
Section 1 and 2 of the questionnaire provide information on individual household
members’ profile in terms of their age, education sex, occupation, marital status etc.
Section 3 deals with the information on end use of straw and health effects of the
burning. It gives information on the current health status of individuals, symptoms of
illnesses linked to air pollution exposure, averting and mitigation activities followed by
all the members in a household during the designated months when the rice straw burning
was happening. Sub-sections also provide information on whether a particular individual
is suffering from any chronic diseases. There was question also on the general awareness
of households about the illnesses that occur due to air pollution. Sections 4 to 7 seek
information regarding agriculture productivity, input usage, stubble management etc.

7
Section 8 and 9 provide information on medical expenditure and workdays lost during the
designated period of rice straw burning. The former section provides information on the
expenditure on formal medication such as fee paid to a doctor, expenses on the allopathic
medicines, cost of hospitalization etc., while the later section provides information on
expenditure incurred on informal medicines that Indian household generally take without
consulting any medical professional. Last two sections provide information on individual
habits and households assets. Information on the habits includes whether an individual is
habitual to smoking, alcohol drinking or/and taking any other toxicants and affect health
in general.
4 The Survey Results
4.1 The Household and Farming Characteristics
The phenomenon of adverse gender ratio whereby male members exceed female
members in Punjab is also reflected in our selected sample. Out of the total number of
households surveyed in our sample, the ratio of male to female was approximately 55 to
45 percent in all the three villages selected (Table A2). Population in working age out of
total population of all the surveyed households was 70 percent. About 28 percent of the
surveyed household members in the three villages were illiterate or educated up to
primary level only. The highest (64 percent) households were educated up to secondary
level while only 7 percent had higher education above secondary level. 67 percent
household members were self employed in farming while 14 percent were wage earners
and 11 percent were involved in formal or informal salaried work.
The average size of holdings was around 7 acres among the selected villages out
of which 5.4 acres were irrigated (Table A3). On an average, leased-in area was more
than leased-out area among the selected households, except in Ajnauda Kalan where
leased-out area exceeded leased-in area. The cropping intensity was around two crops in
a year among all the selected households. On an average, household assets valued at
Indian rupees 0.35 million that included ownership of tractor, submersible pumpset,
milch and non milching animals and animal house (Table A4). In addition to rice and
wheat grown during kharif and rabi seasons, some area was also devoted to green fodder
crops like jowar and bajra during the kharif season and barseem during the rabi season.
8
There were some miniscule examples of one or two farmers growing mustard (oilseed),
moong (pulse crop), sugarcane and maize. The input-output table is worked out for the
major crops of rice, wheat and green fodder (Table A5). Among these three crops, returns
were highest in wheat, followed by rice and green fodder while the latter was mostly
produced for domestic animals and the crop was not sold in the market. Irrigation, labour,
machine cost and plant protection were the major items of cost of production in rice and
wheat while seed was the second significant item in the case of green fodder. The net
returns per acre were around 14000 for rice and 16500 for wheat. However, while
calculating cost of production, we have not included the rental value of own land, interest
paid on fixed capital and depreciation value of implements and therefore value of net
returns is exaggerated.
4.2 Management of Stubble among the Selected Farmers
Table 2 presents the details of total amount of stubble (by-product) generated on the field,
its various uses and various alternatives adopted by the farmers to dispose of the stubble
for the two main crops of paddy and wheat. On an average, total amount of stubble
generated for paddy and wheat per acre was around 23 and 19 quintals, respectively. Out
of this in the case of paddy, more than 85 percent was burnt in the open field and less
than 10 percent was incorporated using rotavator4 while rest of 8 percent was used for
other purposes. In the case of wheat, 77 percent of the total amount was used as fodder
for animals while 9 percent was incorporated and around 11 percent was burnt. The
reason for burning high amount of paddy stubble in the open field was non availability of
any machine which can be used to collect the crop remains after the combine harvest.
Rotavator was used by around 10 percent of the households to incorporate rice remains
after combine harvest but it could be used only after partly or fully burning the field. On
the other hand, in the case of wheat, 90 percent of households used reaper driven by
tractor after combine harvest to collect the wheat remains that were used as fodder for
animals. Among the selected households, less than 7 percent in wheat and 2 percent in
paddy harvested manually to collect the stubble from the field. More than 80 percent
4 Rotavator, a rotary tiller also known as a rototiller, rotary hoe, power tiller, or rotary plough, is a motorised cultivator that works the soil by means of rotating tines or blades. Rotavator are either self-propelled or drawn as an attachment behind two or four-wheel tractor.

9
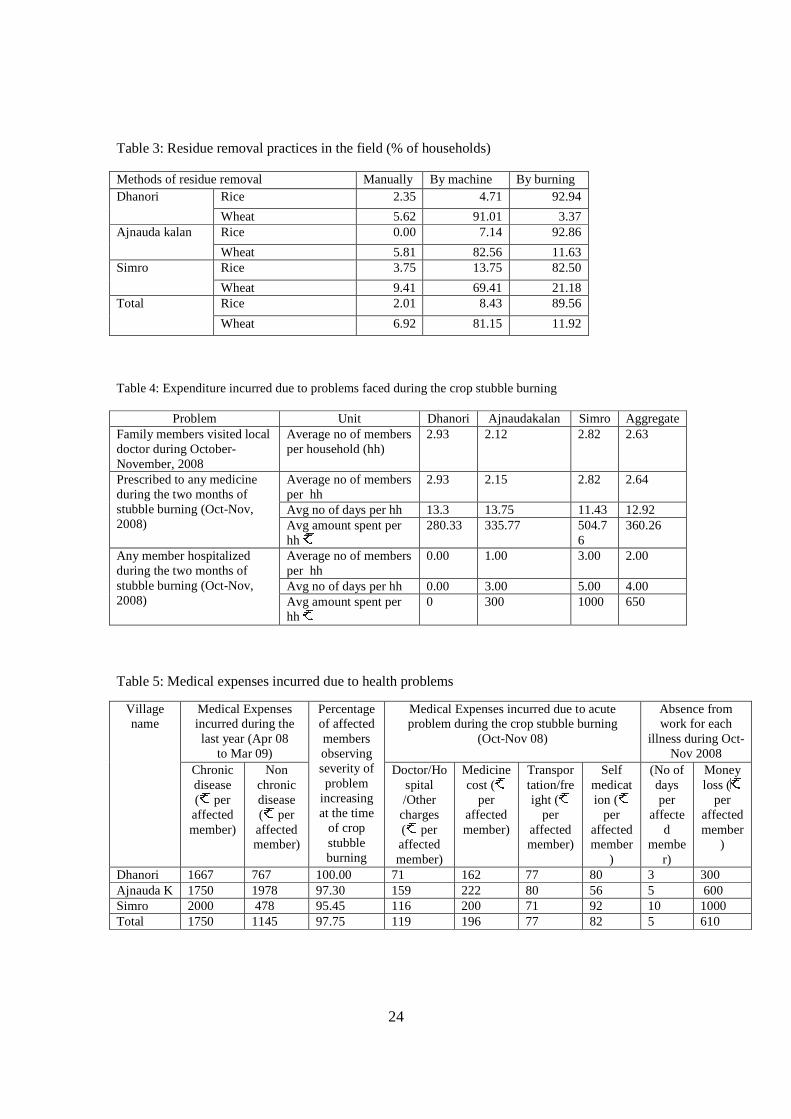
households in wheat used reaper to collect wheat residue to use it as fodder. In the case of
paddy, around 8 percent households indicated using machine (rotavator) to remove crop
remains from the field while around 90 percent households fully burnt the field to remove
the crop residue (Table 3).
Providing a reasoning why the majority of the households were burning rice
residue, around 41 percent households indicated that there was shortage of time period
between harvesting of paddy crop and sowing of wheat crop. A majority, 48 percent
indicated that burning was more economical and only around 8 percent opined that they
were indulging in burning because there was shortage of labour force for manual removal
of the residue (Table A6). Shortage of time in wheat sowing after harvest of paddy is
further confirmed from the survey data (Table A7). Among the households who burnt in
the open field the average time of sowing interval was 13 days while households who
incorporated stubble using rotavator/zero drill, the average interval was 15 days. The
average interval went up to 18 days among those households who used manual or other
methods of stubble removal. In the case of wheat, however, there was sufficient time of
46-48 days for removal of stubble before the transplantation of paddy putting no
additional compulsion on the farmers to burn the field for removal of crop residue.
According to 82 percent of the selected farmers, the easiest and quickest way of paddy
stubble removal was burning while 14 percent indicated incorporation using rotavator
(Table A8). Not only the majority of farmers were of the opinion that burning was the
quickest way of stubble removal but they were also convinced that this method of stubble
management was ensuing them the maximum crop yield (Table A9).
A few farmers who incorporated the stubble of paddy, they used either rotavator
or zero drill machines. The happy seeder5 machine was not yet adopted by any selected
farmers (Table A10). However, although farmers were convinced that burning was not
harming the level of crop yield but they pointed out that burning of field added extra cost
to the production because of top soil getting affected by the burning. Some of these
farmers observed changes in colour of the top soil on the surface of the land after
5 Happy seeder is designed for direct drilling wheat into heavy rice residue load. It is tractor powered machine that cuts and lifts the rice straw, sows into the bare soil and deposits the straw over the sown area as a mulch. It thus combines three operations of stubble cutting, mulching and seed and fertilizer drilling in a single pass.

10
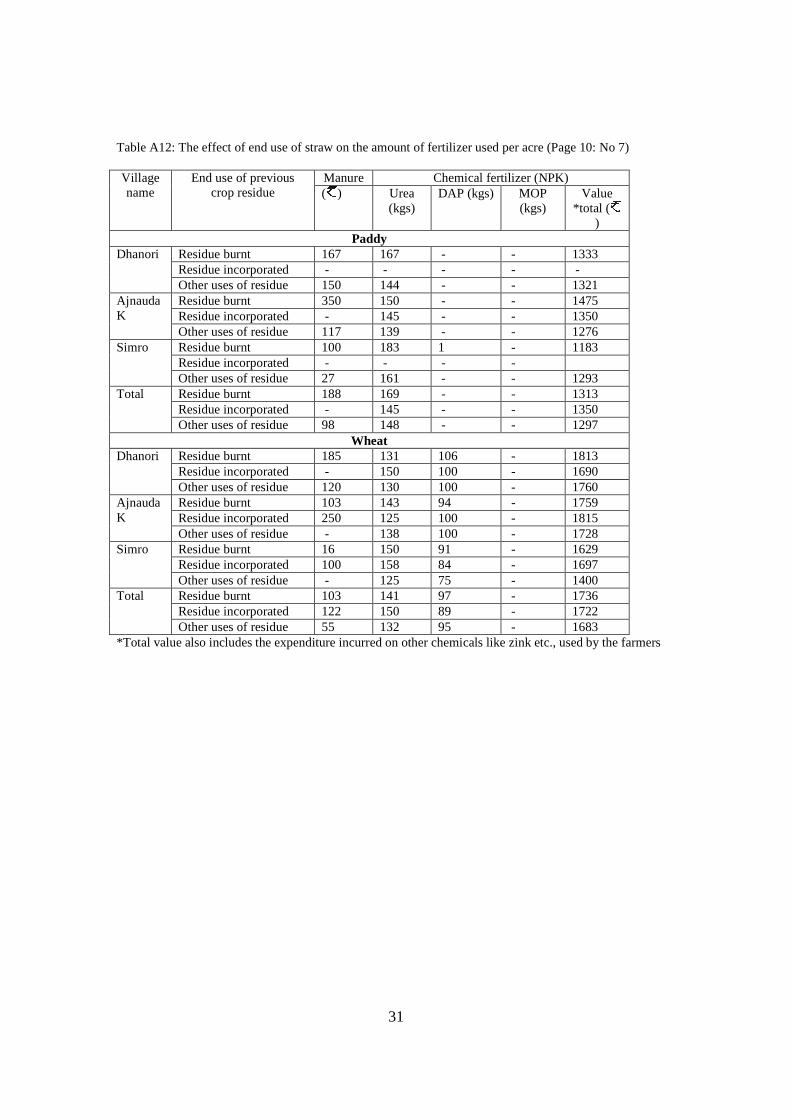
burning. Farmers indicated that in comparison to incorporation, burning required, on an
average, 20 to 50 kgs of extra chemical fertilizer that added 250 to 300 per acre extra
cost of production (Table A11). The farmers who burnt in the open field (fully or partly)
to clear the wheat stubble used 169 kgs of urea in the next crop of paddy while those who
incorporated or adopted other means used 145 and 148 kgs of urea, respectively.
Similarly, those farmers who burnt paddy field, used added amount of Di-Amonia
Phosphate (DAP) to recapture the nutritive lost in the fire in comparison to those who
incorporated or removed stubble manually (Table A12). Higher expenses are not only in
terms of higher fertilizer but also in terms of higher irrigation requirement by those who
burn their field to clear the stubble (Table A13). In paddy the total cost of irrigation was
2220 for those who burn their filed in comparison to 2000 for the farmers who
incorporated the wheat stubble. In the case of wheat, per acre irrigation cost was 941
for those who burned the field but slightly less, 907 for those who removed stubble by
other means. However, in wheat the cost of irrigation was higher for those who
incorporated probably because of additional irrigation requirement for stubble fixation.
4.3 The Effect of Crop Stubble Burning on Human Health
As mentioned in the beginning of the paper, air pollution leads to respiratory diseases like
eye irritation, bronchitis, asthma etc., increasing individuals’ disease mitigation expenses
and also affecting ones’ working capacity. In addition, open burning in the field affects
life of animals, birds and other insects below and above the earth. Burning at times also
causes poor visibility and increases the incidences of road accidents. Our household
survey shows that paddy stubble burning among our selected villages leads to air
pollution and several other problems. There was no conclusive evidence of smoke caused
by stubble burning affecting the health or productivity of the milk producing animals
(Table A14). On the other hand, a significant numbers of households indicated that
smoke caused loss to the vegetation in the field and it also led to accidents taking place
on the road during the peak of stubble burning that happens in the months of October and
November every year. To the question whether households were aware of harmful effects
of residue burning, more than 90 percent selected households indicated ‘yes’ but almost
11
none of them was taking any preventive measures to escape from air pollution related
diseases before the beginning of the harvest season.
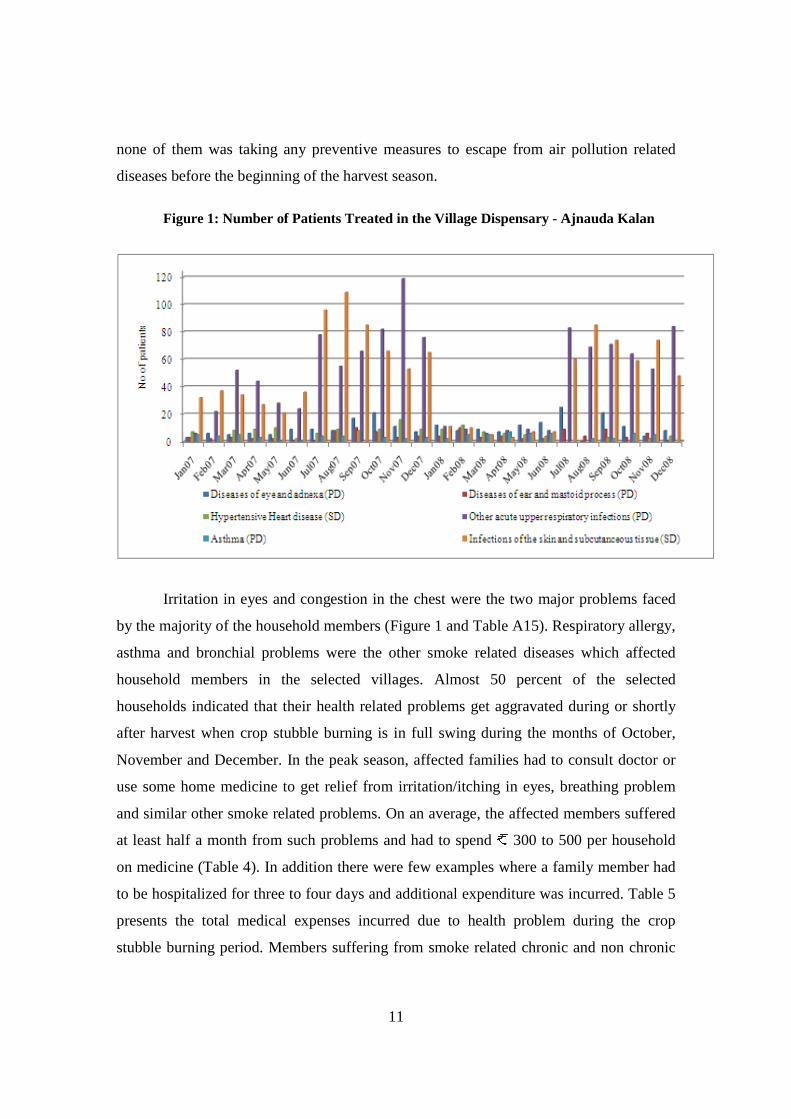
Figure 1: Number of Patients Treated in the Village Dispensary - Ajnauda Kalan
Irritation in eyes and congestion in the chest were the two major problems faced
by the majority of the household members (Figure 1 and Table A15). Respiratory allergy,
asthma and bronchial problems were the other smoke related diseases which affected
household members in the selected villages. Almost 50 percent of the selected
households indicated that their health related problems get aggravated during or shortly
after harvest when crop stubble burning is in full swing during the months of October,
November and December. In the peak season, affected families had to consult doctor or
use some home medicine to get relief from irritation/itching in eyes, breathing problem
and similar other smoke related problems. On an average, the affected members suffered
at least half a month from such problems and had to spend 300 to 500 per household
on medicine (Table 4). In addition there were few examples where a family member had
to be hospitalized for three to four days and additional expenditure was incurred. Table 5
presents the total medical expenses incurred due to health problem during the crop
stubble burning period. Members suffering from smoke related chronic and non chronic
12
diseases observed that their problem becomes acute and the severity increases during the
time of crop stubble burning. On an average, households spent around more than 1000
on the non chronic respiratory diseases like coughing, difficulty in breathing, irregular
heartbeat, itching in eyes decreased lung function etc., during the year 2008-09.
However, out of this total expenditure, around 40 to 50 percent was spent during the
months of October and November during the time of crop stubble burning. There was an
additional cost in terms of household members remaining absent from work due to
illness.
Some respondents pointed out that Punjab government from time to time advises
farmers not to set their field on fire. It is advertised in the local newspapers to make
people aware about the adverse effects of crop stubble burning. Some respondents
pointed out that District Commissioner directed gram panchayats to prevent stubble
burning (Table A16). The administration even makes such announcements by loud
speakers in the villages. However, no documentary or road shows were organized in this
regard. Similarly, those farmers who incorporate stubble instead of burning it were not
provided with any incentive from the administration. Although farmers were not aware
about the availability of happy seeder which can provide alternate to burning, significant
majority of them showed interest to buy such machine if the Punjab government gives
sufficient financial support for such machine given the price of happy seeder exceeds
100000 in the market. The farmers indicated that if at least half of the price is born by the
government for happy seeder they would be interested to buy the happy seeder machine.
5 Methodology
5.1 Theoretical Model
Air quality affects the utility of individuals and an economic value exists. There are
several ways to capture this economic value, viz., dose-response, revealed preferences
and contingent valuation methods. The dose-response method assumes a relationship
between air quality and morbidity (and/or mortality). It puts a price tag on air quality
without retrieving people’s preferences for the good. But, such type of mechanical
relationship of the dose response function does not take into account consumer behavior.
The revealed preference methods assume that the consumers are aware of the

13
costs/benefits of air quality and are able to adjust their behavior to reveal their
preferences. This necessitates the need to have estimates of willingness to pay (WTP) or
willingness to accept (WTA) on the basis of a consumer choice model aimed at
measuring the strength of association between health effects and contaminated air quality.
Suppose an individual maximizes his/her utility through expenditure on marketed
goods and services, X.6 The utility depends not only on X but also on the state of health,
H of an individual which is affected by the level of air quality (non-marketed good). It is
further assumed that the contaminated air quality, P is beyond the control of individuals,
but individuals can at least partially reduce its effects through incurring defensive
expenditure, D. The utility function is defined as:
)(),();,( XUPDHPDXU = (1) where UX>0, UXX<0, HD>0, HP<0, HDD<0, HPP<0.
The state of health affects individual’s work performance and hence the wage
income. Moreover, it is also possible that the contaminated air quality make the
individual so sick as to be completely incapacitated. During the time the individual is
under this condition, he/she is absent from work and loses the wage income completely.
Therefore ‘sick time’, S can also be assumed to be the function of defensive expenditure
and contaminated air quality,
),( PDSS = (2) where SD<0, SP>0, SDD>0, SPP>0 The equation (1) is maximized subject to the following constraints: The time constraint is:
TSW =+ (3) where W is the work time and T is the total time available. The income (resource)
constraint is:
6 Harrington et al. (1989) take the individual utility as a function of expenditure on marketed goods and services, X and leisure time, L. Since in developing countries especially in rural areas people are living in the conditions of poverty, therefore, we assume that the individual utility is the function of marketed goods and services, X only.
14
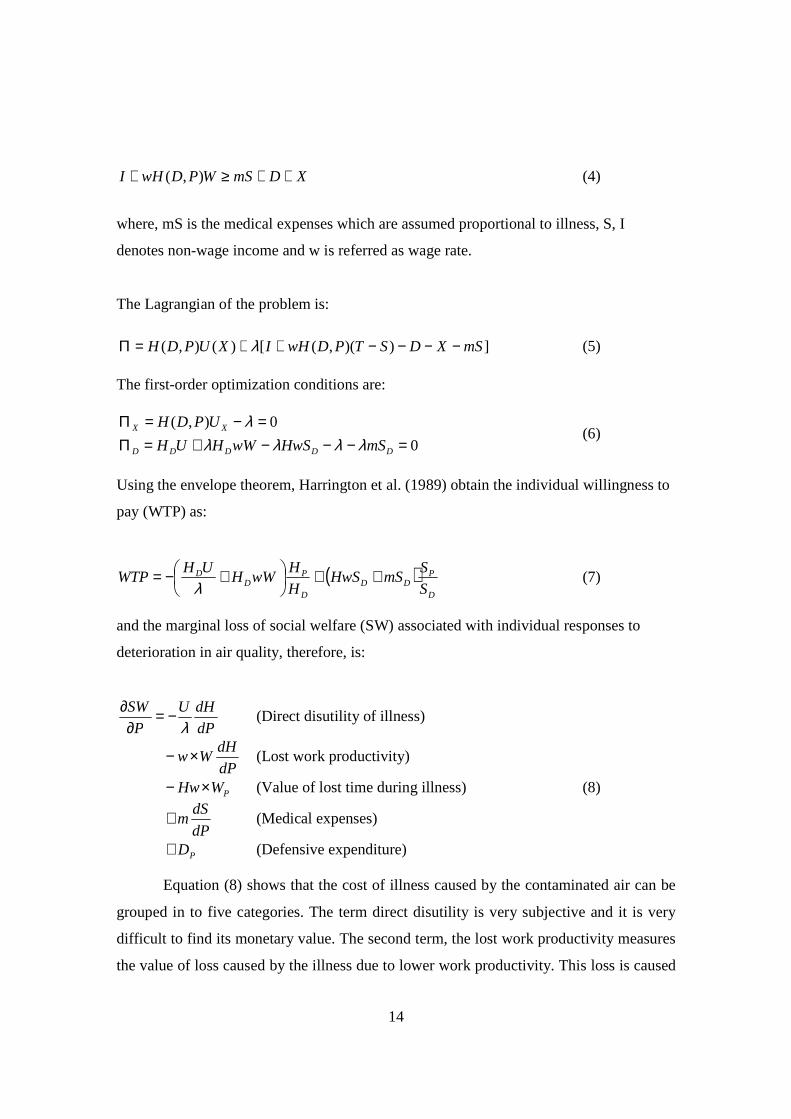
XDmSWPDwHI ++≥+ ),( (4)
where, mS is the medical expenses which are assumed proportional to illness, S, I
denotes non-wage income and w is referred as wage rate.
The Lagrangian of the problem is:
]))(,([)(),( mSXDSTPDwHIXUPDH −−−−++=Π λ (5) The first-order optimization conditions are:
0
0),(
=−−−+=Π=−=Π
DDDDD
XX
mSHwSwWHUH
UPDH
λλλλλ
(6)
Using the envelope theorem, Harrington et al. (1989) obtain the individual willingness to
pay (WTP) as:
( )D
PDD
D
PD
D
S
SmSHwS
H
HwWH
UHWTP ++
+−=λ
(7)
and the marginal loss of social welfare (SW) associated with individual responses to
deterioration in air quality, therefore, is:
dP
dHU
P
SW
λ−=
∂∂
(Direct disutility of illness)
dP
dHWw×− (Lost work productivity)
PWHw×− (Value of lost time during illness) (8)
dP
dSm+ (Medical expenses)
PD+ (Defensive expenditure)
Equation (8) shows that the cost of illness caused by the contaminated air can be
grouped in to five categories. The term direct disutility is very subjective and it is very
difficult to find its monetary value. The second term, the lost work productivity measures
the value of loss caused by the illness due to lower work productivity. This loss is caused

15
when the sick person is present for work but is not able to work with his/her full
productivity. The third term measures the loss in social welfare due to illness absence of
individuals from work. The last two terms measure the expenses individual have to incur
for defensive and mitigating activities due to contamination of air quality. In rural areas
during survey we could not get figures on the defensive activities of individuals, therefore
we measures only two values: medical expenses and value of lost time during illness.
Thus our measure of social loss due to contaminated air provides the lower bound of the
value.
5.2 Estimation Strategy
To get the estimates of social welfare loss due to contaminated air in terms of health
damages, we estimate the following two equations consisting of demand function for
medical expenses (mS) and the workdays lost due to illness (S):
19876
5432210
εαααααααααα
++++++++++=
OCCUPATIONEDUCATIONAGESEX
ssetsPerCapitaADRINKINGSMOKINGSOSPMmS(9)
and
2876
543210
εααααααααα
+++++++++=
OCCUPATIONEDUCATIONAGE
SEXssetsPerCapitaADRINKINGSMOKINGSPMS(10)
where:
Medical Expenses (mS): Mitigating activities or medical expenses include expenses
incurred as a result of air pollution related diseases. These expenditures include costs of
medicine (formal as well informal), doctor’s fee, diagnostic tests, hospitalization, and
travel to doctor’s clinic during the rice harvesting two months.
Workdays Lost (S): S represent the number of workdays lost per person during the two
rice harvesting months of October and November due to diseases/symptoms associated
with air pollution.
Particulate matter (PM10) and Sulfur Dioxide (SO2): These are the averages of the
ambient emission levels observed during the monitoring period measured in µg/m3.
16
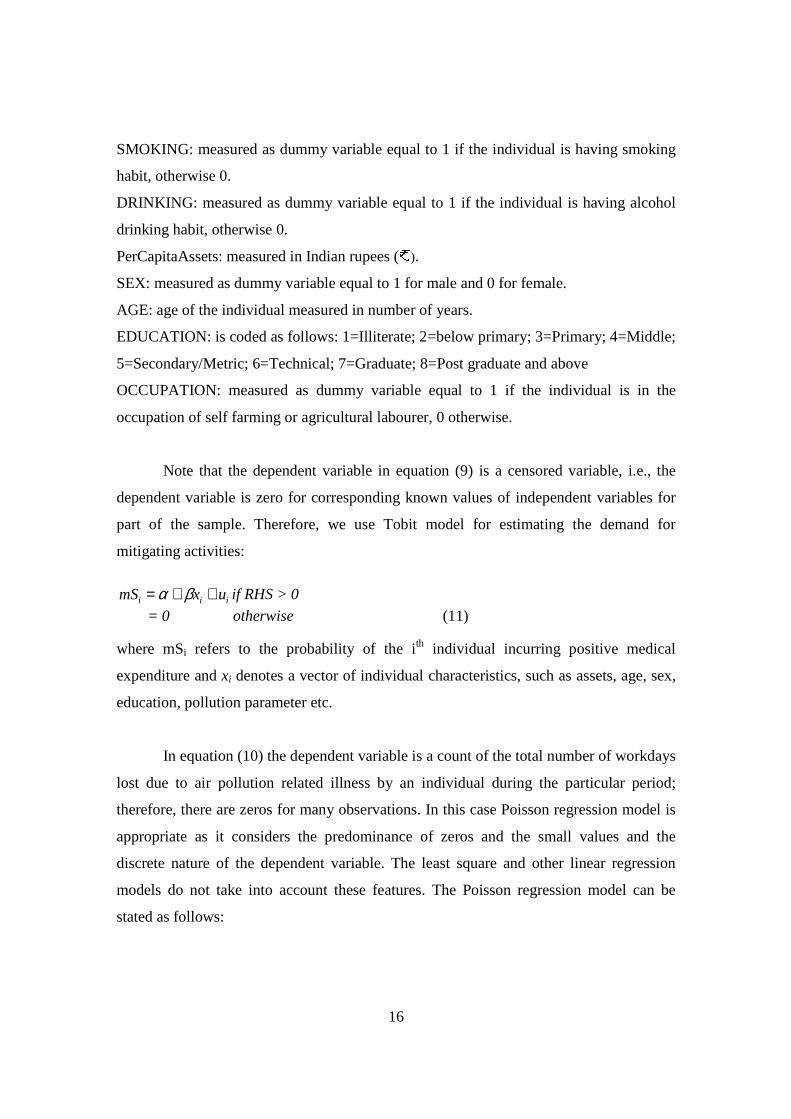
SMOKING: measured as dummy variable equal to 1 if the individual is having smoking
habit, otherwise 0.
DRINKING: measured as dummy variable equal to 1 if the individual is having alcohol
drinking habit, otherwise 0.
PerCapitaAssets: measured in Indian rupees ().
SEX: measured as dummy variable equal to 1 for male and 0 for female.
AGE: age of the individual measured in number of years.
EDUCATION: is coded as follows: 1=Illiterate; 2=below primary; 3=Primary; 4=Middle;
5=Secondary/Metric; 6=Technical; 7=Graduate; 8=Post graduate and above
OCCUPATION: measured as dummy variable equal to 1 if the individual is in the
occupation of self farming or agricultural labourer, 0 otherwise.
Note that the dependent variable in equation (9) is a censored variable, i.e., the
dependent variable is zero for corresponding known values of independent variables for
part of the sample. Therefore, we use Tobit model for estimating the demand for
mitigating activities:
iii uxmS ++= βα if RHS > 0
= 0 otherwise (11) where mSi refers to the probability of the ith individual incurring positive medical
expenditure and xi denotes a vector of individual characteristics, such as assets, age, sex,
education, pollution parameter etc.
In equation (10) the dependent variable is a count of the total number of workdays
lost due to air pollution related illness by an individual during the particular period;
therefore, there are zeros for many observations. In this case Poisson regression model is
appropriate as it considers the predominance of zeros and the small values and the
discrete nature of the dependent variable. The least square and other linear regression
models do not take into account these features. The Poisson regression model can be
stated as follows:

17
,/)/( iyiiii yexyYprob ii µµ −== yi = 0, 1, 2, ………. (12)
This equation is non-linear in parameters; therefore, for estimation purpose by
taking its natural log we convert it into an equation which is linear in parameters. Note
that the Poisson regression model is restrictive in many ways. For example, the
assumption that the conditional mean and variance of yi, given xi are equal, is very strong
and fails to account for over dispersion.7 The data used in the estimation of equations 9
and 10 is provided in Table 6.
6 The Model Results
Tables 7 and 8 provide the results of parameter estimates of reduced form equations of
mitigation expenditure and workdays lost. In the reduced form these equations are
expressed as functions of a common set of socio-economic variables and ambient air
pollution expressed in terms of particulate matter (PM10) and SO2 levels.
The parameter estimates of mitigating expenditure equation are given in Table 7.
We find there is a positive and statistically significant (at 10 % level) association between
ambient PM10 level and the mitigating expenditure. This implies that individual have to
spend higher amount of money to mitigate the adverse health effects when the particulate
level is higher in the ambient environment. The relationship between mitigating
expenditure and ambient SO2 level is negative and statistically insignificant, as contrary
to expectations. This might be happening as the ambient SO2 level is within the NAAQS
limits in the villages of Punjab.
As is expected, the coefficient of the variables such as smoking and drinking
behaviour of the individual are found to be positive and statistically significant. These
personal habits coupled with the ambient air pollution make individual more prone to
asthmatic diseases and as a result they are required to spend more on mitigating activities.
Similarly we find there is positive and significant relationship between the age of
individual and their mitigating expenses implying that the marginal effect of age on
mitigating expenses is positive. We also observe that there is positive and statistically
significant relationship between mitigating expenses and per capita assets. This might be
7 Similar estimation procedure is followed by Gupta (2008).

18
happening because wealthier individuals do not hesitate to take mitigating activities if
they are suspected to some diseases in comparison to people who have lesser assets.
Education raises awareness level of individuals with respect to environmental
problems and related health damages and helps in taking informed preventing activities
related decisions. The coefficient of education is negative, as expected, though
statistically insignificant, depicts that there happens to be a reduction in mitigation
expenditure with the increase in education level. Similarly, the individuals who have to
work in agriculture fields where burning of agricultural residue take place are thought to
be more prone to the adverse effects of pollution in comparison to their counterparts who
are in other occupations such as salaried individuals. We use dummy variable equal to
one for farmers and agricultural wage earners and zero for the individuals who are in
other occupations. We find a positive association between occupation variable and
medical expenditure.
Table 8 presents parameter estimates of the reduced form equation of workdays
lost. As expected, the coefficient of PM10 variable is positive and statistically significant
at 1% level implying that the probability of losing workdays increases as the
concentration of particulate matters in ambient environment increases. Education
increases awareness level and helps in taking preventing action and as a result an
individual is expected not to lose workday, therefore, we find that there is negative
association between education level of individuals and workdays lost. Similarly,
wealthier individuals could spend money on preventing activities and there is negative
relationship between per capita assets and workdays lost.
Welfare Loss
The welfare loss in terms of health damage due to increase in the concentration of
particulate matters from rice straw burning in the ambient environment can be estimated
in terms of increase in the medical expenditure on mitigating activities and the
opportunity cost of workdays lost and are presented in Table 9.
Increase in Medical Expenditure

19
To get the estimates of welfare loss in terms of increased medical expenditure we need to
obtain the marginal effects. The marginal effects in the case of Tobit estimation could be
computed by taking partial derivatives of mitigating expenditure equation with respect to
PM10 and multiplying it by the probability of the dependent variable taking the non-zero
values. If the ambient PM10 level is reduced from the level observed during the
harvesting period of rice in rural Punjab to the safe level (i.e., a reduction of 207 µg/m3
since the safe level defined under NAAQS is 100µg/m3 for the 24 hours average), the
estimated reduction in medical expenditure turns out to be 2.17 for the months of
October and November for a representative person.
Total rural population projected for October 2008 based on Census 2001 is 1083
thousand and 16839 thousand for the district of Patiala and the state of Punjab,
respectively. Extrapolating this welfare loss for the entire rural population of Patiala and
Punjab, it is estimated as 2.35 million and 36.52 million, respectively.
Opportunity Cost of Increase in Workdays Lost
To get the marginal effects of reduction in PM10 level on workdays lost, we differentiated
partially the reduced form equation of workdays lost with respect to PM10. The Poisson
estimates show that one µg/m3 increase in PM10 results in a marginal loss of 0.0000946
days for a representative individual in these two harvesting months. If the PM10 level is
reduced from the current level to the safe levels during rice harvesting period, the
estimated gain in workdays is 0.03. In monetary terms, the loss in terms of workdays lost
for a representative individual is estimated to be 2.35 and for rural Patiala district and
rural Punjab state it turns out to be 2.54 million and 39.57 million, respectively
assuming a wage rate of 120 per day.8
The total monetary loss (due to lost workdays and increased medical
expenditures) caused in terms of health damages due to increase in ambient PM10 level
beyond the safe level for the rural areas of Patiala district and Punjab state is estimated
as, 4.89 million and 76.09 million, respectively. These losses should be considered
the lower bound of health damages caused by the increased air pollution level in rural
Punjab. These estimates could be much higher if expenses on averting activities,
8 A wage rate fixed for the state of Punjab under National Rural Employment Guarantee Act (NREGA).

20
productivity loss due to illness, monetary value of discomfort and utility could also be
considered. There is additional monetary cost of burning to the farmers in terms of
additional fertilizer, pesticides and irrigation as was shown by the survey results
discussed in section 4. One also has to add into the above cost the losses of soil nutrient,
vegetation, bio-diversity and accidents caused because of low visibility.
7 Conclusion
In this Paper an attempt is made to estimate the monetary value of health damage caused
by the smoke pollution emitted by the burning of rice and wheat stubble in the open fields
in Punjab, India. We use data of 625 individuals collected from a household level survey
conducted in three villages, namely Dhanouri, Ajnoda Kalan and Simro of Patiala district
of Punjab for 150 households. To get the monetary values we estimated two equations:
one with mitigation expenditure and the other with workdays lost as dependent variables.
Tobit and Poisson models are used for estimating mitigation expenditure and workdays
lost equations, respectively.
On an average, total amount of stubble generated for paddy and wheat per acre
was around 23 and 19 quintals, respectively. Out of this in the case of paddy, more than
85 percent was burnt in the open field and less than 10 percent was incorporated, while
rest of 8 percent was used for other purposes. In the case of wheat, 77 percent of the total
amount was used as fodder for animals while 9 percent was incorporated and around 11
percent was burnt. Although farmers were convinced that burning was not harming the
level of crop yield but they pointed out that burning of field added extra cost to the
production because of top soil getting affected by the burning. The farmers who burnt the
field (fully or partly) to clear the wheat stubble used 169 kgs of urea in the next crop of
paddy while those who incorporated or adopted other means used 145 and 148 kgs of
urea, respectively. Similarly, those farmers who burnt paddy field, used added amount of
Di-Amonia Phosphate (DAP) to recapture the nutritive lost in the fire in comparison to
those who incorporated or removed stubble manually. Higher expenses were not only in
terms of higher fertilizer but also in terms of higher irrigation requirement by those who
burn their field to clear the stubble

21
Our household survey showed that paddy stubble burning leads to air pollution
and several other problems. Irritation in eyes and congestion in the chest were the two
major problems faced by the majority of the household members. Respiratory allergy,
asthma and bronchial problems were the other smoke related diseases which affected
household members in the selected villages. Almost 50 percent of the selected
households indicated that their health related problems get aggravated during or shortly
after harvest when crop stubble burning is in full swing during the months of October,
November and December. In the peak season, affected families had to consult doctor or
use some home medicine to get relief from irritation/itching in eyes, breathing problem
and similar other smoke related problems. On an average, the affected members suffered
at least half a month from such problems and had to spend 300 to 500 per household
on medicine. In addition there were few examples where a family member had to be
hospitalized for three to four days and additional expenditure was incurred. On an
average, households spent around more than 1000 on the non chronic respiratory
diseases like coughing, difficulty in breathing, irregular heartbeat, itching in eyes
decreased lung function etc., during the year 2008-09. However, out of this total
expenditure, around 40 to 50 percent was spent during the months of October and
November during the time of crop stubble burning. There was an additional cost in terms
of household members remaining absent from work due to illness.
We find that total annual welfare loss in terms of health damages due to air
pollution caused by the burning of rice straw in rural Punjab amounts to 76 millions.
These estimates could be much higher if expenses on averting activities, productivity loss
due to illness, monetary value of discomfort and utility could also be considered. There is
additional monetary cost of burning to the farmers in terms of additional fertilizer,
pesticides and irrigation. One also needs to add the losses of soil nutrient, vegetation, bio-
diversity and accidents caused because of low visibility.
22
References
Alberini A, Krupnick A (2000) ‘Cost of illness and willingness to pay estimates of the benefits of improved air quality: evidence from Taiwan’, Land Economics 76:37–53
Chesnut LG, Ostro BD, Vichit-Vadakan N (1997) ‘Transferability of air pollution control health benefits estimates from the United States to developing countries: evidence from the Bangkok study’, American Journal of Agricultural Economics 79:1630–1635
Cropper Maureen, Simon NB, Alberini A, Seema A, Sharma PK (1997) ‘The health benefits of air pollution control in Delhi’, American Journal of Agricultural Economics 79(5):1625–1629
Dockery DW et al (1993) ‘An association between air pollution and mortality in six US cities’, New England Journal of Medicine 329(4):1753–1808
Gadde, B.; Bonnet, S.; Menke, C.; Garivait, S. (2009) ‘Air pollutant emissions from rice straw open field burning in India, Thailand and the Philippines’, Environmental Pollution 157, 1554–1558.
Gerking S, Linda RS (1986) ‘An economic analysis of air pollution and health: the case of St Louis’, Review of Economics and Statistics 68:115–121
Gupta, U. (2008) ‘Valuation of Urban Air Pollution: A Case Study of Kanpur City in India’, Environmental and Resource Economics 41:315–326
Harrington, W., Krupnick, A.J. and Spofford, W.O. (1989) ‘The Economic Losses of Waterborne Disease Outbreak’, Journal of Urban Economics, 25: 116-137
Kumar S, Rao DN (2001) ‘Valuing benefits of air pollution abatement using health production function: a case study of Panipat thermal power station, India’, Environmental and Resource Economics 20:91–102
Long, W. Tate, RB; Neuman, M.; Manfreda, J.; Becker, AB and Anthonisen, NR (1998) ‘Respiratory Symptoms in a Susceptible Population Due to Burning of Agricultural Residue’, Chest 1998;113;351-357.
Murty MN, Gulati SC, Banerjee A (2003) ‘Health benefits from urban air pollution abatement in the Indian subcontinent’, Discussion Paper no. 62/2003, Institute of Economic Growth, Delhi, IEG Website
Ostro B, Sanchez, J., Aranda, C., Eskeland, GS (1995) ‘Air pollution and mortality: results from Santiago, Chile’, Policy Research Department, Working Paper 1453, World Bank, Washington, DC
Pope IIICA, Thun MJ, Namboodiri MM, Dockery DW, Evans JS, Spieizer FE, Health CW (1995) ‘Particulate air pollution as a predictor of mortality in a perspective study of US adults’, American Journal of Respiratory and Critical Care Medicine 151(3):669–674
Schwartz (1993) ‘Particulate air pollution and chronic respiratory diseases’, Environmental Research 62:7–13
23
Table 1: Descriptive Statistics of Emissions and Metrological Data PM10
(µg/m3) SO2 (µg/m3)
NOX (µg/m3)
Relative Humidity (min) (%)
Wind Speed (Km/hr)
Temperature (maximum) (0C)
Temperature Difference (maximum minus minimum) (0C)
Mean 306.66 14.20 56.08 46.13 1.78 29.35 16.87
Standard Deviation
16.60 2.96 12.32 0.97 0.40 0.60 1.05
Maximum 325.5 17.4 69 47.4 2.35 30.2 18.2
Minimum 284.75 10.25 39.25 45.1 1.425 28.8 15.6
Source: Envirotech Instruments Private Limited (2006) Table 2: The amount of stubble generated on the field and its alternate uses (quintals)
Variable name Dhanori Ajnaudakalan
Simro Aggregate
Paddy
Qty of total residue generated (quintals per acre) 22.61 23.50 21.54 22.55
Percentage of residue burnt out of the total 87.54 89.47 78.80 85.48
Percentage of residue incorporated using HS 0.00 0.00 0.00 0.00
Percentage of residue incorporated using rotavator 5.82 5.26 15.31 8.59
Percentage of residue sold in the market 0.00 0.00 2.51 0.78
Percentage of residue used as fodder 0.00 0.00 0.00 0.00
Percentage of residue used in bio-thermal plant 1.75 2.24 2.51 2.16
Percentage of residue used as in pulp industry 0.00 0.56 0.00 0.20
Percentage of residue used for other purpose 4.89 2.46 0.88 2.79
Wheat
Qty of total residue generated (quintals per acre) 19.33 18.98 17.73 18.68
Percentage of residue burnt out of the total 10.87 8.17 13.12 10.66
Percentage of residue incorporated using HS 0.00 0.00 0.00 0.00
Percentage of residue incorporated using rotavator 10.09 10.80 6.35 9.15
Percentage of residue sold in the market 1.94 3.29 3.53 2.90
Percentage of residue used as fodder 76.33 76.42 77.01 76.57
Percentage of residue used in bio-thermal plant 0.00 0.00 0.00 0.00
Percentage of residue used as in pulp industry 0.00 0.00 0.00 0.00
Percentage of residue used for other purpose 0.78 01.32 0.00 0.71
24
Table 3: Residue removal practices in the field (% of households) Methods of residue removal Manually By machine By burning
Rice 2.35 4.71 92.94 Dhanori
Wheat 5.62 91.01 3.37 Rice 0.00 7.14 92.86 Ajnauda kalan
Wheat 5.81 82.56 11.63 Rice 3.75 13.75 82.50 Simro
Wheat 9.41 69.41 21.18 Rice 2.01 8.43 89.56 Total
Wheat 6.92 81.15 11.92
Table 4: Expenditure incurred due to problems faced during the crop stubble burning
Problem Unit Dhanori Ajnaudakalan Simro Aggregate Family members visited local doctor during October-November, 2008
Average no of members per household (hh)
2.93 2.12 2.82 2.63
Average no of members per hh
2.93 2.15 2.82 2.64
Avg no of days per hh 13.3 13.75 11.43 12.92
Prescribed to any medicine during the two months of stubble burning (Oct-Nov, 2008) Avg amount spent per
hh 280.33 335.77 504.7
6 360.26
Average no of members per hh
0.00 1.00 3.00 2.00
Avg no of days per hh 0.00 3.00 5.00 4.00
Any member hospitalized during the two months of stubble burning (Oct-Nov, 2008) Avg amount spent per
hh 0 300 1000 650
Table 5: Medical expenses incurred due to health problems
Medical Expenses incurred during the last year (Apr 08
to Mar 09)
Medical Expenses incurred due to acute problem during the crop stubble burning
(Oct-Nov 08)
Absence from work for each
illness during Oct-Nov 2008
Village name
Chronic disease ( per affected member)
Non chronic disease ( per affected member)
Percentage of affected members observing severity of problem
increasing at the time
of crop stubble burning
Doctor/Hospital /Other charges ( per affected member)
Medicine cost (
per affected member)
Transportation/freight (
per affected member)
Self medication (
per affected member
)
(No of days per
affected
member)
Money loss (
per affected member
)
Dhanori 1667 767 100.00 71 162 77 80 3 300 Ajnauda K 1750 1978 97.30 159 222 80 56 5 600 Simro 2000 478 95.45 116 200 71 92 10 1000 Total 1750 1145 97.75 119 196 77 82 5 610

25
Table 6: Variables Used in the Regression Analysis Variable Mean Standard
Deviation Maximum Minimum Percent
Formal Medical Expenses ( )
39.26 165.05 2700.00 0.00
Informal Medical Expenses ( )
19.46 66.62 450.00 0.00
Workdays Lost 0.06 0.72 15.00 0.00
Age 31.35 18.50 90.00 1.00
Education 3.14 1.77 8.00 1.00
Per Capita Assets () 64469 78377 539467 250
Male 54.41
Occupation (Farmers and Agricultural laborers) 26.32
Smoking 2.12
Drinking 5.88
Toxicants 3.29
Table 7: Tobit Equation of Total Medical Expenditure (Left censured at 0)
Notes; Figures in parentheses are t-values *** Significance at 1% level ** Significance at 5% level * Significance at 10% level
Independent Variable Coefficient
PM10 (+) 0.046 (1.72)*
SO2 (+) -5.16 (-0.52)
SMOKING (+) 395.14 (2.62)***
DRIKING (+) 177.94 (1.71)*
Per Capita Assets (+) 0.0009 (2.65)***
SEX -41.76 (-0.57)
AGE (+) 4.13 (1.74)*
EDUCATION (-) -9.85 (-0.51)
OCCUPATION (+) 92.58 (1.16)
Constant -678.69 (-2.73)***
Pseudo R2 0.014
Log likelihood -1262.37
Wald Chi2 (9) 35.74***
Uncensored Observations: 141 Left Censored Observations: 484
Total Observations 625

26
Table 8: Poisson Equation of Workdays Lost Independent Variable Coefficient
PM10 (+) 0.008 (5.59)***
SMOKING (+) -14.66 (-0.01)
DRIKING (+) -0.81 (-0.79)
Per Capita Assets (-) -0.00001 (-1.78)*
SEX 0.43 (1.07)
AGE -0.011 (-0.97)
EDUCATION (-) -0.71 (-5.07)***
OCCUPATION -0.32 (-0.67)
Constant -5.02 (-3.98)***
Pseudo R2 0.023
Log likelihood -170.93
Wald Chi2 (8) 97.97
Total Observations 625
Notes; Figures in parentheses are t-values *** Significance at 1% level ** Significance at 5% level * Significance at 10% level Table 9: Welfare Loss due to Increased Air Pollution in Rural Punjab Representative
individual ( ) Rural Patiala District ( millions)
Rural Punjab ( millions)
Medical Expenditure 2.17 2.35 36.52
Opportunity Cost of Workdays Lost
2.35 2.54 39.57
Total Welfare Loss 4.52 4.89 76.09

27
Annexure Table A1: Total sown area and area under rice and wheat in the selected villages in the year 2001 Village Total Sown area (acres) Area under Rice
(acres) Area under Wheat (acres)
Ajnouda Kalan 897 365 367 Dhanouri 343 156 130
Simbro 755 342 344 Source: Official website, district Patiala Table A2: Household characteristics Village Name
Average family size
Percentage of male in the family
Percentage of HH in working age (16-60)
Percentage illiterate
Percentage up to secondary
Percentage above secondary
Percentage self emp-loyed farming
Percentage self employed non farming
Percentage salaried & pen-sioners
Percentage wage earn-ers
Dhanori 5.56 54.68 71.22 26.98 66.55 6.47 67.39 9.78 2.17 20.65 Ajnauda K 5.54 55.23 67.87 29.24 62.82 7.94 67.01 11.34 11.34 10.31 Simro 5.92 53.38 70.95 28.38 63.85 7.77 67.92 1.89 17.92 12.26 Total 5.67 54.41 70.04 28.20 64.39 7.40 67.46 7.46 10.85 14.24 Table A3: Farm holding characteristics Village Name
Average operated area (acres)
Leased in area (acres)
Leased out area (acres)
Irrigated area (acres)
Cropping intensity
Number of total hh in the village
Number of marginal famers
Number of small famers
Number of medium famers
Number of large famers
Dhanori 6.07 4.13 2.00 4.74 1.99 117 10 11 13 6 Ajnauda K 8.43 4.45 5.50 6.12 2.00 380 10 10 10 10 Simro 6.86 3.31 0.00 5.17 2.15 152 10 10 15 5 Total 7.12 4.00 3.40 5.36 2.05 649 30 31 38 21

28
Table A4: Assets holding among the farmers ( per household)
Table A5: Input-output table ( per acre) Village Name
Seed Manure fertilizer and pesticides
Irrigation
Labour cost including family labour
Cost of machinery
Rent for leasing-in
Other cost
Total cost
Value of total output (+byproduct)
Net returns
Rice Dhanori 303 1527 2138 1908 1924 0 63 7863 22191 14327 Ajnauda K 276 1493 2138 2065 2133 385 56 8547 22454 13907 Simro 237 1183 2064 2386 1896 0 185 7951 21706 13755 Total 272 1401 2113 2120 1984 128 102 8120 22117 13997
Wheat Dhanori 853 1364 953 2235 1993 0 138 7534 24427 16893 Ajnauda K 912 1528 955 2509 2031 38 65 8037 24924 16887 Simro 876 1098 953 2078 1821 0 184 7009 23001 15992 Total 880 1330 953 2274 1948 13 129 7527 24117 16590
Green fodder Dhanori 1091 215 400 1538 449 0 0 3692 6982 3289 Ajnauda K 1098 269 364 1436 409 0 4 3580 8038 4458 Simro 1040 200 395 1156 743 0 0 3534 7072 3538 Total 1076 228 386 1377 534 0 1 3602 7364 3762 Note: Total cost does not include, rental value of own land, depreciation of capital and implements and interest on fixed capital
Dhanori Ajnaudakalan Simro Aggregate
Tractor/Trolley 111700 82700 122960 105787 All other mechanical implements 41162 46448 88658 58756
Happy Seeder 2000 0 70 690
Thresher 40 1844 2858 1581
Irrigation pump sets submersible 59500 89900 40700 63367
Irrigation pump set non-submersible 9660 200 200 3353
Other mechanized assets 800 3200 120 1373
Animal house 27700 42300 48650 39550
Milching animals 57400 63380 56880 59220
Non milch animals 14230 15320 18000 15850
Any other 200 2060 0 753
Total 324392 347352 379096 350280

29
Table A6: Motivation for burning of crop residue (% of households)
Motivation to burn residue
Shortage of time between harvesting and next crop
Shortage of labour for mannual removal
No economical use of crop residue
Burning is more economical
Dhanori 37.80 7.32 0.00 54.88 Ajnauda kalan 38.75 10.00 5.00 46.25 Simro 48.53 5.88 1.47 44.12 Total 41.30 7.83 2.17 48.70
Table A7: Average no of days available for the next crop when crop residue is removed by different practices
Average no of days available for next crop when residue is Village/Crop
Burnt (paddy)/use of reaper (wheat)
Incorporated in soil using happy seeders
incorporated in soils using rotavator/zero drill
removed from the field by other means
Rice 46 - 44 44 Ajnauda kalan Wheat 13 - 18 21
Rice 45 - 49 48 Dhanori
Wheat 13 - 10 -
Rice 60 - - 48 Simro
Wheat 13 - 14 16
Rice 48 - 46 47 Total Wheat 13 - 15 18
Table A8: The easiest and quickest way to get rid of the crop stubble (% of households)
Crop stubble removal method
Burning Incorporation using happy seeder technology
Incorporation using other methods
Manual way of harvesting and collection
Removal from the field by other means
Dhanori 89.89 0.00 8.99 1.12 0.00 Ajnauda kalan 79.55 0.00 14.77 3.41 2.27 Simro 78.82 0.00 17.65 3.53 0.00 Total 82.82 0.00 13.74 2.67 0.76

30
Table A9: Households’ perception about which method of crop stubble management gives them the maximum crop yield (% of households) Burning happy
seeder technology
Zero drill / Rotavator
Traditional way
Any other
Dhanori 83.15 0.00 15.73 1.12 0.00 Ajnauda kalan 71.59 0.00 28.41 0.00 0.00 Simro 74.12 0.00 23.53 2.35 0.00 Total 76.34 0.00 22.52 1.15 0.00 Table A10: If crop subtle incorporated in the soil, method used for incorporation (% of households) Incorporation method Happy
seeder Zero till drill
Rotavator Manually Others
Dhanori 0.00 2.78 88.89 8.33 0.00 Ajnauda kalan 0.00 7.16 92.86 0.00 0.00 Simro 0.00 4.00 92.00 4.00 0.00 Total 0.00 4.49 91.01 4.49 0.00 Table A11: Differences by the input use and seen at soil level.
Higher amount of fertilizer required for next crop when crop subtle of previous crop burnt
Percentage HH
Extra amount of Fertilizer
(kgs per acre)
Extra amount of Fertilizer
(value per acre)
Difference seen on surface of top of soil when residue burnt (% of households)
Dhanori 14.29 46.67 233.33 14.29 Ajnauda kalan 10.00 23.00 247.50 17.50 Simro 23.08 53.89 305.56 12.82 Total 15.70 45.11 270.53 14.88
31
Table A12: The effect of end use of straw on the amount of fertilizer used per acre (Page 10: No 7)
Manure Chemical fertilizer (NPK) Village name
End use of previous crop residue ( ) Urea
(kgs) DAP (kgs) MOP
(kgs) Value
*total ()
Paddy Residue burnt 167 167 - - 1333 Residue incorporated - - - - -
Dhanori
Other uses of residue 150 144 - - 1321 Residue burnt 350 150 - - 1475 Residue incorporated - 145 - - 1350
Ajnauda K
Other uses of residue 117 139 - - 1276 Residue burnt 100 183 1 - 1183 Residue incorporated - - - -
Simro
Other uses of residue 27 161 - - 1293 Residue burnt 188 169 - - 1313 Residue incorporated - 145 - - 1350
Total
Other uses of residue 98 148 - - 1297 Wheat
Residue burnt 185 131 106 - 1813 Residue incorporated - 150 100 - 1690
Dhanori
Other uses of residue 120 130 100 - 1760 Residue burnt 103 143 94 - 1759 Residue incorporated 250 125 100 - 1815
Ajnauda K
Other uses of residue - 138 100 - 1728 Residue burnt 16 150 91 - 1629 Residue incorporated 100 158 84 - 1697
Simro
Other uses of residue - 125 75 - 1400 Residue burnt 103 141 97 - 1736 Residue incorporated 122 150 89 - 1722
Total
Other uses of residue 55 132 95 - 1683 *Total value also includes the expenditure incurred on other chemicals like zink etc., used by the farmers

32
Table A13: The effect of end use of straw on the amount of irrigation used per acre
Electric tube well – owned and hired
Diesel tube well Village name
End use of previous crop residue
Sub-mersible
(No of hrs)
Non Submersible (No of hrs)
Charges ( )
No of hrs
Charges ( )
Total Charges ( )
Paddy
Residue burnt 15 - 1000 10 1500 2500 Residue incorporated - - - - - -
Dhanori
Other uses of residue 17 20 727 10 1423 2150 Residue burnt 15 - 600 10 1500 2100 Residue incorporated 15 - 500 10 1500 2000
Ajnauda K
Other uses of residue 17 - 781 9 1367 2148 Residue burnt 10 - 833 9 1350 2183 Residue incorporated - - - - - -
Simro
Other uses of residue 14 - 653 9 1341 1994 Residue burnt 12 - 820 9 1400 2220 Residue incorporated 15 - 500 10 1500 2000
Total
Other uses of residue 16 20 722 9 1378 2100 Wheat
Residue burnt 7 10 348 4 563 911 Residue incorporated 8 0 500 4 600 1100
Dhanori
Other uses of residue - - - 5 700 700 Residue burnt 8 - 374 4 611 985 Residue incorporated - - - 5 675 675
Ajnauda K
Other uses of residue - - - 4 600 600 Residue burnt 7 - 364 4 561 925 Residue incorporated 6 - 313 4 650 963
Simro
Other uses of residue 6 - 200 6 825 1025 Residue burnt 7 10 362 4 579 941 Residue incorporated 7 - 375 4 644 1019
Total
Other uses of residue 6 - 200 5 707 907 Table A14: Percentage of household experiencing any problem due to smoke caused by crop stubble burning (mainly rice) Village / Nature of problem
Awareness of harmful effect of residue burning
Family taken preventive measure to escape from smoke disease
Smoke affected productivity of other working members (attendant)
experienced decline in productivity of milk producing animal
Milk producing animal suffering from sickness
loss of vegetation due to smoke
Having observed accident happening due to smoke
Dhanori 87.50 2.04 0.00 6.00 0 60.00 8.00 Ajnauda kalan 92.50 0.00 4.17 0.00 0 59.18 24.00 Simro 95.83 0.00 0.00 2.04 4.08 87.76 89.80 Total 92.19 0.71 1.37 2.68 1.35 68.92 40.27

33
Table A15: Percentage of household members suffering from the disease due to crop stubble burning
Problem Dhanori Ajnaudakalan Simro Aggregate Bronchial problems ( inflammation of lungs due to infection or other causes)
1.56 2.04 0.00 1.14
Irritation in eyes (eyes feel as being burnt) 75.00 73.47 93.65 81.25 Coughing ( congestion in the chest) 34.38 20.41 44.44 34.09 Experience nose/throat irritation due to smoke 4.32 0.00 0.68 1.65 Asthma ( shortness of breath, congestion in the chest) 3.13 4.08 23.81 10.80 Emphysema ( lung disease due to exposure to smoke, toxic chemicals etc)
0.00 0.00 0.00 0.00
Respiratory allergies (hay fever caused due to over reaction of the immune system to a stimulus like dust, smoke, air pollutants etc)
7.81 12.24 15.87 11.93
Other lung and heart disease 0.00 0.00 0.00 0.00 Any other problem 3.13 8.16 1.59 3.98 Health problem gets aggravated during or shortly after crop stubble burning
52.00 52.00 42.55 48.98
Table A16: Percentage of households saying yes to the following questions
Problem Dhanori Ajnaudakalan Simro Aggregate
Are respondents aware of the Punjab government’s policies towards pollution?
12.00 16.00 10.20 12.75
Has the Punjab government taken steps to make people aware of the adverse implications of crop stubble burning in open fields?
6.00 4.00 2.04 4.03
Have any seminars/documentary/road show being organized by the Punjab government to make people aware of the harmful effects of crop stubble burning?
0.00 2.00 0.00 0.67
Has the Punjab government given them enough incentives to stop burning the crop waste?
0.00 0.00 0.00 0.00
Are respondents aware of the Happy Seeder Technology for getting rid of the crop stubble?
0.00 0.00 0.00 0.00
Have respondents been provided subsidy to purchase the Happy Seeder Technology?
0.00 0.00 0.00 0.00
Are respondents willing to buy the Happy Seeder Technology if given the financial support by the Punjab Government
73.17 35.42 41.30 48.89
How much amount of subsidy respondents think the Punjab Government should provide given the market price of Happy Seeder (% amount of subsidy)
50.00 50.00 50.00 50.00