
Valuing Music Assets - American Society of Appraisers
18
Valuing Music Assets David Dunn Shot Tower Capital August 2019
Transcript of Valuing Music Assets - American Society of Appraisers

Valuing Music AssetsDavid Dunn
Shot Tower Capital
August 2019

CONFIDENTIAL | 2
Shot Tower Recent Assignments
Sell-Side Advisor Sell-Side Advisor(Exclusive)
Financial Advisor Sell-Side Advisor(Exclusive)
Financial Advisor Sell-Side Advisor(Exclusive)
Financial Advisor Valuation Services Valuation Services Valuation Services Sell-Side Advisor(Exclusive)
Sell-Side Advisor(Exclusive)
Sell-Side Advisor(Exclusive)
Financial Advisor Sell-Side Advisor(Exclusive)
Valuation Services Advisor Sell-Side Advisor(Exclusive)
EMI Music Publishing
sale to Sony Corporation
Codigo Entertainment sale to
Concord Music Group
Prince Estate New Recorded
Music Agreement
Imagem sale of Phil Collins
publishing to Hit N’ Run
Jackson Estate New
Recorded Music Agreement
Sale of Imagem to Concord
Music Group
Jackson Estate on New
Administration Agreement
for MIJAC
Valuation services to Roc
Nation Sports Management
Valuation of Intellectual
Property Assets
Valuation services to Roc
Nation Recorded Music
Jackson Estate on the sale of
50% interest in Sony/ATV
Nettwerk Music Group on
sale of its Music Publishing
Assets to Kobalt
Fintage on the sale of its
music businesses to Kobalt
Jackson Estate Cirque du
Soleil Shows
Ease Entertainment Services
on its sale to
Entertainment Partners
Valuation of Intellectual
Property Assets
WPT sale to Ourgame
International
Verse Music on its sale to
BMG Rights Management
Shot Tower advised on the largest global music transaction in 2018 (EMI), 2017 (Imagem) and 2016 (Sony/ATV), representing in excess of $6 billion of total transaction value.
Select recent music valuation and valuation advisory assignments include Estates of Aretha Franklin, Michael Jackson, Mac Miller, Prince, Elizabeth Taylor and Robin Williams

CONFIDENTIAL | 3
Music Publishing vs. Recorded Music
Recorded performance of a composition
MASTER RECORDINGMUSIC COMPOSITION
Words and lyrics
Royalty income paid on every version of the song
Royalty income paid only on the specific recording of a song
Monetization and exploitation is the responsibility of a music publisher
Monetization and exploitation is the responsibility of a record label
Royalty income typically split between a publisher (NPS) and a
songwriter (writer’s share)
Record label typically owns the master recording and the performance artist
receives a royalty
CONFIDENTIAL | 4
Music Catalog vs. Music Company
Definition
Music Catalog
(IP Rights)
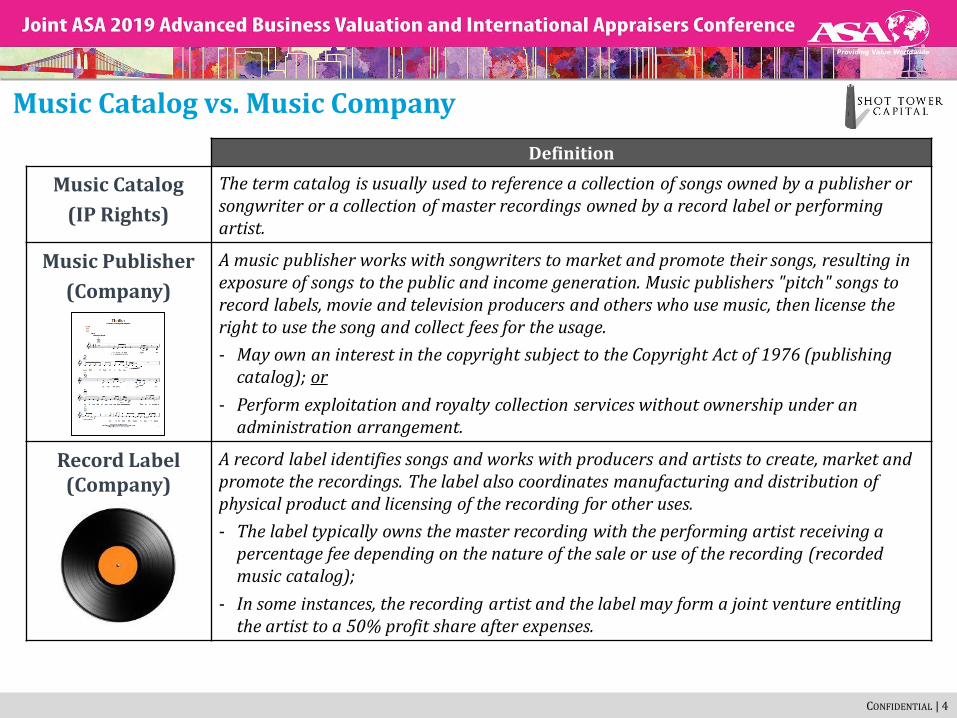
The term catalog is usually used to reference a collection of songs owned by a publisher or songwriter or a collection of master recordings owned by a record label or performing artist.
Music Publisher
(Company)
A music publisher works with songwriters to market and promote their songs, resulting in exposure of songs to the public and income generation. Music publishers "pitch" songs to record labels, movie and television producers and others who use music, then license the right to use the song and collect fees for the usage.
- May own an interest in the copyright subject to the Copyright Act of 1976 (publishing catalog); or
- Perform exploitation and royalty collection services without ownership under an administration arrangement.
Record Label (Company)
A record label identifies songs and works with producers and artists to create, market and promote the recordings. The label also coordinates manufacturing and distribution of physical product and licensing of the recording for other uses.
- The label typically owns the master recording with the performing artist receiving a percentage fee depending on the nature of the sale or use of the recording (recorded music catalog);
- In some instances, the recording artist and the label may form a joint venture entitling the artist to a 50% profit share after expenses.

CONFIDENTIAL | 5
Music Sources of Income
▪ Key driver behind the industry’s return to growth. Over the past decade, streaming went from1% of recorded revenue to 47% and is expected to continue growing.
▪ Spotify and Apple Music are global leaders, holding ~60% of paid streaming market share.▪ Access, convenience and personalization continues to boost music consumption and engagement.
▪ Analog radio continues to be a dominant form of music consumption despite displacement by streaming services among younger generations.
▪ The ad-funded landscape is dominated by YouTube, who has been under immense pressure from industry professionals to return more revenue to content creators.
▪ Increasing number of content creators (e.g., social media, user-generated, film & tv, etc.) and rising content consumption opens the door to more synch opportunities for rights holders.
▪ Becoming an important source of discoverability for music listeners, rivaling traditional mediums.▪ Film soundtracks were one of Nielsen’s five 2018 year-end music trends, displaying the influence of synchs.
▪ Consumer preference for digital downloads has been replaced by streaming services as consumers prefer access over ownership. In addition, several streaming platforms provide premium users with full download capabilities, removing the need to purchase individual songs and albums to store on a digital device.
▪ Analysts expect digital downloads to continue declining between 10% – 20% over the next decade.
▪ Largest driver of industry declines over the past decade as consumers transitioned from physical to digital formats.▪ Still accounted for 25% of recorded sales in 2018 and continues to be the largest revenue source in major music
markets, such as Japan (71% of market share) and Germany (35% of market share).▪ Vinyl continues to be the bright spot in physical formats with sales growing 6.0% in 2018 per IFPI.
Streaming
Performance Rights
Synchronization
Digital Downloads
Physical

CONFIDENTIAL | 6
Key Cash Flow Metrics
Revenue / Gross Royalties
Less Writer Royalties
Less Administration Costs
= Net Publisher’s Share
Revenue / Sales / Royalties
Less Artist Royalties
Less Manufacturing and Distribution Costs
= Net Label’s Share
CATALOG
Less Operating Expenses
- Artist & Repertoire- Licensing- G&A- Talent Expense
= EBITDA
Less Operating Expenses
- Artist & Repertoire- Licensing- G&A- Talent Expense
= EBITDAAmortization
AdvancesRecoupments
Capital Expenditures
AmortizationAdvances
RecoupmentsCapital Expenditures
COMPANY
MASTER RECORDINGMUSIC COMPOSITION

CONFIDENTIAL | 7
Key Valuation Considerations
Cost of ExploitationFunctions (e.g., A&R)
Operating CostsAdministration
Duration of RightsU.S. Copyright Act of 1976
Ex. U.S. LawContractual Retention Periods
Expectation of Diminution(Front list/Catalog/Evergreen)
Control of ExploitationAdministrationNone (Passive)
Approval RightsCo-Publishing
Full Control
Legal BackdropBlanket License RatesCompulsory Licenses
Consent DecreesTerritorial Differences
Tax and Cost of CapitalInterest Rates
Tax (Rates and Amortization)Buyer Target Returns
Media BackdropStreaming Services Growth Rates
Advertising MarketTV/Film/Video Streaming
MACROASSET OR COMPANY SPECIFIC

CONFIDENTIAL | 8
Music Valuation Methodologies
DISCOUNTED
CASH FLOW
▪ Based upon a projection forecast, the DCF analysis discounts all expected future cash flows to their present value; favors high free cash flow enterprises.
▪ Advantageous for growth businesses expecting to increase terminal year cash flow.
▪ Heavily influenced by the expected rate of return or weighted average cost of capital (WACC) and the assumed terminal exit multiple.
INVESTOR
RETURNS
ANALYSIS
▪ Investor returns analysis derives a value for a business based upon a likely investor’s required rate of return and assumed exit value, which are directly influenced by the quality of the operating business or catalog being acquired.
▪ Based on unlevered and levered equity capital structures.
MARKET
MULTIPLE
ANALYSIS
▪ Relies on the purchase multiples recently paid for similar businesses or catalogs to derive an implied market value for a company or catalog.
▪ Applies an NPS/NLS or EBITDA multiple, whether a catalog or company, based on recent precedent transactions.
▪ As music publishing and master recording rights differ based on the nature of rights and opportunities, this analysis provides an instructive guide but is not dispositive.

CONFIDENTIAL | 9
While royalties generated from physical ownership of music continue to decline, growth in music streaming has led to an overall increase in music consumption and revenues comparable to the 1990s.
From a consumer perspective, streaming is a great product and is driving the consumption of music. While there is reason to be optimistic, the ability of Spotify and other standalone services to profitably sustain service offerings is crucial to the financial health of the music industry.
Positive Secular U.S. Industry Trends – H1 2019 vs. H1 2018
U.S. MUSIC CONSUMPTION U.S. MUSIC CONSUMPTION/SALES BY FORMAT 1
+27.8%
Audio Streams
+9.6%
VinylAlbums
PhysicalAlbums
-24.4%
DigitalAlbums
-15.1%
Total Consumption 2
1 Album = 10 Downloads = 1,500 Streams(units in millions)
De
clin
ing
Fo
rma
ts
+15.7%
Overall MusicConsumption
Gro
win
g F
orm
ats
304.0
351.6
H1 2018 H1 2019Source: Nielsen Music Mid-Year Report, U.S. 2019.1. Audio streams measured as number of streams, while vinyl albums, physical albums and digital albums measured by sales.2. Nielsen’s measurement of total consumption includes the number of physical and digital albums that were sold and the total number of album equivalent songs from downloads and song streaming volume. Track equivalent
albums ratio for Nielsen represents a ratio of 10 tracks to 1 album and a streaming equivalent albums ratio of 1,500 streams to 1 album.

CONFIDENTIAL | 10
Shifting Music Economics
LOWER PER UNIT PRICING REQUIRES MORE
TRANSACTIONS TO MAINTAIN ECONOMICS
The transition from music ownership to access haslowered the per unit economics of music transactions,requiring more streams/plays to maintain economics.
SHIFT TO CONSUMPTION MONETIZATION DRIVES HIGHER
ROYALTY PAYMENTS IN THE U.S.
Despite lower per unit economics, the shift towards monetizing on consumptiondrives high royalty payments to content creators. The exception to this isYouTube, who the industry views as a value gap that drastically needs fixing.
Royalty per million streams/plays in U.S.DECLINING FORMATS GROWING FORMATS
PHYSICAL SALES
DOWNLOADS
9.1 CENTSper reproduced copy of a song
9.1 CENTSper reproduced copy of a song
PERFORMANCE
PERFORMANCE
15.5% Flat percentage
of gross revenue $0Not legally
required to pay labels or artists
Analog (AM/FM)
Satellite Radio
STREAMING 1
0.74 CENTSPay-per-stream
0.78 CENTSPay-per-stream
0.40 CENTSPay-per-stream
0.07 CENTSPay-per-stream
0.172/0.223
CENTSper song
performance
$0
$740
$1,700
$2,200
$3,970
$7,400 $7,830
$0
$1,000
$2,000
$3,000
$4,000
$5,000
$6,000
$7,000
$8,000
$9,000
$U.S
. Do
llar
s
Analog Radio
Ad-Based Online Radio
Sub-Based Online Radio
Three Largest Streaming Services
Value Gap
Sources: U.S. Copyright Royalty Board; The Trichordist.1. Pay-per-stream rates reported for calendar year 2017 and represent a mid-size indie label with an approximately 200+ album catalog generating over 200m+ streams annually.2. $.0017 per song performance is the statutory royalty rate set for ad-based commercial non-interactive webcasters.3. $.0022 per song performance is the statutory royalty rate set for subscription-based commercial non-interactive webcasters.
Online Radio

CONFIDENTIAL | 11
What the Data Tells Us
The online radio market still has room for growth but saturation in the U.S. market will likely come in the next five years as the percent of the U.S. population listening to online radio is expected to near 70%.
Without increases in time spent with online radio, the online radio market should see consolidation or investments across platforms, as LiveXLive did with Slacker Radio in 2017 and SiriusXM did with Pandora in 2018.
Spotify and Apple Music continue to dominate the U.S. streaming market with iHeartRadio and TuneIn competing to provide online radio alternatives to terrestrial radio listeners.
Sources: S&P Capital IQ; companies’ filings; press releases; Edison Research; The Infinite Dial.
$U.S. Millions
Monthly Subs/Users (mm) Est. Annual
Costs Paid Total Revenue
Spotify$9.99 100.0 217.0 € 6,735
iHeartRadio
$9.99 NA 128.0 $3,167
TuneIn$9.99 10.0 75.0 NA
Pandora$9.99 6.9 66.0 $1,517
Apple Music
$9.99 60.0 60.0 $5,040
SiriusXM$10.99 34.2 34.2 $7,714
Amazon Music
$9.99 32.0 32.0 $3,345
Google Play
$9.99 15.0 15.0 $851
Deezer$9.99 7.0 14.0 $400
Napster$9.99 4.5 4.5 $172
Slacker$9.99 0.7 1.4 $34
Tidal$9.99 1.2 1.2 $120
Users and Estimated Revenue of Online Subscription ServicesOnline Radio Listening (Weekly)
Online Radio Listening (Percent of U.S. Population)
17% 17%22%
29%33%
36%
44%
50%53%
57%60%
0%
10%
20%
30%
40%
50%
60%
70%
'09 '10 '11 '12 '13 '14 '15 '16 '17 '18 '19E
% o
f U
.S. P
op
ula
tio
n
6:31
8:029:17 9:46
11:56
13:1912:53
12:08
14:3913:40
16:43
0:00
2:24
4:48
7:12
9:36
12:00
14:24
16:48
19:12
'09 '10 '11 '12 '13 '14 '15 '16 '17 '18 '19E
On
lin
e R
adio
Lis
ten
ing
(Ho
urs
:Min
ute
s)

CONFIDENTIAL | 12
Music Streaming – Paid Streaming ARPU
As more competitors have entered the streaming space, ARPU has steadily held in the $6.00 range over the last four years with the most significant decrease in ARPU coming from 2014 to 2015 as Apple Music began to offer free three month trial periods to lure customers.
The bundling of family members under family plans and discounted student rates originally resulted in depressed ARPU rates, but given discounted offerings in foreign territories, we would expect the ARPU to continue in the $6.00 range going forward.
ARPU BY STREAMING SERVICE
$9.4
$6.7$6.3
$4.3
$7.1$7.6
$2.7
$4.3 $4.6
$5.7
$6.9
$6.0
$4.1$4.7
$4.3
$6.0
$7.5
$3.6
$5.3
$3.5
$6.0
$7.9
$3.5
$6.1
$3.6
$0.00
$1.00
$2.00
$3.00
$4.00
$5.00
$6.00
$7.00
$8.00
$9.00
$10.00
Spotify Apple Music Deezer Pandora Plus Rhapsody/Napster
AR
PU
($U
.S. D
oll
ars)
2014 2015 2016 2017 2018
ARPU WEIGHTED AVERAGE OF ALL STREAMING SERVICES 3
1 2
2014 2015 2016 2017 2018E
$7.80
$6.10 $6.00 $6.03$6.31
ARPU across the music streaming sector has bounced back in 2018 due to less aggressive customer
acquisition promotions and bundling.
E
Source: Kagan by S&P Market Intelligence, as of November 2018.1. Previously Beats and MOG.2. Pandora revenue is for Pandora Plus subscribers only and excludes advertising. Previously Pandora One.3. APRU average across all of the streaming services is based on a weighted average and also includes the ARPUs of TIDAL, Slacker, Rdio, eMusic and Muve in the years they were operating.
CONFIDENTIAL | 13
Music Publishing Industry Outlook
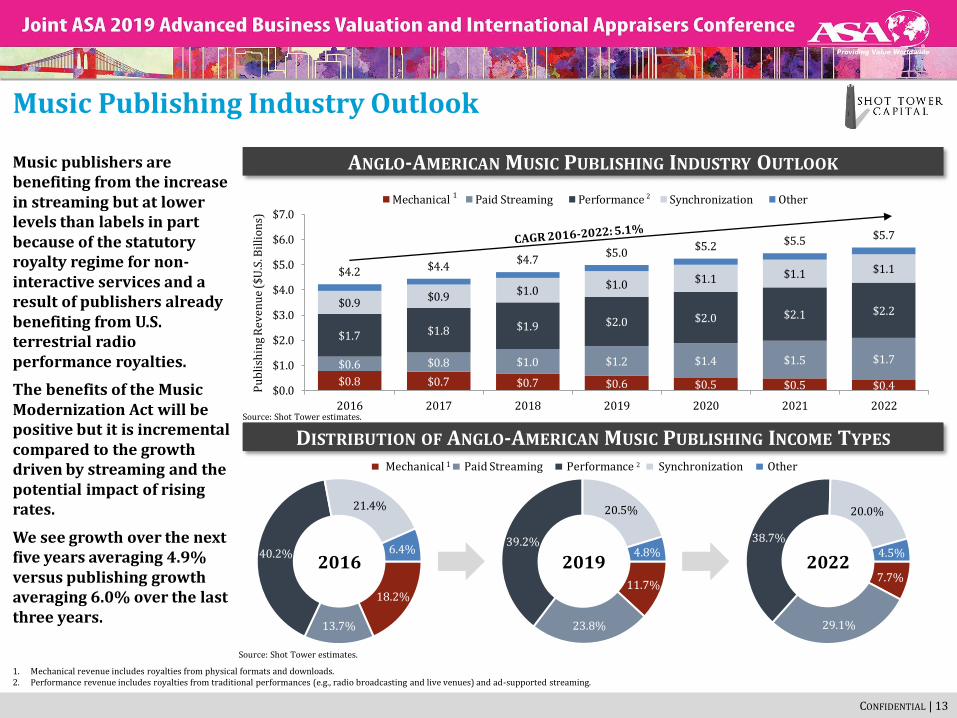
Music publishers are benefiting from the increase in streaming but at lower levels than labels in part because of the statutory royalty regime for non-interactive services and a result of publishers already benefiting from U.S. terrestrial radio performance royalties.
The benefits of the Music Modernization Act will be positive but it is incremental compared to the growth driven by streaming and the potential impact of rising rates.
We see growth over the next five years averaging 4.9% versus publishing growth averaging 6.0% over the last three years.
7.7%
29.1%
38.7%
20.0%
4.5%
11.7%
23.8%
39.2%
20.5%
4.8%
18.2%
13.7%
40.2%
21.4%
6.4%
ANGLO-AMERICAN MUSIC PUBLISHING INDUSTRY OUTLOOK
$0.8 $0.7 $0.7 $0.6 $0.5 $0.5 $0.4
$0.6 $0.8 $1.0 $1.2 $1.4 $1.5 $1.7
$1.7 $1.8 $1.9 $2.0 $2.0 $2.1 $2.2$0.9
$0.9 $1.0$1.0 $1.1 $1.1 $1.1$4.2 $4.4
$4.7$5.0
$5.2 $5.5 $5.7
$0.0
$1.0
$2.0
$3.0
$4.0
$5.0
$6.0
$7.0
2016 2017 2018 2019 2020 2021 2022
Pu
bli
shin
g R
even
ue
($U
.S. B
illi
on
s)
Mechanical Paid Streaming Performance Synchronization Other
DISTRIBUTION OF ANGLO-AMERICAN MUSIC PUBLISHING INCOME TYPES
2016 2019 2022
Performance 2 Paid Streaming SynchronizationMechanical 1 Other
Source: Shot Tower estimates.
Source: Shot Tower estimates.
1 2
1. Mechanical revenue includes royalties from physical formats and downloads.2. Performance revenue includes royalties from traditional performances (e.g., radio broadcasting and live venues) and ad-supported streaming.
CONFIDENTIAL | 14
Recorded Music Industry Outlook
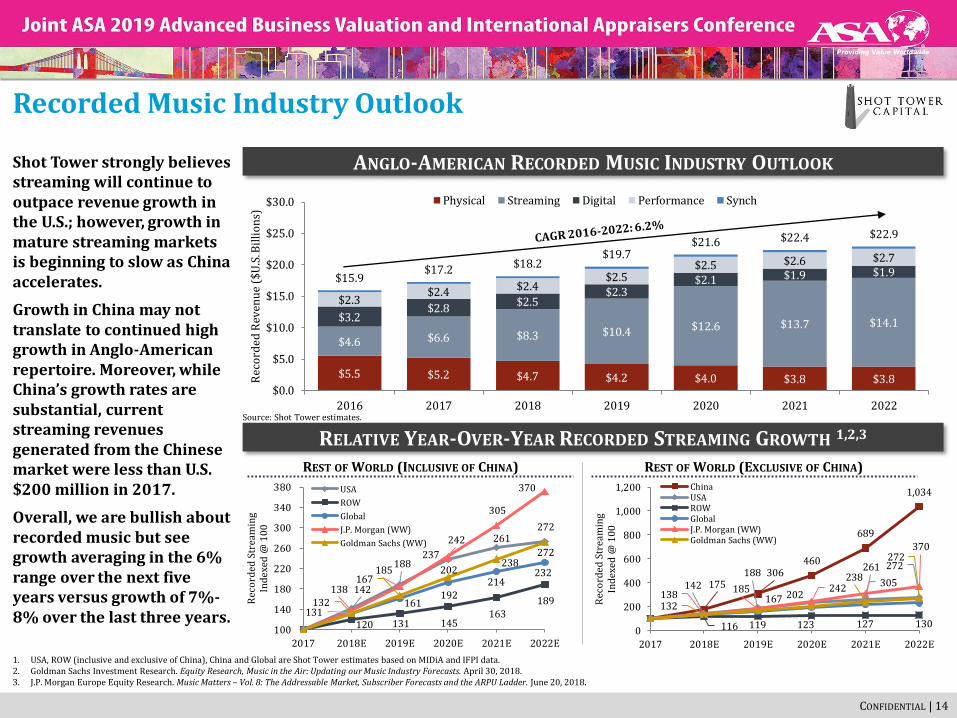
Shot Tower strongly believes streaming will continue to outpace revenue growth in the U.S.; however, growth in mature streaming markets is beginning to slow as China accelerates.
Growth in China may not translate to continued high growth in Anglo-American repertoire. Moreover, while China’s growth rates are substantial, current streaming revenues generated from the Chinese market were less than U.S. $200 million in 2017.
Overall, we are bullish about recorded music but see growth averaging in the 6% range over the next five years versus growth of 7%-8% over the last three years.
1. USA, ROW (inclusive and exclusive of China), China and Global are Shot Tower estimates based on MIDiA and IFPI data.2. Goldman Sachs Investment Research. Equity Research, Music in the Air: Updating our Music Industry Forecasts. April 30, 2018.3. J.P. Morgan Europe Equity Research. Music Matters – Vol. 8: The Addressable Market, Subscriber Forecasts and the ARPU Ladder. June 20, 2018.
$5.5 $5.2 $4.7 $4.2 $4.0 $3.8 $3.8
$4.6 $6.6 $8.3 $10.4 $12.6 $13.7 $14.1$3.2$2.8
$2.5$2.3
$2.1 $1.9 $1.9
$2.3$2.4 $2.4
$2.5$2.5 $2.6 $2.7
$15.9$17.2 $18.2
$19.7$21.6 $22.4 $22.9
$0.0
$5.0
$10.0
$15.0
$20.0
$25.0
$30.0
2016 2017 2018 2019 2020 2021 2022
Rec
ord
ed R
even
ue
($U
.S. B
illi
on
s)
Physical Streaming Digital Performance Synch
175306
460
689
1,034
142188
261 272
116 119 123 127 130
138185 242
305
370
132167 202
238
272
0
200
400
600
800
1,000
1,200
2017 2018E 2019E 2020E 2021E 2022E
Rec
ord
ed S
trea
min
g In
dex
ed @
10
0
ChinaUSAROWGlobalJ.P. Morgan (WW)Goldman Sachs (WW)
RELATIVE YEAR-OVER-YEAR RECORDED STREAMING GROWTH 1,2,3
Source: Shot Tower estimates.
142
188 237
261 272
120 131 145 163
189 131
161 192
214 232
138
185
242
305
370
132
167 202
238 272
100
140
180
220
260
300
340
380
2017 2018E 2019E 2020E 2021E 2022E
Rec
ord
ed S
trea
min
g In
dex
ed @
10
0
USA
ROW
Global
J.P. Morgan (WW)
Goldman Sachs (WW)
REST OF WORLD (INCLUSIVE OF CHINA) REST OF WORLD (EXCLUSIVE OF CHINA)
ANGLO-AMERICAN RECORDED MUSIC INDUSTRY OUTLOOK

CONFIDENTIAL | 15
Value of Publishing and Recorded (Recent Trends)
Market multiples are up substantially for both publishing and recorded music over the last five years, reaching levels consistent with the period prior to the Great Recession.
The increase in values has been driven by prospects of growth from streaming services, historically low interest rates and an expansion of well-financed buyers with long-term investment horizons.
While publishing has historically been the music investment of choice given the diversity of income streams, recent interest has turned to recorded music as its growth is directly related to streaming.
RECORDED MUSIC – AVG. MULTIPLE OF ALL TRANSACTIONS BY YEAR
MUSIC PUBLISHING – AVG. MULTIPLE OF ALL TRANSACTIONS BY YEAR
16.4x
19.1x
12.9x
10.1x
14.5x
19.9x
17.6x
16.3x 16.1x
13.5x
8.8x 9.2x 9.0x7.4x
9.8x11.0x
10.2x12.0x
4.0x
9.0x
14.0x
19.0x
24.0x
2006 2007 2008 2009 2010 2011 2012 2013 2014 2015 2016 2017 2018
Ave
rage
Tra
nsa
ctio
n M
ult
iple
Major Independent
18.7x
8.7x
7.0x
10.8x
6.0x 7.3x 7.5x
9.6x
11.0x+
4.0x
6.0x
8.0x
10.0x
12.0x
14.0x
16.0x
18.0x
20.0x
2006 2007 2008 2009 2010 2011 2012 2013 2014 2015 2016 2017 2018
Ave
rage
Tra
nsa
ctio
n M
ult
iple
Major Independent
(19.1x – EBITDA) 3
1 2
(EBITDA Mult.) (NPS Mult.) EMI
1 2
(EBITDA Mult.) (NLS Mult.)
Spotify
(4.0x – EV/Rev.) 4
N/A
14.0x –16.0x+
10.0x –12.0x+
Source: Shot Tower estimates.1. “Major” represents larger transactions with a sale price in excess of $200 million and valued on an EBITDA multiple.2. “Independent” represents transactions with a sale price between $20 million and $200 million and valued on an NPS/NLS multiple.3. EBITDA multiple provided per press release.4. Spotify enterprise value measured as of July 22, 2019 and revenue represents last twelve months as of March 31, 2019. Financials translated into USD at an exchange rate of 1.16 USD/EUR.

CONFIDENTIAL | 16
Values are Strongly Correlated to Growth Over Time
Not surprisingly, there is high correlation between expected growth rates and valuation multiples.
Drivers:
‒ Streaming Growth;
‒ Low Interest Rates;
‒ Stability (Publishing);
‒ Scarcity/Competition.
Future Drivers:
‒ Streaming Growth;
‒ Interest Rates;
‒ Regulation (e.g., changes to consent decree);
‒ Ex. U.S. Growth.
RELATIVE MUSIC INDUSTRY REVENUE GROWTH 1
40
60
80
100
120
140
160
180
200
220
19
93
19
94
19
95
19
96
19
97
19
98
19
99
20
00
20
01
20
02
20
03
20
04
20
05
20
06
20
07
20
08
20
09
20
10
20
11
20
12
20
13
20
14
20
15
20
16
20
17
20
18
Rev
enu
e %
Gro
wth
In
dex
to
10
0
Recorded Music Music Publishing
CD Era1991 ‒ 1999
MP3 Era1999 ‒ 2016
The global music industry appears to be emerging from a period of digital disruption and is poised to reach new highs.
Streaming Era2016 ‒ ?
Music Publishing M&A Multiples 2
Recorded Music M&A Multiples 2
Sources: RIAA; Enders Analysis; NMPA; Shot Tower estimates.1. Revenue growth for music publishing and recorded music is projected after 2017.2. For music publishing and recorded music M&A multiples, red outline represents independent transactions, while navy represents majors – as presented on the previous slide.

CONFIDENTIAL | 17
Interest Rates in Focus
Music valuations have benefited from low rates as large corporations, pension funds and family offices have all been attracted to the potential for higher yields from relatively stable music publishing income.
U.S. INTEREST RATE ENVIRONMENT
1.4%
1.4%
1.7%
2.0%
2.3%
2.5%
2.6%2.8% 2.8%
2.6%
2.2%2.1%
1.8%1.8%1.8%
2.1%
2.4%
2.6%
2.8%
2.8% 3.0%
2.9%
2.6%
2.2%2.1%
1.8%
2.3% 2.2%
2.3%
2.6%
2.8%
3.0% 3.0%
3.1%3.0%
2.7%
2.4%
2.3%
2.1%
1.2%
1.4%
1.6%
1.8%
2.0%
2.2%
2.4%
2.6%
2.8%
3.0%
3.2%
3.4%
Yie
lds
2-Year U.S. Treasury 5-Year U.S. Treasury 10-Year U.S. Treasury↑(1.36% to 1.83%) ↓(1.82% to 1.81%) ↓(2.26% to 2.06%)
Source: Bloomberg L.P.

CONFIDENTIAL | 18
Disclaimer
The principals of Shot Tower Capital LLC are registeredrepresentatives of Shot Tower Securities LLC, Member FINRA/SIPC.
This communication does not represent a solicitation of an offer tosell securities. Securities offered through Shot Tower SecuritiesLLC, Member FINRA/SIPC. Licensed to sell securities in Maryland,New York, and California.
Shot Tower Capital LLC621 East Pratt Street
Suite 600Baltimore, Maryland 21202
+1 (410) [email protected]