Valuing Ecosystem Services and Biodiversity: … Valuing Ecosystem Services and Biodiversity:...
37
1 Valuing Ecosystem Services and Biodiversity: Experience and Approaches Taken in Georgia Workshop for Eastern Europe and Central Asia on Valuation and Incentive Measures Tbilisi Georgia 29 -31 May 2012. Prepared by: Malkhaz Adeishvili
Transcript of Valuing Ecosystem Services and Biodiversity: … Valuing Ecosystem Services and Biodiversity:...

1
Valuing Ecosystem Services and Biodiversity:
Experience and Approaches Taken in Georgia
Workshop for Eastern Europe and Central Asia on Valuation and Incentive Measures
Tbilisi
Georgia
29 -31 May 2012.
Prepared by: Malkhaz Adeishvili
2
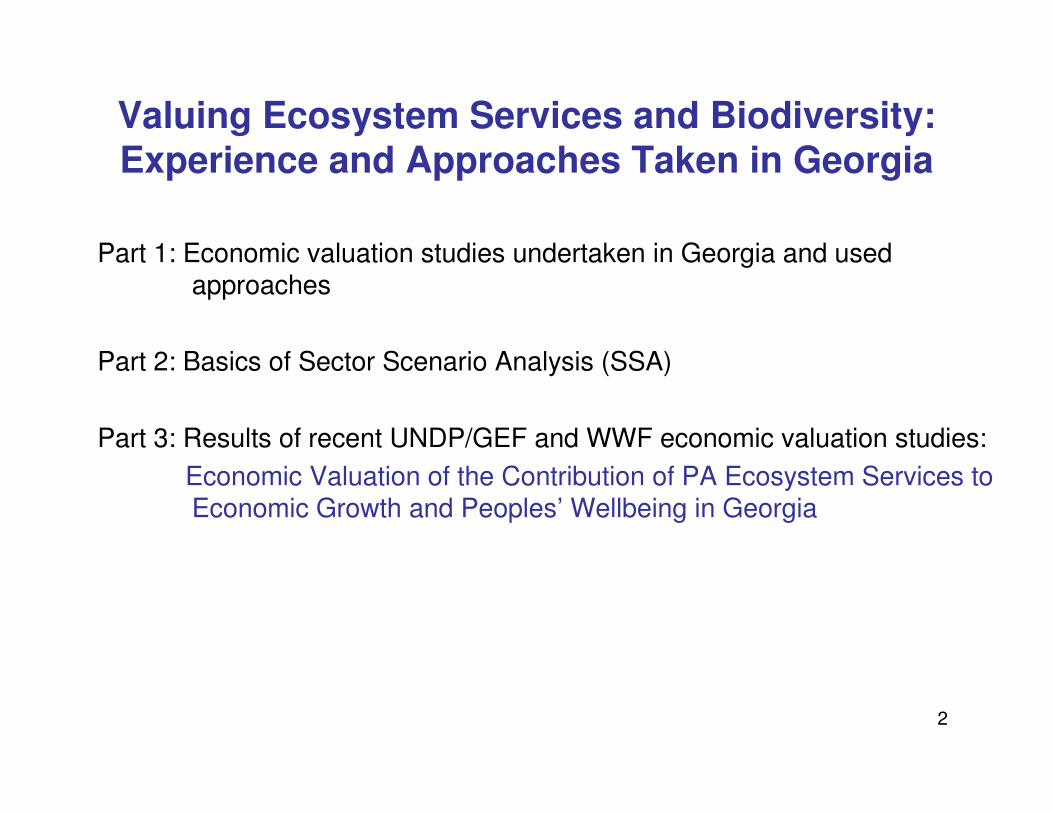
Valuing Ecosystem Services and Biodiversity:
Experience and Approaches Taken in Georgia
Part 1: Economic valuation studies undertaken in Georgia and used approaches
Part 2: Basics of Sector Scenario Analysis (SSA)
Part 3: Results of recent UNDP/GEF and WWF economic valuation studies:
Economic Valuation of the Contribution of PA Ecosystem Services to Economic Growth and Peoples’ Wellbeing in Georgia

3
Part 1: Economic Valuation Studies Undertaken in
Georgia and Used Approaches
• World Bank studies (2000) exploring the revenue generation potential of the
national parks to be established under the GEF funded Protected Areas
Development Project:
- Contingent Valuation Survey among Georgian City Dwellers:
Attitudes, Preferences and Willingness to Pay for Biodiversity Conservation.
Tijen Arin, World Bank. Manon Circe, Tecsult Inc. Georgian Opinion Research
Business International (GORBI). (2000);
- Tourist Preferences for the Establishment of National Parks in Georgia,
Survey Results for Expatriates Residing in Tbilisi, Georgia. Tecsult International Inc.
(2000).
• Methodology used – Contingent Valuation Method: the respondents were asked
for their maximum willingness to pay (WTP) for access to national parks (e.g. the
highest entrance fee that they would pay ) as well as WTP for nature conservation in
Georgia.

4
Part 1: Economic Valuation Studies Undertaken in
Georgia and Used Approaches
Some findings of these studies:
• Contingent Valuation Survey among Georgian City Dwellers (2000):
- The recreational value that Georgian city dwellers would derive from visiting
national parks was estimated at 2.7 million GEL (1.7 mln USD) annually.
- 1.1 million GEL of this value could be captured by the national parks through the
introduction of an annual pass at 5 GEL (3 USD) per adult person;
- Urban residents of the five urban areas surveyed would derive an estimated
3.5 million GEL (2.15 mln USD) annually in non-use value from improved biodiversity
protection.
• Survey Results for Expatriates Residing in Tbilisi (2000):
The average willingness to pay among expatriates for entering a Georgian National
Park was 21.5 GEL (13.2 USD).

5
Part 1: Economic Valuation Studies Undertaken in
Georgia and Used Approaches
• In 2000-2001 the WB conducted a study Benefits and Costs of Establishing the Kolkheti National Park in the Kolkheti wetlands
• Total Economic Valuation (TEV) methodology was applied in estimating the costs and benefits associated with the establishment of the national park.
• This approach accounts for all uses and services of ecosystems and biodiversity that humans derive from them.

6
Table 1: Classification of total economic value for Kolkheti National Park
Esthetic value
Education
Habitats for migratory birds
Scientific research
Groundwater regulation and protection
Peat harvesting
Spawning groundsRecreational and tourism (eco- and cultural)
Micro-climatic stabilization
Fishing
Bequest (preservation for future generations)
Water filteringHunting
Culture, heritageFlood controlFuelwood collection
Archeological treasureCarbon SequestrationGrazing
BiodiversityPotential future uses
Nutrient retentionCrop cultivation
Existence valueOption ValueIndirect Use
valuesDirect Use Values
Non-Use ValuesUse Values

7
Part 1: Economic Valuation Studies Undertaken in
Georgia and Used Approaches
• The cost-benefit analysis found that the establishment of the KNP under the
current KPA Law would lead to significant net losses to the local communities. A
socially and ecologically sustainable alternative was needed.
• Study results suggested that in this alternative scenario, limitations on resource
use in the KNP should have been less strict but within the limits of ecological
sustainability.
• Based on the findings of this analysis some specific recommendations were
presented to guide the preparation of the KNP Management Plan.

88
Part 1: Economic Valuation Studies Undertaken in
Georgia and Used Approaches
• Georgian Forest Development Project (World Bank):
- Legal, Institutional and Economic Background of Georgia’s Forest Sector and
Principles of Total Economic Valuation. Report 1. URS Corporation Ltd (2003);
- Legal, Institutional and Economic Analysis, Forest resource Evaluation
Methodology, Resource Pricing Mechanisms ad worked Example of Forest
Resources Economic Valuation for Oni Forest District for Forest Management
Planning and Valuation Purposes in Georgia. Report 2. URS Corporation Ltd (2003);
• 2010: UNDP/GEF project Catalyzing the Financial Sustainability of Georgian
Protected Areas System: Economic Valuation of the Tusheti National Park and of the
Network of Georgian Protected Areas.
• 2011: WWF Caucasus Programme Office: Valuation of the Contribution of Borjomi-
Kharagauli and Mtirala National Parks Ecosystem Services to Economic Growth and
Human Well-being. The study results presented on a regional workshop in March
2012.

99
Part 1: Economic Valuation Studies Undertaken in
Georgia and Used Approaches
• Based on the Tusheti NP (UNDP/GEF) and WWF valuation studies a draft report
Economic Valuation of the Contribution of Ecosystems to Economic Growth and
Human Well-Being in Georgia: Protected Areas of Tusheti and the Georgian Network
of Protected Areas was developed in 2012. Final report is expected to be submitted
in June 2012.
• Both UNDP/GEF and WWF economic valuation studies were undertaken by the
same group of international and national experts;
• UNDP/GEF report builds upon and integrates the findings and results of the WWF
report. Both studies applied the same methodology - Sector Scenario Analysis:
Business as Usual (BAU) and Sustainable Ecosystems Management (SEM).

1010
Part 1: Economic Valuation Studies Undertaken in
Georgia and Used Approaches
• 2011: Georgian President Mr. Mikheil Saakashvili expressed interest with WWF and UNEP for Georgia to become a pilot country for the national assessment work of TEEB
• UNEP is in the process of developing a fully-fledged proposal for Georgia and seeking donors to assist in carrying out a TEEB Georgia study
• UNEP launched a first scoping study to identify existing valuation studies carried out for Georgia as well as opportunities to build on these studies

11
End of Part 1.

12
Ecosystem services:
Ecosystem services (ES) are the conversion of natural assets – such as trees,
snow cover, and soil fertility – into valuable benefits such as wood products,
winter tourism, fresh water and arable land (Schroter et al., 2005):
• Freshwater (watershed services)
• Food (Wild meets, fruits, greens, fresh water fish and seafood)
• Timber, fire wood
• Biodiversity regulation/conservation (habitat for plant/animal species)
• Wild crop varieties
• Nutrient cycling
• Snow coverage
• Air quality and carbon sequestration
• Human health
• Detoxification
• Natural hazard regulation
• Nature based sports: fishing, hunting, skiing, hiking, nature & wildlife viewing
Protected areas provide the best continuous natural conditions for ecosystems
to be able to function and continue to deliver these services.
Part 2: Basics of Sector Scenario Analysis

13
Part 2: Basics of Sector Scenario Analysis
Ecosystems generate many economically valuable goods and services

14
Sector Scenario Analysis using BAU and SEM scenarios
• Identify linkages between ES and economic sectors
• Assess the level of ecosystem service input to economic sectors
• Identify the potential changes in sector-productivity under different
management strategies: Busyness as Usual (BAU) and Sustainable Ecosystems
Management (SEM)
• Develop scenarios under short (4year, political), medium (4-20yrs) and/or
longer (20-50 year) time frames
• Assess the resulting change in sectors’ production
• Assess changes in terms of various socio-economic indicators e.g.
employment, return on investment, poverty, etc.
Part 2: Basics of Sector Scenario Analysis

15
Comparing BAU/SEM scenarios
3/29/2012
how ecosystem degradation
lowers outputs and results in
costs and losses
how sustainable ecosystem
management practices generate
benefits and reduce costs
BAUBusiness As Usual
SEMSustainable Ecosystem
Management
Tbilisi, Georgia, PA’s Ecosystems Valuation Training– Marlon Flores
Part 2: Basics of Sector Scenario Analysis

16
Indicators to estimate net benefits of SEM compared to BAU:
� production (volume, value)
� employment (direct, indirect and induced)
� income
� fiscal impacts (tax revenues, subsidies and green taxes)
� foreign exchange (foreign investments, exports)
� avoided damage costs
� returns on investment
� net revenue
� productivity (return to labor, land, capital)
� changes in natural capital
� equity impact on the poor / distribution of benefits
Part 2: Basics of Sector Scenario Analysis

17
Selecting sectors and indicators for BAU / SEM
3/29/2012 Tbilisi, Georgia, PA’s Ecosystems Valuation Training– Marlon Flores
Fore
stry
Ag
ricu
ltu
re
Fish
eri
es
Hy
dro
po
we
r
Be
ve
rag
es
ind
ust
ry
Win
e i
nd
ust
ry
To
uri
sm
Na
tura
l d
isa
ste
r
mit
iga
tio
n
Wa
ter
sup
ply
cov
era
ge
Ru
ral
liv
eli
ho
od
s
BAU SEM
Employment (direct, indirect and induced) ● ● ● ● ● ● ● ? ?
Income trends ● ● ● ● ● ● ● ● ? ?
Fiscal impacts (tax revenues, subsidies and green taxes) ● ● ● ● ● ● ● ? ?
Foreign exchange (foreign investments, exports) ● ● ● ● ● ● ● ? ?
Access to green markets/income & innovation potential ● ● ● ● ● ● ● ● ? ?
Opinion polls /surveys ● ● ● ● ● ● ● ● ● ● ? ?
Avoided damage costs ● ? ?
Returns on investment ● ● ● ● ● ● ● ● ● ● ? ?
Production (volume, value) ● ● ● ● ● ● ● ● ● ● ? ?
Net revenue ● ● ● ● ● ● ● ● ● ? ?
Changes in natural capital ● ● ● ● ● ● ● ? ?
Equity impact on the poor / distribution of benefits ● ● ? ?
Indicator
Productive sectors Well-being Comparison
Part 2: Basics of Sector Scenario Analysis
18
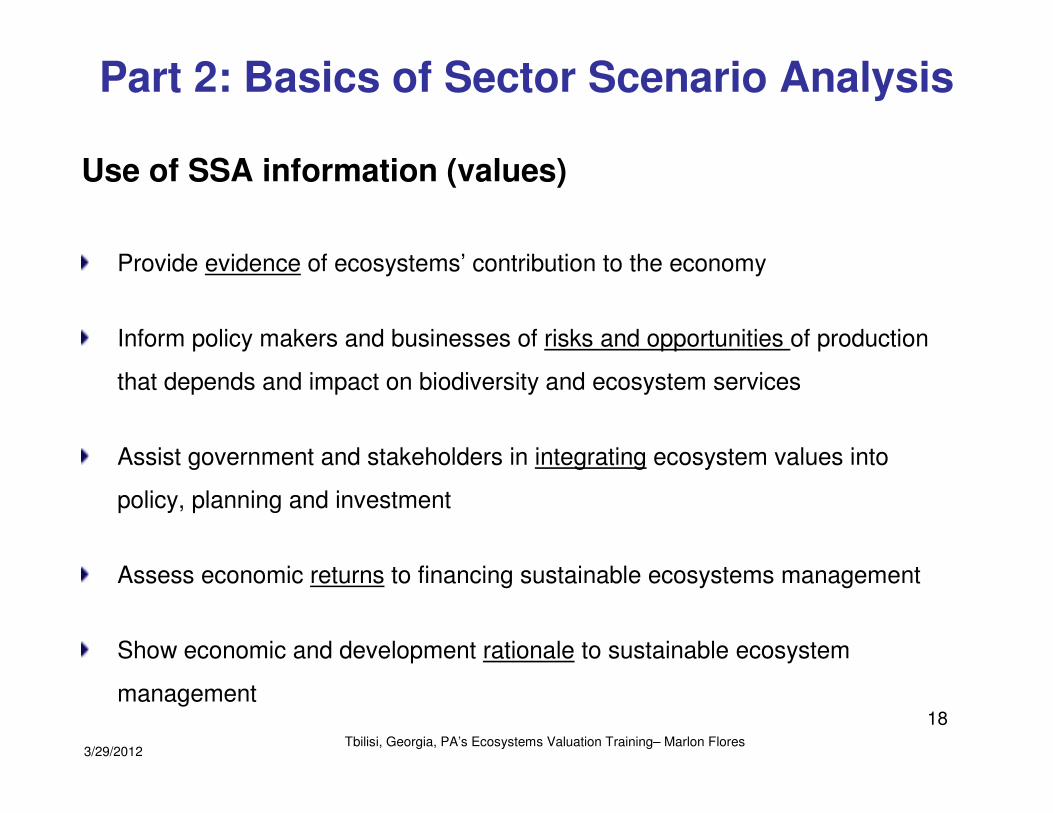
Part 2: Basics of Sector Scenario Analysis
Provide evidence of ecosystems’ contribution to the economy
Inform policy makers and businesses of risks and opportunities of production
that depends and impact on biodiversity and ecosystem services
Assist government and stakeholders in integrating ecosystem values into
policy, planning and investment
Assess economic returns to financing sustainable ecosystems management
Show economic and development rationale to sustainable ecosystem
management
Use of SSA information (values)
Tbilisi, Georgia, PA’s Ecosystems Valuation Training– Marlon Flores3/29/2012

19 19
• employment
• income trends
• fiscal impacts (tax revenues, subsidies and green taxes)
• foreign exchange (foreign investments, exports)
• access to green markets/income & innovation
• opinion polls /surveys
• avoided damage costs
• returns on investment
• production (volume, value)
• net revenue
• productivity (return to labor, land, capital)
• changes in natural capital
• equity impact on the poor / distribution of benefits
SSA FLOW
3/29/2012 Tbilisi, Georgia, PA’s Ecosystems Valuation Training– Marlon Flores

20
End of Part 2

21
Part 3: Economic Valuation of the Contribution of
PA Ecosystems to Economic Growth and Human
Wellbeing in Georgia
This economic valuation has been based on the UNDP/GEF and WWF studies of 3 selected PAs in Georgia – Tusheti PAs, Borjomi-Kharagauliand Mtirala National Parks.

22
Tusheti PAs
BKNP
MNP
RUSSIA
G E O R G I A

23
Part 3. Economic valuation of the contribution of PA ecosystem services to economic growth and human
wellbeing in Georgia
• The studies were undertaken in 2010-2012 by Mr. Marlon Flores from the Ecologic Institute (Washington D.C.), Malkhaz Adeishvili (Georgian National Expert) and a group of local experts.
• Objective was not to assess total economic value of all PAs;
• The objective was to illustrate on the example of selected PAs the contribution of ES to the economic development and human wellbeing

24
Part 3. Economic valuation of the contribution of PA ecosystem services to economic growth and human
wellbeing in Georgia
• SSA analysis BAU and SEM methodology
• Information sources:
- PA Management Plans
- Socio-Economic studies of WB (2005), NACRES/FFI (2009), NACRES (2010)
- Field Visit to PAs (August 2010, July 2011)
- Local experts’ information
- Statistical data of the Georgian Statistical service
• Limitations:
- Lack of scientific information on ecosystem services and links with economic sectors
in Georgia
- Lack of economic sector level data by time series.

25
Findings of the economic valuation of the PA network’s contribution to economic development:
• ES of PAs contribute significantly to economic development, poverty reduction
and wellbeing of population in Georgia
• ES contribute to the development of economic sectors such as:
- Tourism
- Agriculture
- Hydropower
- Fishery
- Fresh water supply
- Mineral and bottled water
• Input of ES into production processes in Georgia are abundant and essentially
free.
Part 3. Economic valuation of the contribution of PA ecosystem services to economic growth and human
wellbeing in Georgia

26
Contribution of the PAs to Tourism
• Tourism and NB tourism are rapidly growing sectors in Georgia
• Number of visitors to Georgian PAs (2005-2011)

27
Contribution of the PAs network to tourism
• No statistical data is available on the contribution of the NB tourism to economic
growth (GDP) in Georgia
• The average expenditure of a tourist visiting Georgia - USD 1,732
• Assuming 30% are foreign tourists – total expenditures of the tourists in Georgia
would be 155 mln USD
• Borjomi-Kharagauli NP and related ecosystems are good examples of promoting
tourism, recreation, health and sports around PAs
• Hotels’ economic turnover is one of the highest in the region where the BKNP is
located.

28
Nature based tourism in TPA
• Tourism is growing in TPA
Figure 211: Visitation to Tusheti Protected Area
Source: Consultant
Source: Administration of the TPAs (2010)
675
1,244 954
2,131
6,185
9,294
-
1,000
2,000
3,000
4,000
5,000
6,000
7,000
8,000
9,000
10,000
2006 2007 2008 2009 2010 2011
Figure 11. Vistation to Tusheti protected areas (2006-2011)
Nu
mb
er
of
vis
ito
rs

29
Nature based tourism in TPA
• Local people are engaged in tourism related services:
- Guesthouses
- Transportation
- Guiding
- Renting horses
- Selling traditional handicrafts
Source: Administration of the TPAs (2010)
7
27
0
5
10
15
20
25
30
2005 2010
Figure 16. Increse of guest houses in TPAs
Nu
mb
er
of
gu
est
ho
use
s
BAU
SEM
Source: Consultant
0
20
40
60
80
100
120
140
160
180
2005 2010
Figure 17. People engaged in NBT activities in TPAs
Nu
mb
er
of
pe
op
le
BAU
SEM
30
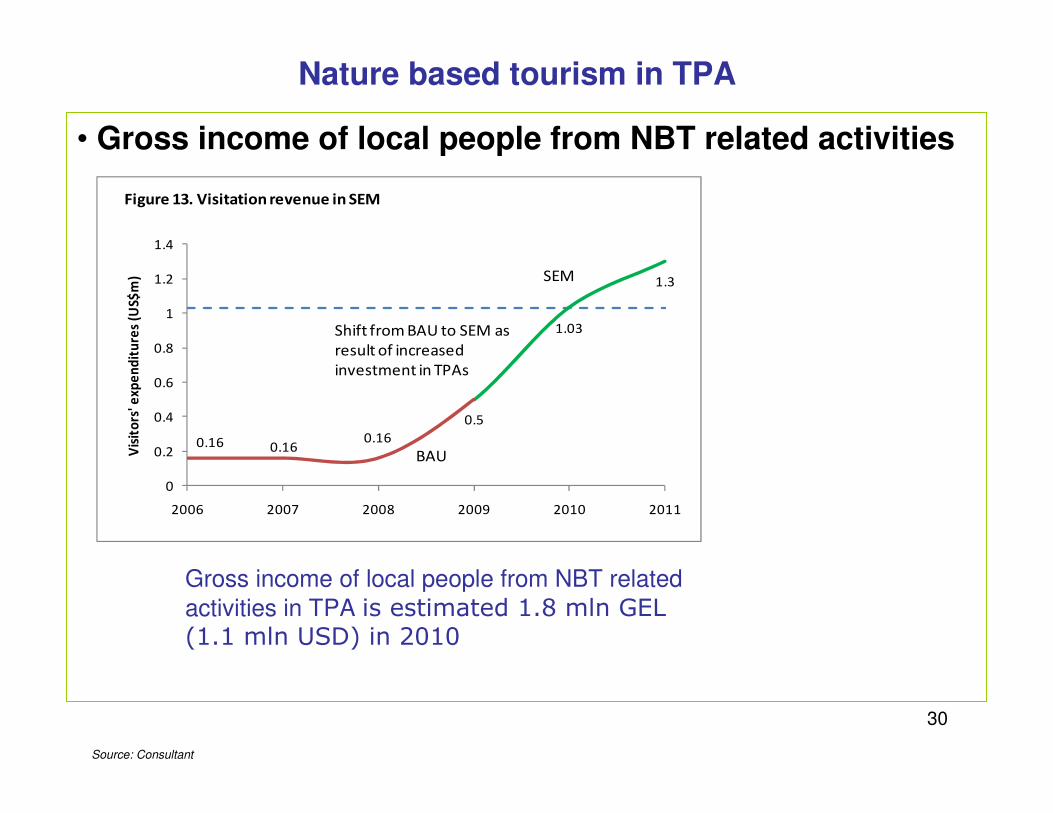
Nature based tourism in TPA
• Gross income of local people from NBT related activities
Source: Consultant
Gross income of local people from NBT related
activities in TPA is estimated 1.8 mln GEL(1.1 mln USD) in 2010
0.16 0.160.16
0.5
1.03
1.3
0
0.2
0.4
0.6
0.8
1
1.2
1.4
2006 2007 2008 2009 2010 2011
Vis
ito
rs' e
xpe
nd
itu
res
(US$
m)
Figure 13. Visitation revenue in SEM
BAU
SEM
Shift from BAU to SEM as
result of increased
investment in TPAs

31
Contribution of the PAs and related ecosystems to Agriculture
• Irrigation water supply (e.g. in Kakheti region)
• Pollination (e.g. citrus around Mtirala NP)
• Climate regulation (e.g. around Mtirala NP)
• Livestock breeding and crops production (e.g. in Tusheti PAs)
• Honey production in the BKNP and MNP support zones
32
Contribution of the PAs to Hydropower
• Many HPPs run on waters originating in PAs or related ecosystems
• GoG has ambitious plans for developing hydropower sector: State Program “Renewable Energy 2008” includes 21 new hydropower projects with total installed capacity of 1,583 MW and generation of 5.5 billion KWh.
•Sustainable watersheds management is indispensable to secure water flow and savings (from avoided replacement costs), and economic benefits from hydropower generation.

33
Contribution of the PAs network to Fresh water supply
•Large amount of freshwater resources are formed on the territories of TPAs, MNP and BKNP,
• E.g. Batumi with 140 000 population and more than 0.5 mlntourists per year receives drinking water from MNP;
• BKNP and related ecosystems provide indispensable natural resource to support a large sub-sector of the economy in Georgia - the bottled spring water industry. IDS Borjomi Georgiabottles 400,000 ~ 500,000 liter (400,000 ~ 500,000 GEL) spring waters of “Borjomi” and “Bakuriani” brands per day.

34
Contribution of the PAs to mineral water industry
• IDS Borjomi Georgia produces 400,000 half liter bottles and 250,000 one liter bottles of “Borjomi” and “Likani” mineral waters per day. The gross value of such production is approximately 26 USD million, and 60-70% of the “Borjomi” mineral water is exported to 30 countries.
Photos: “Borjomi” Water website

35
Contribution of the PAs to Fishery
• Georgia’s abundant water resources are fundamental to sustain marine and
fresh water fish stock
• For example, there are 3 fish farms using waters originating in BKNP. The
market value of 35 tons of fish produced annually is estimated at 207,000 USD
• There are also 30 fish farms in the MNP support zone where 74 people are employed. Total annual production of these farms amounts 142 tons of fish with total market value about 970,000 GEL (584,000 USD).
36
PAs Contribution to poverty alleviation
• PAs and related ecosystems under SEM can contribute to poverty alleviation
and equity.
• There is a range of services linked to the use of natural resources of the PA that
support poverty alleviation such as:
- firewood collection
- non-timber forest products (NTFP),
- bee keeping
- guesthouses, stables,
- livestock breeding
- employment in parks’ administrations.
• For example, gross of these benefits in the MNP support zone are estimated at
3.4 mln GEL (2 mln USD) per year;
• In BKNP support zone total value of collected NTFP is more that 1 mln GEL (0.6
mln USD) per year;

37
Illustrative annual aggregated value of selected sectors
766,8 1 018,2 Estimate
3,1 4,1 Fresh water in Batumi
5,3 7,0 Carbon sequestration BKNP and MNP
20,0 26,6 Borjomi water
77,0 102,2 Hydropower (Energo-Pro)
630,4 837,1 Tourism /Nature-based tourism
13,0 17,3 Livestock / dairy (exports)
17,9 23,8 Wine production (exports)
Euros (Million)USD (Millon)Sectoral output (sample)