Values and Volumes of Lumber Recovered from Mountain Pine ... · Summary In order to estimate the...
22
Forintek Canada Corp. Western Division 2665 East Mall Vancouver, BC V6T 1W5 Values and Volumes of Lumber Recovered from Mountain Pine Beetle Killed Wood by Laszlo Orbay Research Scientist Sawmilling Group Manufacturing Department and Derek Goudie Research Scientist Sawmilling Group Manufacturing Department Prepared for British Columbia Ministry of Forests and Range Revenue Branch, 727 Fisgard Street, Victoria, BC V8W 1R8 March 2006 BC MOF Contract No.: 500626FVT0700 Forintek Reference No.:2006- 5243 Laszlo Orbay Project Leader John Taylor Reviewed Peter Lister Department Manager
Transcript of Values and Volumes of Lumber Recovered from Mountain Pine ... · Summary In order to estimate the...

Forintek Canada Corp. Western Division
2665 East Mall Vancouver, BC
V6T 1W5
Values and Volumes of Lumber Recovered
from Mountain Pine Beetle Killed Wood
by
Laszlo Orbay Research Scientist Sawmilling Group
Manufacturing Department
and Derek Goudie Research Scientist Sawmilling Group
Manufacturing Department
Prepared for
British Columbia Ministry of Forests and Range Revenue Branch, 727 Fisgard Street, Victoria, BC V8W 1R8
March 2006
BC MOF Contract No.: 500626FVT0700 Forintek Reference No.:2006- 5243
Laszlo Orbay Project Leader
John Taylor Reviewed
Peter Lister Department Manager

©2006 Forintek Canada Corp. All rights reserved.
Values and Volumes of Lumber Recovered from Mountain Pine Beetle Killed Wood
©2006 Forintek Canada Corp. All rights reserved. i
Summary In order to estimate the trend in lumber value loss due to blue stain and checks, Forintek’s Optitek sawmill simulation software was used to simulate the conversion of logs from mountain pine beetle (MPB) attacked trees into lumber. Data describing the true-shape of debarked, 5-meter logs was taken from sawmill scanners then modified to represent a range of defects. A “typical” dimension sawmill was modelled in Optitek and a target product mix was created. The processing of 750 logs in five different diameter classes was simulated.
The results of the simulation showed the expected decrease in value recovery as the degree of MPB induced defect increased. In the modelled environment, when logs were processed soon after attack and before checking has occurred (“green attack”), little or no value loss was found. However, when logs are left to dry to the point where checks are numerous and deep, value loss was significant. Value loss was also seen to be more significant for smaller diameter logs.
This work was necessarily limited in scope and scale. The simulation did not consider productivity impacts or losses due to drying defects, nor did it consider the potential impact of innovative technology intended to mitigate losses due to these defects.

Values and Volumes of Lumber Recovered from Mountain Pine Beetle Killed Wood
©2006 Forintek Canada Corp. All rights reserved. ii
Acknowledgements Forintek would like to acknowledge the financial contribution of the British Columbia Ministry of Forests and Range, which made this project possible. The project team would also like to thank members of the Interior MPS Technical Subcommittee, as well as members of Forintek’s MPB Industry Task Force for their valuable assistance. In particular, the authors would like to thank Mr. Barry McKinney, Tolko Industries Ltd, and Mr. Cliff Tuttle, Pope & Talbot Inc., for their valuable advice and guidance regarding the simulation model parameters
Values and Volumes of Lumber Recovered from Mountain Pine Beetle Killed Wood
©2006 Forintek Canada Corp. All rights reserved. iii
Table of Contents
Summary......................................................................................................................................................................... i
Acknowledgements........................................................................................................................................................ ii
Table of Contents.......................................................................................................................................................... iii
List of Tables................................................................................................................................................................. iv
List of Figures ............................................................................................................................................................ iv
1 Introduction......................................................................................................................................................1
2 Objectives ........................................................................................................................................................1
3 Staff .................................................................................................................................................................1
4 Procedures and Results ..................................................................................................................................1 4.1 Log Data............................................................................................................................................1 4.2 Sawmill configuration.........................................................................................................................5 4.3 Targeted product mix ........................................................................................................................6 4.4 Yields by damage level and diameter group .....................................................................................7
4.4.1 Diameter class 1 .................................................................................................................7 4.4.2 Diameter class 2 .................................................................................................................8 4.4.3 Diameter class 3 .................................................................................................................9 4.4.4 Diameter class 4 ...............................................................................................................10 4.4.5 Diameter class 5 ...............................................................................................................11 4.4.6 Discussion of results .........................................................................................................12
5 Conclusions and Recommendations .............................................................................................................14
Appendix I Lumber prices by size and grade ..............................................................................................................15

Values and Volumes of Lumber Recovered from Mountain Pine Beetle Killed Wood
©2006 Forintek Canada Corp. All rights reserved. iv
List of Tables Table 1: Damage level groupings .......................................................................................................... 3 Table 2: Shape characteristics of logs. .................................................................................................. 4 Table 3: Grades and specifications for lumber produced by the OPTITEK model ............................... 6 Table 4: Diameter class 1; damage impact............................................................................................ 7 Table 5: Diameter class 2; damage impact............................................................................................ 8 Table 6: Diameter class 3; damage impact............................................................................................ 9 Table 7: Diameter class 4; damage impact.......................................................................................... 10 Table 8: Diameter class 5; damage impact.......................................................................................... 11
List of Figures Figure 1: Check depth, length and spirality............................................................................................. 4 Figure 2: Sawmill layout.......................................................................................................................... 5 Figure 3: Value recovery by damage level for diameter class 1.............................................................. 7 Figure 4: Value recovery by damage level for diameter class 2.............................................................. 8 Figure 5: Value recovery by damage level for diameter class 3.............................................................. 9 Figure 6: Value recovery by damage level for diameter class 4............................................................ 10 Figure 7: Value recovery by damage level for diameter class 5............................................................ 11 Figure 8: Value recovery by damage level ............................................................................................ 13 Figure 9: Value recovery loss as percent of healthy log........................................................................ 13

Values and Volumes of Lumber Recovered from Mountain Pine Beetle Killed Wood
© 2006Forintek Canada Corp. All rights reserved. 1 of 16
1 Introduction Logs cut from trees that have been attacked by the mountain pine beetle (MPB) have two main defects that have a negative impact on quality and value of the lumber produced: blue stain and checks. The blue stain develops quickly in the sapwood after MPB attack, while checking develops after tree death as the moisture content (MC) falls below the fibre saturation point (approximately 30%). Sawmill performance measures, including lumber volume recovery and lumber grade yields are known to decrease with increasing levels of log degrade. However, information on the nature of this relationship is not readily available. In this study Forintek’s sawmill simulation program, Optitek, was used to estimate lumber volume and grade yields from classes of logs grouped according to the degree of MPB induced damage.
2 Objectives To estimate the trend in lumber value loss from blue stain and checks in a typical BC interior sawmill processing logs from lodgepole pine trees that have been attacked by the MPB.
3 Staff • Laszlo Orbay, Research Scientist, Sawmilling Group, Forintek Canada Corp.
• Ron Neissen, Software Developer, Forintek Canada Corp.
• Derek Goudie, Research Scientist, Sawmilling Group, Forintek Canada Corp.
4 Procedures and Results Forintek’s Optitek sawmill simulation software was used to simulate the conversion of logs from MPB attacked trees into lumber. Optitek uses three input files. The log file describes the resource to be processed, the sawmill file details all of the equipment used to convert the logs to rough green lumber, and the product file describes all of the product options the mill has, along with associated wane allowances and rough green values.
4.1 Log Data The log data files used in this project were based on true-shape measurements of 150 debarked, 5-meter logs taken from sawmill scanners and grouped into five size classes based on small end diameter. The five diameter classes were 10-15-cm, 15-20-cm, 20-25-cm, 25-30-cm and greater than 30-cm. Generation of the log data file thus began with thirty unique logs in each of the five diameter classes. These logs had no MPB induced defect and represented a baseline of healthy logs.

Values and Volumes of Lumber Recovered from Mountain Pine Beetle Killed Wood
© 2006Forintek Canada Corp. All rights reserved. 2 of 16
Data files for each log were then modified by inserting different levels of MPB induced defects, namely bluestain and checks, into the logs. This approach had several advantages over using actual log data. First and most importantly, it allowed the influence of the MPB induced defects to be evaluated independently from the influence of the log shape characteristics. This is important because lumber recovery is highly dependent on log diameter, taper and sweep. Secondly, it allowed the severity of the defects to be easily varied thus providing an indication of how the magnitude of the defects affected lumber value outturns. The characteristics of the defects inserted into the logs were based on measurements of actual MPB attacked logs. These measurements were from several sources and included data from Forintek members and from other Forintek projects. Thus, although the defects inserted into the logs were artificial, they were accurate representations of what would be expected in actual MPB attacked logs. Four levels of defects were created from each log resulting in five distinct damage level groupings. The groupings were designed to represent increasing levels of MPB defects between the two extremes of fresh green logs with no defects, and dry logs with blue stain and heavy checks. The five damage groupings were coded as follows:
• “H” Healthy green logs with no MPB related defects • “OST” Green logs with blue stain but no checks • “A” Dry logs with blue stain and light checking • “B” Dry logs with blue stain and medium checking • “C” Dry logs with blue stain and heavy checking
Thus the “OST” group represented MPB logs commonly called “green attack”, while the “A”, “B” and “C” groups represented dry MPB logs with increasing levels of defects ranging from “red attack” to “gray attack.” With five diameter classes and five damage level groupings within each diameter class, there were 25 distinct groups of logs. Each group contained 30 logs, so in total 750 logs were used in the simulation. Detailed information describing defects and their parameters for each of the five damage level groupings is provided in Table 1. Figure 2 shows how the depth, length and spirality of checks are evaluated.

Values and Volumes of Lumber Recovered from Mountain Pine Beetle Killed Wood
© 2006Forintek Canada Corp. All rights reserved. 3 of 16
Table 1: Damage level groupings
Damage level group Defect parameter
H OST A B C
Blue stain No stain Sapwood 100% stained; sapwood depth (cm) estimated from section diameter, D, as follows: SW = 2.484 + 0.045*D, where D is measured in cm.
Number of major checks 0 0 1 1-3 3-4
Check length, as % of log length n/a n/a 20-40 30-60 50-100
Check width, mm n/a n/a 2-3 3-5 4-8
Check depth, as % of radius n/a n/a -74.3682 + 3.61031*W + 1.04516*D - 0.00158*D, where
D is the log diameter measured in cm.
Location of check start, % of log length measured from large end.
n/a n/a (0-MaxAllowable)*(100 - Length%) /2
(0-MaxAllowable)* (100 - Length%)/2
(0-MaxAllowable)* (100 - Length%)/2
Check spirality, (degrees / meter)
A - 90% of logs, 0 – 18 deg/m; 10% of logs, 18 – 45 deg/m B - 60% of logs, 0 – 18 deg/m; 40% of logs, 18 – 45 deg/m C - 30% of logs, 0 – 18 deg/m; 70% of logs, 18 – 45 deg/m
The logs were also selected to represent a typical range of sweep and taper characteristics, and also more importantly, a typical range of diameters. Table 2 shows shape characteristics of the logs used in the simulation by diameter class.

Values and Volumes of Lumber Recovered from Mountain Pine Beetle Killed Wood
© 2006Forintek Canada Corp. All rights reserved. 4 of 16
Table 2: Shape characteristics of logs.
Diam. Class Average
Small-End Diameter
(cm)
Average Large-End Diameter
(cm)
Average Sweep (cm/m)
Average Taper (cm/m)
Average Volume
(dm3)
1 13.0 19.0 0.05 1.21 105
2 17.5 22.2 0.04 0.94 154
3 22.2 26.9 0.04 0.96 237
4 27.4 31.7 0.04 0.87 347
5 33.1 38.4 0.03 1.05 514
Figure 1: Check depth, length and spirality
Values and Volumes of Lumber Recovered from Mountain Pine Beetle Killed Wood
© 2006Forintek Canada Corp. All rights reserved. 5 of 16
4.2 Sawmill configuration Although every sawmill is unique, the great majority of MPB sawlogs are processed in mills that use similar equipment and technology, as well as similar processing strategies and tactics. A “typical” BC interior sawmill was modelled in Optitek based on the project team’s experience and understanding of the equipment and systems commonly in use in BC sawmills today. During mill model development, the project team received input from the Interior MPS Technical Subcommittee and also from Forintek’s MPB Industry Task Force, a group of individuals invited to assist on an ongoing basis in the development of Forintek’s MPB research program as it relates to lumber manufacturing issues.
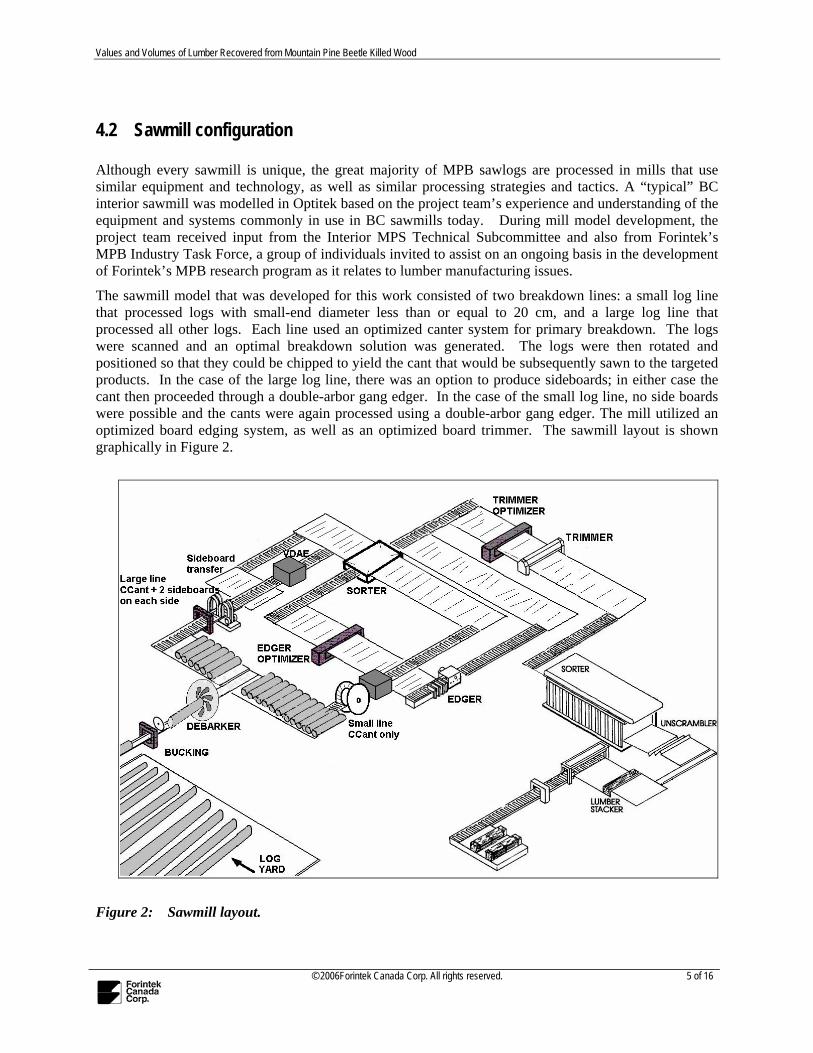
The sawmill model that was developed for this work consisted of two breakdown lines: a small log line that processed logs with small-end diameter less than or equal to 20 cm, and a large log line that processed all other logs. Each line used an optimized canter system for primary breakdown. The logs were scanned and an optimal breakdown solution was generated. The logs were then rotated and positioned so that they could be chipped to yield the cant that would be subsequently sawn to the targeted products. In the case of the large log line, there was an option to produce sideboards; in either case the cant then proceeded through a double-arbor gang edger. In the case of the small log line, no side boards were possible and the cants were again processed using a double-arbor gang edger. The mill utilized an optimized board edging system, as well as an optimized board trimmer. The sawmill layout is shown graphically in Figure 2.
Figure 2: Sawmill layout.
Values and Volumes of Lumber Recovered from Mountain Pine Beetle Killed Wood
© 2006Forintek Canada Corp. All rights reserved. 6 of 16
The sawmill used in this simulation study does not use innovative or emerging technologies that are presently being developed in order to mitigate value and volume losses associated with producing lumber from MPB attacked fibre. Such developing technologies include scanners that can detect MPB induced defects such as stain and checks, and optimisers that will generate breakdown solutions that minimize the impact of said defects. It is expected that vendors will soon begin to market these integrated systems; however, at this point in time, such technologies are unproven. Although Optitek is already capable of simulating advanced scanning and optimizing systems, such simulations would not accurately indicate value and volume recoveries that are presently attainable.
4.3 Targeted product mix The targeted product mix used in the simulations was also based on the output of a “typical” BC interior sawmill. Products were selected in consultation with representatives from the Interior MPS Technical Subcommittee and Forintek’s MPB Industry Task Force and included dimension lumber with a nominal thickness of 2 inches and nominal widths of 3-, 4-, 6-, 8-, and 10-inches. All lumber was produced in lengths ranging from 8-feet to 16-feet in 2-foot increments. Also included was an export, appearance grade product (J-grade) and a machine strength-rated grade (MSR).
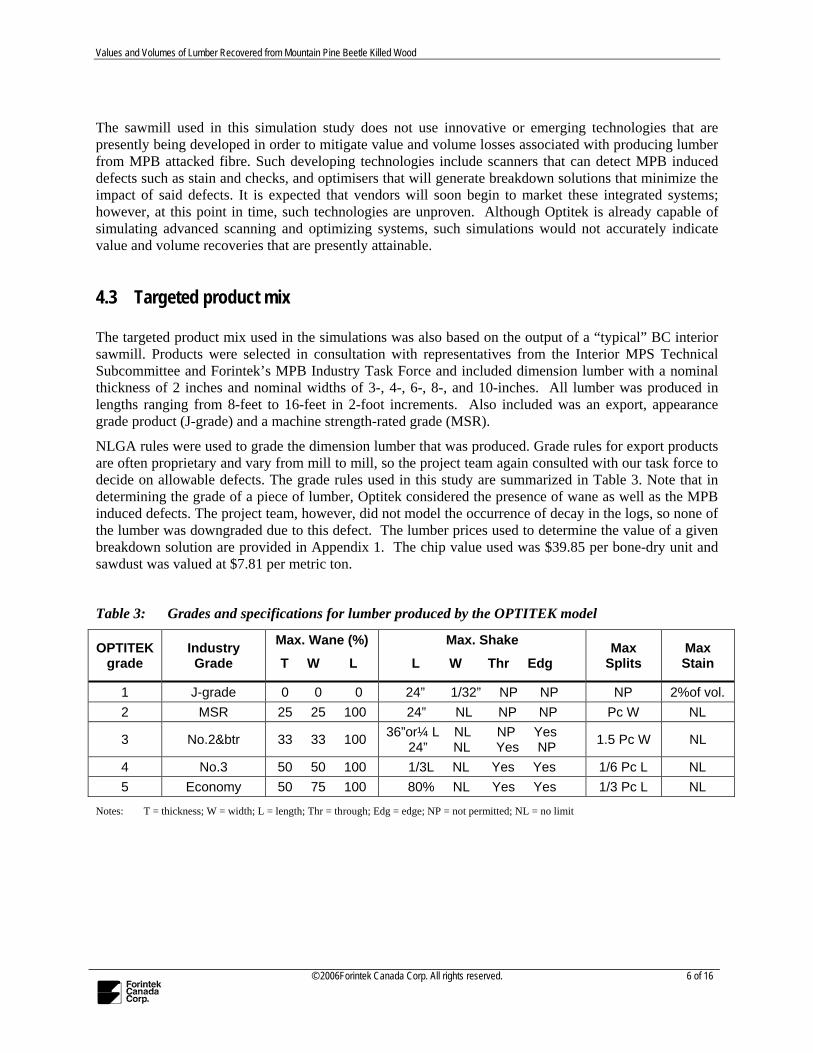
NLGA rules were used to grade the dimension lumber that was produced. Grade rules for export products are often proprietary and vary from mill to mill, so the project team again consulted with our task force to decide on allowable defects. The grade rules used in this study are summarized in Table 3. Note that in determining the grade of a piece of lumber, Optitek considered the presence of wane as well as the MPB induced defects. The project team, however, did not model the occurrence of decay in the logs, so none of the lumber was downgraded due to this defect. The lumber prices used to determine the value of a given breakdown solution are provided in Appendix 1. The chip value used was $39.85 per bone-dry unit and sawdust was valued at $7.81 per metric ton.
Table 3: Grades and specifications for lumber produced by the OPTITEK model
OPTITEK grade
Industry Grade
Max. Wane (%)
T W L
Max. Shake
L W Thr Edg Max
Splits Max Stain
1 J-grade 0 0 0 24” 1/32” NP NP NP 2%of vol. 2 MSR 25 25 100 24” NL NP NP Pc W NL
3 No.2&btr 33 33 100 36”or¼ L NL NP Yes 24” NL Yes NP 1.5 Pc W NL
4 No.3 50 50 100 1/3L NL Yes Yes 1/6 Pc L NL 5 Economy 50 75 100 80% NL Yes Yes 1/3 Pc L NL
Notes: T = thickness; W = width; L = length; Thr = through; Edg = edge; NP = not permitted; NL = no limit
Values and Volumes of Lumber Recovered from Mountain Pine Beetle Killed Wood
© 2006Forintek Canada Corp. All rights reserved. 7 of 16
4.4 Yields by damage level and diameter group
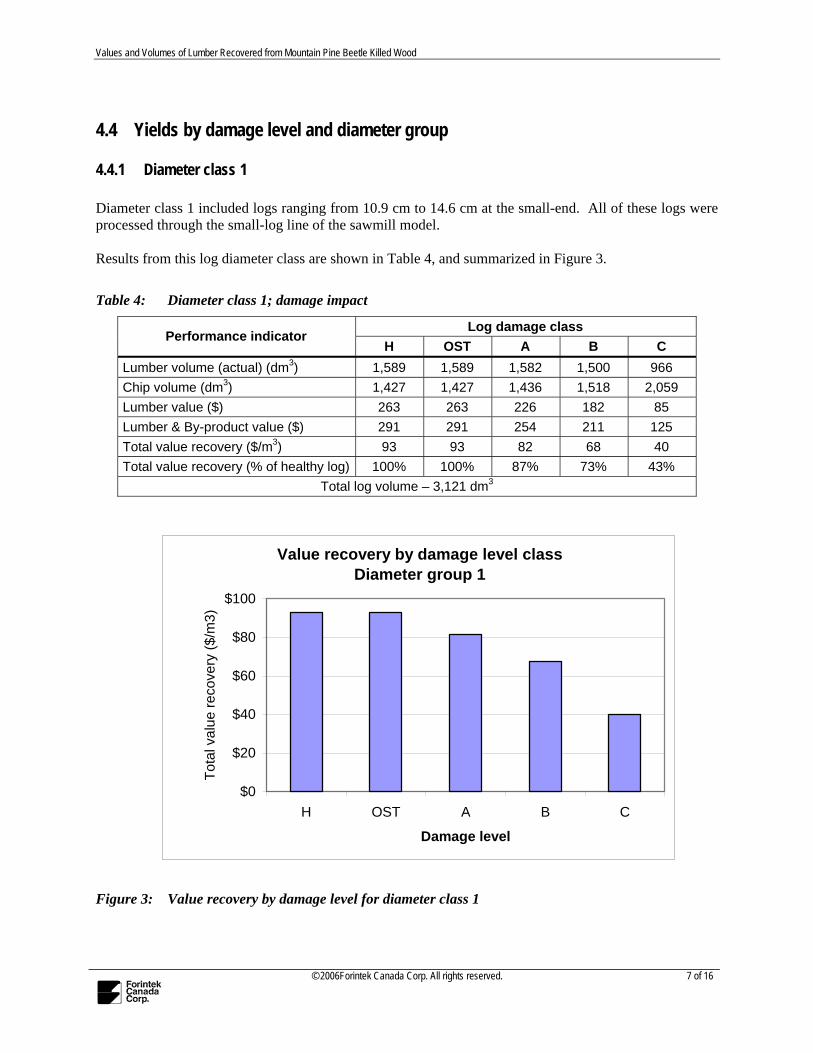
4.4.1 Diameter class 1 Diameter class 1 included logs ranging from 10.9 cm to 14.6 cm at the small-end. All of these logs were processed through the small-log line of the sawmill model. Results from this log diameter class are shown in Table 4, and summarized in Figure 3.
Table 4: Diameter class 1; damage impact
Log damage class Performance indicator
H OST A B C Lumber volume (actual) (dm3) 1,589 1,589 1,582 1,500 966 Chip volume (dm3) 1,427 1,427 1,436 1,518 2,059 Lumber value ($) 263 263 226 182 85 Lumber & By-product value ($) 291 291 254 211 125 Total value recovery ($/m3) 93 93 82 68 40 Total value recovery (% of healthy log) 100% 100% 87% 73% 43%
Total log volume – 3,121 dm3
Value recovery by damage level classDiameter group 1
$0
$20
$40
$60
$80
$100
H OST A B C
Damage level
Tota
l val
ue re
cove
ry ($
/m3)
Figure 3: Value recovery by damage level for diameter class 1

Values and Volumes of Lumber Recovered from Mountain Pine Beetle Killed Wood
© 2006Forintek Canada Corp. All rights reserved. 8 of 16
4.4.2 Diameter class 2 Diameter class 2 included logs ranging from 15.0 cm to 19.7 cm at the small-end. All of these logs were processed through the small-log line of the sawmill model. Results from this log diameter class are shown in Table 5, and summarized in Figure 4.
Table 5: Diameter class 2; damage impact
Log damage class Performance indicator
H OST A B C
Lumber volume (actual) (dm3) 2,722 2,722 2,715 2,654 1,769
Chip volume (dm3) 1,677 1,677 1,689 1,741 2,618
Lumber value ($) 446 445 394 301 140
Lumber & By-product value ($) 479 478 427 336 192
Total value recovery ($/m3) 104 104 93 73 42
Total value recovery (% of healthy log) 100% 100% 89% 70% 40%
Total log volume – 4,603 dm3
Value recovery by damage level classDiameter group 2
$0
$20
$40
$60
$80
$100
$120
H OST A B C
Damage level
Tota
l val
ue re
cove
ry,
$/m
3
Figure 4: Value recovery by damage level for diameter class 2

Values and Volumes of Lumber Recovered from Mountain Pine Beetle Killed Wood
© 2006Forintek Canada Corp. All rights reserved. 9 of 16
4.4.3 Diameter class 3 Diameter class 3 included logs ranging from 20.0 cm to 24.7 cm at the small-end. All of these logs were processed through the large-log line of the sawmill model. Results from this log diameter class are shown in Table 6, and summarized in Figure 5.
Table 6: Diameter class 3; damage impact
Log damage class Performance indicator
H OST A B C
Lumber volume (actual) (dm3) 4,361 4,361 4,316 4,129 3,057 Chip volume (dm3) 2,270 2,270 2,324 2,506 3,580 Lumber value ($) 736 735 653 469 279 Lumber & By-product value ($) 782 780 699 519 350 Total value recovery ($/m3) 110 110 99 73 49 Total value recovery (% of healthy log) 100% 100% 89% 66% 45%
Total log volume – 7,087 dm3
Value recovery by damage level classDiameter group 3
$0
$20
$40
$60
$80
$100
$120
H OST A B C
Damage level
Tota
l val
ue re
cove
ry, $
/m3
Figure 5: Value recovery by damage level for diameter class 3
Values and Volumes of Lumber Recovered from Mountain Pine Beetle Killed Wood
© 2006Forintek Canada Corp. All rights reserved. 10 of 16
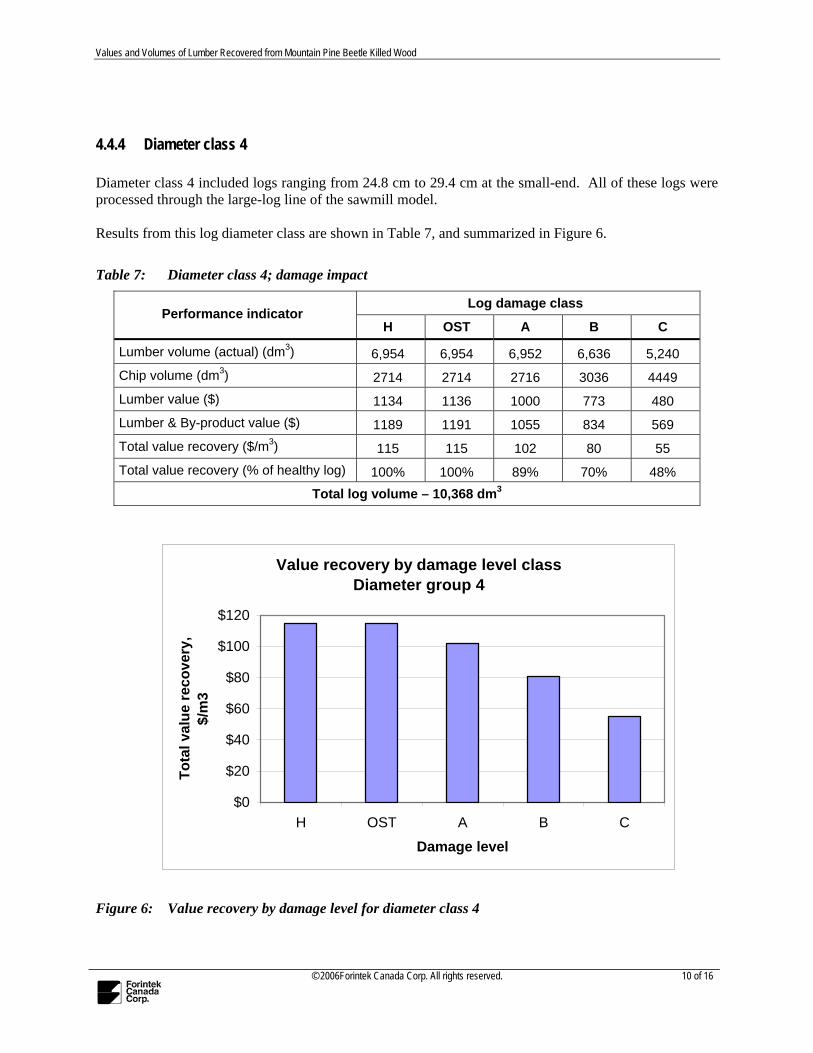
4.4.4 Diameter class 4 Diameter class 4 included logs ranging from 24.8 cm to 29.4 cm at the small-end. All of these logs were processed through the large-log line of the sawmill model. Results from this log diameter class are shown in Table 7, and summarized in Figure 6.
Table 7: Diameter class 4; damage impact
Log damage class Performance indicator
H OST A B C
Lumber volume (actual) (dm3) 6,954 6,954 6,952 6,636 5,240 Chip volume (dm3) 2714 2714 2716 3036 4449 Lumber value ($) 1134 1136 1000 773 480 Lumber & By-product value ($) 1189 1191 1055 834 569 Total value recovery ($/m3) 115 115 102 80 55 Total value recovery (% of healthy log) 100% 100% 89% 70% 48%
Total log volume – 10,368 dm3
Value recovery by damage level classDiameter group 4
$0
$20
$40
$60
$80
$100
$120
H OST A B C
Damage level
Tota
l val
ue re
cove
ry,
$/m
3
Figure 6: Value recovery by damage level for diameter class 4

Values and Volumes of Lumber Recovered from Mountain Pine Beetle Killed Wood
© 2006Forintek Canada Corp. All rights reserved. 11 of 16
4.4.5 Diameter class 5 Diameter class 5 included logs ranging from 30.1 cm to 39.0 cm at the small-end. All of these logs were processed through the large-log line of the sawmill model. Results from this log diameter class are shown in Table 8, and summarized in Figure 7.
Table 8: Diameter class 5; damage impact
Log damage class Performance indicator
H OST A B C
Lumber volume (actual) (dm3) 10,785 10,785 10,702 10,640 9,632
Chip volume (dm3) 3611 3611 3694 3755 4761
Lumber value ($) 1687 1688 1536 1327 939
Lumber & By-product value ($) 1761 1761 1611 1403 1035
Total value recovery ($/m3) 115 115 105 91 67
Total value recovery (% of healthy log) 100% 100% 91% 80% 59%
Total log volume – 15,340 dm3
Value recovery by damage level classDiameter group 5
$0
$20
$40
$60
$80
$100
$120
$140
H OST A B C
Damage level
Tota
l val
ue re
cove
ry,
$/m
3
Figure 7: Value recovery by damage level for diameter class 5
Values and Volumes of Lumber Recovered from Mountain Pine Beetle Killed Wood
© 2006Forintek Canada Corp. All rights reserved. 12 of 16
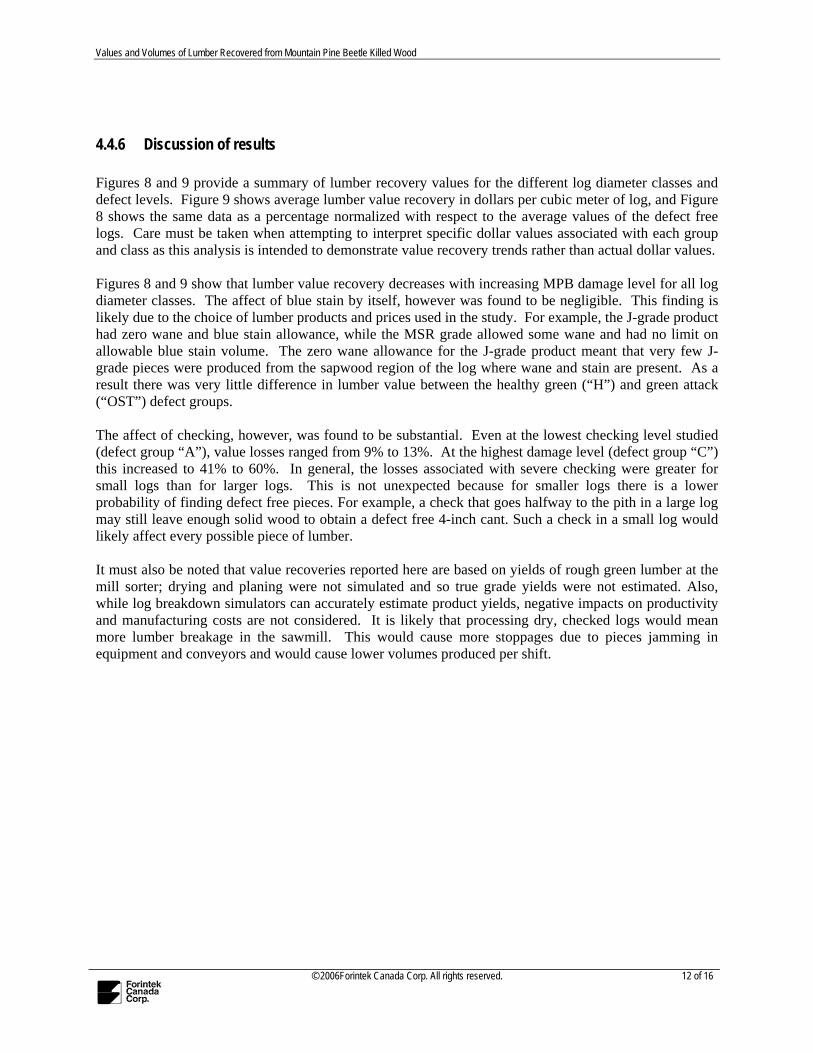
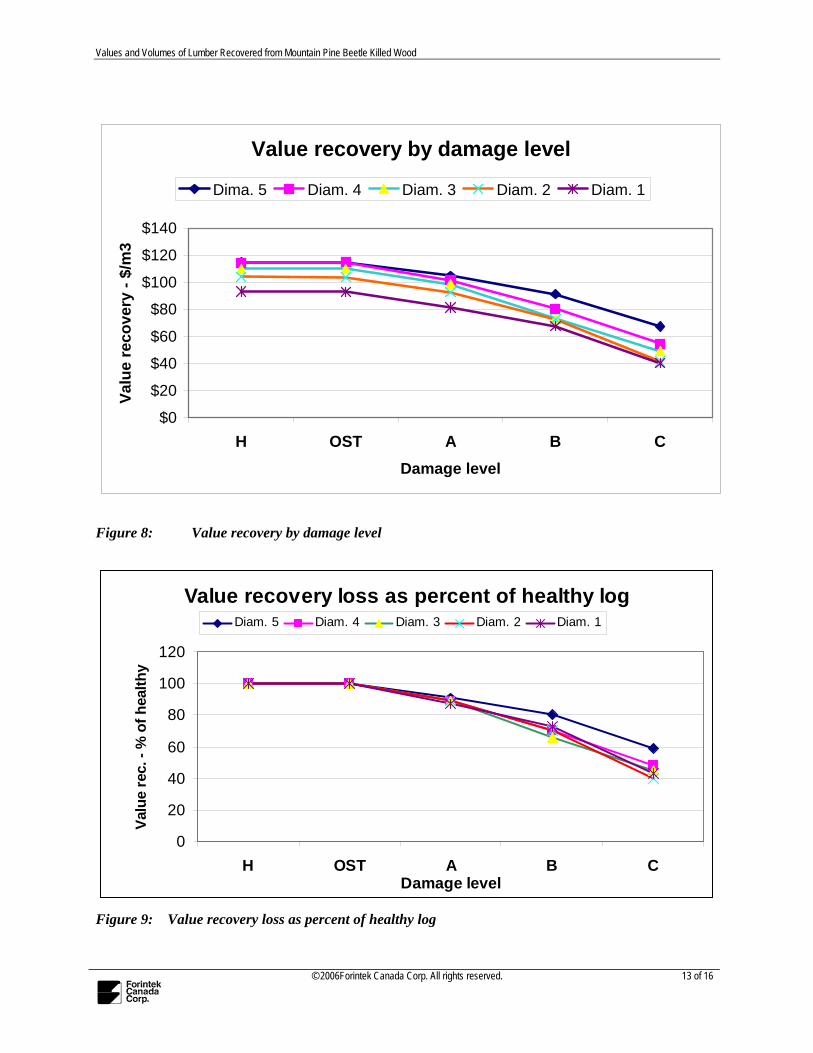
4.4.6 Discussion of results Figures 8 and 9 provide a summary of lumber recovery values for the different log diameter classes and defect levels. Figure 9 shows average lumber value recovery in dollars per cubic meter of log, and Figure 8 shows the same data as a percentage normalized with respect to the average values of the defect free logs. Care must be taken when attempting to interpret specific dollar values associated with each group and class as this analysis is intended to demonstrate value recovery trends rather than actual dollar values. Figures 8 and 9 show that lumber value recovery decreases with increasing MPB damage level for all log diameter classes. The affect of blue stain by itself, however was found to be negligible. This finding is likely due to the choice of lumber products and prices used in the study. For example, the J-grade product had zero wane and blue stain allowance, while the MSR grade allowed some wane and had no limit on allowable blue stain volume. The zero wane allowance for the J-grade product meant that very few J-grade pieces were produced from the sapwood region of the log where wane and stain are present. As a result there was very little difference in lumber value between the healthy green (“H”) and green attack (“OST”) defect groups. The affect of checking, however, was found to be substantial. Even at the lowest checking level studied (defect group “A”), value losses ranged from 9% to 13%. At the highest damage level (defect group “C”) this increased to 41% to 60%. In general, the losses associated with severe checking were greater for small logs than for larger logs. This is not unexpected because for smaller logs there is a lower probability of finding defect free pieces. For example, a check that goes halfway to the pith in a large log may still leave enough solid wood to obtain a defect free 4-inch cant. Such a check in a small log would likely affect every possible piece of lumber. It must also be noted that value recoveries reported here are based on yields of rough green lumber at the mill sorter; drying and planing were not simulated and so true grade yields were not estimated. Also, while log breakdown simulators can accurately estimate product yields, negative impacts on productivity and manufacturing costs are not considered. It is likely that processing dry, checked logs would mean more lumber breakage in the sawmill. This would cause more stoppages due to pieces jamming in equipment and conveyors and would cause lower volumes produced per shift.
Values and Volumes of Lumber Recovered from Mountain Pine Beetle Killed Wood
© 2006Forintek Canada Corp. All rights reserved. 13 of 16
Value recovery by damage level
$0
$20
$40
$60
$80
$100
$120
$140
H OST A B CDamage level
Valu
e re
cove
ry -
$/m
3
Dima. 5 Diam. 4 Diam. 3 Diam. 2 Diam. 1
Figure 8: Value recovery by damage level
Value recovery loss as percent of healthy log
0
20
40
60
80
100
120
H OST A B CDamage level
Valu
e re
c. -
% o
f hea
lthy
Diam. 5 Diam. 4 Diam. 3 Diam. 2 Diam. 1
Figure 9: Value recovery loss as percent of healthy log
Values and Volumes of Lumber Recovered from Mountain Pine Beetle Killed Wood
© 2006Forintek Canada Corp. All rights reserved. 14 of 16
5 Conclusions and Recommendations This simulation study has yielded data demonstrating the trend in lumber value loss from logs with increasing levels of damage caused by MPB attack. Relative losses resulting from blue stain and checks in a typical sawmill processing logs from MPB attacked timber have been shown and the marked decreases in recovery from logs with increasing degrees of MPB induced defect are highlighted. The study has also shown that the impact of MPB induced defect is greater for small logs than for larger ones. These results were expected and, in general, highlight the trend of decreasing log value with increasing degree of MPB induced defect
The study results suggest that blue stain has very little impact on the overall value of the products cut from MPB affected logs. However, care must be taken when interpreting this result. As noted, grade rules for export products such as J-grade are often proprietary and vary from mill to mill. Only one J-grade product was included here, a square-edged product that permitted no wane. This meant that even in healthy logs, very little of the J-grade produced came from the sapwood region where pieces are more likely to have wane. It is likely that if a wider range of export products was included in the targeted product mix, the impact of blue stain on log value would have been more pronounced.
Checking had the most impact on value losses and these losses increased with the severity of the checks. At the lowest checking level considered value losses ranged from 9% to 13%. This increased to 41% to 60% for the highest checking level case. The affect of severe checking was also dependent on log diameter class. For the largest log diameter class, the most severe checks resulted in losses of about 40%, but this increased to almost 60% for the smallest diameter class.
As stated, the simulation modelled a “typical” BC interior mill and did not consider new and emerging technology that has been recently developed for processing MPB affected logs. Such technologies include scanners, optimisers and machinery that detect MPB induced defects and orient logs or boards to mitigate the impact of the defects. Although the Optitek model represents the kind of mill that processes the great majority of lodgepole pine in the province, it may be worth considering different sawmill configurations and technology mixes in future simulation studies.
It must also be noted that value recoveries reported here are based on yields of rough green lumber at the mill sorter; drying and planing were not simulated and so true grade yields were not estimated. Also, while log breakdown simulators can accurately estimate product yields, negative impacts on productivity and manufacturing costs are not considered. It is likely that processing dry, checked logs would mean more breakage in the sawmill, resulting in more stoppages due to pieces jamming in equipment and conveyors; total volumes produced per shift would thus be lower. This would also result in increased wear and tear on equipment.
The modeling tool used here is ideally suited for identifying trends that result from varying a particular parameter while holding others constant. However, it must be emphasized again that this work does not allow specific value or volume losses associated with MPB induced defects to be inferred. More detailed simulation work modeling a particular operating facility or facilities may be warranted, as may field studies to demonstrate the extent to which recoveries vary as a function of sawmill configuration and processing strategies and tactics.

Values and Volumes of Lumber Recovered from Mountain Pine Beetle Killed Wood
© 2006Forintek Canada Corp. All rights reserved. 15 of 16
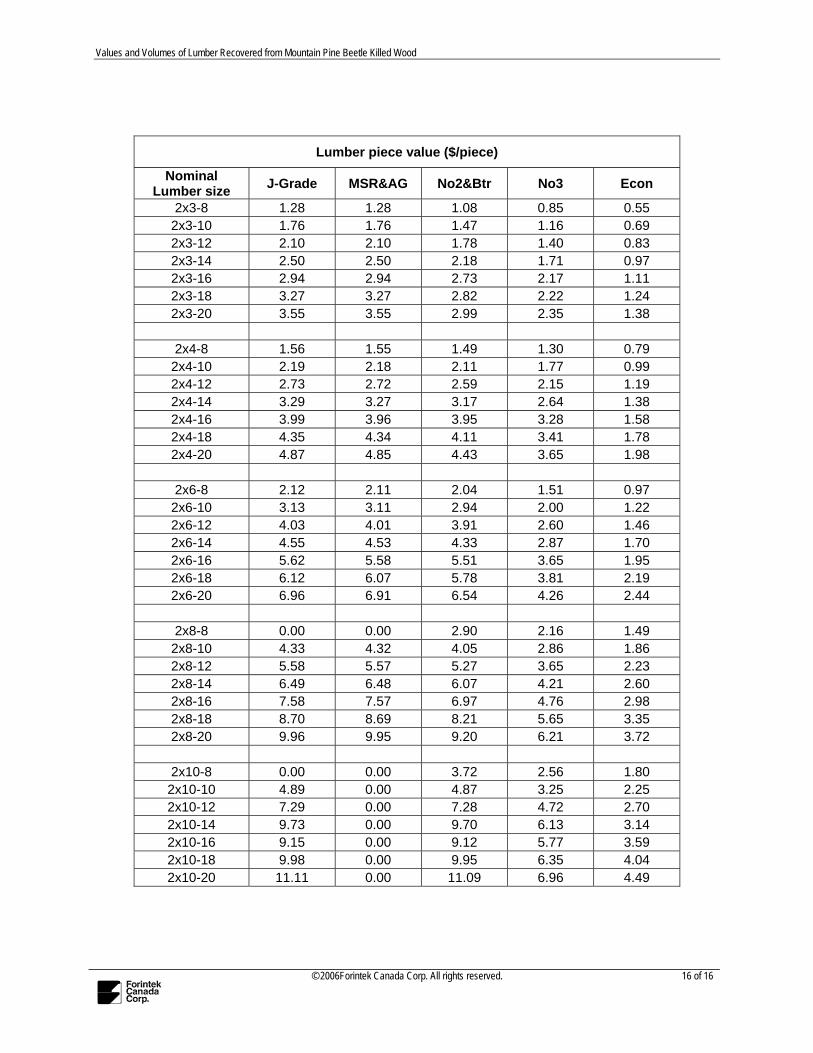
Appendix I
Lumber prices by size and grade
Values and Volumes of Lumber Recovered from Mountain Pine Beetle Killed Wood
© 2006Forintek Canada Corp. All rights reserved. 16 of 16
Lumber piece value ($/piece)
Nominal Lumber size J-Grade MSR&AG No2&Btr No3 Econ
2x3-8 1.28 1.28 1.08 0.85 0.55 2x3-10 1.76 1.76 1.47 1.16 0.69 2x3-12 2.10 2.10 1.78 1.40 0.83 2x3-14 2.50 2.50 2.18 1.71 0.97 2x3-16 2.94 2.94 2.73 2.17 1.11 2x3-18 3.27 3.27 2.82 2.22 1.24 2x3-20 3.55 3.55 2.99 2.35 1.38
2x4-8 1.56 1.55 1.49 1.30 0.79
2x4-10 2.19 2.18 2.11 1.77 0.99 2x4-12 2.73 2.72 2.59 2.15 1.19 2x4-14 3.29 3.27 3.17 2.64 1.38 2x4-16 3.99 3.96 3.95 3.28 1.58 2x4-18 4.35 4.34 4.11 3.41 1.78 2x4-20 4.87 4.85 4.43 3.65 1.98
2x6-8 2.12 2.11 2.04 1.51 0.97
2x6-10 3.13 3.11 2.94 2.00 1.22 2x6-12 4.03 4.01 3.91 2.60 1.46 2x6-14 4.55 4.53 4.33 2.87 1.70 2x6-16 5.62 5.58 5.51 3.65 1.95 2x6-18 6.12 6.07 5.78 3.81 2.19 2x6-20 6.96 6.91 6.54 4.26 2.44
2x8-8 0.00 0.00 2.90 2.16 1.49
2x8-10 4.33 4.32 4.05 2.86 1.86 2x8-12 5.58 5.57 5.27 3.65 2.23 2x8-14 6.49 6.48 6.07 4.21 2.60 2x8-16 7.58 7.57 6.97 4.76 2.98 2x8-18 8.70 8.69 8.21 5.65 3.35 2x8-20 9.96 9.95 9.20 6.21 3.72
2x10⁻⁸ 0.00 0.00 3.72 2.56 1.80 2x10⁻¹⁰ 4.89 0.00 4.87 3.25 2.25 2x10-12 7.29 0.00 7.28 4.72 2.70 2x10-14 9.73 0.00 9.70 6.13 3.14 2x10-16 9.15 0.00 9.12 5.77 3.59 2x10-18 9.98 0.00 9.95 6.35 4.04 2x10-20 11.11 0.00 11.09 6.96 4.49