ValuEngine Weekly: Tech Stocks, Cigna, Chinese Reports, and ValuEngine Capital
Upload
valuenginecomCategory
view
5download
0description
June 27, 2014
If you no longer wish to receive this free newsletter, CLICK HERE to unsubscribe
The ValuEngine Weekly is an Investor Education newsletter focused on the quantitative approach toinvesting and the tools available from In today's fast-moving and globalized financial markets, it is easy to
get overloaded with information. The winners will adopt an objective, scientific, independent andunemotional approach to investing. If you are not yet a member of ValuEngine's stock analysis service,
sign up now for a two-week free trial at www.valuengine.com!
VALUATION WARNING: Our models find that overvaluation is at levels typically seen when market pullbacks occur. Overvalued stocks now makeup 75% of our stocks assigned a valuation and 34% of those equities are calculated to be overvalued by 20% or more. ALL sectors are calculated tobe overvalued--fourteen by double digits.
MARKET OVERVIEW
Index Started week Friday AM Change Change % ytd
DJIA 16946.5 16828.8 -117.7 -0.69% 1.52%
NASDAQ 4368.96 4382.01 13.05 0.30% 4.92%
RUSSELL 2000 1189.47 1181.54 -7.93 -0.67% 1.54%
S&P 500 1962.92 1956.83 -6.09 -0.31% 5.87%
Summary of VE Stock UniverseStocks Undervalued 24.85%
Stocks Overvalued 75.15%
Stocks Undervalued by 20% 7.77%
Stocks Overvalued by 20% 34.00%

SECTOR OVERVIEW
Sector Change MTD YTD Valuation Last 12-MReturn
P/ERatio
Aerospace -0.36% -0.17% 1.89% 12.34% overvalued 36.99% 19.95
Auto-Tires-Trucks -0.24% 1.91% 5.93% 22.16% overvalued 31.07% 17.08
Basic Materials -0.18% 4.11% 5.25% 5.33% overvalued 14.68% 27.3
Business Services -0.54% 1.74% -0.49% 10.92% overvalued 30.21% 26.64
Computer and Technology 0.10% 3.90% 4.65% 16.84% overvalued 23.89% 31.81
Construction 0.59% 2.28% 2.81% 6.73% overvalued 23.79% 24.18
Consumer Discretionary -0.12% 1.36% -2.69% 12.83% overvalued 24.10% 29.11
Consumer Staples -0.40% 0.70% 4.00% 19.49% overvalued 26.07% 24.17
Finance -0.04% 1.63% 3.32% 13.31% overvalued 15.81% 18.12
Industrial Products -0.11% 3.02% 1.35% 13.87% overvalued 25.73% 23.65
Medical -0.20% 4.09% 10.60% 21.35% overvalued 39.51% 29.25
Multi-Sector Conglomerates 0.42% 2.13% 4.28% 18.67% overvalued 20.92% 20.79
Oils-Energy 0.29% 4.60% 12.28% 18.59% overvalued 31.01% 30.47
Retail-Wholesale -0.01% 1.07% -3.61% 11.50% overvalued 13.58% 25.47
Transportation -0.13% 1.81% 5.52% 23.17% overvalued 36.61% 24.65
Utilities 0.04% 2.82% 8.12% 14.05% overvalued 25.76% 21.21
ValuEngine Newsletters Latest Results
VE Newsletter Current Month Total S&P 500 Last Month Total S&P 500 SinceInception
S&P500
Forecast MNS 1.59 1.12 -3.98 2.80 86.33 112.12
Dividend Stock -0.55 -0.16 5.18 3.71 21.75 26.43
Small Cap Stock -0.65 0.00 4.23 3.78 31.83 41.29
View 2.84 0.90 9.23 3.69 119.65 71.48
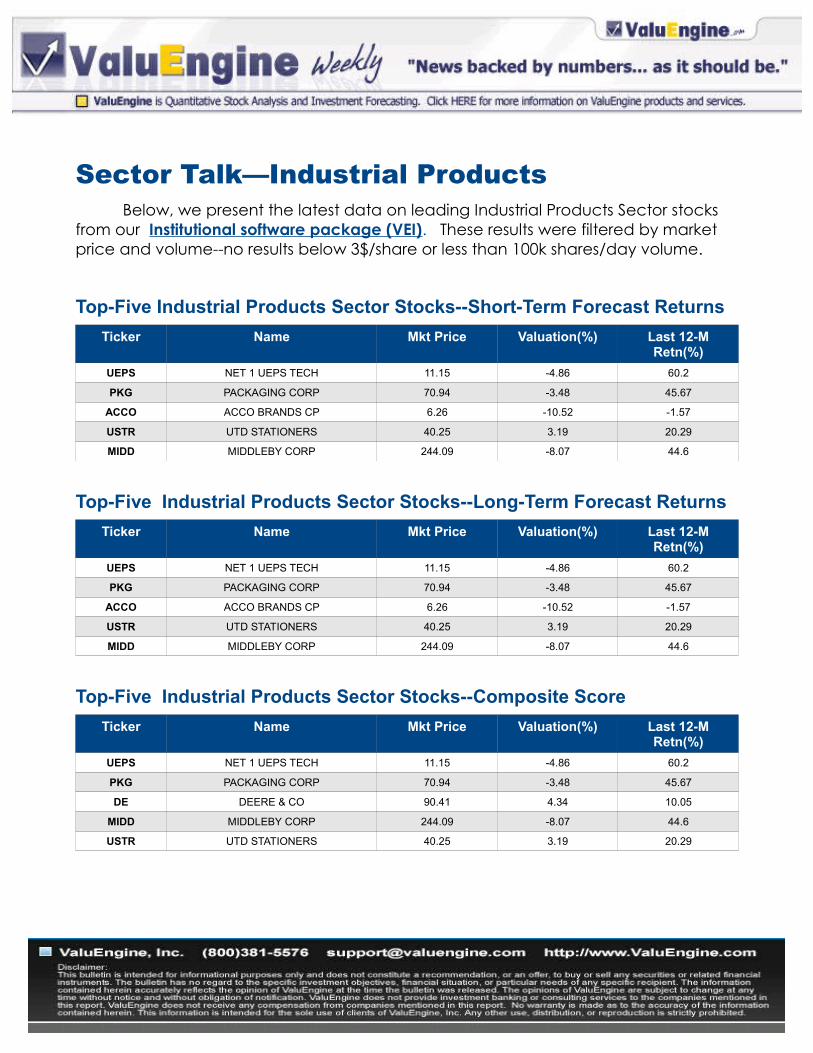
Sector Talk—Industrial ProductsBelow, we present the latest data on leading Industrial Products Sector stocks
from our Institutional software package (VEI). These results were filtered by market price and volume--no results below 3$/share or less than 100k shares/day volume.
Top-Five Industrial Products Sector Stocks--Short-Term Forecast Returns
Ticker Name Mkt Price Valuation(%) Last 12-MRetn(%)
UEPS NET 1 UEPS TECH 11.15 -4.86 60.2
PKG PACKAGING CORP 70.94 -3.48 45.67
ACCO ACCO BRANDS CP 6.26 -10.52 -1.57
USTR UTD STATIONERS 40.25 3.19 20.29
MIDD MIDDLEBY CORP 244.09 -8.07 44.6
Top-Five Industrial Products Sector Stocks--Long-Term Forecast Returns
Ticker Name Mkt Price Valuation(%) Last 12-MRetn(%)
UEPS NET 1 UEPS TECH 11.15 -4.86 60.2
PKG PACKAGING CORP 70.94 -3.48 45.67
ACCO ACCO BRANDS CP 6.26 -10.52 -1.57
USTR UTD STATIONERS 40.25 3.19 20.29
MIDD MIDDLEBY CORP 244.09 -8.07 44.6
Top-Five Industrial Products Sector Stocks--Composite Score
Ticker Name Mkt Price Valuation(%) Last 12-MRetn(%)
UEPS NET 1 UEPS TECH 11.15 -4.86 60.2
PKG PACKAGING CORP 70.94 -3.48 45.67
DE DEERE & CO 90.41 4.34 10.05
MIDD MIDDLEBY CORP 244.09 -8.07 44.6
USTR UTD STATIONERS 40.25 3.19 20.29
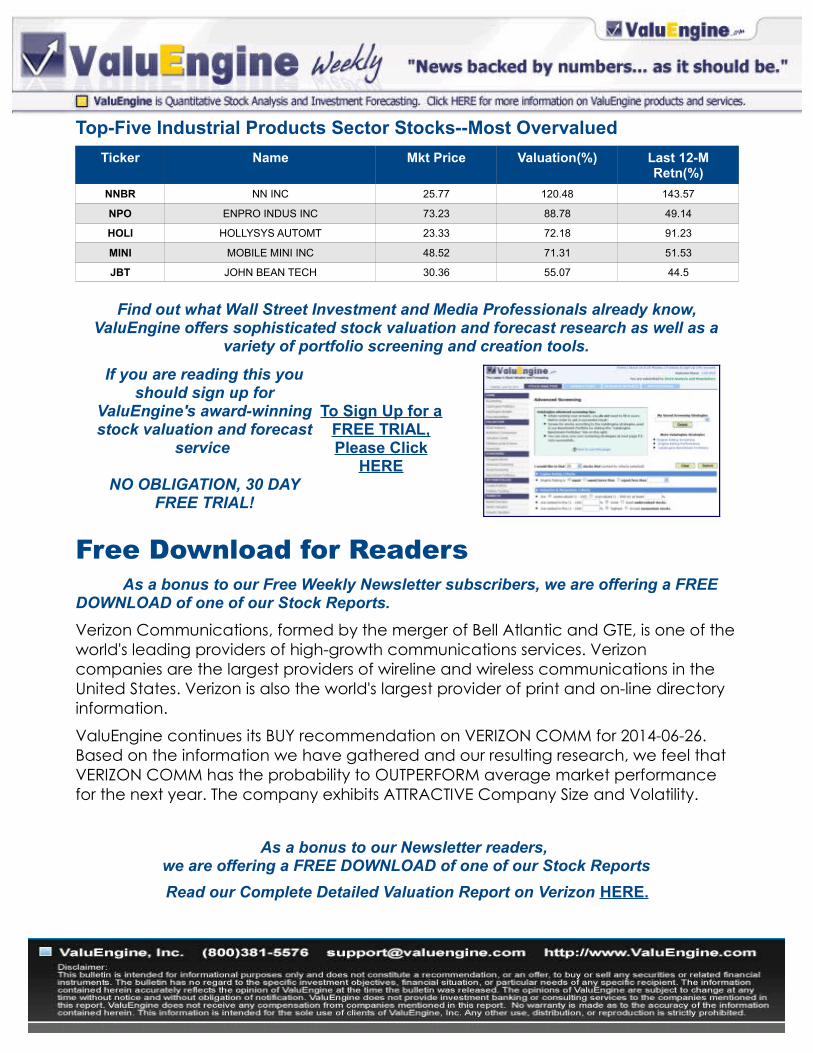
Top-Five Industrial Products Sector Stocks--Most Overvalued
Ticker Name Mkt Price Valuation(%) Last 12-MRetn(%)
NNBR NN INC 25.77 120.48 143.57
NPO ENPRO INDUS INC 73.23 88.78 49.14
HOLI HOLLYSYS AUTOMT 23.33 72.18 91.23
MINI MOBILE MINI INC 48.52 71.31 51.53
JBT JOHN BEAN TECH 30.36 55.07 44.5
Find out what Wall Street Investment and Media Professionals already know,ValuEngine offers sophisticated stock valuation and forecast research as well as a
variety of portfolio screening and creation tools.
If you are reading this youshould sign up for
ValuEngine's award-winningstock valuation and forecast
service
NO OBLIGATION, 30 DAYFREE TRIAL!
To Sign Up for aFREE TRIAL,Please Click
HERE
Free Download for ReadersAs a bonus to our Free Weekly Newsletter subscribers, we are offering a FREE
DOWNLOAD of one of our Stock Reports.
Verizon Communications, formed by the merger of Bell Atlantic and GTE, is one of theworld's leading providers of high-growth communications services. Verizon companies are the largest providers of wireline and wireless communications in the United States. Verizon is also the world's largest provider of print and on-line directory information.
ValuEngine continues its BUY recommendation on VERIZON COMM for 2014-06-26. Based on the information we have gathered and our resulting research, we feel that VERIZON COMM has the probability to OUTPERFORM average market performance for the next year. The company exhibits ATTRACTIVE Company Size and Volatility.
As a bonus to our Newsletter readers, we are offering a FREE DOWNLOAD of one of our Stock Reports
Read our Complete Detailed Valuation Report on Verizon HERE.

What's Hot--ValuEngine View Posts Huge Gain, Almost Triples SP 500 for Month
The jury is still out on the “Sell in May and Go Away” maxim this Summer, but thewarmer weather certainly hasn't cooled off the ValuEngine View's performance. For May/June, the ValuEngine View returned to its winning ways with a great month, We saw winners almost across the board with a hit ratio of 80%. Strong market gains were met with even stronger results from our picks. Our portfolio posted a big gain in excessof 9% and more than doubled the S&P 500. The trailing 12 month gain of the VE View is 33.44% versus the S&P 500 return of 17.57%. We are almost doubling the S&P over the past year. The return since inception of the View is 119.65% versus the S&P's gain of 71.48%. It remains our best performing newsletter under current market conditions.
Return Comparison vs. S&P 500
Last 12 Months
VE View 33.44%
S&P 500 17.57%
We had twelve winners this month—with five one of them posting double-digit gains. Lannett posted a big gain of almost 29% and was followed by Canadian Solar, Micron Tech, Synnex, and Brocade. Losses were minor from Amtrust, Gielad, and Gentex—none of which topped 4%.
With the ValuEngine View Newsletter you Receive 20 Carefully Selected Stock Picks whichRepresent the Most Up-to-Date Calculations of our Award-Winning Stock Valuation and
Forecast Models
Here are the latest results from May/June 2014:
Symbol Company NameEntryPrice
5/21/14Exit Price Change %Change
AFSIAMTRUST FINANCIAL
SERVICES44.23 42.49 -1.74 -3.93
BMA BANCO MACRO-ADR 30.01 31.79 1.78 5.93
BRCDBROCADE COMMUNICATION
SYSTEMS8.47 9.4 0.93 10.98
CSIQ CANADIAN SOLAR 22.41 27.98 5.57 24.85
GILD GILEAD SCIENCES 81.14 79.79 -1.35 -1.66
GNTX GENTEX CORP 28.89 28.65 -0.24 -0.83
HII HUNTINGTON INGALLS 95.03 98.81 3.78 3.98
KS KAPSTONE PAPER 28.09 30.73 2.64 9.40
Symbol Company Name EntryPrice
5/21/14
Exit Price Change %Change
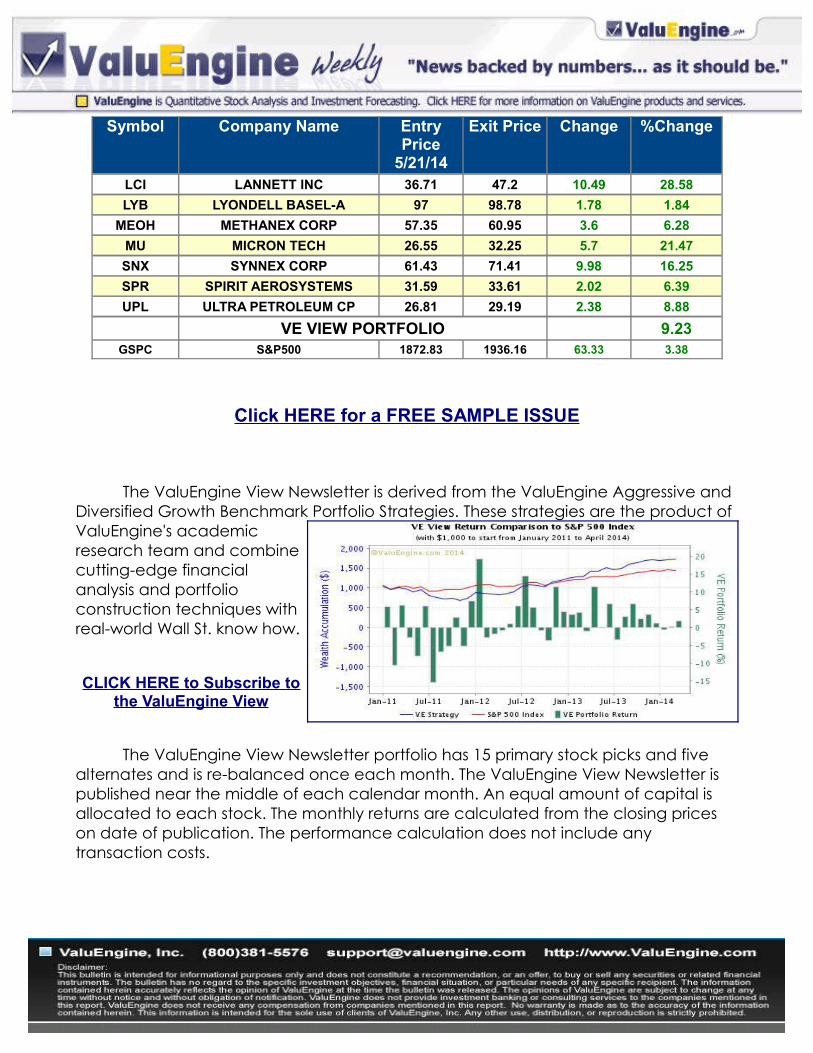
LCI LANNETT INC 36.71 47.2 10.49 28.58
LYB LYONDELL BASEL-A 97 98.78 1.78 1.84
MEOH METHANEX CORP 57.35 60.95 3.6 6.28
MU MICRON TECH 26.55 32.25 5.7 21.47
SNX SYNNEX CORP 61.43 71.41 9.98 16.25
SPR SPIRIT AEROSYSTEMS 31.59 33.61 2.02 6.39
UPL ULTRA PETROLEUM CP 26.81 29.19 2.38 8.88
VE VIEW PORTFOLIO 9.23GSPC S&P500 1872.83 1936.16 63.33 3.38
Click HERE for a FREE SAMPLE ISSUE
The ValuEngine View Newsletter is derived from the ValuEngine Aggressive and Diversified Growth Benchmark Portfolio Strategies. These strategies are the product of ValuEngine's academicresearch team and combinecutting-edge financialanalysis and portfolioconstruction techniques withreal-world Wall St. know how.
CLICK HERE to Subscribe tothe ValuEngine View
The ValuEngine View Newsletter portfolio has 15 primary stock picks and five alternates and is re-balanced once each month. The ValuEngine View Newsletter is published near the middle of each calendar month. An equal amount of capital is allocated to each stock. The monthly returns are calculated from the closing prices on date of publication. The performance calculation does not include any transaction costs.

Suttmeier Says--Commentary and Analysis from Chief Market StrategistRichard Suttmeier
If you have any comments or questions, send them [email protected]
Treasury Yields
10-Year--(2.529) Daily and monthly value levels are 2.586 and 2.708 with weekly, quarterly, annual and semiannual risky levels at 2.484, 2.333, 2.263, 1.837 and 1.779.
30-Year Bond – (3.356) Daily and monthly value levels are 3.428 and 3.492 with weekly, quarterly, annual and semiannual risky levels at 3.361, 3.305, 3.283, 3.114, 3.107 and 2.624.
Commodities and Forex
Comex Gold –($1317.1) Weekly, quarterly and monthly value levels are $1272.2, $1215.7 and $1209.6 with daily, semiannual, annual and semiannual risky levels at $1344.6, $1710.6, $1747.4, $1818.8 and $1857.1.
Nymex Crude Oil – ($105.62) Monthly and quarterly value levels are $96.59 and $89.40with semiannual, daily and weekly pivots at $104.97, $105.49 and $106.48, and annualrisky level at $107.52.
The Euro – (1.3609) Weekly, annual, quarterly and semiannual value levels are 1.3490, 1.3382, 1.3185 and 1.2642 with a daily pivot at 1.3627 and monthly and annual risky levels at 1.3833 and 1.5512.
Major Indices
Daily Dow: (16846) Quarterly, semiannual and annual value levels are 16462, 16245, 14835 and 13467 with a semiannual pivot at 16860, the June 20 all-time intraday high at 16978.02 and daily, weekly and monthly risky levels at 16974, 17084 and 17471.
S&P 500 – (1957.2) Quarterly, semiannual and annual value levels are 1853.5, 1797.3, 1764.4, 1539.1 and 1442.1 with the June 24 all-time intraday high at 1968.17 and daily, weekly and monthly risky levels at 1975.1, 1975.0 and 2020.7.
NASDAQ – (4379) Quarterly, semiannual and annual value levels are 4039, 3930, 3920, 3471 and 3063 with the June 24 multiyear intraday high at 4399.87 and weekly, daily and monthly risky levels at 4387, 4409 and 4532.
NASDAQ 100 (NDX) – (3827) Semiannual, quarterly and annual value levels are 3456, 3424, 3078 and 2669 with the June 24 multiyear intraday high at 3837.17, and daily, weekly and monthly risky levels at 3837, 3871 and 3966.
Dow Transports – (8150) Quarterly, semiannual, and annual value levels are 7407, 7376, 7245, 6249 and 5935 with the June 9 all-time intraday high at 8256.79 and daily, weekly and monthly risky levels at 8276, 8418 and 8463.
Russell 2000 – (1180.71) Quarterly, weekly, semiannual and annual value levels are 1169.22, 1166.83, 1131.70, 1133.29, 1130.79, 966.72 and 879.39 with a daily risky level at 1196.40, the March 4 all-time intraday high at 1212.82 and monthly risky level at 1213.68.
The SOX – (628.28) Monthly, semiannual, quarterly and annual value levels are 621.90, 548.36, 507.19, 490.52, 371.58 and 337.74 with the June 24 multiyear intraday high at 637.91 and daily and weekly risky levels at 632.88 and 635.04.
Dow Utilities: (569.99) Monthly, weekly, quarterly, semiannual and annual value levels are 557.32, 542.98, 528.10, 524.37, 504.74 and 497.53, with the June 19 all-time intraday high at 570.12 and daily risky level at 579.79.
Stock of the Day
Paychex (PAYX) – ($41.31) Paychex, Inc. is a national provider of payroll, human resource, and employee benefit outsourcing solutions for small-to medium-sized businesses. The company has two reportable business segments: Payroll and Human Resource Services and Professional Employer Organization. Paychex's Payroll segment is a national payroll processing and payroll tax preparationservice provided to small-to medium-sized business. The Professional Employer Organization segment provides human resource products and services.
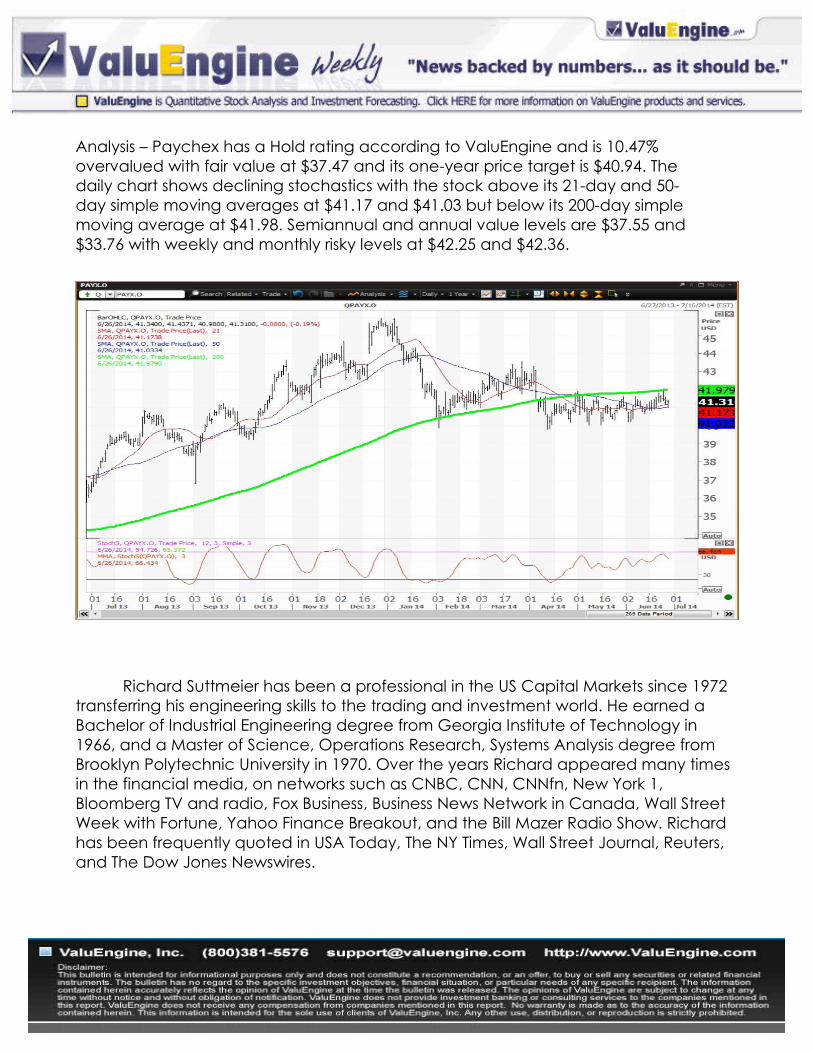
Analysis – Paychex has a Hold rating according to ValuEngine and is 10.47% overvalued with fair value at $37.47 and its one-year price target is $40.94. The daily chart shows declining stochastics with the stock above its 21-day and 50-day simple moving averages at $41.17 and $41.03 but below its 200-day simple moving average at $41.98. Semiannual and annual value levels are $37.55 and $33.76 with weekly and monthly risky levels at $42.25 and $42.36.
Richard Suttmeier has been a professional in the US Capital Markets since 1972 transferring his engineering skills to the trading and investment world. He earned a Bachelor of Industrial Engineering degree from Georgia Institute of Technology in 1966, and a Master of Science, Operations Research, Systems Analysis degree from Brooklyn Polytechnic University in 1970. Over the years Richard appeared many times in the financial media, on networks such as CNBC, CNN, CNNfn, New York 1, Bloomberg TV and radio, Fox Business, Business News Network in Canada, Wall Street Week with Fortune, Yahoo Finance Breakout, and the Bill Mazer Radio Show. Richard has been frequently quoted in USA Today, The NY Times, Wall Street Journal, Reuters, and The Dow Jones Newswires.

With Richard Suttmeier'sMorning Briefing, you get
daily analysis of USTreasury Yields, Gold,
Crude Oil, and CurrencyExchange Rates--Dollar,
Yen, Pound, and Euro--aswell as key technical
indicators for the majorequity averages.
Click HERE to SignUp for Chief MarketStrategist Richard
Suttmeier'sMorning Briefing!