RBSA Advisors Research Report - IPO : It's probably overpriced.
Value, Turnaround & Mean Reversion
Jan 2014
Find Spark research on Bloomberg (SPAK <go>), Thomson First Call, Reuters Knowledge and Factset
Strategy
Market data
BSE Sensex 20760
NSE Nifty 6172
Date Jan 13, 2013
Performance (%)
1m 3m 12m
Sensex 0% 1% 6%
BSE 200 1% 3% 1%
Ganeshram Jayaraman
+91 44 4344 0031
Gautam Singh
+91 44 4344 0076
Vishnu Kumar A S
+91 44 4344 0069
The Nostalgia Stocks
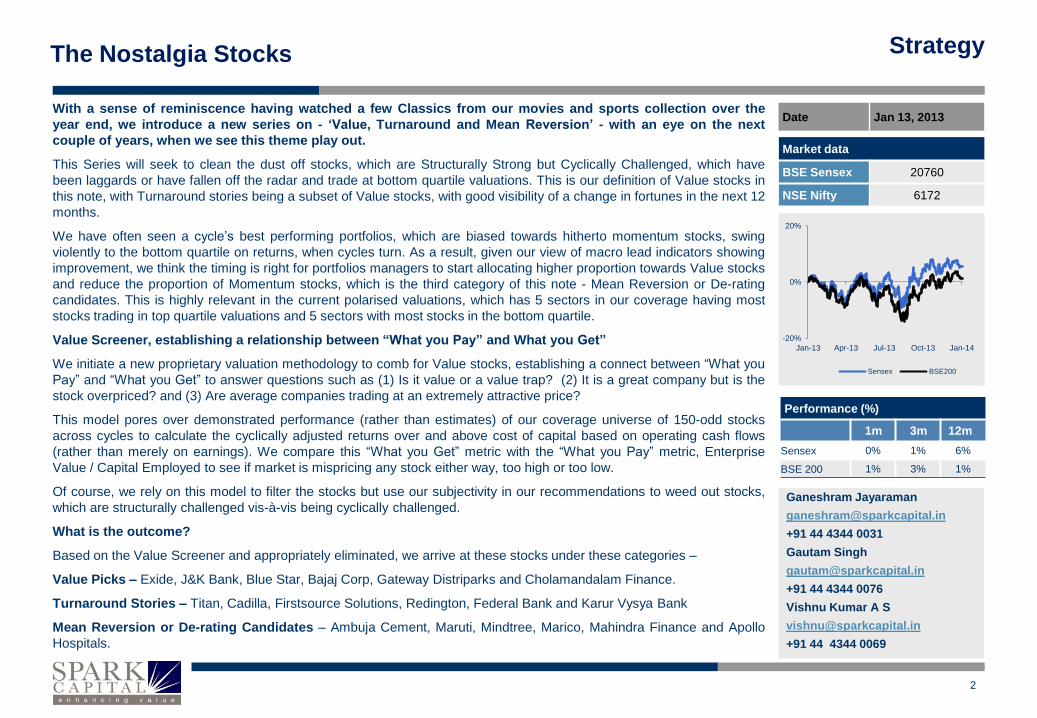
With a sense of reminiscence having watched a few Classics from our movies and sports collection over the
year end, we introduce a new series on - ‘Value, Turnaround and Mean Reversion’ - with an eye on the next
couple of years, when we see this theme play out.
This Series will seek to clean the dust off stocks, which are Structurally Strong but Cyclically Challenged, which have
been laggards or have fallen off the radar and trade at bottom quartile valuations. This is our definition of Value stocks in
this note, with Turnaround stories being a subset of Value stocks, with good visibility of a change in fortunes in the next 12
months.
We have often seen a cycle’s best performing portfolios, which are biased towards hitherto momentum stocks, swing
violently to the bottom quartile on returns, when cycles turn. As a result, given our view of macro lead indicators showing
improvement, we think the timing is right for portfolios managers to start allocating higher proportion towards Value stocks
and reduce the proportion of Momentum stocks, which is the third category of this note - Mean Reversion or De-rating
candidates. This is highly relevant in the current polarised valuations, which has 5 sectors in our coverage having most
stocks trading in top quartile valuations and 5 sectors with most stocks in the bottom quartile.
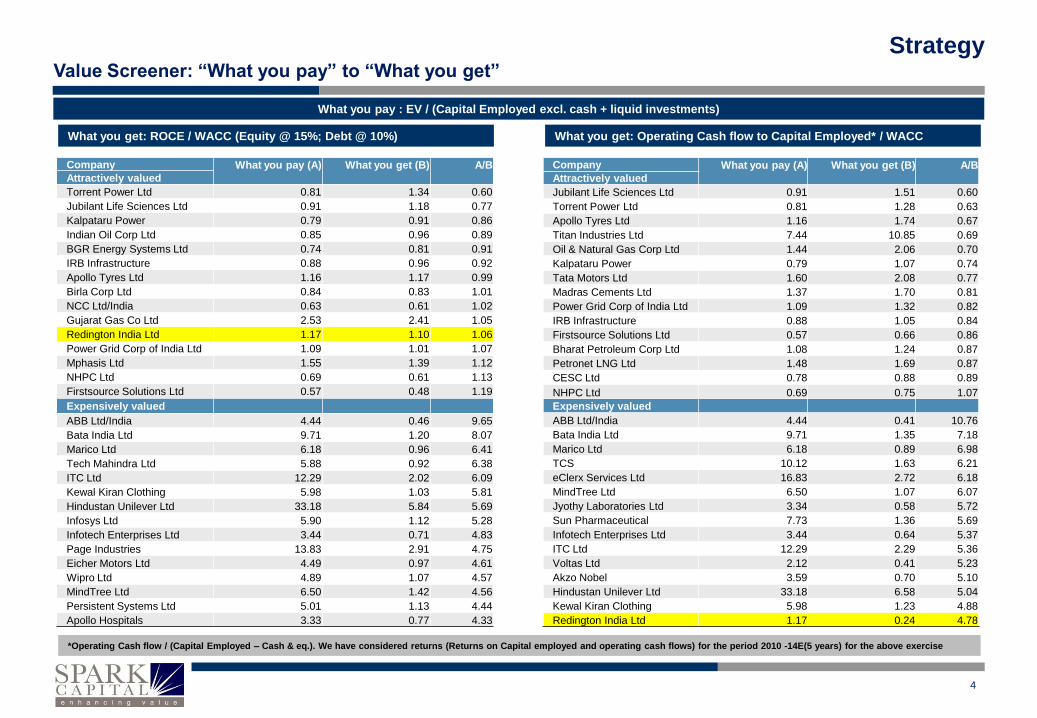
Value Screener, establishing a relationship between “What you Pay” and What you Get”
We initiate a new proprietary valuation methodology to comb for Value stocks, establishing a connect between “What you
Pay” and “What you Get” to answer questions such as (1) Is it value or a value trap? (2) It is a great company but is the
stock overpriced? and (3) Are average companies trading at an extremely attractive price?
This model pores over demonstrated performance (rather than estimates) of our coverage universe of 150-odd stocks
across cycles to calculate the cyclically adjusted returns over and above cost of capital based on operating cash flows
(rather than merely on earnings). We compare this “What you Get” metric with the “What you Pay” metric, Enterprise
Value / Capital Employed to see if market is mispricing any stock either way, too high or too low.
Of course, we rely on this model to filter the stocks but use our subjectivity in our recommendations to weed out stocks,
which are structurally challenged vis-à-vis being cyclically challenged.
What is the outcome?
Based on the Value Screener and appropriately eliminated, we arrive at these stocks under these categories –
Value Picks – Exide, J&K Bank, Blue Star, Bajaj Corp, Gateway Distriparks and Cholamandalam Finance.
Turnaround Stories – Titan, Cadilla, Firstsource Solutions, Redington, Federal Bank and Karur Vysya Bank
Mean Reversion or De-rating Candidates – Ambuja Cement, Maruti, Mindtree, Marico, Mahindra Finance and Apollo
Hospitals.
2
-20%
0%
20%
Jan-13 Apr-13 Jul-13 Oct-13 Jan-14
Sensex BSE200
Strategy
Turnaround Stories – At the cusp of a change in fortunes
Ou
r M
eth
od
olo
gy
• Decline in earnings in the past 2 – 3 years due to weak macro, regulatory overhang or company specific issues
• Stocks have witnessed price correction or time correction and trades 25% below its 5 yr mean or falls in the bottom quartile valuation
• A likely turnaround in CY14/ FY15 with earnings improvement over the next 12-18 months.
• Earnings growth and mean reversion which could potentially generate upside of >40%
Value Picks – Structurally strong, Cyclically challenged
• Structurally strong in the form of historically demonstrated performance, credible management, technology moat, good brand recognition,
high market shares, cash flow generating or marginally negative and healthy balance sheet
• But cyclically challenged over the past 2 – 3 years due to weak macro, regulatory overhang or company specific issues leading to revenue
de-growth and/ or margin compression
• Weak outlook continues and visibility for a turnaround not in sight and difficult to judge the timing of the same but is nevertheless, inevitable
• Stocks have witnessed sharp price correction (>50% decline from its peak) and trades in the lowest quartile or decile in its valuation history
(from Jan’ 07); Mean reversion of business performance and multiples present a potential justifiable multi-bagger opportunity
Mean Reversion – De-rating candidates
• Favorable operating environment, macro tailwinds and momentum over the past few years has aided strong business performance
• Stocks trading at top quartile or decile multiples in its valuation history (from Jan’ 07); Momentum leading to mispriced excessive valuations
• Performance unlikely to sustain due to likely macro headwinds, regulatory risks, changing industry dynamics or company specific issues
• Traded multiples face justifiably high risk of sharp de-rating presenting a good exit opportunity now
Overall Thought Process
3
Strategy
Company What you pay (A)
What you get (B)
A/B
Attractively valued
Torrent Power Ltd 0.81 1.34 0.60
Jubilant Life Sciences Ltd 0.91 1.18 0.77
Kalpataru Power 0.79 0.91 0.86
Indian Oil Corp Ltd 0.85 0.96 0.89
BGR Energy Systems Ltd 0.74 0.81 0.91
IRB Infrastructure 0.88 0.96 0.92
Apollo Tyres Ltd 1.16 1.17 0.99
Birla Corp Ltd 0.84 0.83 1.01
NCC Ltd/India 0.63 0.61 1.02
Gujarat Gas Co Ltd 2.53 2.41 1.05
Redington India Ltd 1.17 1.10 1.06
Power Grid Corp of India Ltd 1.09 1.01 1.07
Mphasis Ltd 1.55 1.39 1.12
NHPC Ltd 0.69 0.61 1.13
Firstsource Solutions Ltd 0.57 0.48 1.19
Expensively valued
ABB Ltd/India 4.44 0.46 9.65
Bata India Ltd 9.71 1.20 8.07
Marico Ltd 6.18 0.96 6.41
Tech Mahindra Ltd 5.88 0.92 6.38
ITC Ltd 12.29 2.02 6.09
Kewal Kiran Clothing 5.98 1.03 5.81
Hindustan Unilever Ltd 33.18 5.84 5.69
Infosys Ltd 5.90 1.12 5.28
Infotech Enterprises Ltd 3.44 0.71 4.83
Page Industries 13.83 2.91 4.75
Eicher Motors Ltd 4.49 0.97 4.61
Wipro Ltd 4.89 1.07 4.57
MindTree Ltd 6.50 1.42 4.56
Persistent Systems Ltd 5.01 1.13 4.44
Apollo Hospitals 3.33 0.77 4.33
Company What you pay (A)
What you get (B)
A/B
Attractively valued
Jubilant Life Sciences Ltd 0.91 1.51 0.60
Torrent Power Ltd 0.81 1.28 0.63
Apollo Tyres Ltd 1.16 1.74 0.67
Titan Industries Ltd 7.44 10.85 0.69
Oil & Natural Gas Corp Ltd 1.44 2.06 0.70
Kalpataru Power 0.79 1.07 0.74
Tata Motors Ltd 1.60 2.08 0.77
Madras Cements Ltd 1.37 1.70 0.81
Power Grid Corp of India Ltd 1.09 1.32 0.82
IRB Infrastructure 0.88 1.05 0.84
Firstsource Solutions Ltd 0.57 0.66 0.86
Bharat Petroleum Corp Ltd 1.08 1.24 0.87
Petronet LNG Ltd 1.48 1.69 0.87
CESC Ltd 0.78 0.88 0.89
NHPC Ltd 0.69 0.75 1.07
Expensively valued
ABB Ltd/India 4.44 0.41 10.76
Bata India Ltd 9.71 1.35 7.18
Marico Ltd 6.18 0.89 6.98
TCS 10.12 1.63 6.21
eClerx Services Ltd 16.83 2.72 6.18
MindTree Ltd 6.50 1.07 6.07
Jyothy Laboratories Ltd 3.34 0.58 5.72
Sun Pharmaceutical 7.73 1.36 5.69
Infotech Enterprises Ltd 3.44 0.64 5.37
ITC Ltd 12.29 2.29 5.36
Voltas Ltd 2.12 0.41 5.23
Akzo Nobel 3.59 0.70 5.10
Hindustan Unilever Ltd 33.18 6.58 5.04
Kewal Kiran Clothing 5.98 1.23 4.88
Redington India Ltd 1.17 0.24 4.78
What you pay : EV / (Capital Employed excl. cash + liquid investments)
Value Screener: “What you pay” to “What you get”
What you get: ROCE / WACC (Equity @ 15%; Debt @ 10%) What you get: Operating Cash flow to Capital Employed* / WACC
*Operating Cash flow / (Capital Employed – Cash & eq.). We have considered returns (Returns on Capital employed and operating cash flows) for the period 2010 -14E(5 years) for the above exercise
4
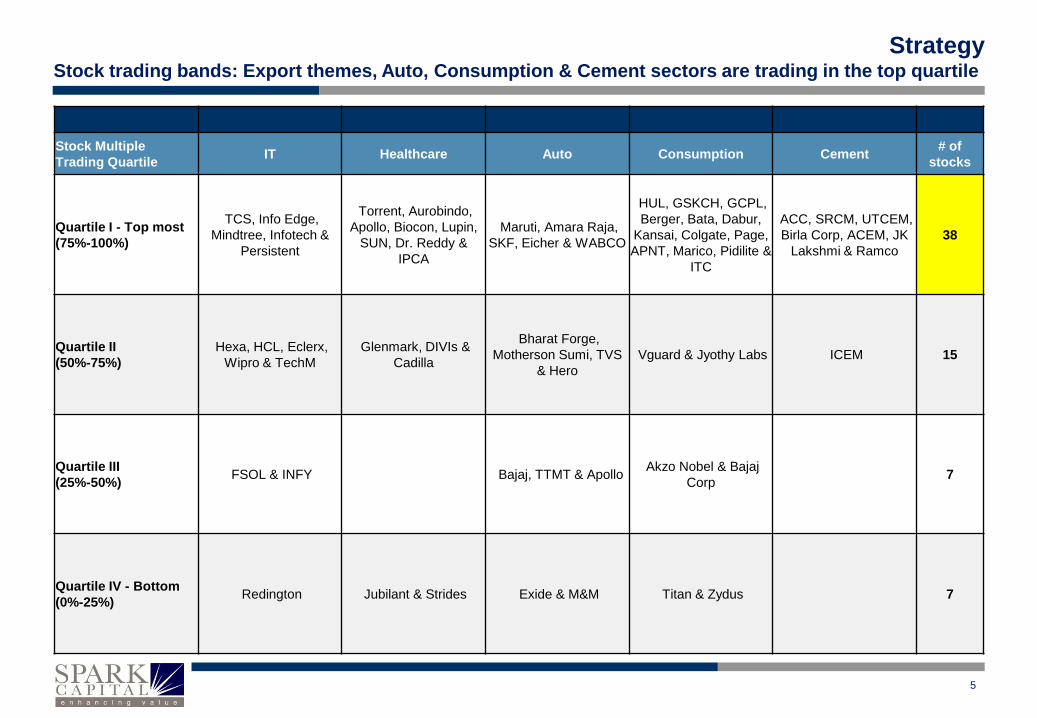
Strategy
Stock Multiple
Trading Quartile IT Healthcare Auto Consumption Cement
# of
stocks
Quartile I - Top most
(75%-100%)
TCS, Info Edge,
Mindtree, Infotech &
Persistent
Torrent, Aurobindo,
Apollo, Biocon, Lupin,
SUN, Dr. Reddy &
IPCA
Maruti, Amara Raja,
SKF, Eicher & WABCO
HUL, GSKCH, GCPL,
Berger, Bata, Dabur,
Kansai, Colgate, Page,
APNT, Marico, Pidilite &
ITC
ACC, SRCM, UTCEM,
Birla Corp, ACEM, JK
Lakshmi & Ramco
38
Quartile II
(50%-75%)
Hexa, HCL, Eclerx,
Wipro & TechM
Glenmark, DIVIs &
Cadilla
Bharat Forge,
Motherson Sumi, TVS
& Hero
Vguard & Jyothy Labs ICEM 15
Quartile III
(25%-50%) FSOL & INFY Bajaj, TTMT & Apollo
Akzo Nobel & Bajaj
Corp 7
Quartile IV - Bottom
(0%-25%) Redington Jubilant & Strides Exide & M&M Titan & Zydus 7
Stock trading bands: Export themes, Auto, Consumption & Cement sectors are trading in the top quartile
5
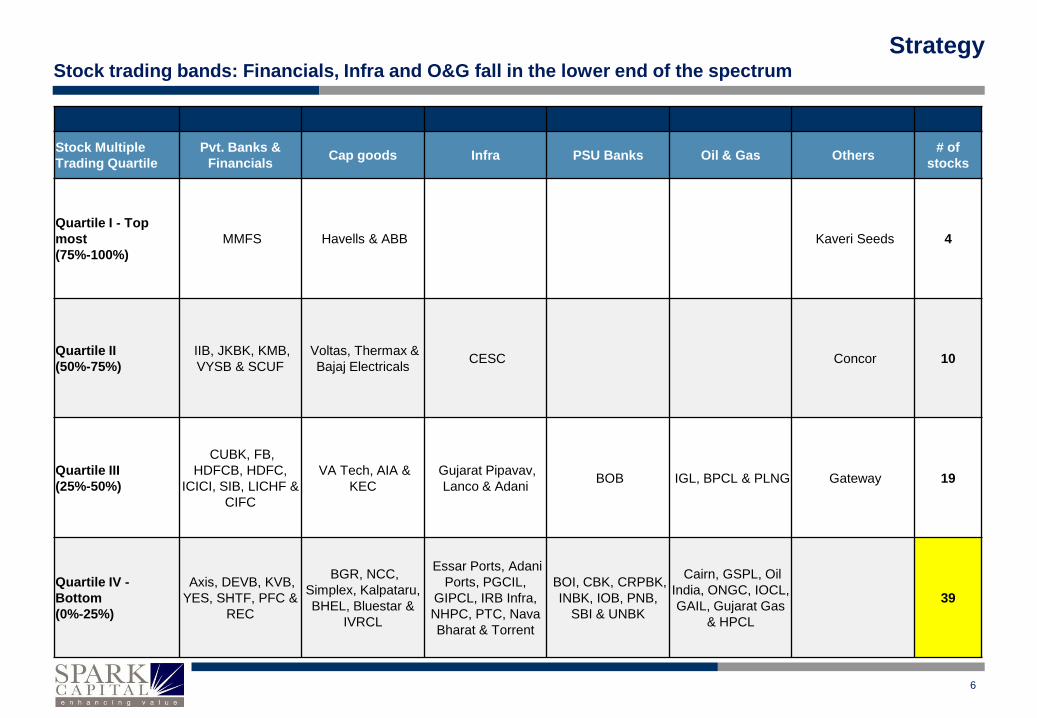
Strategy
Stock Multiple
Trading Quartile
Pvt. Banks &
Financials Cap goods Infra PSU Banks Oil & Gas Others
# of
stocks
Quartile I - Top
most
(75%-100%)
MMFS Havells & ABB Kaveri Seeds 4
Quartile II
(50%-75%)
IIB, JKBK, KMB,
VYSB & SCUF
Voltas, Thermax &
Bajaj Electricals CESC Concor 10
Quartile III
(25%-50%)
CUBK, FB,
HDFCB, HDFC,
ICICI, SIB, LICHF &
CIFC
VA Tech, AIA &
KEC
Gujarat Pipavav,
Lanco & Adani BOB IGL, BPCL & PLNG Gateway 19
Quartile IV -
Bottom
(0%-25%)
Axis, DEVB, KVB,
YES, SHTF, PFC &
REC
BGR, NCC,
Simplex, Kalpataru,
BHEL, Bluestar &
IVRCL
Essar Ports, Adani
Ports, PGCIL,
GIPCL, IRB Infra,
NHPC, PTC, Nava
Bharat & Torrent
BOI, CBK, CRPBK,
INBK, IOB, PNB,
SBI & UNBK
Cairn, GSPL, Oil
India, ONGC, IOCL,
GAIL, Gujarat Gas
& HPCL
39
Stock trading bands: Financials, Infra and O&G fall in the lower end of the spectrum
6
Strategy
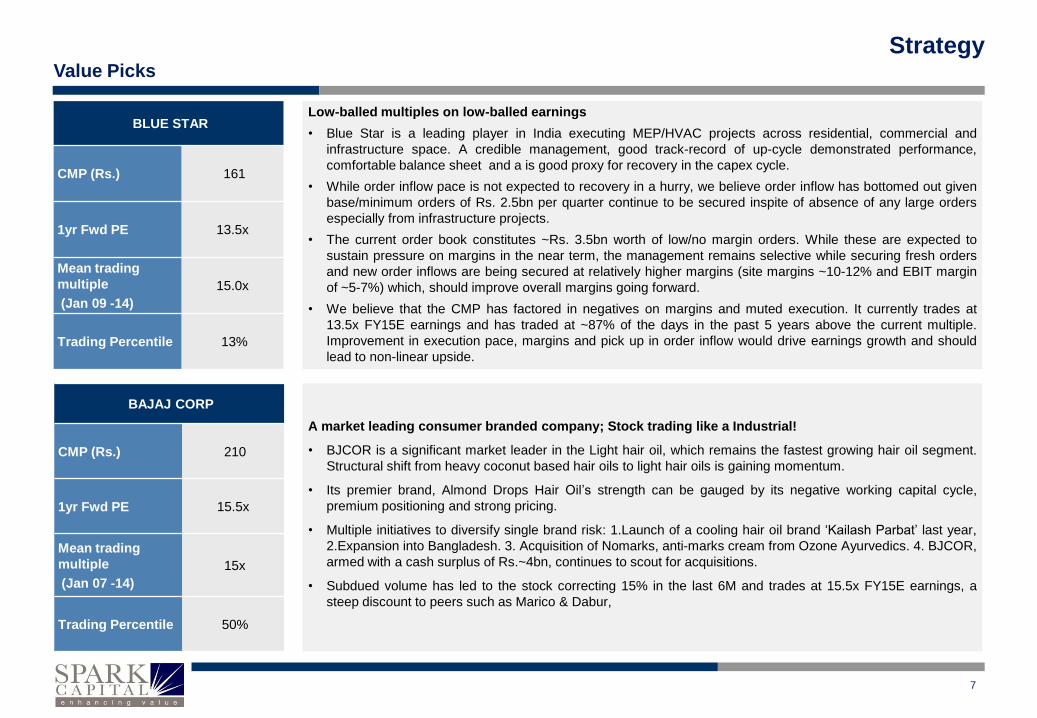
Low-balled multiples on low-balled earnings
• Blue Star is a leading player in India executing MEP/HVAC projects across residential, commercial and
infrastructure space. A credible management, good track-record of up-cycle demonstrated performance,
comfortable balance sheet and a is good proxy for recovery in the capex cycle.
• While order inflow pace is not expected to recovery in a hurry, we believe order inflow has bottomed out given
base/minimum orders of Rs. 2.5bn per quarter continue to be secured inspite of absence of any large orders
especially from infrastructure projects.
• The current order book constitutes ~Rs. 3.5bn worth of low/no margin orders. While these are expected to
sustain pressure on margins in the near term, the management remains selective while securing fresh orders
and new order inflows are being secured at relatively higher margins (site margins ~10-12% and EBIT margin
of ~5-7%) which, should improve overall margins going forward.
• We believe that the CMP has factored in negatives on margins and muted execution. It currently trades at
13.5x FY15E earnings and has traded at ~87% of the days in the past 5 years above the current multiple.
Improvement in execution pace, margins and pick up in order inflow would drive earnings growth and should
lead to non-linear upside.
A market leading consumer branded company; Stock trading like a Industrial!
• BJCOR is a significant market leader in the Light hair oil, which remains the fastest growing hair oil segment.
Structural shift from heavy coconut based hair oils to light hair oils is gaining momentum.
• Its premier brand, Almond Drops Hair Oil’s strength can be gauged by its negative working capital cycle,
premium positioning and strong pricing.
• Multiple initiatives to diversify single brand risk: 1.Launch of a cooling hair oil brand ‘Kailash Parbat’ last year,
2.Expansion into Bangladesh. 3. Acquisition of Nomarks, anti-marks cream from Ozone Ayurvedics. 4. BJCOR,
armed with a cash surplus of Rs.~4bn, continues to scout for acquisitions.
• Subdued volume has led to the stock correcting 15% in the last 6M and trades at 15.5x FY15E earnings, a
steep discount to peers such as Marico & Dabur,
BLUE STAR
CMP (Rs.) 161
1yr Fwd PE 13.5x
Mean trading
multiple
(Jan 09 -14)
15.0x
Trading Percentile 13%
BAJAJ CORP
CMP (Rs.) 210
1yr Fwd PE 15.5x
Mean trading
multiple
(Jan 07 -14)
15x
Trading Percentile 50%
Value Picks
7
Strategy
Struggling market leader in a duopoly market
• The key reason for the weak top-line performance is the steep decline in the higher margin home inverter
business (~25% of revenues) driven by better power situation in most states and a cold winter. Decline in
margins in FY12 and FY13 was also driven by the company’s product mix favoring OEM supplies (significantly
low margin business) and pricing cuts in the four-wheeler replacement segment to gain market share.
• With these issues largely behind, being the market leader, there is room for Exide to participate in a potential
auto and industrial recovery. Also, management focus on a stable pricing strategy and reducing exposure to
low margin segments (within OEMs) could yield results. There is significant room for upside in margins and
hence a top-line recovery could result in non-linear upside to earnings and valuations, which have now trend in-
line with Amara Raja vis-à-vis being 100% higher earlier.
• We believe that despite the negatives on margin and top-line decline the stock current factors in all the
negatives and has limited downside. Valuing the insurance business (turned profitable in FY13) at book value
(after deducting accumulated losses) and the other subsidiaries (smelters) at Rs. 15/share the value of the
core business stands at Rs. 100/share which translates to 12.5x FY15 P/E, which is a bottom quartile valuation
metric for this company.
Play on improving EXIM volumes
• CFS business - Cash Cow: With negligible growth in the Mumbai CFS, growth to be primarily driven by
Chennai (inorganic expansion), Vizag (expansion) and Kochi (new CFS started in 4QFY14). CFS EBITDA
contribution to total business would remain high at 40%+. EBITDA/TEU to remain stable.
• Rail biz to be the growth driver: Growth for GRFL is expected to be driven by new Faridabad terminal
(operational by 4QFY14); increasing proportion of double stacking and conversion of Garhi into a double
stacking hub. Over a long term, completion of DFC and increasing container port capacities would drive
volumes and profits. Expect an EBITDA CAGR of ~25% (FY13-FY15).
• Cold Chain (Snowman): Growth driven by significant capacity expansion (>3x in 3 years) and increasing
share of organized business (~ 15%).
• Balance sheet, estimates and valuation: Strong FCF generation in Mumbai CFS, Rail biz turning FCF
positive in FY14 with lower net debt and growth in the cold chain biz to be drivers. Stock is trading at attractive
dividend yields.
EXIDE
CMP (Rs.) 112
1yr Fwd PE 14.5x
Mean trading
multiple
(Jan 09 -14)
16.0x
Trading Percentile 18%
GATEWAY DISTRIPARKS
CMP (Rs.) 141
1yr Fwd PE 10x
Mean trading
multiple
(Jan 07 -14)
12x
Trading Percentile 30%
Value Picks
8
Strategy
A rare bank with a moat around its business
• Monopoly: JKBK’s branch network in the state of J&K is >2x that of SBI, PNB and HDFCB put together,
accounting for 43% of the state’s branches and 73% of the state’s CASA.
• Performance in times of strife: Even during periods of strife in the state, the bank has consistently registered
>15% yoy growth in deposits and advances with PAT growing in excess of 30%.
• Cost efficiency: Cost to income ratios have been consistently low at ~37%, an outcome of low branch related
rental expenditure in the state of J&K.
• JKBK’s margin profile as measured by high risk adjusted yields, margins, ranks close to the top in our
coverage universe, while a stellar 24% RoRE makes the bank highly efficient on capital consumption. Since a
1998 IPO, the bank hasn’t raised capital.
• Stable asset quality, attractive valuations: Slippages consistently below 1.5% over FY10-13, a flat restructured
book, relatively low risky sector exposures and >90% provision coverage ratios have delivered >20% RoEs
with RoAs of 1.5% over FY11-13 despite which the stock currently trades at 1x FY15 ABV. A deep value high
quality bank.
The Mahindra Finance in the making
• Cholamandalam is a solid bottom up investment argument built on betting on a smart management team, their
strategies to leverage the Murugappa Group’s strengths, huge potential efficiency gains and a play on the
recovery of the CV cycle.
• Improving yield mix, higher operating leverage and favourable funding environment are the three pillars which
should drive the improvement in performance of the business. Strong management pedigree with excellent risk
culture coupled with improving fundamentals and return ratios should result in rerating of the multiples going
forward.
• All round improvement in margins, opex ratios should mean sustenance of ROEs of ~20% even if the credit
costs were to spike up further which is a concern. At 1.2XFY15E ABV, for a company with multiple growth levers
and a favorable positioning, we believe that there is non-linear upside to book values and multiples.
J & K BANK
CMP (Rs.) 1404
1yr Fwd ABV 1.0x
Mean trading
multiple
(Jan 09 -14)
1.0x
Trading Percentile 52%
CHOLAMANDALAM FINANCE
CMP (Rs.) 260
1yr Fwd ABV 1.4x
Mean trading
multiple
(Jan 07 -14)
1.7x
Trading Percentile 40%
Value Picks
9
Strategy
TITAN
CMP (Rs.) 220
1yr Fwd PE 22x
Mean trading
multiple
(Jan 07 -14)
27x
Trading Percentile 11%
Calm post the ‘regulatory storm’:
• Post plethora of measures introduced by the GoI and RBI in 1HFY14 in regards to gold import curbs, we see
that there is a relative calmness in the past three months thereby allowing the industry to settle to the new
game plan.
• With CAD significantly improving in the past three months, the wrath on the sector seems to have come down.
With regulators indicating that they would like to have CAD under control without any distortions (import policy
tweaking) soon, we believe that the measures cannot be permanent.
• The lack of regulatory activity over the past three months has in fact given time for Titan to settle down and
grasp the impact of the affected regulatory policies. The mode of gold purchase amidst the uncertain market
conditions, hedging mechanisms, inventory valuation and of mark-to-market volatility risks are still being
worked out.
• Market leadership status, high brand recall, nature of consumer behavior too habitual and structural for
permanent change, waning regulatory risks and pent up demand make it a compelling turnaround.
• Bottom quartile valuations - stock down ~20% over last 1yr trades at 22x FY15E earnings.
US pipeline – Too good to ignore
• After underperforming peers for over 2 years, Cadila Healthcare is poised for a turnaround in performance, led
by its US business. Warning letter for Moraiya facility in FY12 and delay in approval for key products had
impacted growth for Cadila’s US business. Specific product launch expectations, pick up in approvals
(sirolimus, duloxetine), market share gains in generic Depakote ER and strong pricing environment in base
business are key recent positives.
• We identified several key product opportunities over the next 2 years which include generic versions of Toprol
XL, Astelin, Pentasa, Asacol and Asacol HD. Further, Cadila’s launch pipeline includes several filings in low-
competition niche areas such as transdermal, nasal, topical, controlled-substances (through Nesher) and
injectables which provide comfort on sustainability of growth
• The company’s domestic formulations segment (35% of sales), impacted by price controls in FY14, should
gradually recover from FY15.
• The stock currently trades at ~15x our FY16E EPS. We believe the next leg of rerating for the stock will be
driven by execution (timely launches and market share gains) in the US.
CADILLA
CMP (Rs.) 872
1yr Fwd PE 19.5x
Mean trading
multiple
(Jan 07 -14)
18x
Trading Percentile 75%
Turnaround Stories
10
Strategy
Tumultuous Past; Promising future
• Past mistakes – 1) Acquisition led growth strategy including that of MedAssist at 15x EV/EBITDA in Sep-07. 2)
Funding MedAssist acquisition with FCCB & refinancing it with another US$ loan without hedging forex risk on
both counts 3) Investing & growing the India business, which had best case ROIC of less than 15%.
• Key initiatives taken since current CEO Mr. Rajesh Subramanian took charge - Changing the promoter from
ICICI Bank to CESC, repayment of FCCB, driving cost efficiencies in delivery, higher investment in expanding
sales reach & reducing exposure to accounts with low profitability. Quarterly EBITDA margins expanded from a
trough of 7.4% in Dec-11 to 11.2% in Sep-13. Further, management is focused to achieve margins of 14-15% in
FY15E with price hikes, low margins account rationalization, SG&A leverage & better revenues from healthcare
should aid PAT growth of >250% in FY13-FY15E.
• Deleveraging to be the key value driver: As of Sep-13, FSOL had net debt of Rs. 9bn (US$ 150mn), of which
US$ 11.25mn needs to be repaid quarterly over 14 installments. At stock price of Rs. 24, FSOL has an
Enterprise value of Rs. 24bn (US$ 398mn). Assuming constant EV, repayment of debt over the next 14 quarters
implies >70% accretion to current equity value.
Return to efficiency
• KVB has a demonstrated consistent track record - Asset advantage in the bread and butter SME business in
geographies of comfort; Measured and consistent loan and CASA growth of >25% CAGR over the past decade
backed by stable NIMs of ~3% and 18% RoE across rate cycles.
• The bank’s restructured book is currently up 2x yoy to 5% of the loan book while slippages are ~2.2%
(annualised) up from a steady state 1.3%. However the restructured book is set to decline in proportion and
slippages reverting to ~1.5% in FY15.
• KVB’s margins collapsed from 3% to 2.6% in 2QFY14 as the bank borrowed under the MSF. With a favorable
ALM in 2HFY14, the bank is set to witness an easing of liquidity, with NIMs likely to revert to 3% in FY15. KVB
currently has a 30% AFS book with a high m.duration of 3.6 years. Although investment related provisioning of
~Rs. 1.5bn are expected to be a drag on FY14 profitability, FY15 could witness significant reversals in
provisioning.
• At 1x FY15E ABV, the stock trades at bottom quartile valuations vis-à-vis a mean of 1.4x.
FIRSTSOURCE
CMP (Rs.) 26
1yr Fwd
EV/EBITDA 5.3x
Mean trading
multiple
(Jan 07 -14)
6.3x
Trading Percentile 41%
KARUR VYSYA BANK
CMP (Rs.) 337
1yr Fwd ABV 1.0x
Mean trading
multiple
(Jan 07 -14)
1.4x
Trading Percentile 20%
Turnaround Stories
11
Strategy
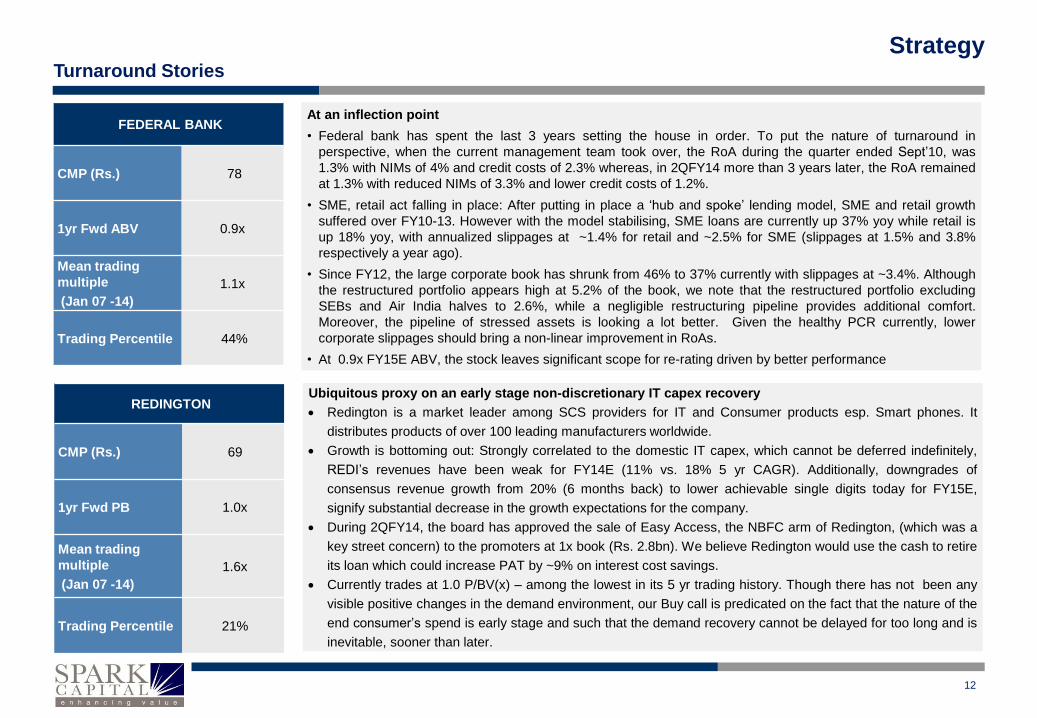
At an inflection point
• Federal bank has spent the last 3 years setting the house in order. To put the nature of turnaround in
perspective, when the current management team took over, the RoA during the quarter ended Sept’10, was
1.3% with NIMs of 4% and credit costs of 2.3% whereas, in 2QFY14 more than 3 years later, the RoA remained
at 1.3% with reduced NIMs of 3.3% and lower credit costs of 1.2%.
• SME, retail act falling in place: After putting in place a ‘hub and spoke’ lending model, SME and retail growth
suffered over FY10-13. However with the model stabilising, SME loans are currently up 37% yoy while retail is
up 18% yoy, with annualized slippages at ~1.4% for retail and ~2.5% for SME (slippages at 1.5% and 3.8%
respectively a year ago).
• Since FY12, the large corporate book has shrunk from 46% to 37% currently with slippages at ~3.4%. Although
the restructured portfolio appears high at 5.2% of the book, we note that the restructured portfolio excluding
SEBs and Air India halves to 2.6%, while a negligible restructuring pipeline provides additional comfort.
Moreover, the pipeline of stressed assets is looking a lot better. Given the healthy PCR currently, lower
corporate slippages should bring a non-linear improvement in RoAs.
• At 0.9x FY15E ABV, the stock leaves significant scope for re-rating driven by better performance
Ubiquitous proxy on an early stage non-discretionary IT capex recovery
Redington is a market leader among SCS providers for IT and Consumer products esp. Smart phones. It
distributes products of over 100 leading manufacturers worldwide.
Growth is bottoming out: Strongly correlated to the domestic IT capex, which cannot be deferred indefinitely,
REDI’s revenues have been weak for FY14E (11% vs. 18% 5 yr CAGR). Additionally, downgrades of
consensus revenue growth from 20% (6 months back) to lower achievable single digits today for FY15E,
signify substantial decrease in the growth expectations for the company.
During 2QFY14, the board has approved the sale of Easy Access, the NBFC arm of Redington, (which was a
key street concern) to the promoters at 1x book (Rs. 2.8bn). We believe Redington would use the cash to retire
its loan which could increase PAT by ~9% on interest cost savings.
Currently trades at 1.0 P/BV(x) – among the lowest in its 5 yr trading history. Though there has not been any
visible positive changes in the demand environment, our Buy call is predicated on the fact that the nature of the
end consumer’s spend is early stage and such that the demand recovery cannot be delayed for too long and is
inevitable, sooner than later.
FEDERAL BANK
CMP (Rs.) 78
1yr Fwd ABV 0.9x
Mean trading
multiple
(Jan 07 -14)
1.1x
Trading Percentile 44%
REDINGTON
CMP (Rs.) 69
1yr Fwd PB 1.0x
Mean trading
multiple
(Jan 07 -14)
1.6x
Trading Percentile 21%
Turnaround Stories
12
Strategy
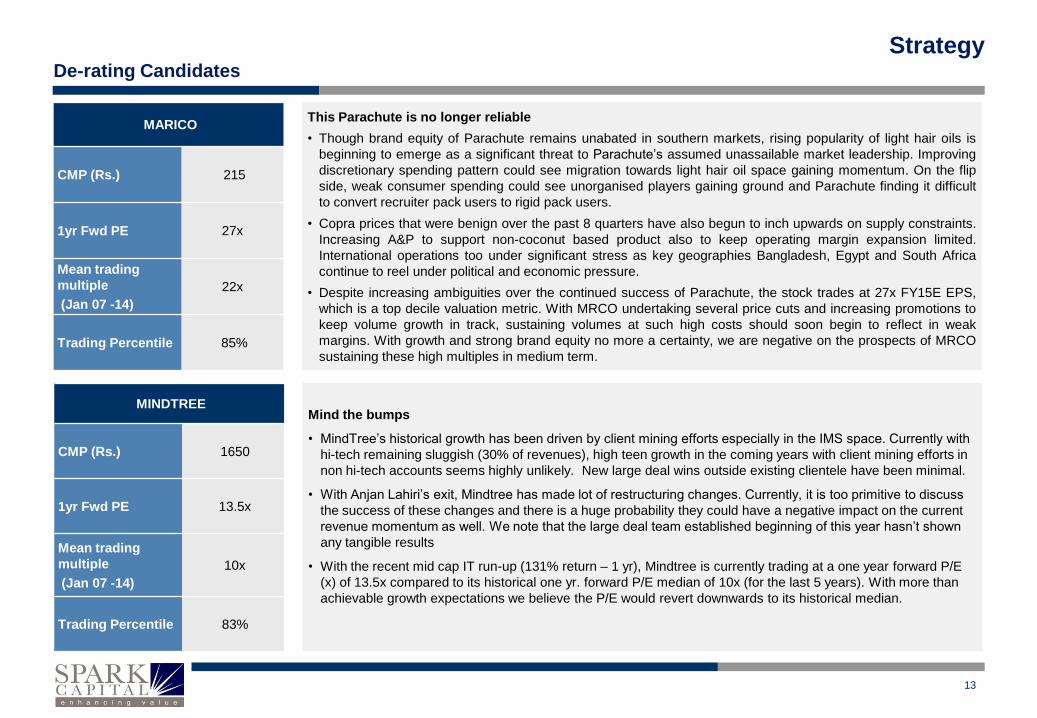
Mind the bumps
• MindTree’s historical growth has been driven by client mining efforts especially in the IMS space. Currently with
hi-tech remaining sluggish (30% of revenues), high teen growth in the coming years with client mining efforts in
non hi-tech accounts seems highly unlikely. New large deal wins outside existing clientele have been minimal.
• With Anjan Lahiri’s exit, Mindtree has made lot of restructuring changes. Currently, it is too primitive to discuss
the success of these changes and there is a huge probability they could have a negative impact on the current
revenue momentum as well. We note that the large deal team established beginning of this year hasn’t shown
any tangible results
• With the recent mid cap IT run-up (131% return – 1 yr), Mindtree is currently trading at a one year forward P/E
(x) of 13.5x compared to its historical one yr. forward P/E median of 10x (for the last 5 years). With more than
achievable growth expectations we believe the P/E would revert downwards to its historical median.
This Parachute is no longer reliable
• Though brand equity of Parachute remains unabated in southern markets, rising popularity of light hair oils is
beginning to emerge as a significant threat to Parachute’s assumed unassailable market leadership. Improving
discretionary spending pattern could see migration towards light hair oil space gaining momentum. On the flip
side, weak consumer spending could see unorganised players gaining ground and Parachute finding it difficult
to convert recruiter pack users to rigid pack users.
• Copra prices that were benign over the past 8 quarters have also begun to inch upwards on supply constraints.
Increasing A&P to support non-coconut based product also to keep operating margin expansion limited.
International operations too under significant stress as key geographies Bangladesh, Egypt and South Africa
continue to reel under political and economic pressure.
• Despite increasing ambiguities over the continued success of Parachute, the stock trades at 27x FY15E EPS,
which is a top decile valuation metric. With MRCO undertaking several price cuts and increasing promotions to
keep volume growth in track, sustaining volumes at such high costs should soon begin to reflect in weak
margins. With growth and strong brand equity no more a certainty, we are negative on the prospects of MRCO
sustaining these high multiples in medium term.
MARICO
CMP (Rs.) 215
1yr Fwd PE 27x
Mean trading
multiple
(Jan 07 -14)
22x
Trading Percentile 85%
MINDTREE
CMP (Rs.) 1650
1yr Fwd PE 13.5x
Mean trading
multiple
(Jan 07 -14)
10x
Trading Percentile 83%
De-rating Candidates
13
Strategy
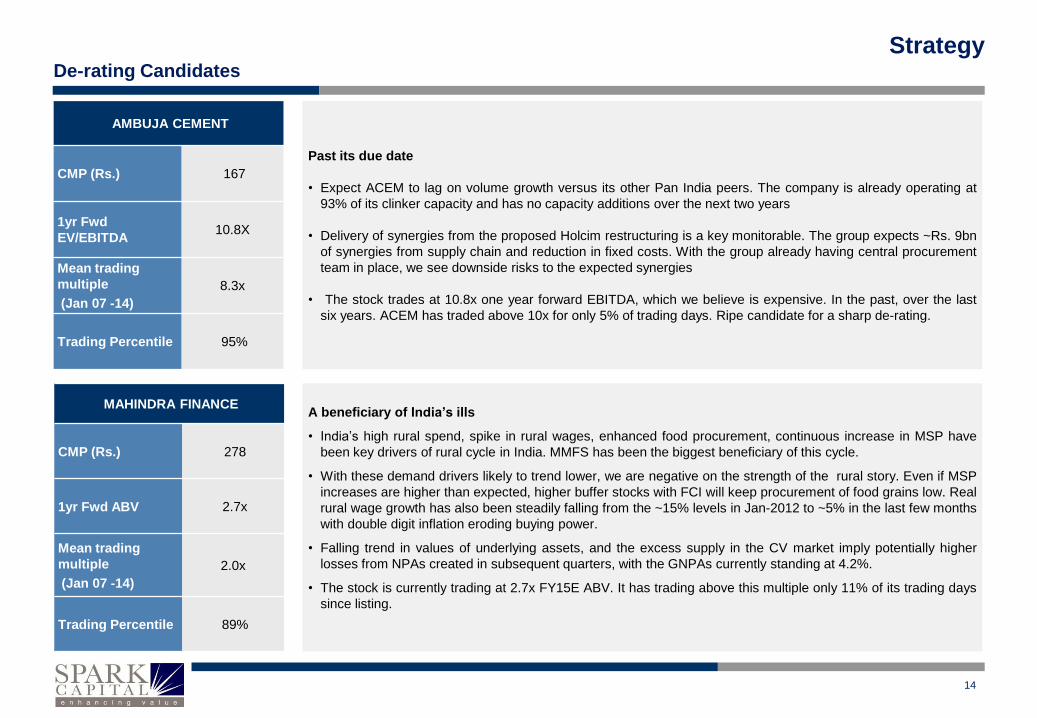
Past its due date
• Expect ACEM to lag on volume growth versus its other Pan India peers. The company is already operating at
93% of its clinker capacity and has no capacity additions over the next two years
• Delivery of synergies from the proposed Holcim restructuring is a key monitorable. The group expects ~Rs. 9bn
of synergies from supply chain and reduction in fixed costs. With the group already having central procurement
team in place, we see downside risks to the expected synergies
• The stock trades at 10.8x one year forward EBITDA, which we believe is expensive. In the past, over the last
six years. ACEM has traded above 10x for only 5% of trading days. Ripe candidate for a sharp de-rating.
A beneficiary of India’s ills
• India’s high rural spend, spike in rural wages, enhanced food procurement, continuous increase in MSP have
been key drivers of rural cycle in India. MMFS has been the biggest beneficiary of this cycle.
• With these demand drivers likely to trend lower, we are negative on the strength of the rural story. Even if MSP
increases are higher than expected, higher buffer stocks with FCI will keep procurement of food grains low. Real
rural wage growth has also been steadily falling from the ~15% levels in Jan-2012 to ~5% in the last few months
with double digit inflation eroding buying power.
• Falling trend in values of underlying assets, and the excess supply in the CV market imply potentially higher
losses from NPAs created in subsequent quarters, with the GNPAs currently standing at 4.2%.
• The stock is currently trading at 2.7x FY15E ABV. It has trading above this multiple only 11% of its trading days
since listing.
AMBUJA CEMENT
CMP (Rs.) 167
1yr Fwd
EV/EBITDA 10.8X
Mean trading
multiple
(Jan 07 -14)
8.3x
Trading Percentile 95%
MAHINDRA FINANCE
CMP (Rs.) 278
1yr Fwd ABV 2.7x
Mean trading
multiple
(Jan 07 -14)
2.0x
Trading Percentile 89%
De-rating Candidates
14
Strategy
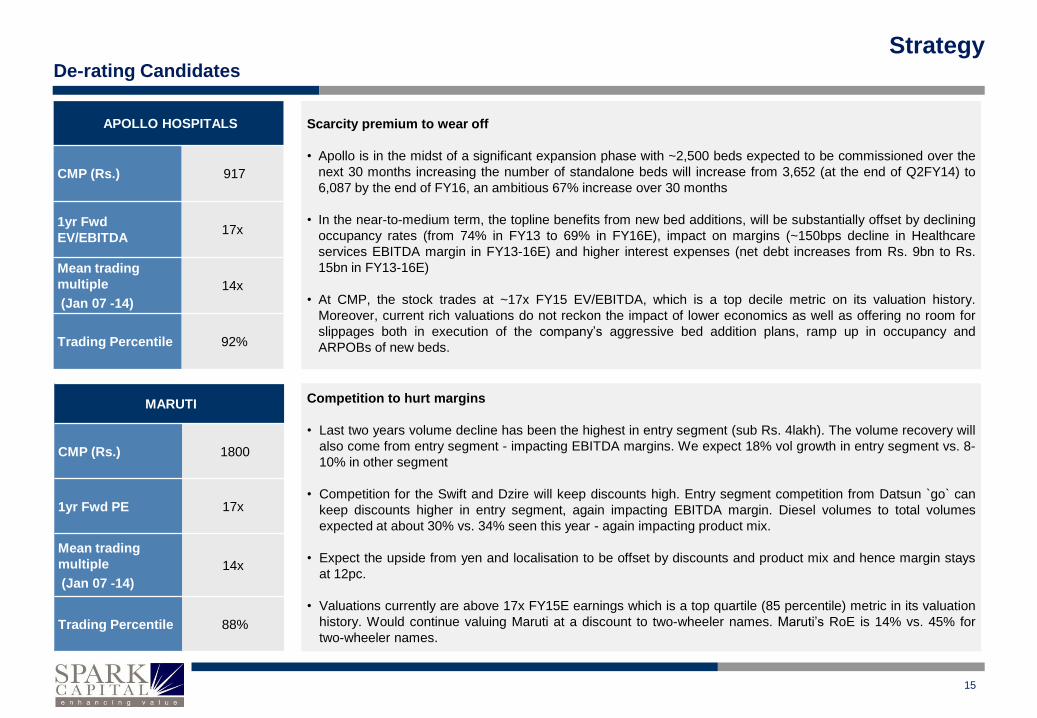
Scarcity premium to wear off
• Apollo is in the midst of a significant expansion phase with ~2,500 beds expected to be commissioned over the
next 30 months increasing the number of standalone beds will increase from 3,652 (at the end of Q2FY14) to
6,087 by the end of FY16, an ambitious 67% increase over 30 months
• In the near-to-medium term, the topline benefits from new bed additions, will be substantially offset by declining
occupancy rates (from 74% in FY13 to 69% in FY16E), impact on margins (~150bps decline in Healthcare
services EBITDA margin in FY13-16E) and higher interest expenses (net debt increases from Rs. 9bn to Rs.
15bn in FY13-16E)
• At CMP, the stock trades at ~17x FY15 EV/EBITDA, which is a top decile metric on its valuation history.
Moreover, current rich valuations do not reckon the impact of lower economics as well as offering no room for
slippages both in execution of the company’s aggressive bed addition plans, ramp up in occupancy and
ARPOBs of new beds.
Competition to hurt margins
• Last two years volume decline has been the highest in entry segment (sub Rs. 4lakh). The volume recovery will
also come from entry segment - impacting EBITDA margins. We expect 18% vol growth in entry segment vs. 8-
10% in other segment
• Competition for the Swift and Dzire will keep discounts high. Entry segment competition from Datsun `go` can
keep discounts higher in entry segment, again impacting EBITDA margin. Diesel volumes to total volumes
expected at about 30% vs. 34% seen this year - again impacting product mix.
• Expect the upside from yen and localisation to be offset by discounts and product mix and hence margin stays
at 12pc.
• Valuations currently are above 17x FY15E earnings which is a top quartile (85 percentile) metric in its valuation
history. Would continue valuing Maruti at a discount to two-wheeler names. Maruti’s RoE is 14% vs. 45% for
two-wheeler names.
APOLLO HOSPITALS
CMP (Rs.) 917
1yr Fwd
EV/EBITDA 17x
Mean trading
multiple
(Jan 07 -14)
14x
Trading Percentile 92%
MARUTI
CMP (Rs.) 1800
1yr Fwd PE 17x
Mean trading
multiple
(Jan 07 -14)
14x
Trading Percentile 88%
De-rating Candidates
15
Strategy
Spark Disclaimer
Spark Capital Advisors (India) Private Limited (Spark Capital) and its affiliates are engaged in investment banking, investment advisory and institutional equities. Spark Capital is registered with
SEBI as a Stock Broker and Category 1 Merchant Banker.
This document does not constitute or form part of any offer or solicitation for the purchase or sale of any financial instrument or as an official confirmation of any transaction. This document is
provided for assistance only and is not intended to be and must not alone be taken as the basis for an investment decision. Nothing in this document should be construed as investment or
financial advice, and nothing in this document should be construed as an advice to buy or sell or solicitation to buy or sell the securities of companies referred to in this document.
Each recipient of this document should make such investigations as it deems necessary to arrive at an independent evaluation of an investment in the securities of companies referred to in this
document (including the merits and risks involved), and should consult its own advisors to determine the merits and risks of such an investment. This document is being supplied to you solely
for your information and may not be reproduced, redistributed or passed on, directly or indirectly, to any other person or published, copied, in whole or in part, for any purpose. This report is not
directed or intended for distribution to or use by any person or entity who is a citizen or resident of or located in any locality, state, country or other jurisdiction, where such distribution,
publication, availability or use would be contrary to law, regulation or which would subject Spark Capital and/or its affiliates to any registration or licensing requirement within such jurisdiction.
The securities described herein may or may not be eligible for sale in all jurisdictions or to a certain category of investors. Persons in whose possession this document may come are required to
inform themselves of and to observe such applicable restrictions. This material should not be construed as an offer to sell or the solicitation of an offer to buy any security in any jurisdiction
where such an offer or solicitation would be illegal.
Spark Capital makes no representation or warranty, express or implied, as to the accuracy, completeness or fairness of the information and opinions contained in this document. Spark Capital ,
its affiliates, and the employees of Spark Capital and its affiliates may, from time to time, effect or have effected an own account transaction in, or deal as principal or agent in or for the
securities mentioned in this document. They may perform or seek to perform investment banking or other services for, or solicit investment banking or other business from, any company
referred to in this report.
This report has been prepared on the basis of information, which is already available in publicly accessible media or developed through an independent analysis by Spark Capital. While we
would endeavour to update the information herein on a reasonable basis, Spark Capital and its affiliates are under no obligation to update the information. Also, there may be regulatory,
compliance or other reasons that prevent Spark Capital and its affiliates from doing so. Neither Spark Capital nor its affiliates or their respective directors, employees, agents or representatives
shall be responsible or liable in any manner, directly or indirectly, for views or opinions expressed in this report or the contents or any errors or discrepancies herein or for any decisions or
actions taken in reliance on the report or the inability to use or access our service in this report or for any loss or damages whether direct or indirect, incidental, special or consequential
including without limitation loss of revenue or profits that may arise from or in connection with the use of or reliance on this report.
Spark Capital and/or its affiliates and/or employees may have interests/positions, financial or otherwise in the securities mentioned in this report. To enhance transparency, Spark Capital has
incorporated a disclosure of interest statement in this document. This should however not be treated as endorsement of views expressed in this report:
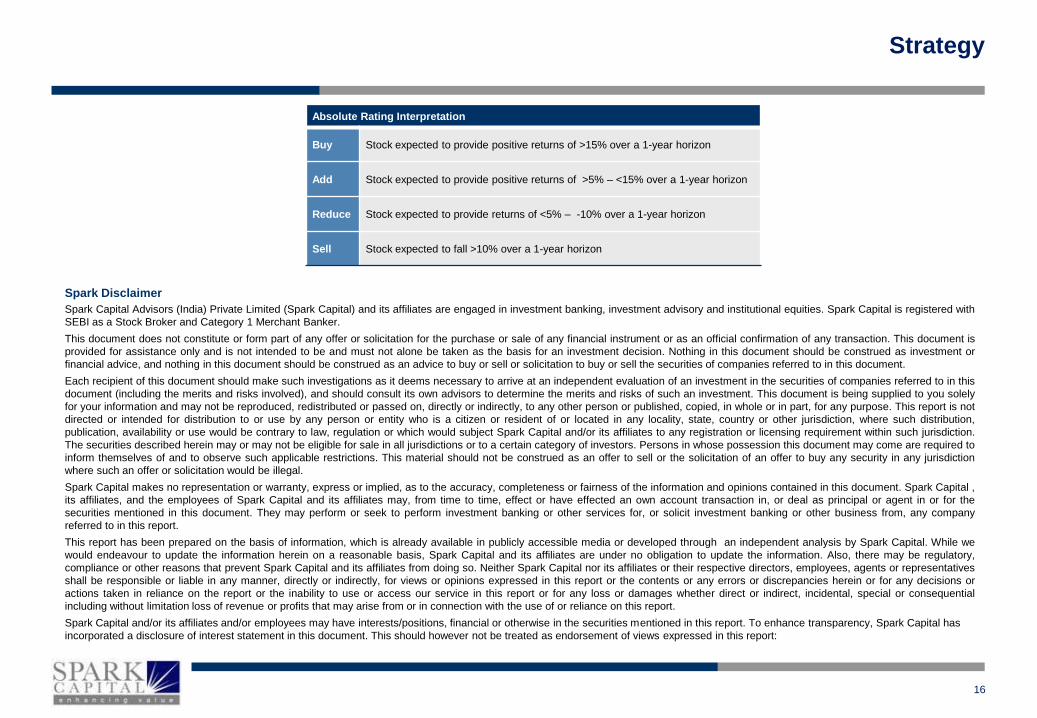
Absolute Rating Interpretation
Buy Stock expected to provide positive returns of >15% over a 1-year horizon
Add Stock expected to provide positive returns of >5% – <15% over a 1-year horizon
Reduce Stock expected to provide returns of <5% – -10% over a 1-year horizon
Sell Stock expected to fall >10% over a 1-year horizon
16
Strategy
Analyst Certification of Independence
The views expressed in this research report accurately reflect the analyst’s personal views about any and all of the subject securities or issuers; and no part of the research
analyst’s compensations was, is or will be, directly or indirectly, related to the specific recommendation or views expressed in the report.
Additional Disclaimer for US Institutional Investors
This research report prepared by Spark Capital Advisors (India) Private Limited is distributed in the United States to US Institutional Investors (as defined in Rule 15a-6 under the Securities
Exchange Act of 1934, as amended) only by Decker & Co, LLC, a broker-dealer registered in the US (registered under Section 15 of Securities Exchange Act of 1934, as amended). Decker &
Co accepts responsibility on the research reports and US Institutional Investors wishing to effect transaction in the securities discussed in the research material may do so through Decker & Co.
All responsibility for the distribution of this report by Decker & Co, LLC in the US shall be borne by Decker & Co, LLC. All resulting transactions by a US person or entity should be effected
through a registered broker-dealer in the US. This report is not directed at you if Spark Capital Advisors (India) Private Limited or Decker & Co, LLC is prohibited or restricted by any legislation
or regulation in any jurisdiction from making it available to you. You should satisfy yourself before reading it that Decker & Co, LLC and Spark Capital Advisors (India) Private Limited are
permitted to provide research material concerning investment to you under relevant legislation and regulations;
17