Value-to-Society - BASF USA - Home Measuring our contribution to sustainable growth Dr. Dirk Voeste...
14
Value-to-Society Measuring our contribution to sustainable growth Dr. Dirk Voeste Vice President Corporate Sustainability Strategy Investor Visit Hermes Ludwigshafen September 29, 2017
Transcript of Value-to-Society - BASF USA - Home Measuring our contribution to sustainable growth Dr. Dirk Voeste...

Value-to-SocietyMeasuring our contribution to sustainable growth
Dr. Dirk VoesteVice PresidentCorporate SustainabilityStrategy
Investor Visit Hermes
LudwigshafenSeptember 29, 2017

Investor Visit Hermes, Sept. 29, 2017 2
Cautionary note regarding forward-looking statements
This presentation contains forward-looking statements. These forward-looking statements are basedon current estimates and projections of the Board of Executive Directors and on currently availableinformation. These forward-looking statements are not guarantees of the future developments andresults outlined therein. Rather, they depend on a number of factors, involve various risks anduncertainties, and are based on assumptions that may not prove to be accurate. Such risk factorsparticularly include those discussed on pages 111 to 118 of the BASF Report 2016. The BASFReport is available online at basf.com/report. BASF does not assume any obligation to update theforward-looking statements contained in this presentation.

Investor Visit Hermes, Sept. 29, 2017 3
Sustainability performance measurement Impact valuation: next level to evaluate the business contribution to a sustainable future
Systematic sustainability performance assessments since 1996
1996
2004
2011
SEEBALANCE®
2012
Advanced IT solutions
for customers
2015
AgBalance™Sustainable
Solution Steering®Eco-Efficiency
AnalysisInvestmentevaluation
Value-to-Society
Corporate Carbon Footprint
2013
2007
Products in the value chain
Portfolio and digital solutions
Corporate
2017

Investor Visit Hermes, Sept. 29, 2017 4
Sustainable Solution Steering®
Methodology to steer our portfolio
Substantial sustainability contribution in the value chain
Meets basic sustainability standards on the market
Specific sustainability issues which are being actively addressed
Significant sustainability concern,action plan developed
27.2%
68.3%
4.2% 0.3%
>60,000 product applications analyzed (€53.2 billion sales, 95.9% of BASF’s portfolio)
27.2% Accelerators− outgrow their markets − deliver margins above the average− represent majority of BASF’s R&D
pipeline
68.3% Performers
<1% Challenged products
2020 goal: Increase the share of Accelerators from 23% in 2014 to 28%

Investor Visit Hermes, Sept. 29, 2017 5
SLENTITE®
High-performance insulation panel for construction
1990
Slen
tite®
1950 1990 20201930
Slen
tite®
Slentite®
PU aerogel as solid panel with best in class thermal insulation
Flexible scope of design thanks to very slim panel (25–50% less than industry standard)
Construction solution for reduced energy consumption
Perspective Strong growth potential in a market of
€1.3 billion
Start of production in a few years

Investor Visit Hermes, Sept. 29, 2017 6
Trilon® MChelating agent for more sustainable detergents and cleaners
Trilon® M – alternative to phosphate for automatic dish washing Fast growing global market demand driven by
regulatory changes and consumer demand
2015: Start-up of a new Trilon® M world-scale plant in Alabama, USA
2016: Expansion and flexibilization of production facilities in Ludwigshafen
Compared with alternative chelating agents Trilon® M is readily biodegradable and shows high
performance
meets eco-label requirements
has better eco-toxicology profile

Investor Visit Hermes, Sept. 29, 2017 7
Acronal® MBFrom biomass to dispersion for premium paints
First BASF binder for interior paints based on the biomass balance approach launched in 2016
91% of interviewed professional painters in Germany see an increase in sustainability aspects in tenders
Replacing fossil raw materials with renewable feedstock at the beginning of the production process
Less greenhouse gas emissions
Enabling interior paints that combine environmental responsibility with uncompromising premium qualityRenewable
Feedstock ProductsConventionalAllocatedFossil
BASF Verbund production steps
Investor Visit Hermes, Sept. 29, 2017 8
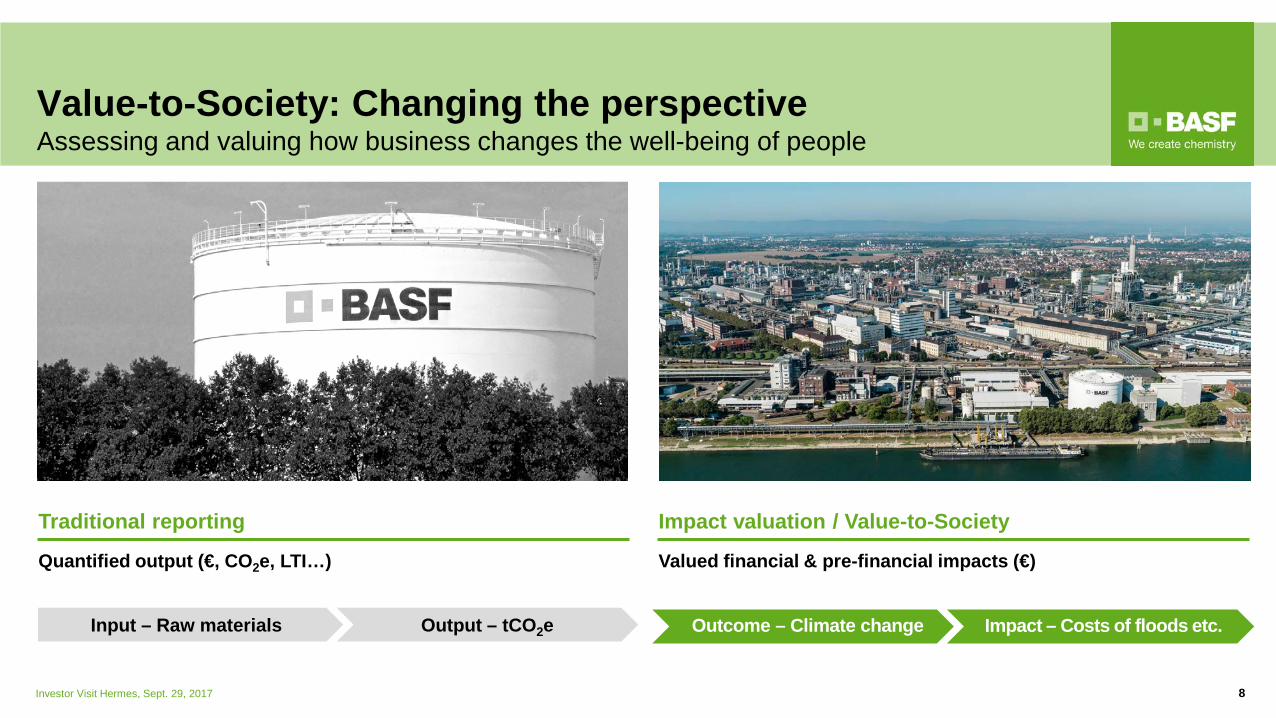
Value-to-Society: Changing the perspectiveAssessing and valuing how business changes the well-being of people
Traditional reporting
Quantified output (€, CO2e, LTI…)
Impact valuation / Value-to-Society
Valued financial & pre-financial impacts (€)
Output – tCO2eInput – Raw materials Impact – Costs of floods etc.Outcome – Climate change

Investor Visit Hermes, Sept. 29, 2017 9
Impact valuation gains momentumIt is not a question of if, but rather when impact valuation is implemented
StandardizationDisclosureBusiness examples
Natural Capital Protocol Social Capital Protocol Natural & Social Capital Sector
Guidance ISO 14007 and 14008
CDP (formerly Carbon Disclosure Project)
Dow Jones Sustainability Index Reporting schemes started the
discussion
WBCSD Redefining Value Impact Valuation Roundtable Increasing number of companies
is piloting in all sectors First companies go public
Investor Visit Hermes, Sept. 29, 2017 10
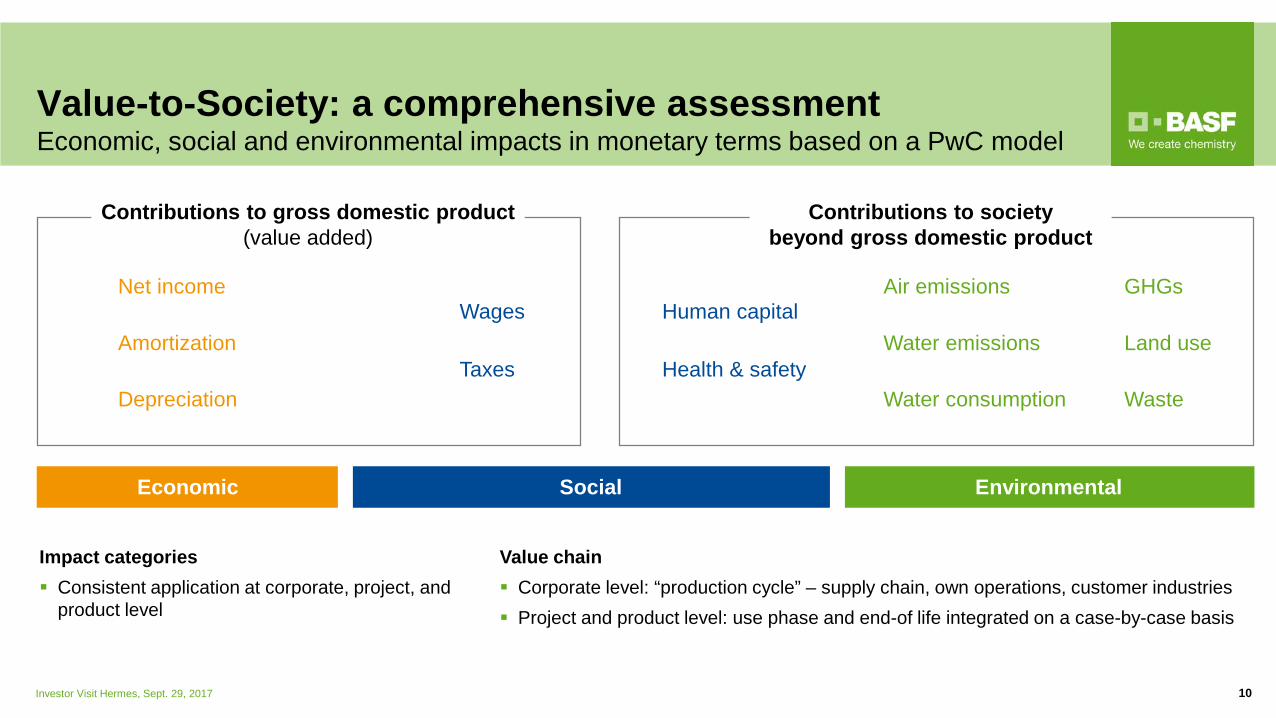
Value-to-Society: a comprehensive assessmentEconomic, social and environmental impacts in monetary terms based on a PwC model
Net incomeWages
Health & safety
Human capitalAir emissions
Land use
Water consumption
Water emissions
GHGs
Waste
Amortization
DepreciationTaxes
Impact categories Consistent application at corporate, project, and
product level
Value chain Corporate level: “production cycle” – supply chain, own operations, customer industries Project and product level: use phase and end-of life integrated on a case-by-case basis
Economic Social
Contributions to gross domestic product (value added)
Contributions to society beyond gross domestic product
Environmental
Investor Visit Hermes, Sept. 29, 2017 11
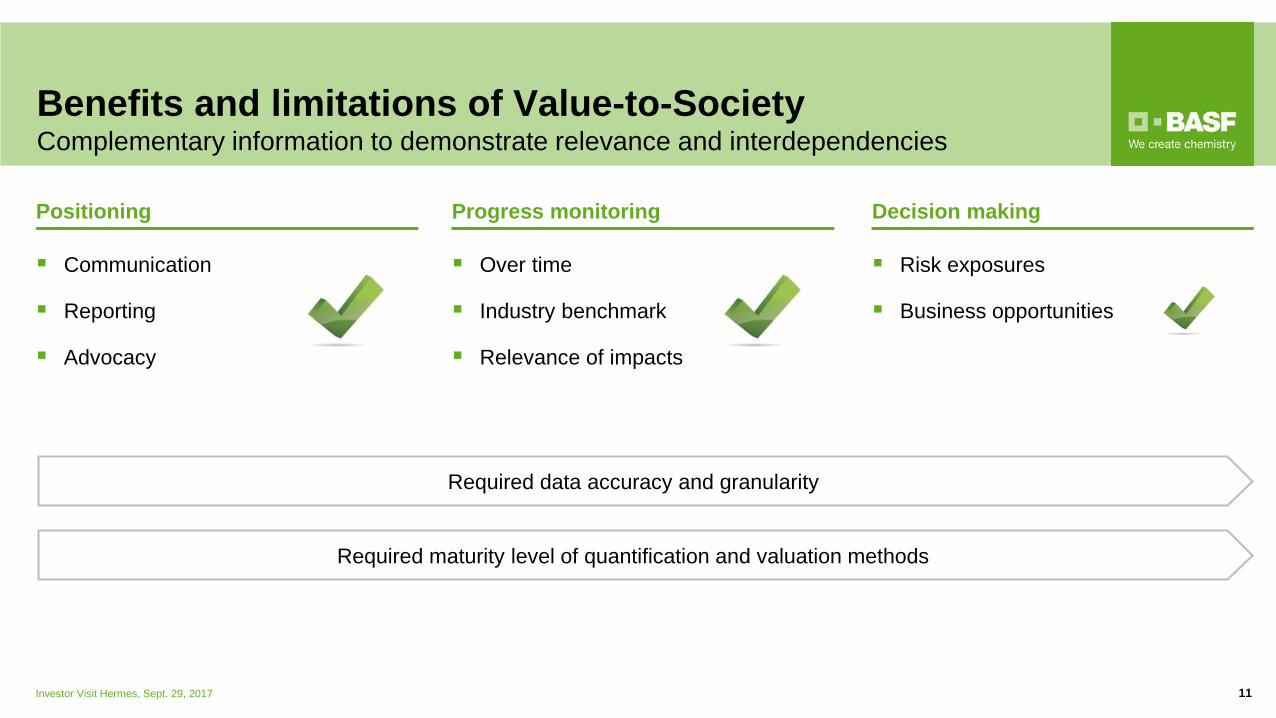
Benefits and limitations of Value-to-SocietyComplementary information to demonstrate relevance and interdependencies
Required data accuracy and granularity
Required maturity level of quantification and valuation methods
Positioning Progress monitoring Decision making
Communication
Reporting
Advocacy
Over time
Industry benchmark
Relevance of impacts
Risk exposures
Business opportunities
Investor Visit Hermes, Sept. 29, 2017 12
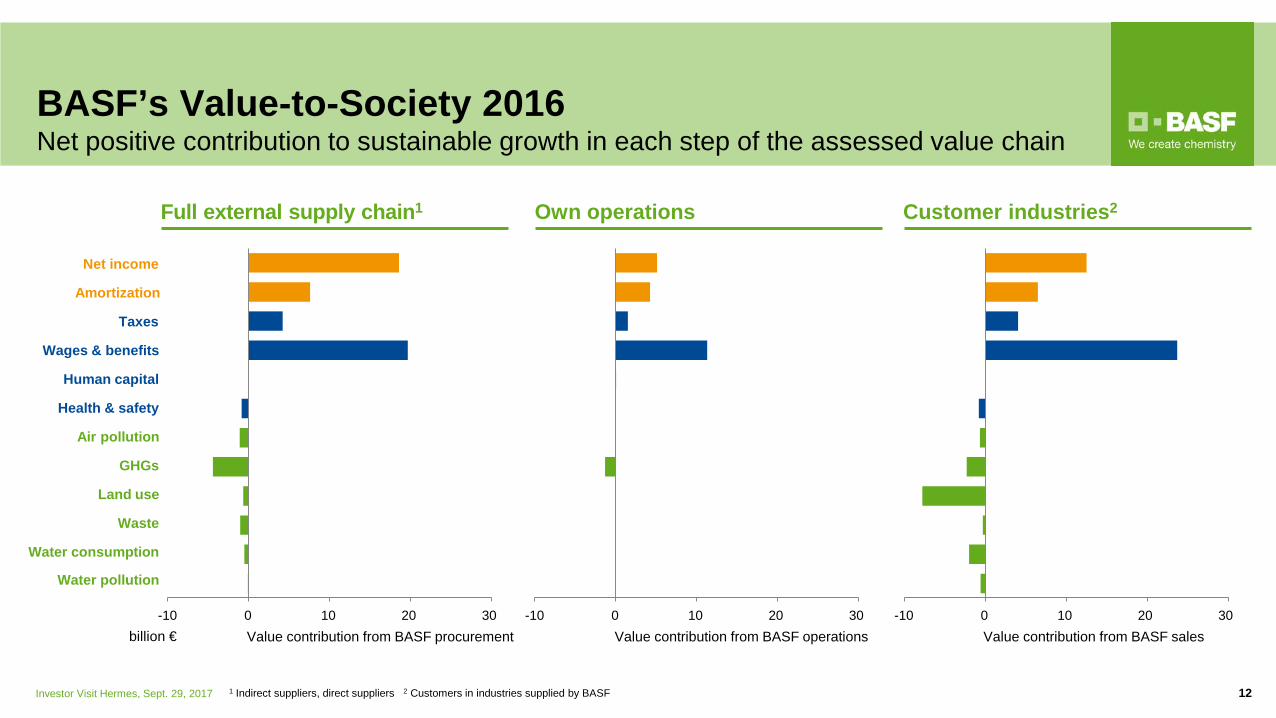
BASF’s Value-to-Society 2016Net positive contribution to sustainable growth in each step of the assessed value chain
Net income
Taxes
Wages & benefits
Human capital
Health & safety
Air pollution
GHGs
Land use
Waste
Water consumption
Water pollution
Amortization
Value contribution from BASF procurement Value contribution from BASF operations-10 0 10 20 30 -10 0 10 20 30 -10 0 10 20 30
Value contribution from BASF sales
Full external supply chain1 Own operations Customer industries2
1 Indirect suppliers, direct suppliers 2 Customers in industries supplied by BASF
billion €
Investor Visit Hermes, Sept. 29, 2017 13
BASF’s Value-to-Society in a nutshell
We assess our contribution to a sustainable future
We improve our understanding of relevance and interdependency of financialand pre-financial impacts
Our calculation model is pragmatic, scalable, transferable and auditable
Our approach is aligned with existing protocols and standards
We engage in relevant networks to share our learnings
We anticipate that impact valuation, after further refinement of the method, will be embedded into daily business

Investor Visit Hermes, Sept. 29, 2017 14