
Value of Popular Decision Analysis Tools in Upstream Asset ...
39
Transcript of Value of Popular Decision Analysis Tools in Upstream Asset ...

Perceived Value & Popularity of DA tools in Upstream E&P

Decision Analysis, What is it?
Decision Analysis in O&G Industry
Motivations & Design of the Study
Toolkit Analysis
Summary of Results
Modeling the Real World
Real World MathematicalTheory
MathematicalModel
Prediction
Abstraction Application
Application Calculation
Source: Applebaum (2008)
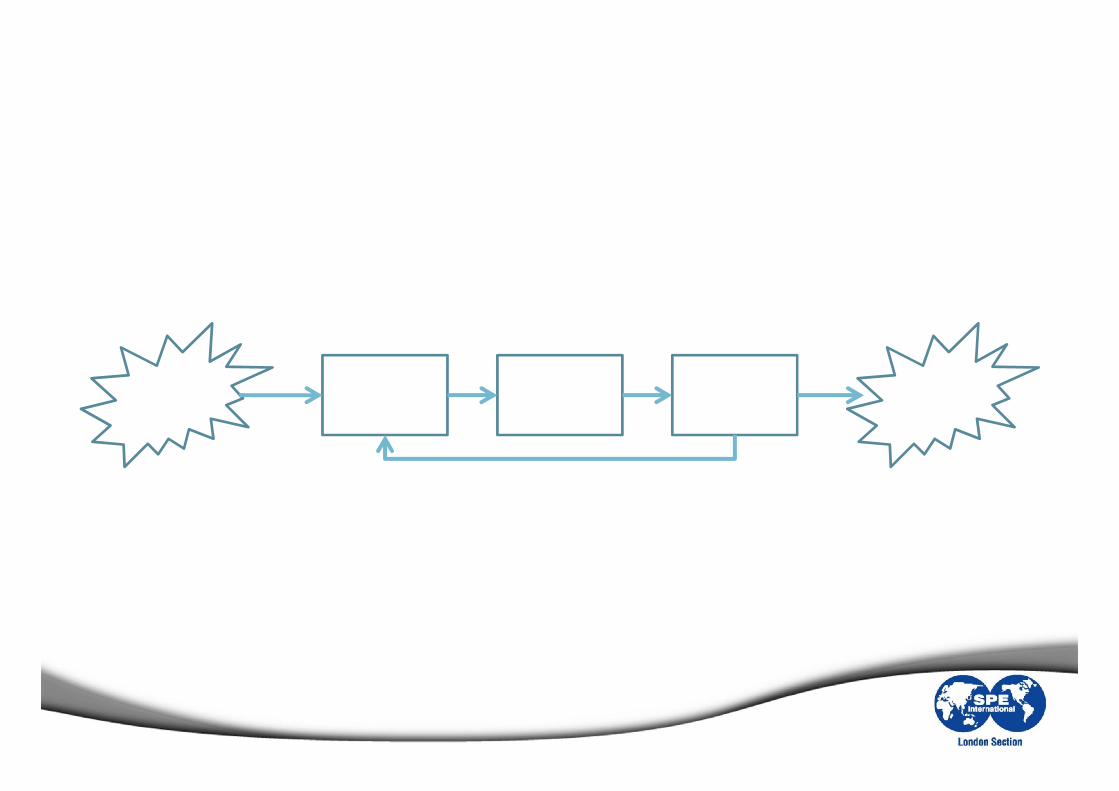
Is Decision Making an Iterative Process?
Formulate Evaluate Appraise
Refine
Real DecisionProblem
Real Action
Source: Howard (1988)
What about Preferences of Decision Makers?St
ages
Proc
esse
sCo
mpl
exiti
es
Generate Proposed Alternatives
Specify Objectives & Attributes
Determine Magnitude & Likelihood of Impact of Proposed Alternatives
Structure & Quantify Values of Decision Makers
Evaluate Proposed Alternatives and Conduct Sensitivity Analysis
Step 1Structure the Decision Problem
Step 2Assess PossibleImpact of Alternatives
Step 3Determine Preferences of Decision Makers
Step 4Evaluate and Compare Alternatives
• Multiple Objectives• Difficulty in Identifying Good
Alternatives• Intangibles• Many Impacted Groups• Sequential Nature of
Decisions
• Long-Time Horizons• Risk & Uncertainty• Interdisciplinary Substance
• Several Decision Makers• Value Tradeoffs• Risk Attitude
Source: Keeney et.al. (1982)
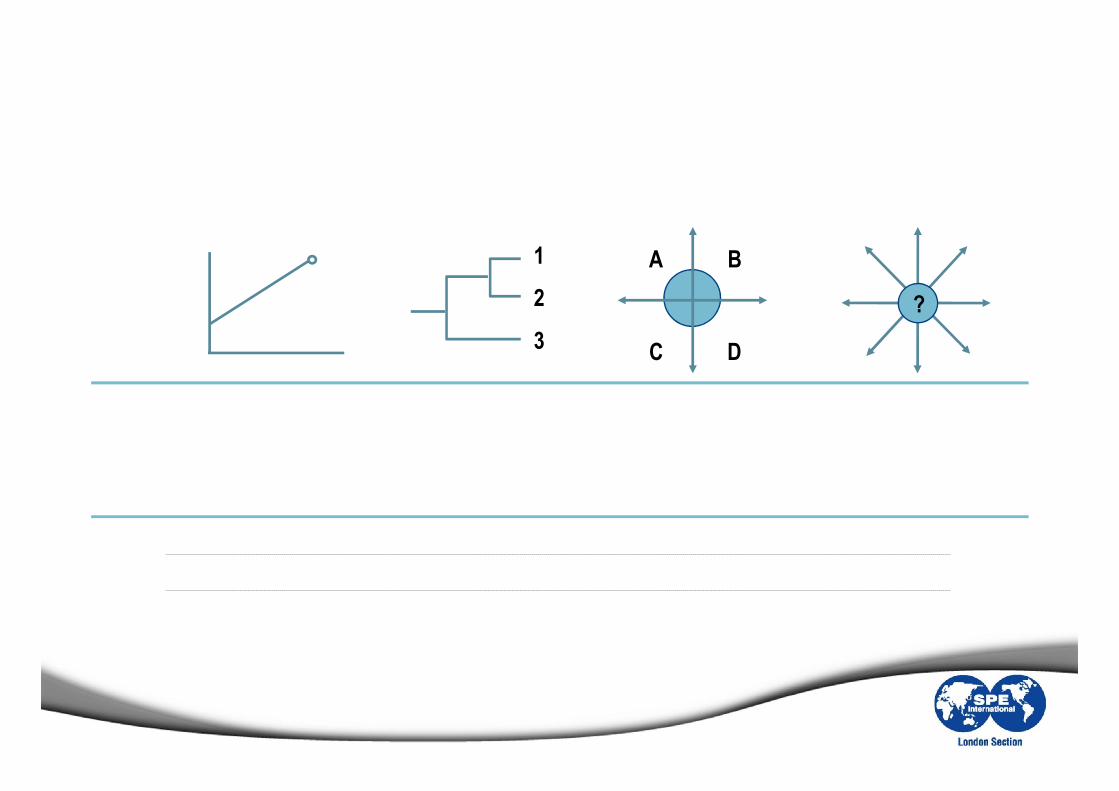
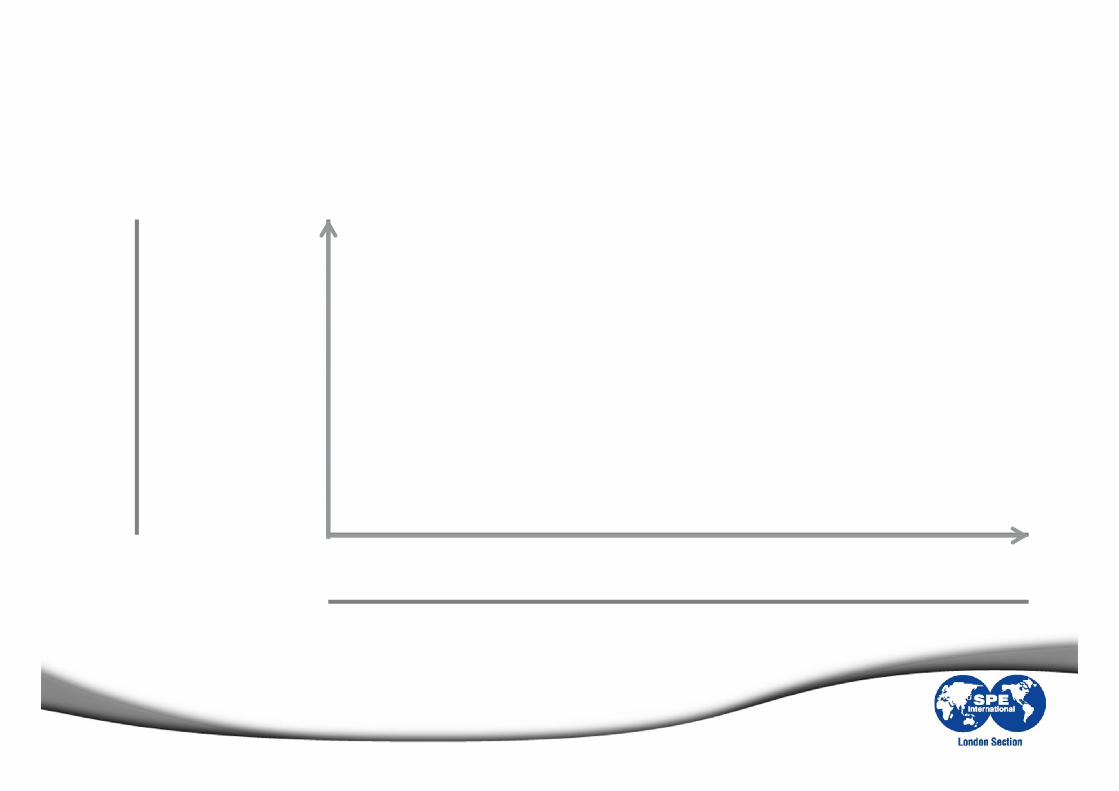
Are all Decision Problems the Same?
A single forecast precise enough for determination of strategy.
A few discrete outcomes that define the future.
Range of outcomes but no natural scenarios.
No basis to forecast the future, true ambiguity.
Traditional ModelsRegression Analysis
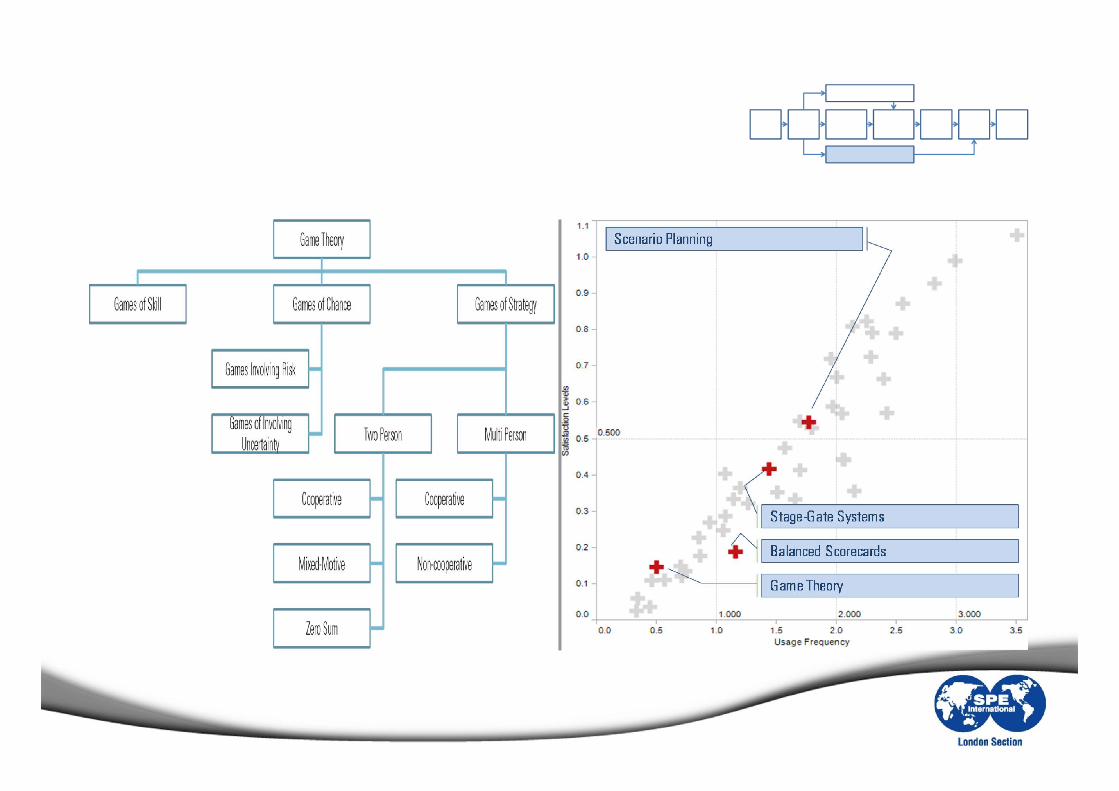
Decision AnalysisGame TheoryOption Valuation Models
Scenario PlanningMulti Case ModelsMonte Carlo Simulation
AnalogiesPattern RecognitionNon-linear dynamic models
Wha
t can
be
kno
wn?
Anal
ytic
alTo
ols
1
2
3
A B
C D
?
Source: Courtney, Kirkland and Viguerie (1997)
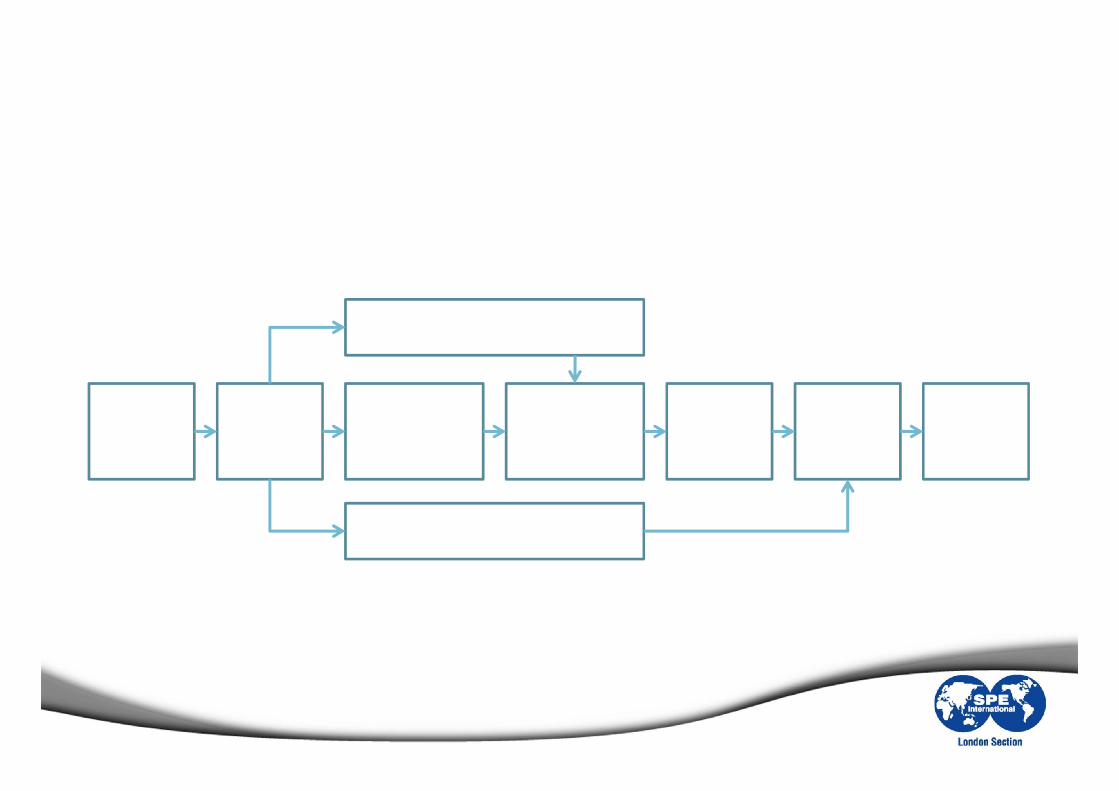
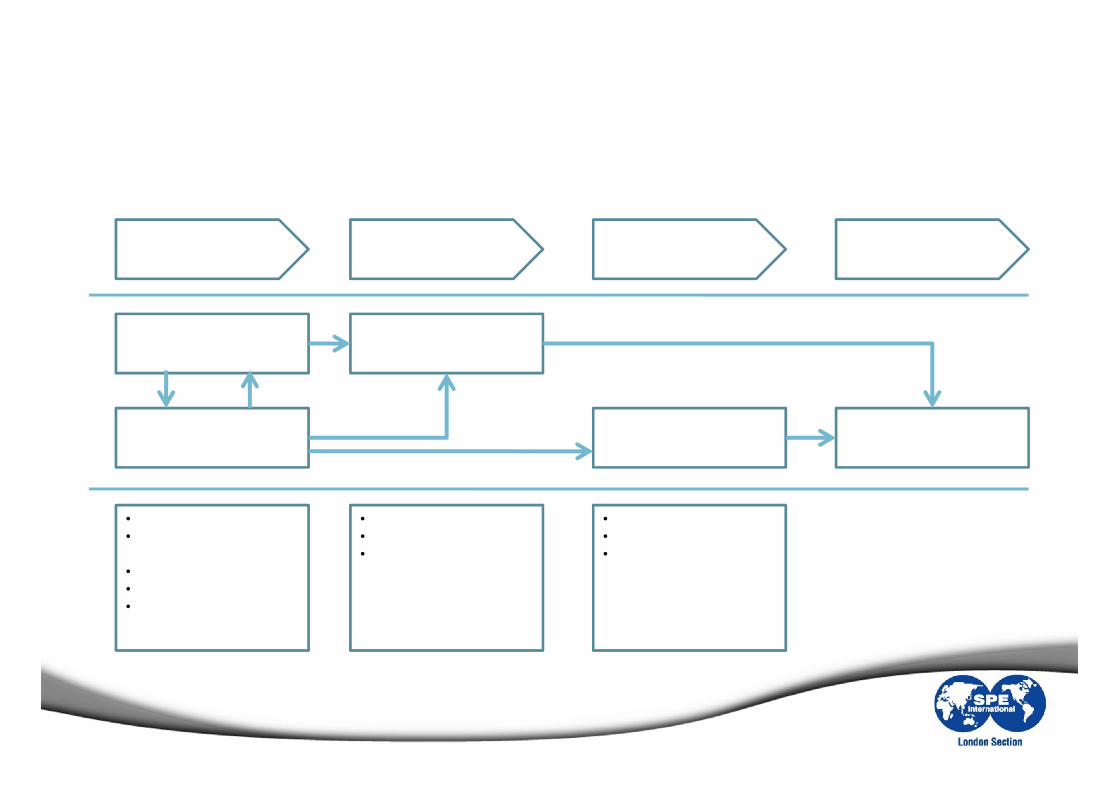
Towards a More Comprehensive Model…
Decision Problem
Structuring
Information Gathering
Assessment of probability
distribution for chance events
Evaluating alternative
strategies using choice criterion
Sensitivity Analysis
Managerial Judgment &
Review
Decision & Choice
Intangibles & other decision parameters
Assessing consequences (outcomes) associated with alternative strategies
Source: Thomas (1982) & Raiffa (1968)

Decision Analysis, What is it?
Motivations & Design of the Study
Toolkit Analysis
Summary of Results
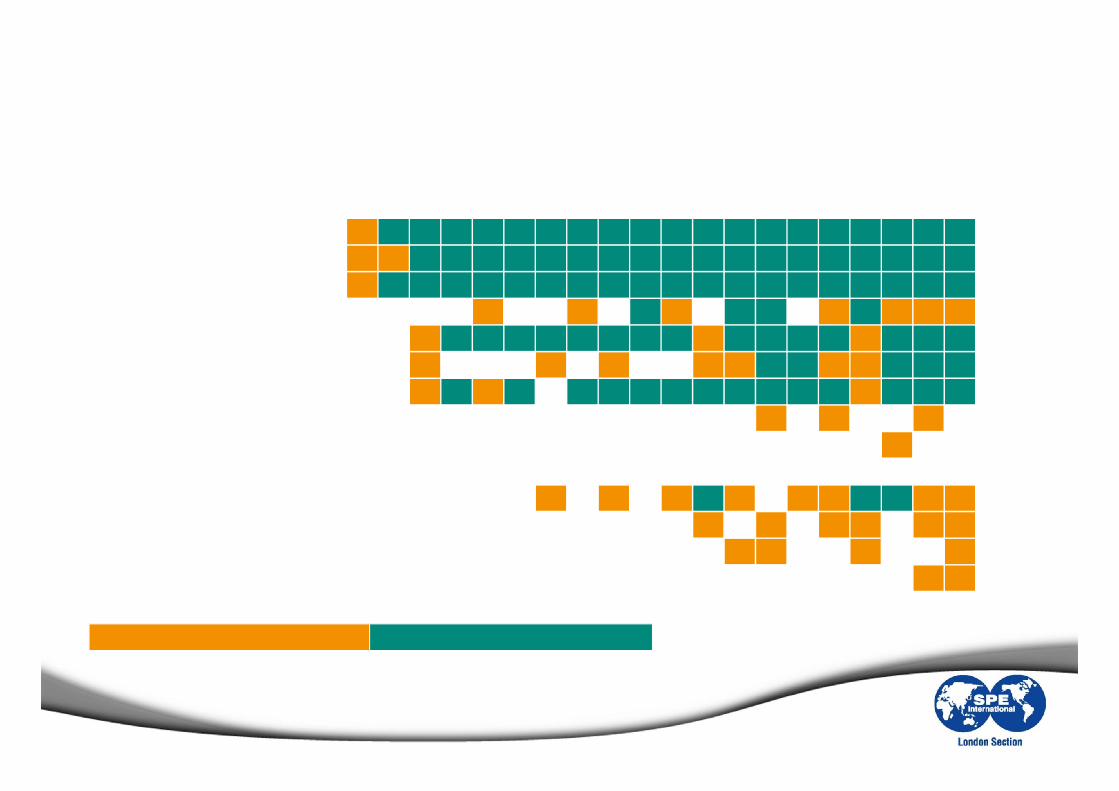
Previous SurveysNorth Sea Operators on Decision Analysis Tools
A B C D E F G H I J K L M N O P Q R S T Score Structured Analysis 98%Holistic view 95%Discounted cash flow 98%Risk and uncertainty definitions 38%Use MC for prospect reserves 83%Take p10,p50,p90 43%EMV, via decision tree 78%Use MC for prospect economics 8%Use MC for production reserves 3%Use MC for production econ. 0%Portfolio Theory 35%Option Theory 15%Preference Theory 10%Qualitative and Quantitative 5%Sophistication Score 11 18 32 36 36 36 36 39 43 43 43 46 54 54 54 54 54 57 61 61
Partial Implementation Full Implementation
Source: Simpson et.al. (2000)

Survey DesignToolkit Framework
Decision Problem
Structuring
Information Gathering
Assessment of probability
distribution for chance events
Evaluating alternative
strategies using choice criterion
Sensitivity Analysis
Managerial Judgment &
Review
Decision & Choice
Intangibles & other decision parameters
Assessing consequences (outcomes) associated with alternative strategies
Source: Thomas (1982) & Raiffa (1968)
Survey DesignKey Measures
Satis
fact
ion
Leve
ls
Very Satisfied 2
Satisfied 1
Neutral 0
Dissatisfied -1
Very Dissatisfied -2
Never 0
Almost Never 1
Sometimes2
Very Often3
Always4
Usage Frequency
Blunt InstrumentsRudimentary Implements
Power ToolsSpecialty Tools
Source: Rigby and Bilodeau (2007) and Author’s
Survey DesignResponse Profile
Executive Manager Spv. Professional
Earth S. Engineering Prj.M. Finance/Legal/Commercial
4 yr. Bachelors Degree / Less Masters Degree Ph.D. Higher
Less than 12 Yrs 13-20 Years 21 Years & +
E&P Companies Others
Less than 100 100-1,000 1,000-10,000 More than 10,000 Employees
Less than $100M $100M-$1B $1B-$10B More than $10B Revenue
Located @ US / Canada Europe Asia/Australia Others
Company Headquartered in Located @ US / Canada Europe Asia/Aus. Others
About 400 respondents…
Decision Analysis, What is it?
Motivations & Design of the Study
Toolkit Analysis
Summary of Results
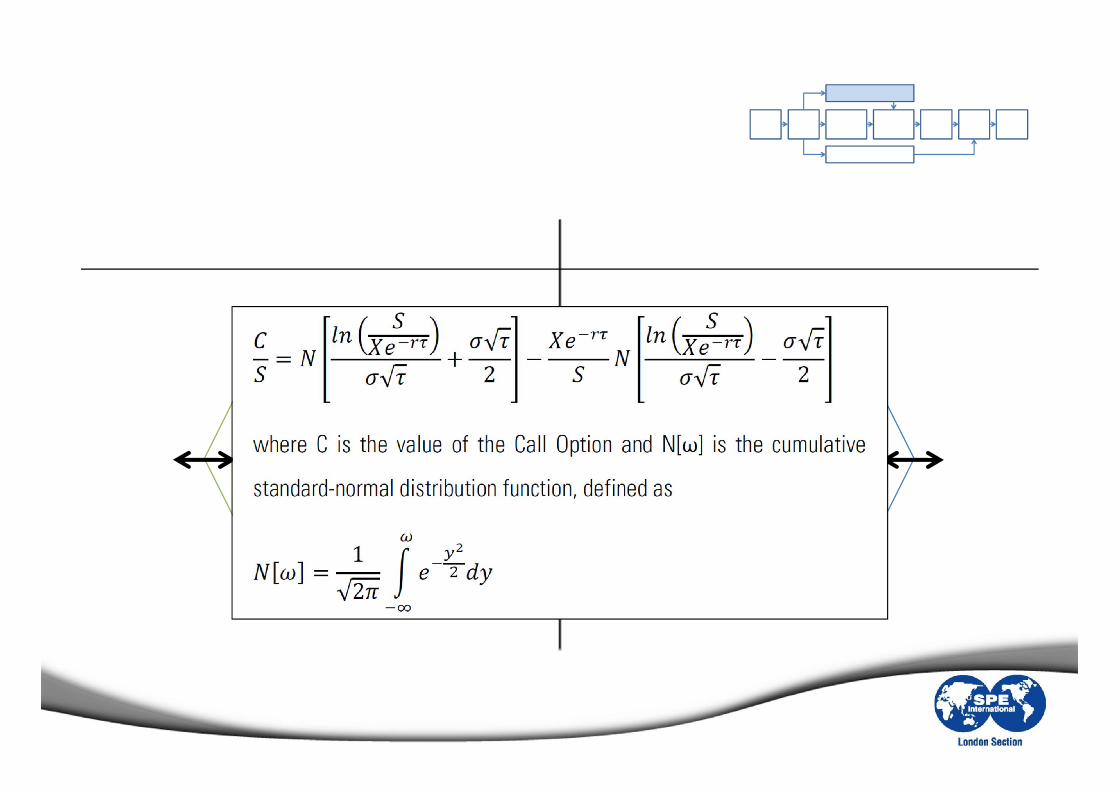
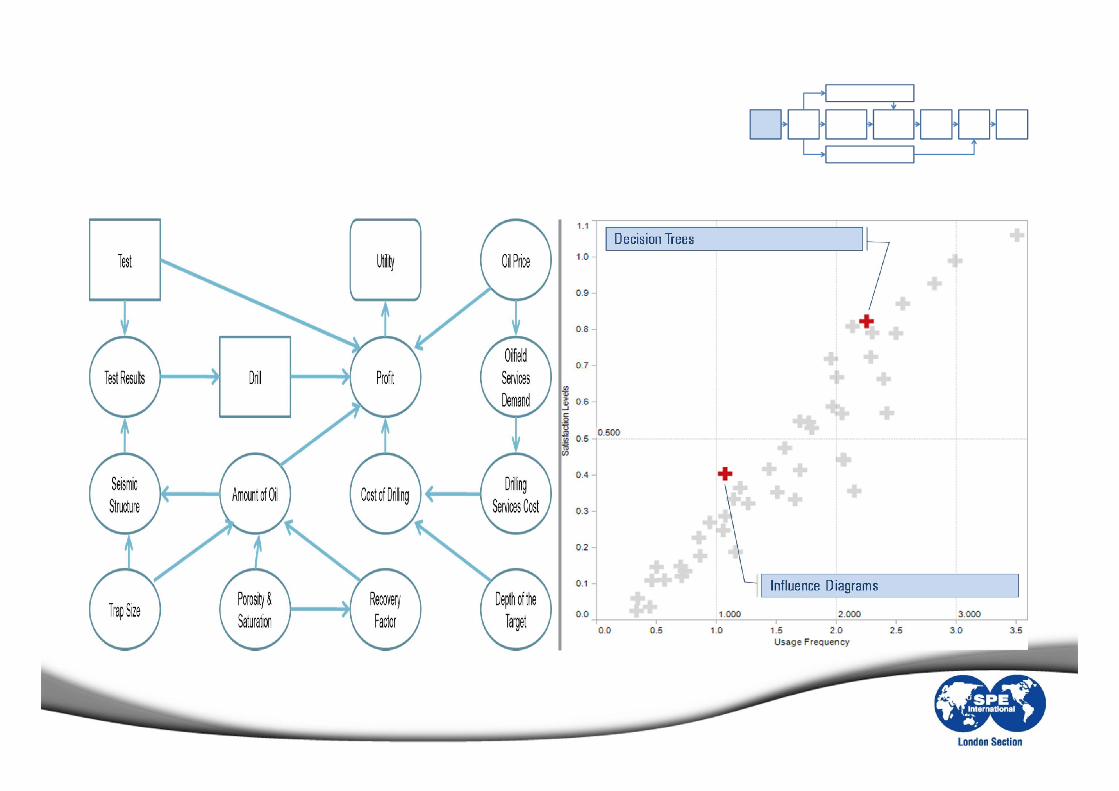
Assessing Consequences of Alternate Strategies
Assessing Consequences of Alternate Strategies
Discounted Cashflow Analysis Real Option Value Levers
PV ofFixed Cost
PV ofExp. CF.
PV ofExp. CF.
ValidityPeriod
Volatility ofExp. CF
Yield ofRiskless Sec.
Lost Value OverOption Period.
PV ofFixed Cost
Assessing Consequences of Alternate Strategies
Discounted Cashflow Analysis Real Option Value Levers
PV ofFixed Cost
PV ofExp. CF.
PV ofExp. CF.
ValidityPeriod
Volatility ofExp. CF
Yield ofRiskless Sec.
Lost Value OverOption Period.
PV ofFixed Cost
Decision Problem Structuring
Information Gathering
Project DataProject ScheduleCapital & Operating Costs Reserve BaseProduction Profile & Forecast
Regulatory FrameworkLegal SystemFiscal SystemProduction Sharing/JV ContractsJoint Operating/Tariff Contracts
Economic Analysis
Macro EconomicsProduct PricesExchange RatesInflation Data & ForecastDiscount Rates, Financing Env.
Decision Enablers / MetricsRevenue & Revenue SplitBefore & After Tax Cash FlowsNPV, IRR, Pay Out Time, PIREconomic Limit & Sensitivity An.
Information GatheringProduction Information
Information GatheringCosting Information
Source: Lædre et. al. (2001)
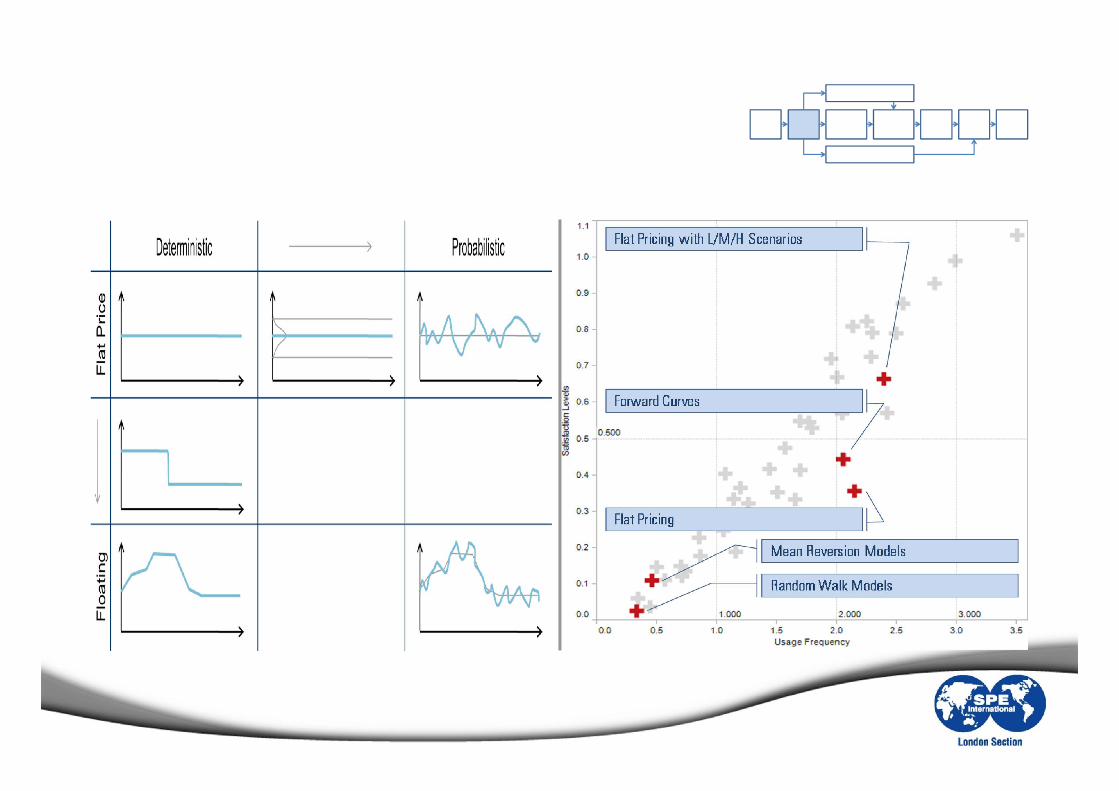
Information GatheringProduct Pricing
Source: Staber (2006)
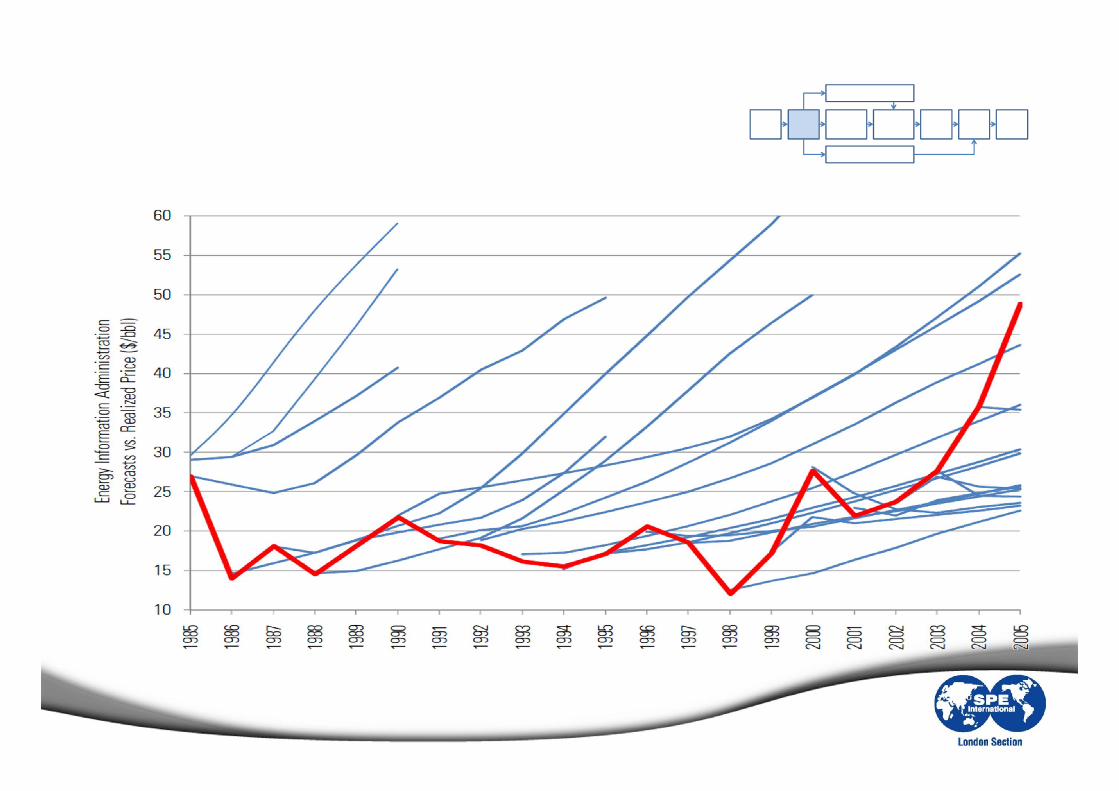
Information GatheringProduct Pricing
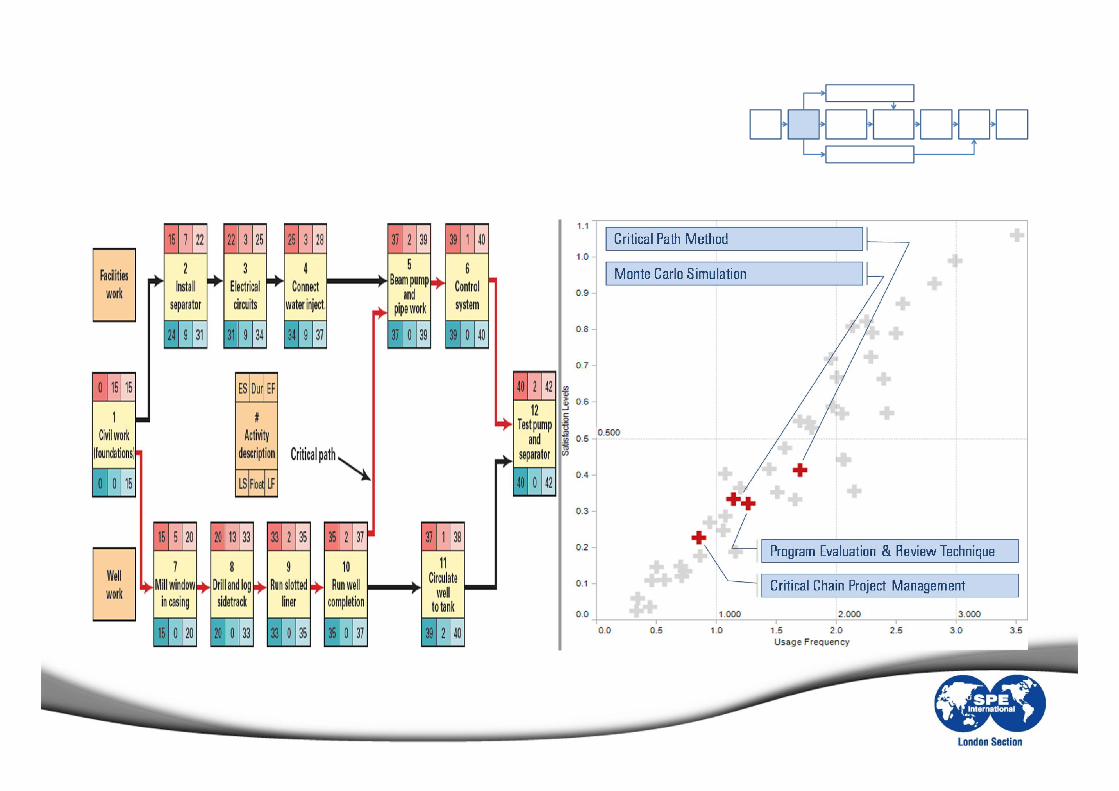
Information GatheringScheduling
Source: Wood (2001)
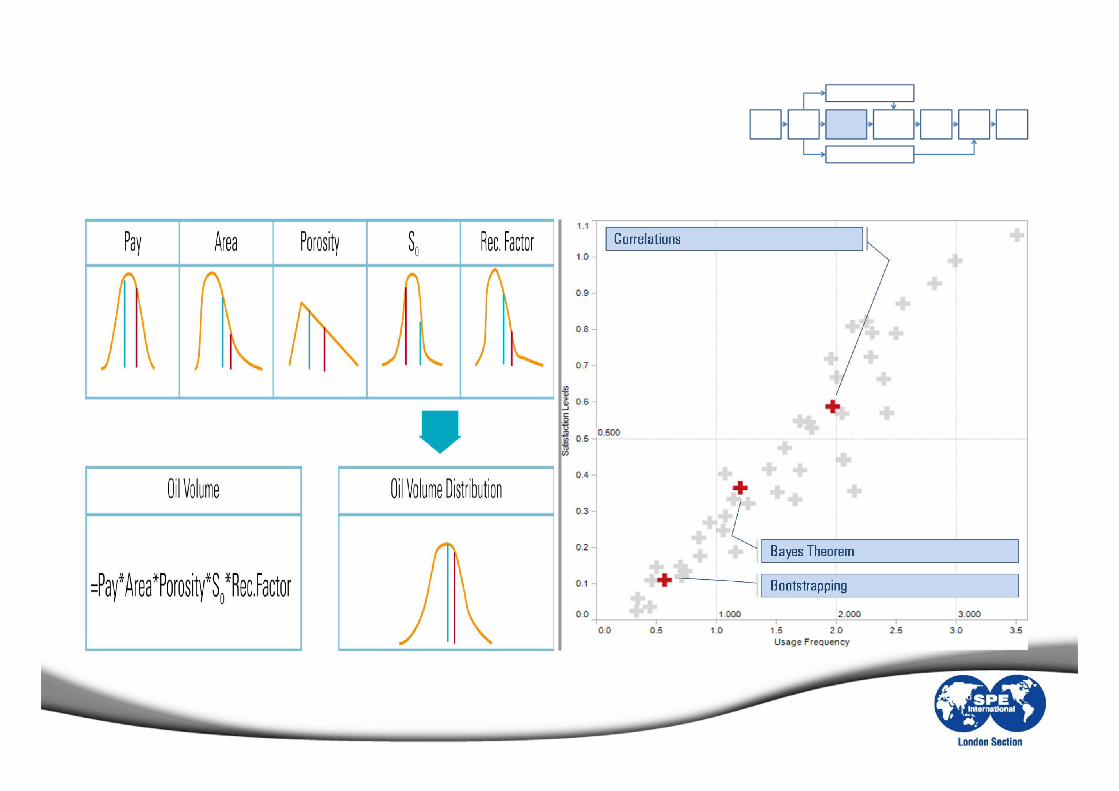
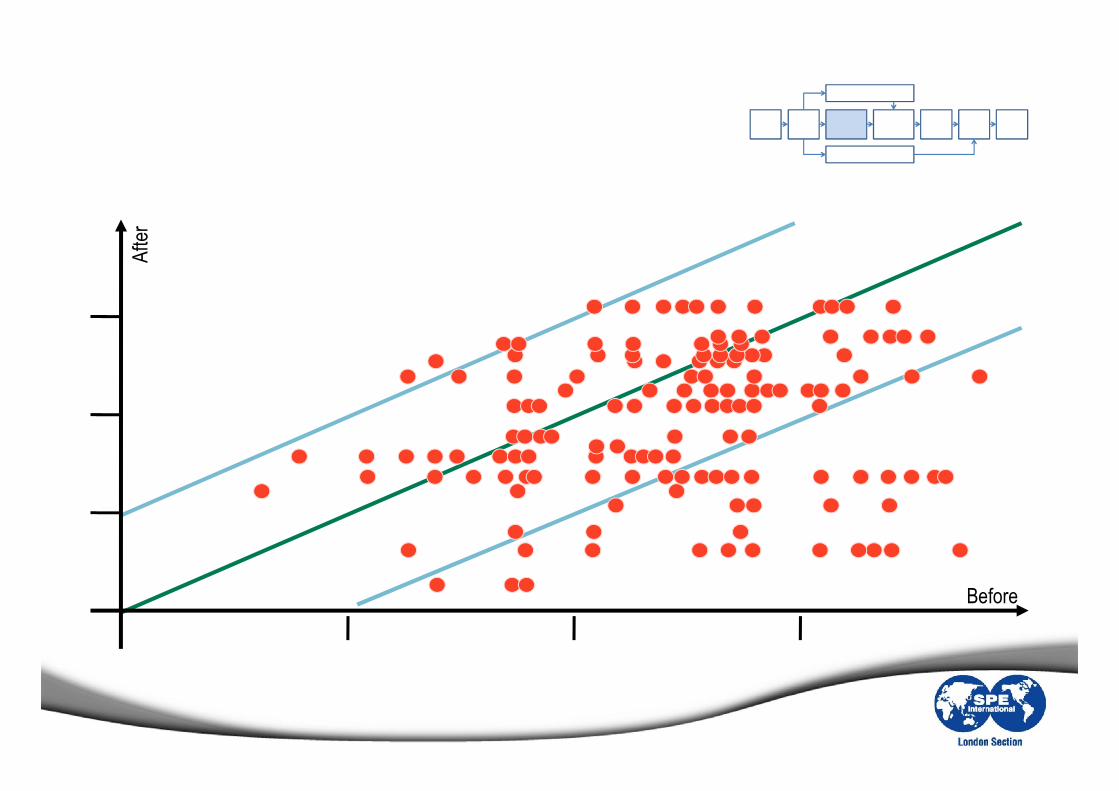
Assessment of Probability Distributions
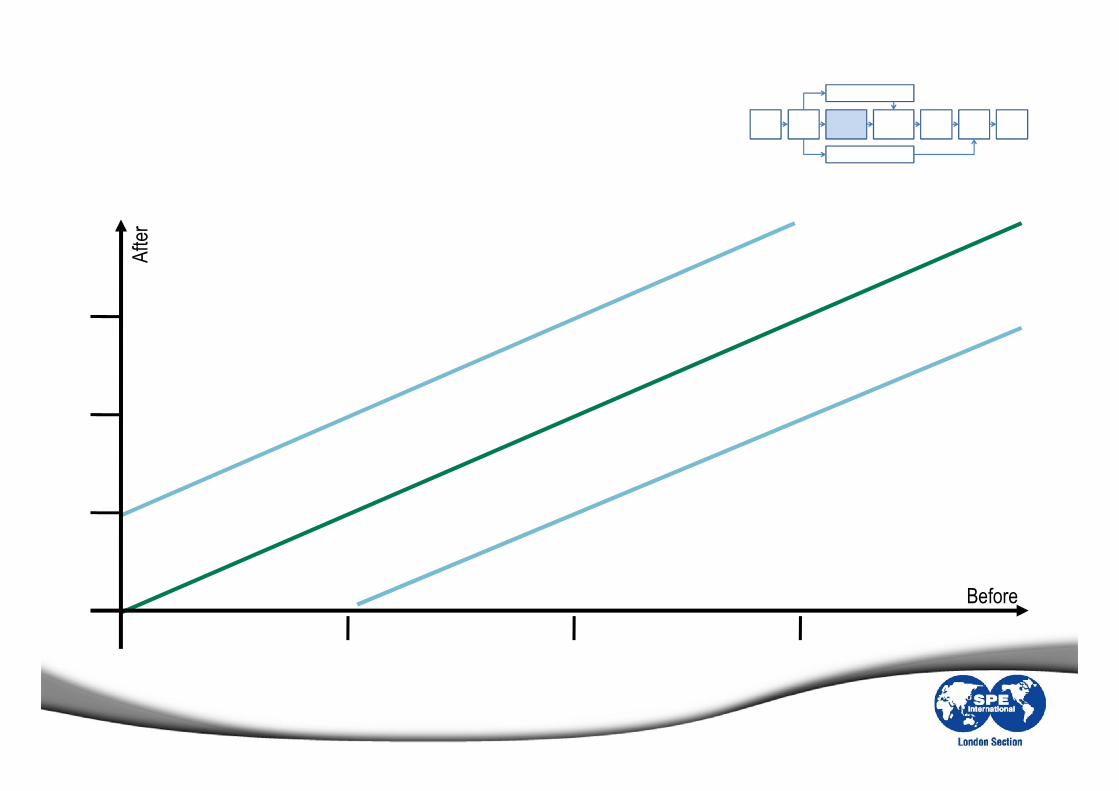
Assessment of Probability Distributions
10 10,000
1010
,000
100 1,000
100
1,00
0
Source: Norwegian Petroleum Directorate
Before
Afte
r
Assessment of Probability Distributions
10 10,000
1010
,000
100 1,000
100
1,00
0
Source: Norwegian Petroleum Directorate
Before
Afte
r
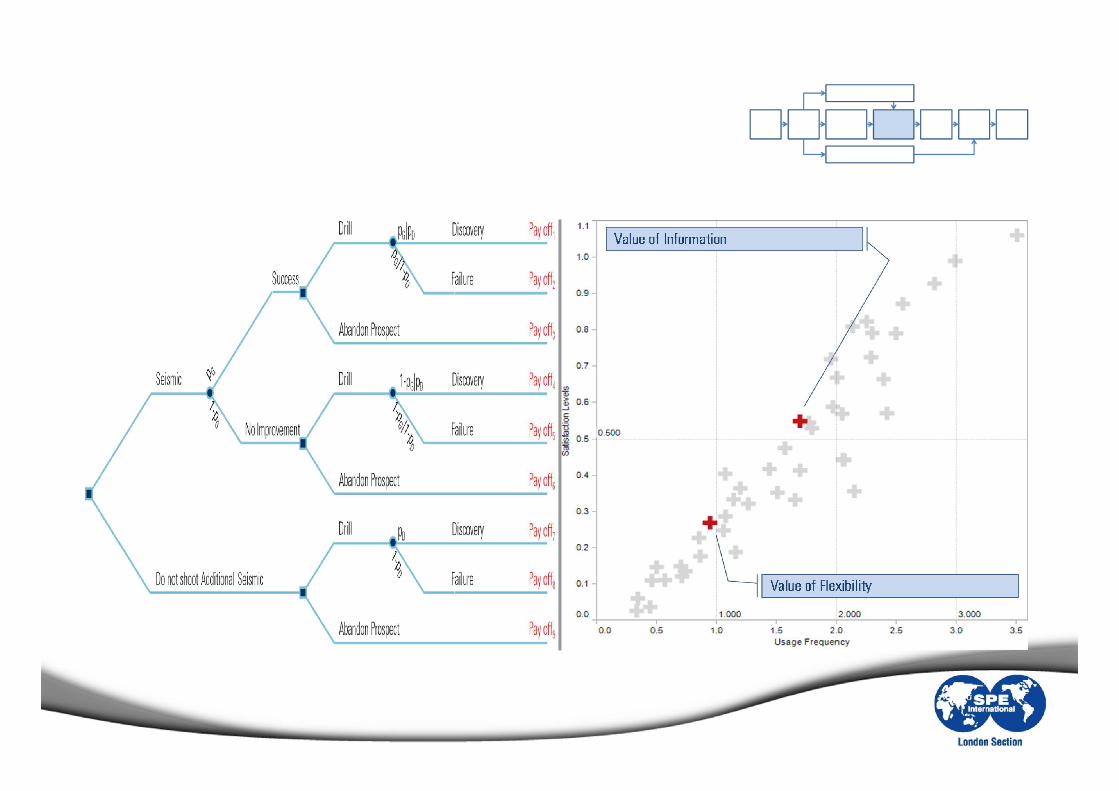
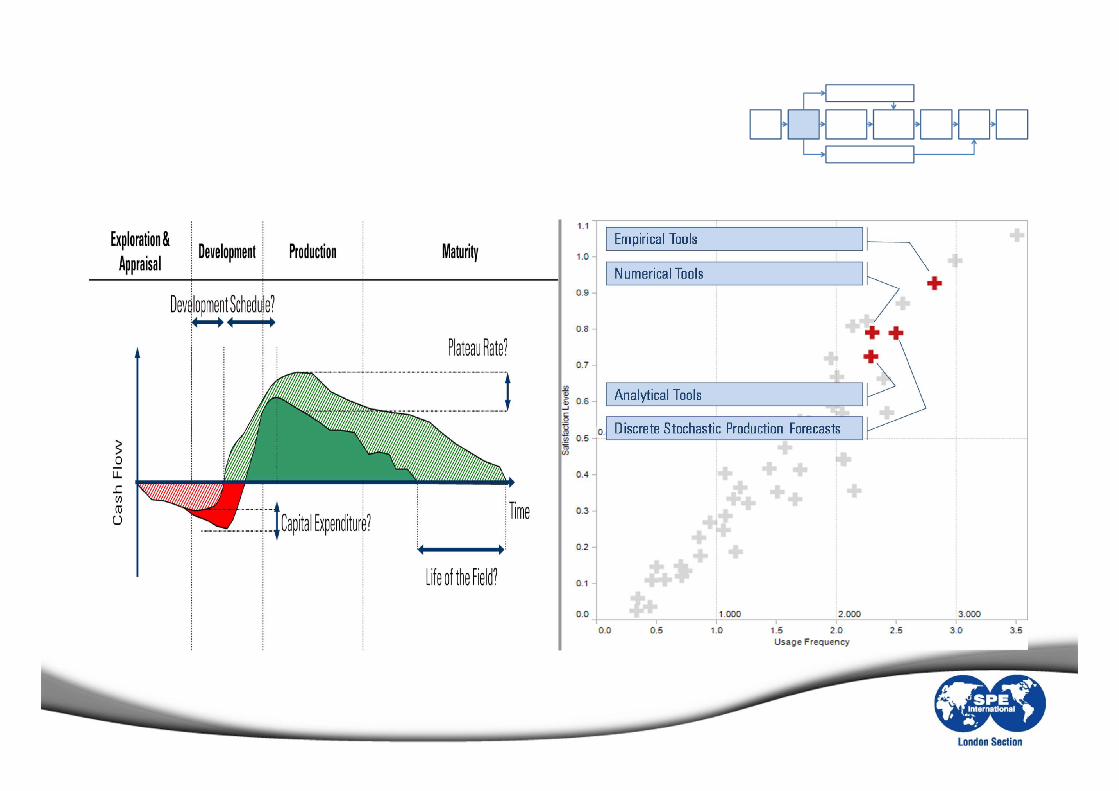
Evaluating Alternative Strategies
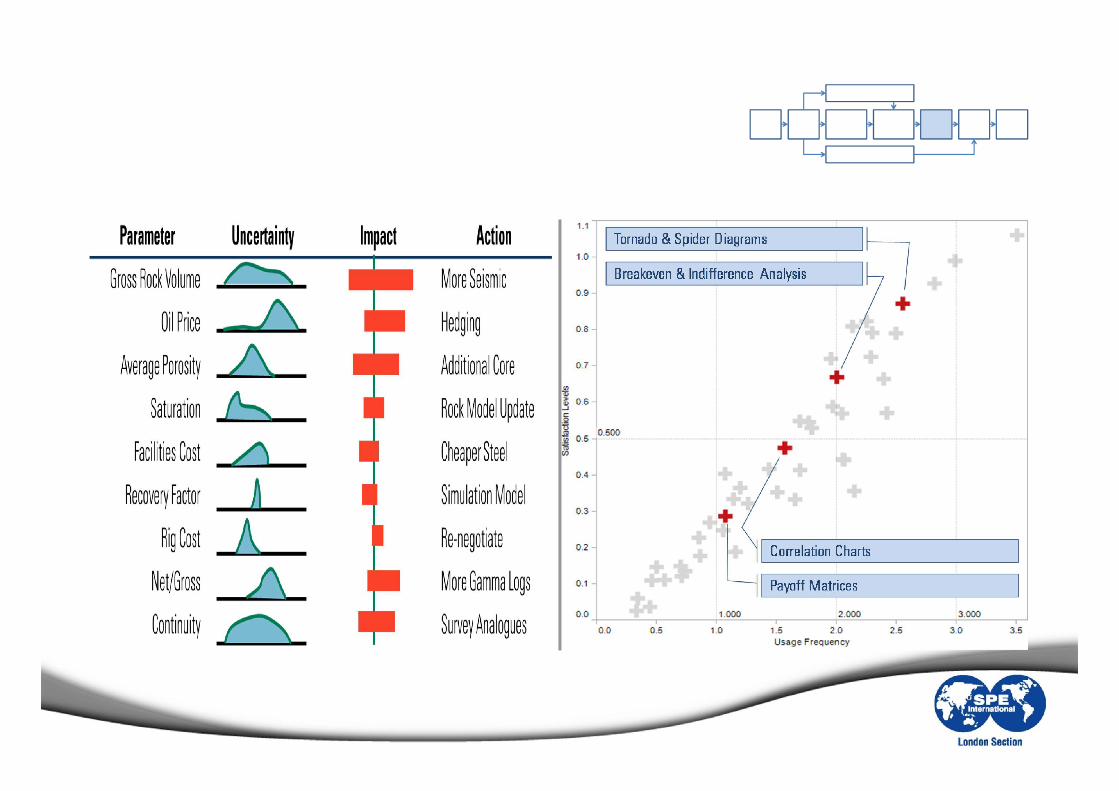
Sensitivity Analysis
Source: Bratvold & Begg (2008)
Intangibles & Other Decision Parameters
Source: Kelly (2003)
Intangibles & Other Decision Parameters
Source: Asrilhant, Meadows & Dyson (2006)
Managerial Judgment & Review
Managerial Judgment & Review
Source: Luehrman (1998)

Decision Analysis, What is it?
Motivations & Design of the Study
Toolkit Analysis
Summary of Results

Key Classifications
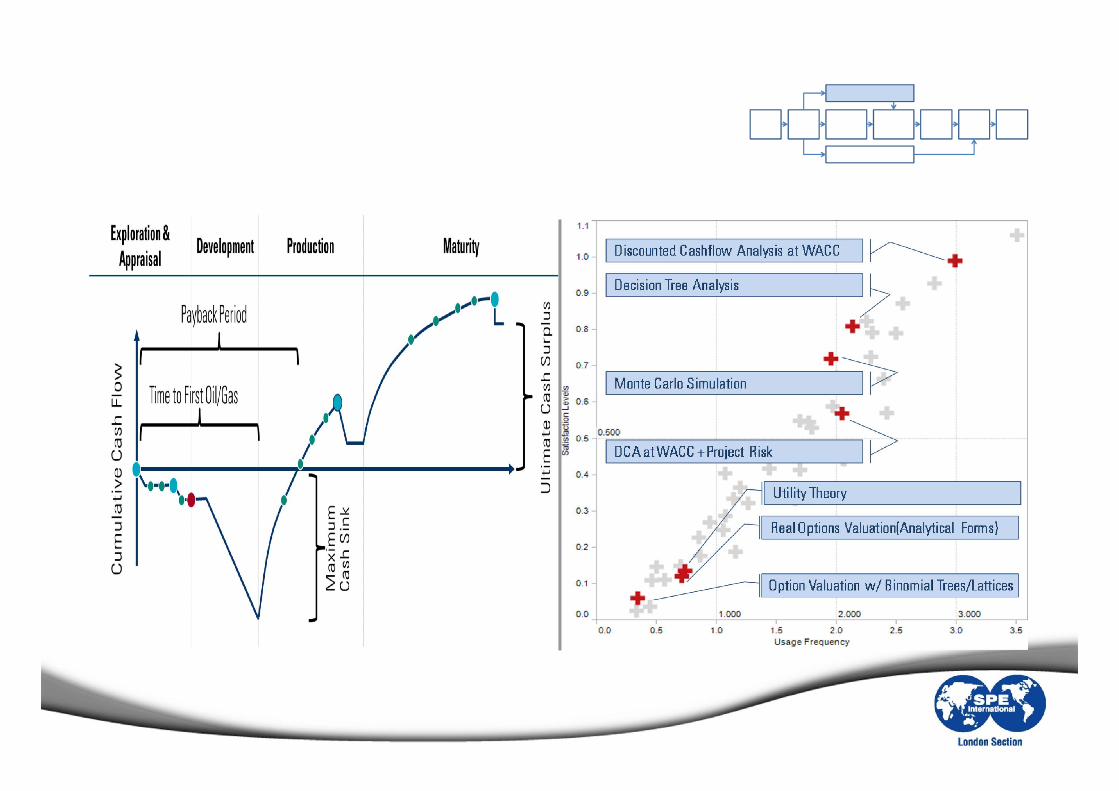
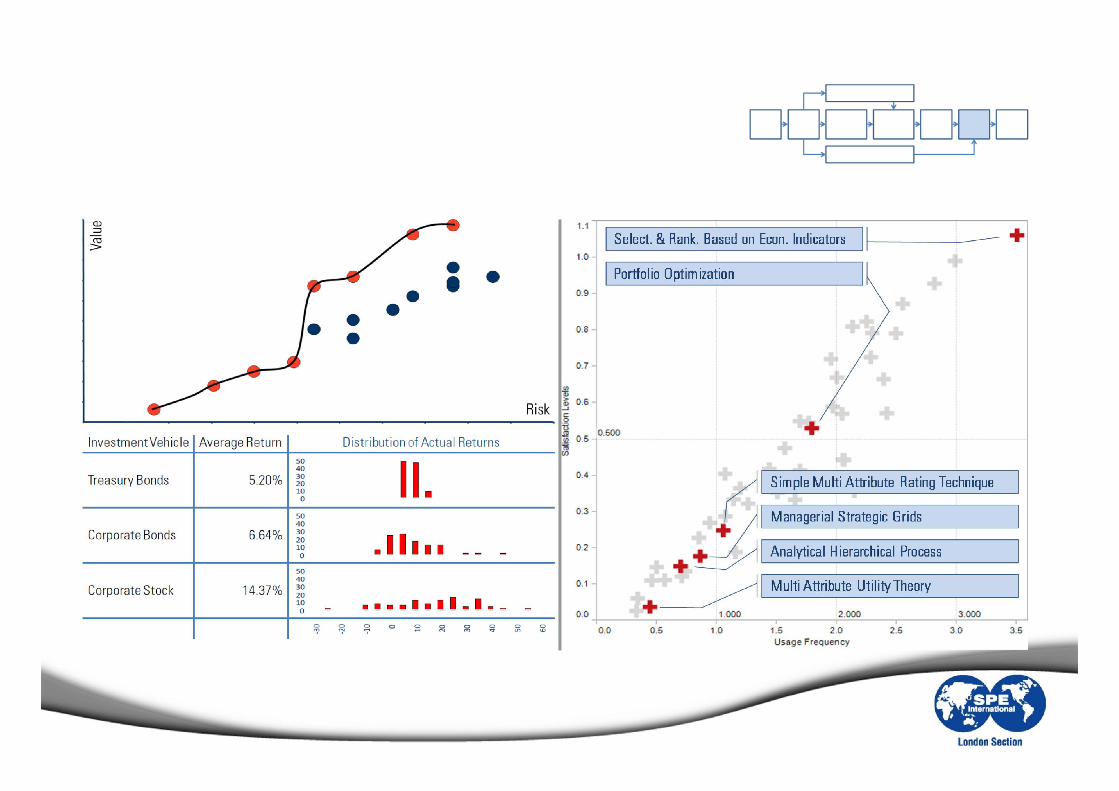
Tools with universal acceptance are characterized by high levels and low variance of Utilization Frequency, such as “Selection & Ranking Based on Economic Indicators”
Tools that haven’t been embraced by industry have both low levels and variance of Utilization Frequency, such as “Random Walk Models”.
Tools with partial acceptance have moderate utilization but high variance, some exhibit linkage to demographic dimensions such as “scheduling tools” being used more by Project Mngmnt.

Demographic Dimensions
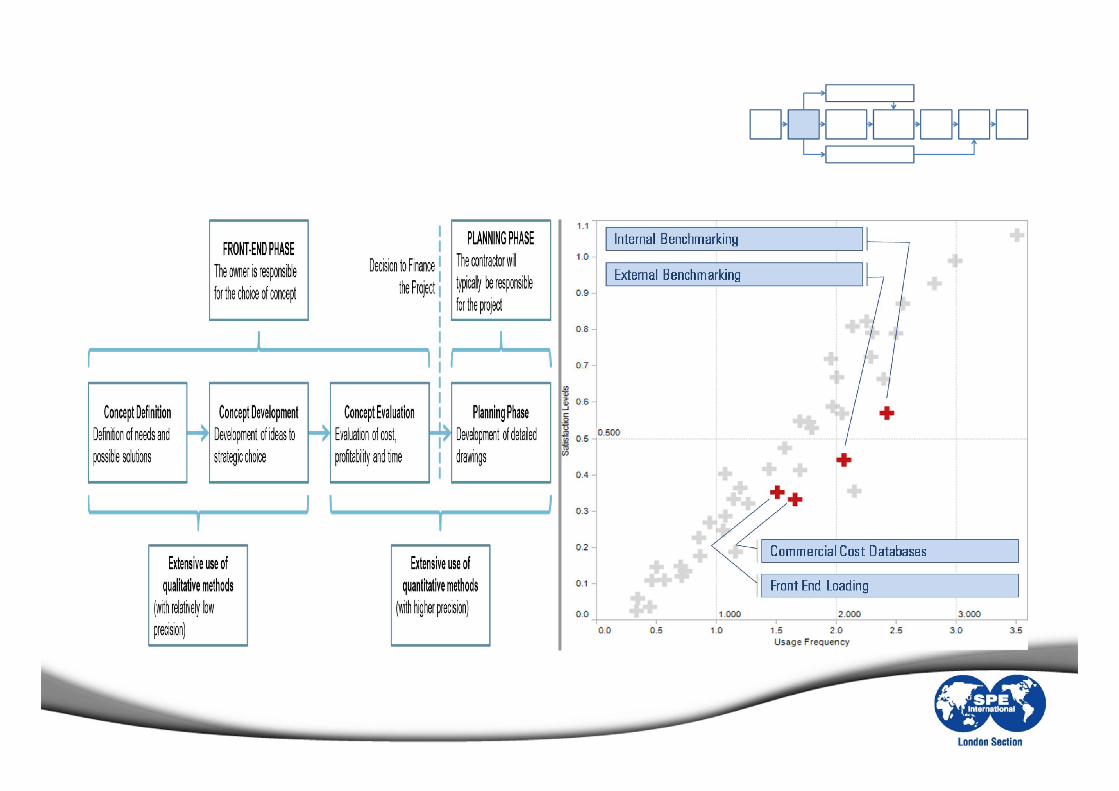
Company Size; tools such as Discrete Stochastic Forecasts, Front End Loading, Balanced Scorecards show an increasing trend with increasing company size
Job Position Level; Tools such as Scenario Planning, Tornado & Spider Diagrams, Breakeven Analysis, Payoff Matrices appear to be more used by executives.
Functional Silos; Especially present in Information Gathering Group of tools, certain sets appear to be used by certain functional groups.
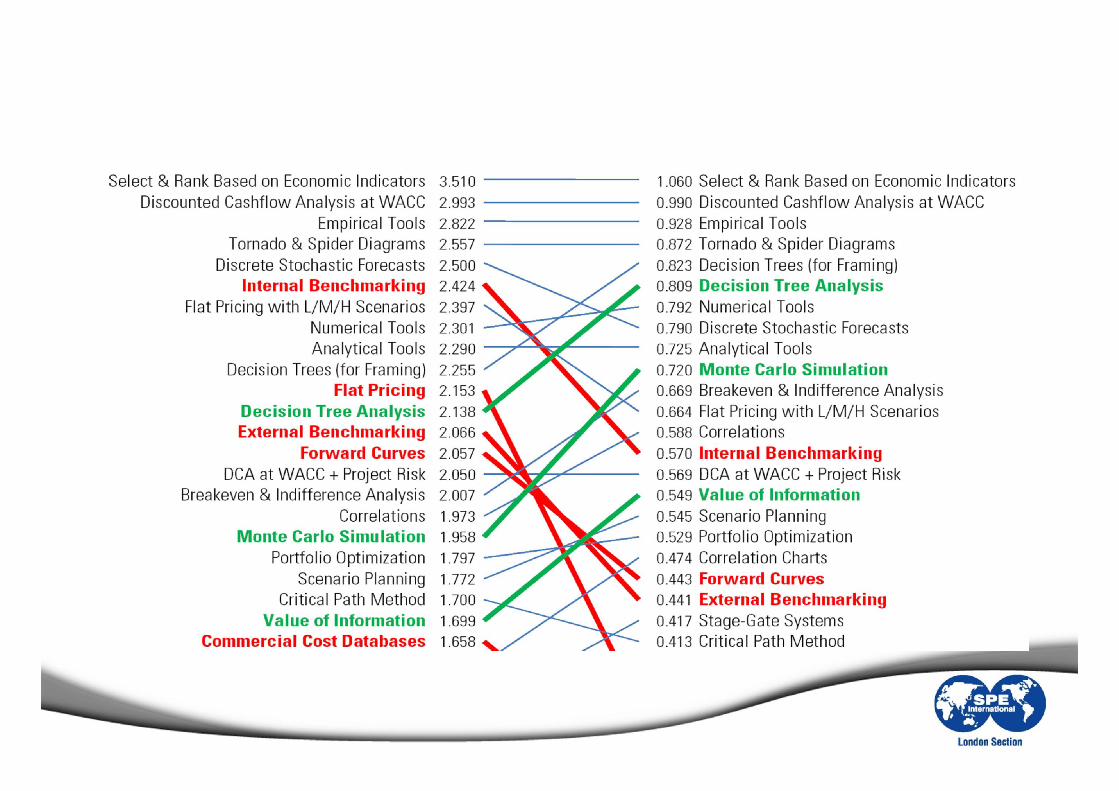
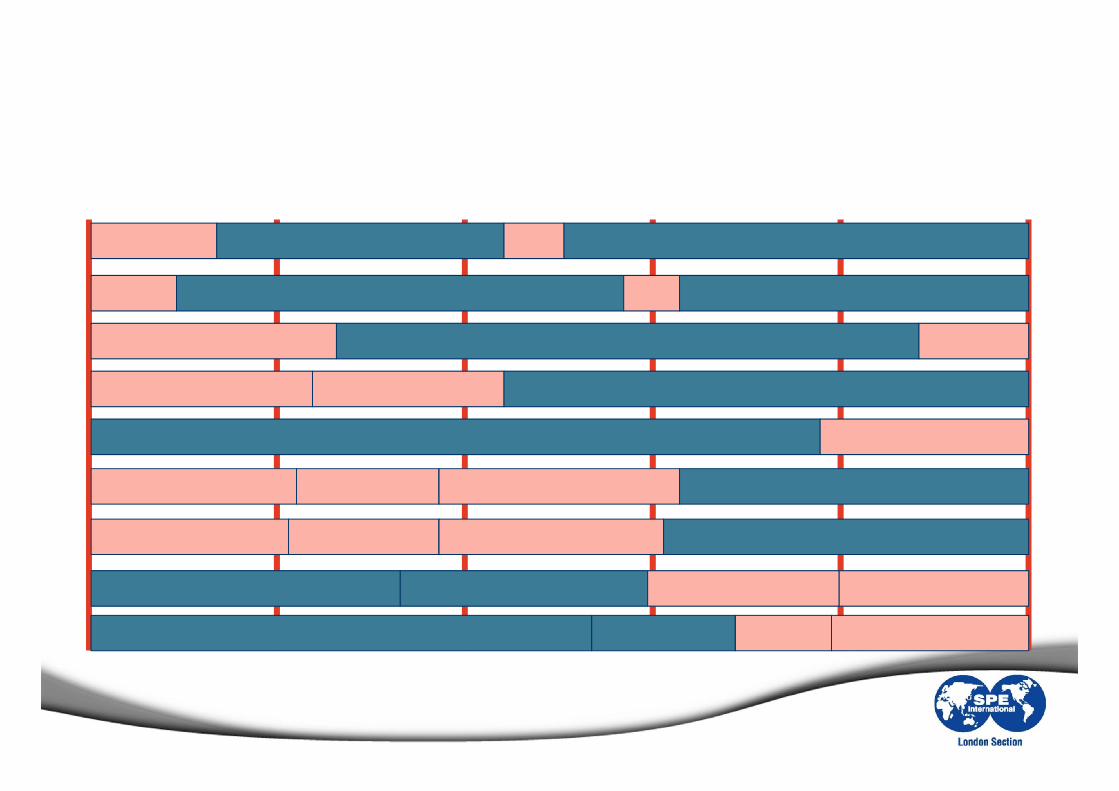
Rank Order Usage Frequency vs. Satisfaction
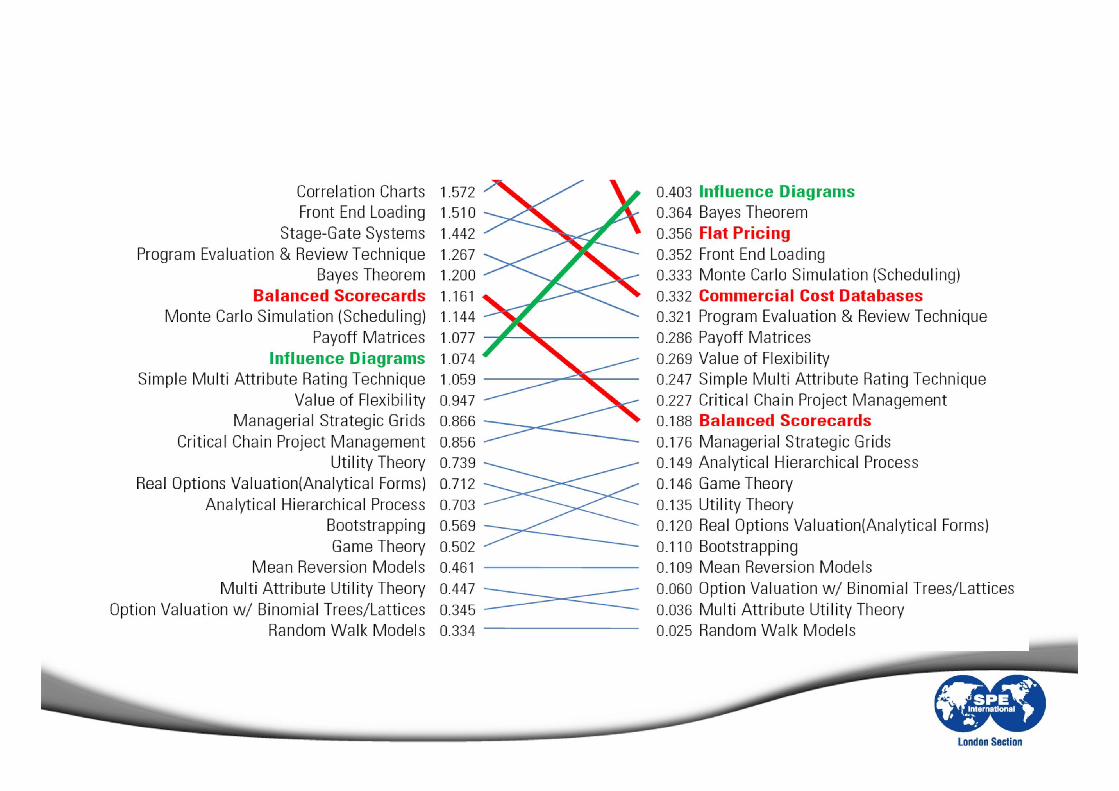
Rank Order Usage Frequency vs. Satisfaction
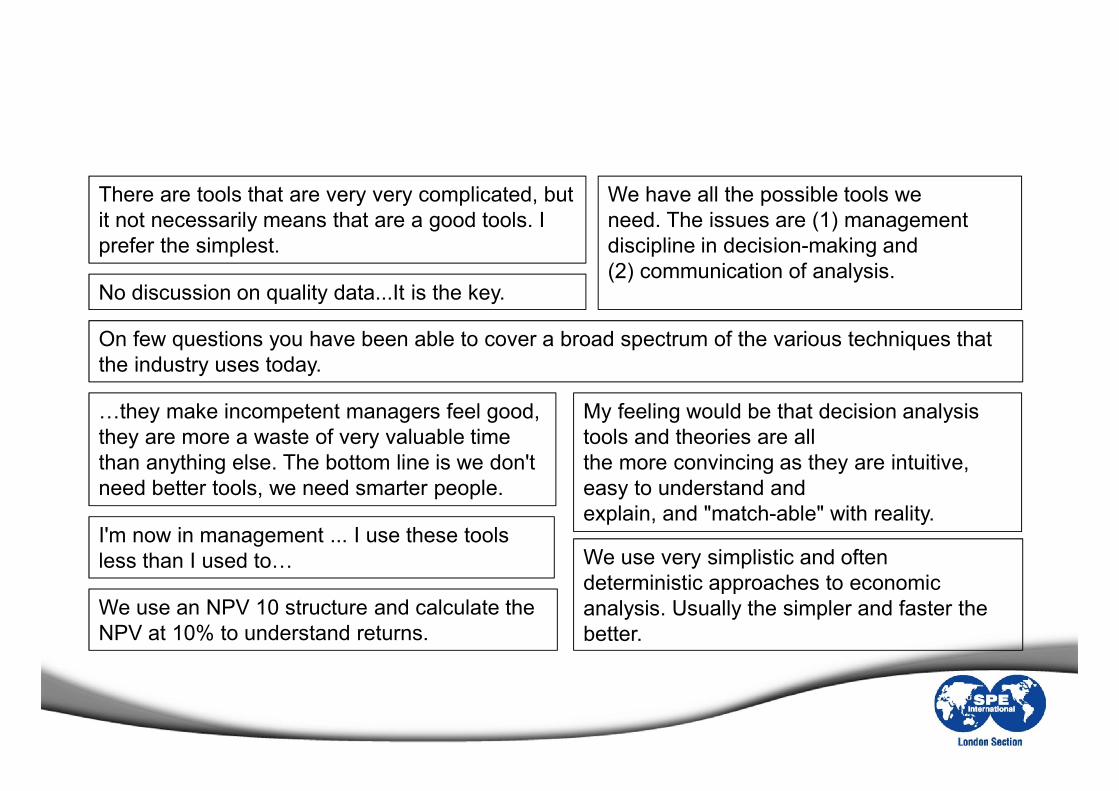
There are tools that are very very complicated, but it not necessarily means that are a good tools. I prefer the simplest.
On few questions you have been able to cover a broad spectrum of the various techniques that the industry uses today.
My feeling would be that decision analysis tools and theories are allthe more convincing as they are intuitive, easy to understand andexplain, and "match-able" with reality.
We have all the possible tools weneed. The issues are (1) management discipline in decision-making and(2) communication of analysis.
I'm now in management ... I use these tools less than I used to…
…they make incompetent managers feel good, they are more a waste of very valuable time than anything else. The bottom line is we don't need better tools, we need smarter people.
We use very simplistic and often deterministic approaches to economic analysis. Usually the simpler and faster the better.
No discussion on quality data...It is the key.
We use an NPV 10 structure and calculate the NPV at 10% to understand returns.
Respondent Comments
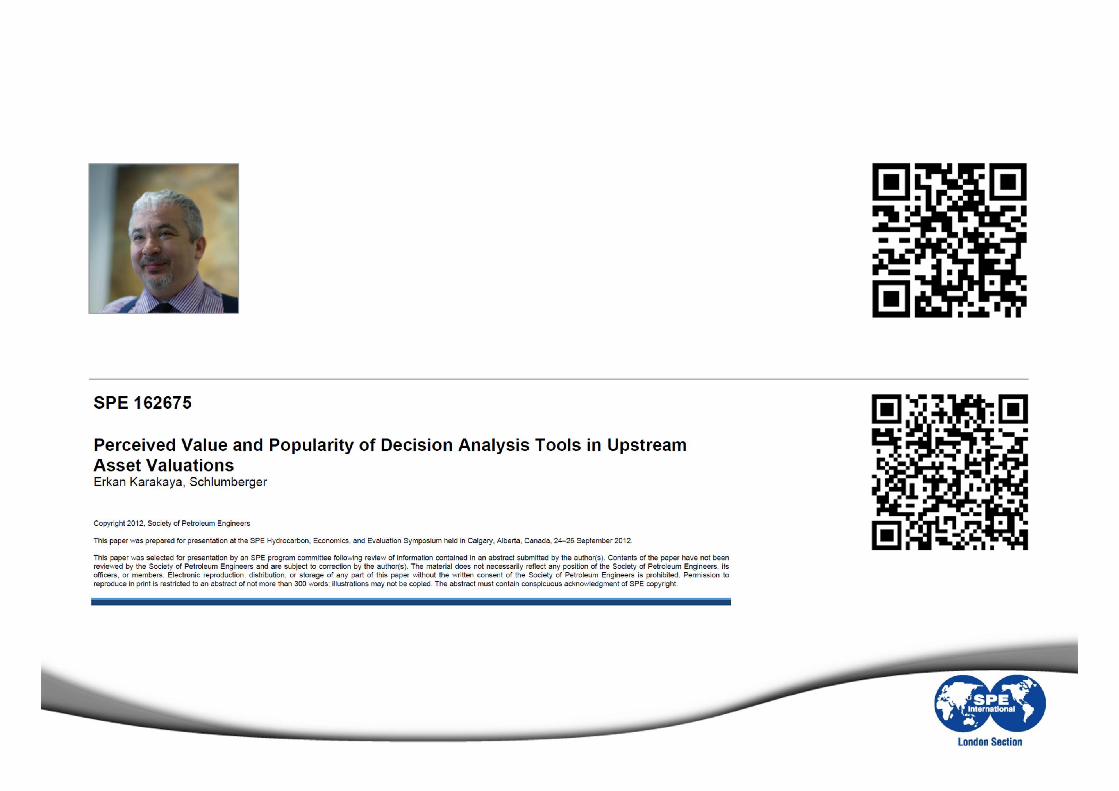
Contact & References
http://www.onepetro.org/mslib/app/Preview.do?paperNumber=SPE-162675-MS&societyCode=SPE
http://www.linkedin.com/pub/erkan-karakaya/2/439/149