Value of Coproduction of Ethanol and Furfural from … Value of Coproduction of Ethanol and Furfural...
38
SERI/TP-231-2147 UC Category: 61a The Value of Coproduction of Ethanol and Furfural from Acid Hydrolysis Processes Stephen Parker Mark Calnon Daniel Feinberg Arthur Power Solar Energy Research Institute Lawrence Weiss Energy Technology Associates May 1984 To be presented at the 6th Symposium on Biotechnology for Fuels and Chemicals Gatlinburg, Tenn. 15-18 May 1984 Prepared under Task No. 1423.10 FTP No. 153 Solar Energy Research Institute A Division of Midwest Research Institute 1617 Cole Boulevard Golden, Colorado 80401 Prepared for the U.S. Department of Energy Contract No. DE-AC02-83CH10093
Transcript of Value of Coproduction of Ethanol and Furfural from … Value of Coproduction of Ethanol and Furfural...

SERI/TP-231-2147
UC Category: 61a
The Value of Coproduction of Ethanol and Furfural from Acid Hydrolysis Processes
Stephen Parker
Mark Calnon
Daniel Feinberg
Arthur Power
Solar Energy Research Institute
Lawrence Weiss
Energy Technology Associates
May 1984
To be presented at the
6th Symposium on Biotechnology for Fuels and
Chemicals
Gatlinburg, Tenn.
15-18 May 1984
Prepared under Task No. 1423.10
FTP No. 153
Solar Energy Research Institute A Division of Midwest Research Institute
1617 Cole Boulevard
Golden, Colorado 80401
Prepared for the
U.S. Department of Energy Contract No. DE-AC02-83CH10093

NOTICE
This report was prepared as an account of work sponsored by the United States Government. Neither the United States nor the United States Department of Energy, nor any of their employees, nor any of their contractors, subcontractors, or their employees, makes any warranty, express or implied, or assumes any legal liability or responsibility for the accuracy, completeness or usefulness of any information, apparatus. product or process disclosed, or represems that its use would not infringe privately owned rights.

THE VALUE OF COPRODUCTION OF ETHANOL
AND FURFURAL FROM ACID HYDROLYSIS PROCESSES
Stephen Parker, Mark Calnon, Daniel Feinberg, Arthur Power
Solar Energy Research Institute
Golden, Colorado 80401
Lawrence Weiss
Energy Technology Associates
New York, New York 10168
ABSTRACT
TP-2147
In the acid hydrolysis of a cellulosic feedstock (wood, wood wastes, or crop
residues), up to 3.65 lb of furfural may be coproduced with each gallon of ethanol for
. only the cost of recovering and purifying it. Each plant producing 50 x 1 o6 galfYr ·of
ethanol would produce an amount of by-product furfural equal to the total current
domestic production. Thus, the need arises for investigation into potentially suitable
processes for deriving profitable end products from furfural and thus expanding the
market.
At its current price, furfural has been confined to a few specialty solvent, resin,
and chemical intermediate markets, most of which are expected to grow very slowly, if
at all. At lower prices, however, furfural offers significant promise as a chemical inter
mediate. The objectives of this study �vere to determine the economic potential of five
selected� large volume derivatives of furfural that could displace hydrocarbon-based
chemicals, and the consequent value of furfural as a by-product to the cellulose hydro
lysis process of ethanol production. The results of the analyses of furfural potential
indicate that the furfural-based processes for producing n-butanol, adipic acid! and
1

TP-2147
maleic anhydride could be economically competitive with hydrocarbon-based processes
and could reduce the cost of approximately 960 x 106 gal of ethanol to a selling price as
low as $0.91/gal.
INTRODUCTION
Ethanol can potentially replace gasoline, as a neat fuel, or traditional fuel
extenders and octane boosters such as methyl tertiary butyl ether (lVIBTE), tertiary butyl
alcohol (TBA), and n-butane. However, the cost of producing ethanol by acid hydrolysis
of cellulose using current technology is too high to allow competitive ethanol prices.
Research and developmental work on this technology are focusing on process improve
ments that will reduce the price of ethanol. One line of investigation concerns the
development of process schemes for the production and sale of ethanol and process
by-products, such as furfural and lignin. If such multiproduct process schemes are
successfully developed, the raw material value of the lignocellulosic feedstock will be
higher, thereby significantly reducing ethanol production costs. The study reported in
this paper focuses on determining the value of by-product furfural to the cellulose hydro
lysis process for ethanol production.
Study Approach
Furfural derived from acid hydrolysis might penetrate chemicals markets by two
major routes. The first route involves displacing current production of furfural. If
furfural coproduced with ethanol by the acid hydrolysis of cellulose can be produced at a
lower unit cost and .in sufficient quantity to meet demand, it will likely displace current
production. However, the existing furfural market is relatively small and growing slowly,
limiting the subsidy potential of a furfural by-product credit for ethanol production.
2
. .
TP-2 1 47
The second route to furfural market penetration, and the one on which we focus in
this study, involves upgrading furfural to derivatives that can substitute for current
petrochemical feedstocks or intermediates in the production of existing commodity
chemicals. The assessment of furfural market penetration potential by this route is more
difficult than assessment of the existing furfural market. One reason is that the tech
nical and economic feasibility of the production of furfural derivatives has not been
established. The other, more significant reason is that the complex, product-interrelated'
struc ture of the petrochemical industry can impose constraints on the introduction of
new feedstocks or modes of production. To assess market potential we have selected,
therefore, distinct yet complementary analytical methods that take into account engi
neering, economic, and market factors.
This study is based on the process engineering analyses of the hydrocarbon- and
furfural-based routes to the production of five large-volume (minimum annual production
of 1 00 x 1 06 lb/yr) co m modity chemicals: butanol, butadiene, styrene, adipic acid, and
maleic anhydride. Criteria used to select these five chemicals include ( 1 ) availability of
well-defined process technology and capital and operating cost data for large-scale
hydrocarbon-route plants, (2) availability of patent and laboratory experimental data on
furfural-route processes, and (3 ) high probability of ultimate successful com mercial-scale
development of furfural-based processes. Each furfural process has a history of at least
ground-breaking research work in Germany and England in the 1930s. Comparisons of the
capital and operating costs for competing process options provide a preliminary indica
tion of the potential for furfural to displace petroleu m feedstocks in these markets and
to subsidize the price of ethanol for fuel markets.
The cost comparisons were derived by first calculating the sales price for 15%
discounted cash flow (DCF) return for the hydrocarbon-based routes. Then, for the
furfural routes the raw materials costs were calculated to yield the same DCF returns as
the hydrocarbon routes. Finally, the equivalent furan/tetrahydrofuran and furfural costs
3
TP-2147
were calculated. These furfural costs, less estimated recovery costs of about $0.03/lb,*
are approximate measures of the by-product values that could be credited to the cellu-
lose hydrolysis process for ethanol production. The results constitute a conservative base
case and may be modified, if desired, for various inflation rates and future crude oil
market values.
The results of this first level of evaluation, which analyzes the cost differential
between the established production processes and the proposed furfural-based processes,
provides an initial characterization of the competitive economics and technical feasi-
bility. However, a competitive cost advantage for a furfural-based process will not
ensure that it displaces the existing process. Complex factors inherent in the petro-
chemicals industry can restrict the market penetration by a new chemical feedstock. We
include discussion in this paper of how the integrated structure of the petrochemical
industry can be expected to affect the cost required to trigger penetration of new tech-
nologies. Then, using a model of the U.S. fuels and petrochemical industry, we examine
the potential for subsidizing ethanol production with furfural by-_produc� credits.
PROCESS TECHNOLOGY
Background
The use of furfural to produce commodity chemicals is not a subject of exclusively
recent interest. Furfural was investigated in the laboratory many years ago, especially
in wartime Germany in the 1930s, as an alternative feedstock for hydrocarbon-based
*Furfural recovery costs are site-sensitive because the dominant cost factor, both capital and operating, is low-pressure steam. A plant steam balance with a significant surplus of low-pressure steam is a common condition and could lead to recovery costs less than $0.03/lb.
4

TP-2147
commodity chemicals such as butadiene, styrene, maleic anhydride, adipic acid, adiponi-
trile, hexamethylenediamine, butanol, synthetic lubricant polymers, and many others.
Walter Reppe and coworkers appear to have been leaders in this work, and descriptions of
most of their experimental work can be found in German literature and British and
American technical intelligence reports. Wartime urgency and the attendant disregard
for cost kept alive interest in furfural as a versatile chemical building block. Today we
have reason to revive this work because of the potential for furfural to be a large-
volume, low-cost coproduct in the production of fuel-grade ethanol from the acid hydro-
lysis of cellulose.
In the acid hydrolysis of a cellulosic feedstock for production of ethanol, furfural
can be coproduced in yields up to 60% of the hemicellulose, or about 3.65 lb for each
gallon of ethanol. A yield of 60% was used as the basis of this study. (Hydroxy methyl
furfural [HMFI, another by-product of less importance, is not considered in this study.)
The hydrolysis reaction conditions for producing ethanol are similar to those under which
furfural is commerci�lly prepared: temperatures are 250°-350° C, pressures are above
l 00 lb/in2, and dilute mineral acid (usually sulfuric but sometimes hydrochloric) is
present (3). This means that furfural is produced for only the cost of recovering and
purifying it. Each plant producing 50 x l o6 gal/yr of ethanol would also produce an
amount of by-product furfural equal to the total current domestic production. Thus, the
need arises for investigation into potentially suitable processes for deriving profitable
end products from furfural.
Furfural: Current Status
Furfural is the common name for 2-furaldehyde, a derivative of furan. Furfural is
a widely used chemical intermediate, but unlike many chemical intermediates, a compet-
itive hydrocarbon-based process for its production has never been found (18). Instead, it
is produced from the five-carbon sugars, especially xylose, which make up 25% or more
5

TP-2147
of the composition of various woods and crop residues. The Quaker Oats Company
produces essentially the entire U. S. output, using oat hulls as the primary raw mate
rial (3). Estimates of 1980 furfural production range from 125 x 106 lb (15). Furfural
production in recent years has been only marginally profitable for Quaker Oats, and the
company has publicly expressed doubts about whether it will continue to produce
furfural (7). The current list price of furfural is $0.66/lb (8).
At its current price, furfural has been confined to a few specialty solvent, resin,
and chemical intermediate markets, most of which are expected to grow very slowly, if
at all (e.g., steel) (15). Slight decreases in the price of furfural would directly affect its
two most common derivatives, tetrahydrofuran and furfuryl alcohol. The former is an
important solvent for which there is a competitive petroleum-based synthesis; the other,
furfuryl alcohol is used in the manufacture of resins and binders.
Cheap furfural offers the most promise as a chemical intermediate. It can be and
has been converted to a great variety of chemicals, some commercially and others in the
laboratory only. Some of these derivatives have current markets many times that of fur
fural, and these markets will at least grow at the same rate as the economy. The five
commodity chemicals selected for this study represent a good cross section of the petro
chemical industry. Each is a moderately to extremely large volume commodity chemical
that is currently produced from petroleum-based feedstocks but can also be made from
furfural. Each of the furfural conversion processes has been demonstrated in the
lab ora tory.
Process Studies
A required first step in determining the market feasibility of furfural derivatives is
establishing a standardized means of comparing the furfural-based routes with the hydro
carbon-based routes producing the five chemicals selected for study. Process and
economic studies performed by Energy Technology Associates (ETA) compare capital and
6

TP-2 1 47
operating costs of the alternative processes for large-scale manufacture of the five
chemicals. These studies allow appraisal o f the economics with the best process infor
mation available. In this section we present the basis and the results o f the ETA process
engineering studies and analyze their relevance.
The plant capacities selected are so-called "world-class" size, equal to the most
recently operational plant, which is generally the largest built. Process information was
obtained from published sources. Because much work is required to commercialize the
furfural-based processes, the economic analyses were adjusted to the year 1995 . Moder
ate rates of inflation were assumed for construction costs as well as for the cost of crude
oil, but the real price of crude oil was assumed to remain constant.
The process studies by ETA yielded for each of the five pairs of alternatives (i.e.,
chemical production from hydrocarbons versus furfural) a discussion of the process
chemistry, a process description, a process flow diagram, and an economic summary
consisting of the following elements:
• · Plant capacity and locat�on
• Year o f costs used and stream factor
• Production costs, including use factors and unit costs:
Raw rna terials
Utilities
Operating costs
Overhead expenses
• Depreciation
• Sales price for 15% DCF return.
The results are sufficiently good to establish a value for furfural as a raw material that
yields a profitability for the furfural process routes to each product that is approxi
mately equal to the profitability of the hydrocarbon routes. This value represents the
maximum cost that producers of the furfural derivative can afford to pay in order to
7
TP-2 1 47
recover their capital, as well as the credit the ethanol and furfural producer can expect
to receive. These economic results are adequate for broad comparisons. Establishment
of more definitive data for the individual furfural processes was beyond the scope of the
work and can be done only after considerably more research, develop ment, and
engineering.
In tables for each of the five chemicals examined, we present the capital and oper
ating costs for both the hydrocarbon and furfural-based processes to permit direct
comparisons of all cost components. The sales prices (15% DCF return) calculated for
the hydrocarbon-route products were assumed to be the same for the furfural-route
products. A net raw materials cost for the furfural route was calculated using this value
and the capital investment estimates, which are extensions of the known hydrocarbon
route investments. This cost was then further broken down to the furan/tetrahydrofuran
costs required for equal profitability of the hydrocarbon and furfural process routes; the
results are shown as footnotes to the tables. We include, in 1;1ddition, process now
diagrams for prom ising furfural-based processes.
n-Butanol. Table 1 co mpares the economics of n-butanol production via the conventional
carbonylation of propylene (the oxo process) and via the proposed furan hydrogenation
process. The investment costs and working capital requirements for both processes are
within the sa me ranges. With a furan value of $ 0 .25/lb (a 198 2 furfural value of
$0.08/lb), the production cost and selling price of butanol are identical for both
processes. Even with a 3 10 x 10 6 lb annual feedstock requirement, the net raw materials
cost is actually lower for the furan route. The conversion of furan into butanol appears
pro mising.
8
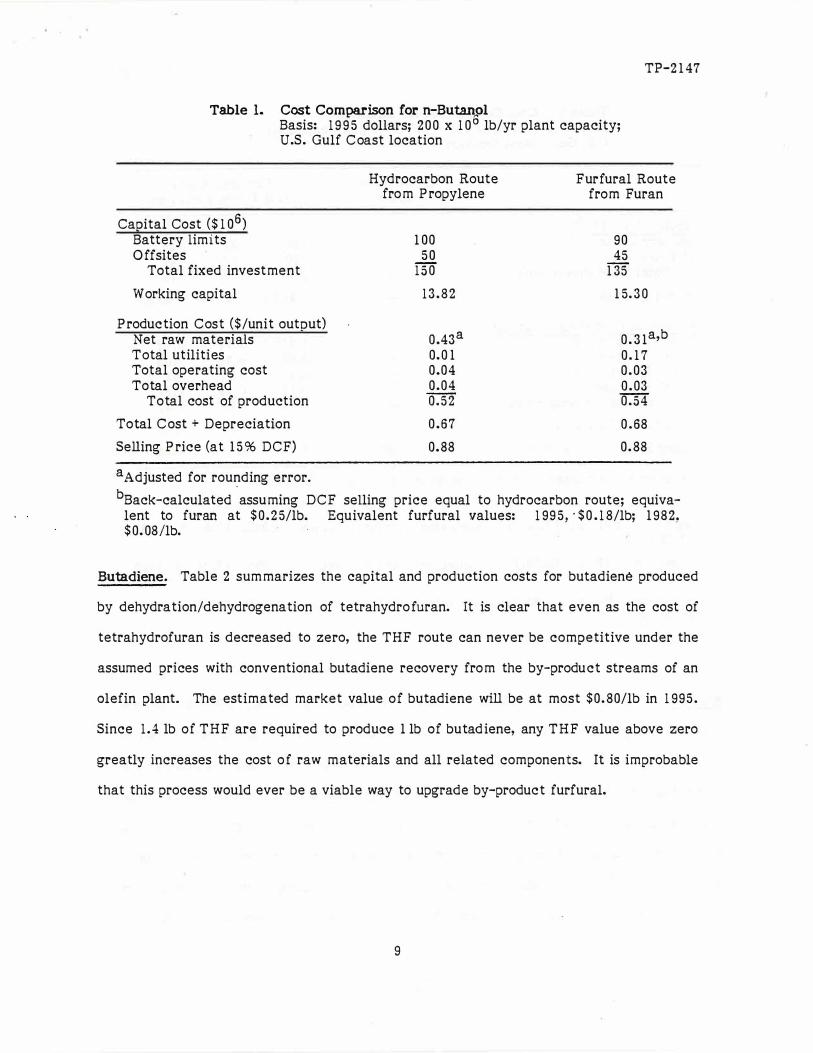
Table 1. Cost Comparison for n-Buta.n_pl
TP-2 1 47
Basis: 1 9 9 5 dollars; 2 0 0 x 1 0° lb/yr plant capacity; U.S. Gulf C oast location
Capital Cost ($ 1 06) Battery limits O ff sites
Total fixed investment
Working capital
Production Cost ($/unit output) Net raw materials Total utilities Total operating cost Total overhead
Total cost of production
Total C ost + Depreciation
Selling Price (at 1 5 % DCF)
aAdjusted for rounding error.
Hydrocarbon Route fro m Propylene
1 00 5 0
150
13.82
0.43a
0. 0 1 0.04 0 .04 0 .52
0 .67
0.88
Furfural Route from Furan
90 45
1 35
1 5.30
0 .31 a,b
0 . 1 7 0 .03 0 .03 0 .54
0 . 68
0 .88
bBack-calculated assuming DCF selling price equal to hydrocarbon route; equivalent to furan at $ 0 .2 5/lb. Equivalent furfural values: 1 99 5, · $ 0 . 1 8/lb; 1 982, $ 0. 08/lb.
Butadiene. Table 2 sum marizes the capital and production costs for butadiene produced
by dehydration/dehydrogenation of tetrahydro furan. It is clear that even as the cost of
tetrahydrofuran is decreased to zero, the THF route can never be competitive under the
assumed prices with conventional butadiene recovery fro m the by-product streams of an
olefin plant. The estimated market value of butadiene will be at most $0.80/lb in 1 995 .
Since 1 .4 lb of THF are required to produce l lb of butadiene, any THF value above zero
greatly increases the cost o f raw materials and all related components. It is improbable
that this process would ever be a viable way to upgrade by-product furfural.
9

Table 2. Cost Comparison f�r Butadiene Basis: 1 99 5 dollars; 5 0 0 x 1 0 lb/yr plant capacity; U.s. Gulf Coast location
TP-2 1 47
Hydrocarbon Furfural Route Route a from Tetrahydrofuran
Capital Cost ($ 1 06) Battery limits 180 180 180 O ff sites 9 0 9 0 9 0
Total fixed investment 270 270 270
W orking capital 94.06 57.04 36.85
P roduction Cost ($ /unit outEu t) 1 . 2 l b,c 0.44b,d o .ozb,e Net raw materials
T otal utilitiesf 0 . 08 0 . 08 0 .08
Total operating cost 0 . 1 7 0 . 1 7 0 . 1 7 Total overhead 0 . 1 8 0 . 1 8 0 . 1 8
Total cost of production 1 . 64 0.87 0.45
T otal C ost + Depreciation 1 . 7 5 0.98 0 . 5 6
Selling Price (at 1 5 % DCF) 0.80 2 . 1 2 1 . 24 0 .76
aButadiene coproduced from cracking of hydrocarbon feedstocks. bB ack-calculated assu ming DCF selling price equal to hydrocarbon route .
. cBased on THF at $ 0.85/lb. Equivalent furfural values: 1 99 5 , $0 . 64/lb; 1 982, $ 0 . 29/lb.
dBased on THF at $0.30/lb. Equivalent furfural values: 1 9 9 5 , $0 . 23/lb; 1 982, $0 . 1 0/lb.
eBased on THF at $0.00/lb. Equivalent furfural values: 1 995, $0.00/lb; 1 982, $ 0 . 00/lb.
f Adjusted for rounding error.
Styrene. The capital and operating costs for production of styrene via benzene
alkylation/ethylbenzene dehydrogenation and via butadiene dimerization are shown in
Table 3. The furfural route is based on butadiene produced from $0 . 00/lb furfuraL The
estimated total fixed investments in 1 99 5 for both processes are over $300 million. The
working capital required for the furfural route is almost twice as high as that for the
hydrocarbon route. Primarily because the feed requirement for the fur fural route is
almost 1 .3 x 1 0 9 lb of butadiene, the production cost and selling price of styrene fro m
the dimerization process are significantly higher than those for the benzene process.
1 0
TP-2147
Table 3. Cost Comparison for Styre�e Basis: 1995 dollars; 1 x 10 lb/yr plant capacity; U.S. Gulf Coast location
Hydrocarbon Route Furfural Route from Benzene from Butadiene
Caeital Cost ($ 106) Battery limits 215 240 Offsites 90 75 Total fixed investment 305 31 5
Working capital 62.25 123.37
Production Cost ($/unit outeut) 0.96a ,b Net raw materials 0.53
Total utilities 0.03 0.10 Total operating cost 0.01 0.02 Total overhead 0.01 0.02
Total cost of production 0.58 1.10
Total Cost + Depreciation 0.65 1 .16
Selling Price (at 15 % DCF) 0.78 1 . 37
aAdjusted for rounding error. bBack-calculated assuming DCF selling price equal to hydrocarbon route; based on
bu�adiene at $0. 76/lb. Equivalent furfural value: 1995, $0.00/lb.
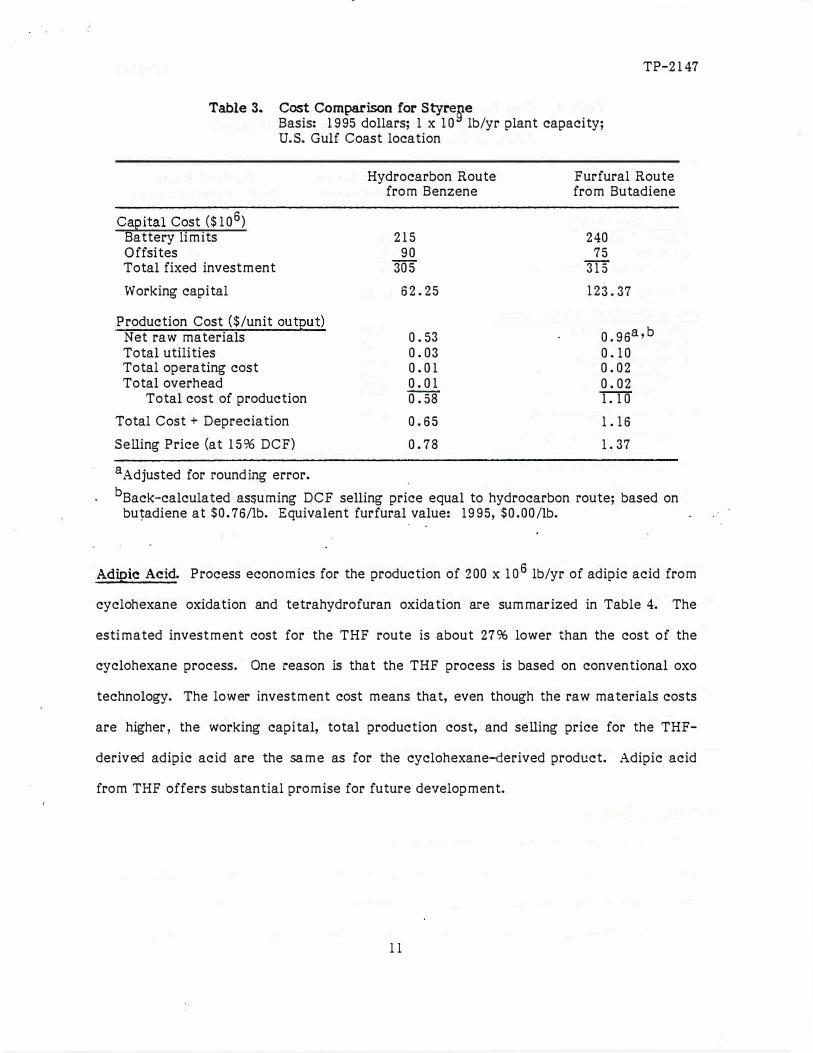
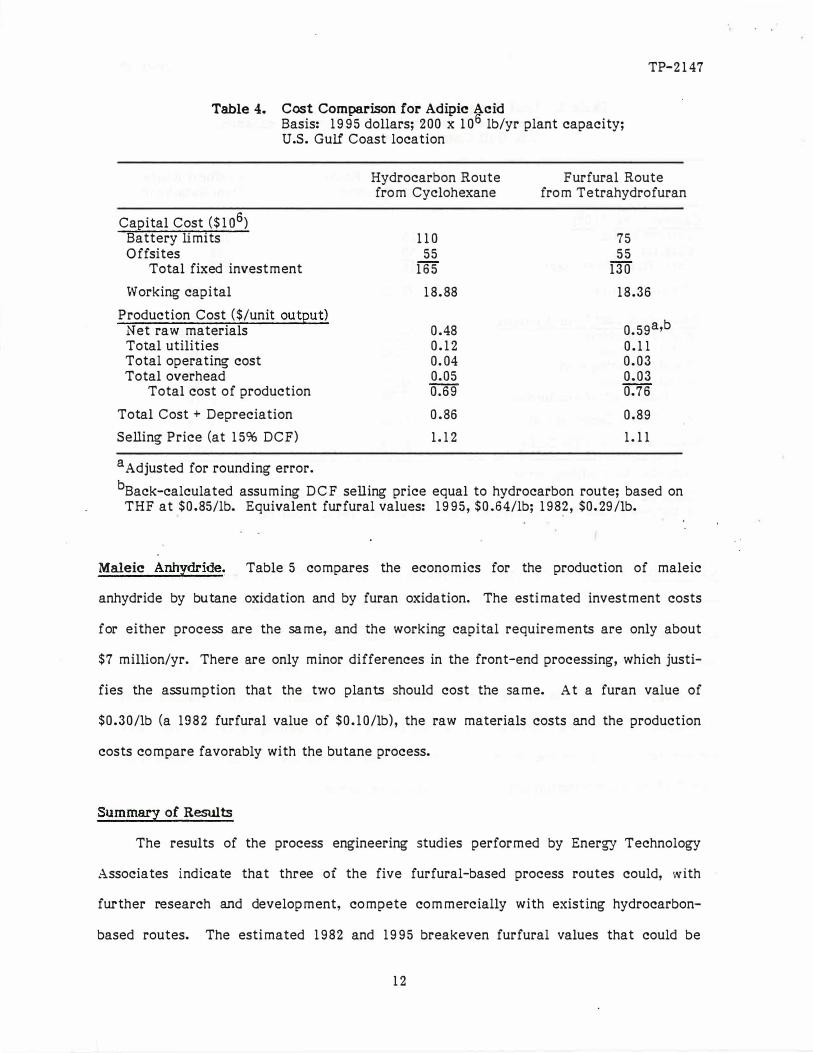
Adipic Aeid. Process economics for the production of 200 x 1 o6 lb/yr of adipic acid from
cyclohexane oxidation and tetrahydrofuran oxidation are summarized in Table 4. The
estimated investment cost for the THF route is about 27% lower than the cost of the
cyclohexane process. One reason is that the THF process is based on conventional oxo
technology. The lower investment cost means that, even though the raw materials costs
are higher, the working capital, total production cost, and selling price for the THF-
derived adipic acid are the same as for the cyclohexane-derived product. Adipic acid
from THF offers substantial promise for future development.
l l
TP-2147
Table 4. Cost Comparison for Adipic Acid Basis: 1995 dollars; 200 x 106 lb/yr plant capacity; U.S. Gulf Coast location
Capital Cost ($1 o6) Battery limits Off sites
Total fixed investment
Working capital
Production Cost ($/unit output) Net raw materials Total utilities Total operating cost Total overhead
Total cost of production
Total Cost + Depreciation
Selling Price (at 15% DCF)
aAdjusted for rounding error.
Hydrocarbon Route from Cyclohexane
110 55
165
18.88
0.48 0.12 0.04 0.05 0.69
0.86
1.12
Furfural Route from Tetrahydrofuran
75 55
130
18.36
0.59a,b
0.11 0.03 0.03 0. 76
0.89
1.11
bBack-calculated assuming DCF selling price equal to hydrocarbon route; based on THF at $0.85/lb. Equivalent furfural values: 1995, $0.64/lb; 198�, $0.29/lb.
Maleic Anhydride. Table 5 compares the economics for the production of maleic
anhydride by butane oxidation and by furan oxidation. The estimated investment costs
for either process are the same, and the working capital requirements are only about
$7 million/yr. There are only minor differences in the front-end processing, which justi-
fies the assumption that the two plants should cost the same. At a furan value of
$0.30/lb (a 1982 furfural value of $0.10/lb), the raw materials costs and the production
costs compare favorably with the butane process.
Summary of Results
The results of the process engineering studies performed by Energy Technology
Associates indicate that three of the five furfural-based process routes could, with
further research and development, compete commercially with existing hydrocarbon-
based routes. The estimated 1982 and 1995 breakeven furfural values that could be
12

TP-2147
credited to production of ethanol by cellulose hydrolysis are shown below for each
promising process:
• Furan hydrogenation to n-butanol (furfural value: 1982, $0.08/lb; 1995, $0.18/lb)
• Tetrahydrofuran carbonation to adipic acid (furfural value: 1982, $0.10/lb; 1995,
$0.21/lb)
• Furan oxidation to maleic anhydride (furfural value: 1982, $0.29/lb; 1995,
$0.64/lb).
Table 5. ,Cost Comparison for Maleic Anhydride Basis: 1995 dollars; 60 x 106 lb/yr plant capacity; U.S. Gulf Coast location
Hydrocarbon Route Furfural Route from n-Butane from Furan
Ca!2ital Cost ($ 106) Battery limits 105 105 105 Off sites 50 50 50
Total fixed .investment 155 155 155
Working capital -7.62 7.12 7.44
Production Cost ($/unit output) 0.33a,b Net raw materials 0.42 0.39a,c
Total utilities 0.00 0.01 0.0 I Total operating cost 0.12 0.12 0.12 Total overhead 0.12 0.12 0.11 d
Total cost of production 0.66 0.58 0.63
Total Cost + Depreciation 1.18 1.09 1.15
Selling Price (at 15% DCF) I. 74 1.64 1. 71
aBack-calculated assuming DCF selling price equal to hydrocarbon route. bBased on furan at $0.25/1b. Equivalent furfural values: 1995, $0.19/lb; 1982,
$0.08/1b. cEased on furan at $0.30/1b. Equivalent furfural values: 1995, $0.21/1b; 1982,
$0.10/1b. dAdjusted for rounding error.
If a marginal 1982 furfural value of $0.08/1b is assumed, the adipic acid process shows
the greatest promise. However, considering the accuracy of the estimates and calcula-
tions, all three processes are viable candidates for additional study. The other two
1 3
:

TP-2147
routes-tetrahydrofuran to butadiene and butadiene to styrene-do not have promising
commercial potential, chiefly because the raw material costs for these processes are too
high.
The combined production of n-butanol, adipic acid, and maleic anhydride in 1982
was approximately 2.3 x 1 o9 lb, indicating vast markets are potentially available to acid
hydrolysis-derived furfural. However, as is examined in the following section, factors
within the complex structure of the petrochemical industry can restrict or augment the
extent to which the conversion from hydrocarbon-based routes to furfural-based routes
would probably occur.
Other opportunities for upgrading furfural have been recognized for many years and
have been studied by the paper industry, the German chemical industry, and the petro
chemical industry. Some examples include:
• 1,4-butanediol via THF-a plasticizer and resin intermediate.
• Y -bu tyro lactone via THF. Typical applications are, among others, as a precursor
of synthetic blood plasma and of ny1on.,;.4.
• Polymers of furfural and furan-synthetic lubricants. Materials for specific mili
tary applications were developed in Germany in the 1930s.
• Levulinic acid from furfural alcohol or HMF-a polymer and pharmaceuticals
intermediate. A large family of derivatives was developed in extensive work 30
years ago.
• Alcohol and acid analogs of furfural made by hydrogenation/oxidation-polyester
intermediates.
• Thermal decomposition of HMF to furfural and formaldehyde.
None of this work is new, but all of it could l_)rovide starting points for continuing inves
tigation of the furfural market potential.
14

TP-2147
IMPLICATIONS OF AN EXPANDED FURFURAL MARKET
The process studies described in the previous section establish an initial estimate of
the potential demand for furfural as a chemical precursor. The prices listed in Table 6
are the prices that allow the furfural process design to be competitive with the conven-
tional process. The quantities of furfural are those necessary to fill the 1982 demands
for the given chemicals.
Table 6. Potential Furfural Demand
Market Price ($/lb) Quantity ( 1 o6 lb)
Furfural Adipic acid Maleic anhydride Butanol
$0.50a $0.29 $0.10 $0.08
140 1002
454 1758
aThis is a very conservative assumption since, at the current price of $0.66/lb, profit margins are extremely low.
·
Although this information is important, breakeven process designs do not ensure
that firms will adopt the furfural-based processes. This section discusses the additional
factors affecting a firm's decision to switch to a new process. In this section we also
examine the effects of the potential supply of ethanol from lignocellulosic feedstocks at
the level of the petrochemical industry, and we determine the impact of credits earned
from the sale of furfural.
The Structure and Behavior of Petrochemical Markets
Because chemical plants and oil refineries produce a fixed slate of products from
various feedstocks, the price of any one product is not determined in isolation. The
selling prices of the slate of products are jointly determined to best meet management
15

TP-2147
objectives for the plant as a whole. Any one price must be considered in a larger inte
grated-market context: changes in the market may imply changes in the price of one
product, which in turn may cause changes in related product prices.
A firm's reaction to increased competition for one of its products will be governed
by the technology flexibility, the marginal cost of production, and the overhead costs to
be shared by all the products sold by the firm. If other coproduct prices can be increased
to cover overhead and a targeted rate of return, the firm can react to increased compe
tition in one market by lowering its price to a point where marginal cost is just covered.
In cases of coproduction, the secondary products are effectively (in an accounting sense)
produced at no cost to the firm, and severe price competition could drive the price below
the marginal production cost or so low that total revenues (from all products) decline.
Such price adjustments of products can be expected to persist until competition in one
market or in several markets increases sufficiently to require an adjustment of the
amount or type of feedstock or the conversion process used by the plant. For a more
accurate· picture of the potential .of new processes and products, these price,. quantity,
and process adjustments must be taken into consideration.
Oil Reimery Structure and Behavior
Oil refineries supply most of the feedstocks for the conventional processes of
production of the chemicals considered in this study. This section discusses the effects
of the competition between conventional and furfural-based processes on these
refineries.
Refineries maximize their revenue by attempting to derive the optimal mix of
products from the crude oil processed. The refinery can vary the type of crude oil
processed or the secondary processing steps as the demands for fuels and chemicals
vary. From any given configuration of type of crude oil and processing steps, the
refinery produces a fixed slate of several products. The best-known example of refinery
16

TP-2147
adjustment in response to changing demand is the seasonal swing between cracking heavy
residual oil for enhanced gas production in summer and using the residual for heating oil
in the winter.
The degree to which a chemical plant is capable of meeting its demands with a new
technology or mix of technologies will determine whether the firm will reduce its general
level of demand for petroleum feedstocks or simply demand less of one specific feed
stock and possibly more of another. Neither of these situations have much impact on the
refinery, since petrochemical demands account for only about 4.5% of total refinery out
put (12). If furfural displaces only small amounts of refinery feedstocks, refinery product
prices or processing steps will change only marginally.
In the wider context of ethanol/furfural coproduction by cellulose hydrolysis,
however, potential impacts on the refinery become more apparent. Ethanol is used both
as a blender, reducing gasoline demand, and as a precursor for chemicals, thereby reduc
ing the demand for petrochemical feedstocks. Methanol is also a source of blending
components and ch�mical· products and may further reduce the demand for petroleum
products. Thus it may be possible to replace almost all the primary products of the
refinery. Refineries may respond to these changing demands by reducing the number of
barrels of oil refined. From an energy conservation perspective, the new technology has
greater value if products such as furfural and ethanol reduce the number of barrels
refined than if a readjustment in utilization of refinery products results.
The Structure and Base-Case Values of the PETNET Model
The PETNET model (11) was designed to represent the existing structure of the
U.S. petrochemical markets. PETNET, in conjunction with an optimization computer
code, can describe th� optimal allocation of resources in the petrochemical industry and
predict the response of plants and refineries to the new technologies considered in this
paper. This section describes the operation and structure of PET NET.
17

TP-2147
The PETNET model has three major components: final demands, supplies, and arcs
or structural relationships that represent conversion processes. An optimal solution of
the model is defined as the least-cost method of filling final demands, given the avail
ability of resources and the structural ties linldng supplies to demandso The magnitudes
of the supplies and demands are fixed for any one simulation but may be varied for
different scenarios. The arcs or structural relationships specify alternative routes for
conversion of supplies to fill demands.
The U.S. petrochemical and fuel industry is represented in the model by the
demands for 29 chemical and fuel products, which are listed in Table 7. Chemical
demands represent major products that are inputs to final demand production processes
with base-case values representative of 1982 levels of consumption. The fuel demands
are also representative of the 1982 market; they include gasoline and the major fuel
extenders and octane enhancers. The fuel demands also include ethanol, which is cur
rently derived from starch fermentation processes, .and methanol, which is produced from
natural gas.
In the model, feedstocks may be derived from renewable or nonrenewable sources.
Base-case supplies and prices of the nonrenewable feedstocks are i?resented in Table 8
along with approximate 1982 consumption. To determine the availability of oil-derived
fuel and petrochemical supplies, we applied data on the average product yields per barrel
of oil (1) to estimate the amount of oil refined. The model includes natural gas and
natural gas product supplies to represent the feedstocks available for production of final
demand products. The supplies include the "heavy" portions such as distillates and resid
uals, although in its current configuration the model does not include final demands for
products that utilize these feedstocks.
18

TP-2147
Table 7. Base-Case Fuels and Chemicals Final Demands
Fuel or Chemical
Ethylene oxide Ethyl acetate Chemical-grade ethanol Fuel ethanol Gasoline Tertiary butyl alcohol Ethyl benzene Ethylene dibromide Miscellaneous ethylene Vinyl chloride Low density polyethy lene High density polyethylene Methyl tertiary butyl ether Formaldehyde Methylamines Celanese fuel methanol Chemical-grade methanol Oxinol Fuel methanol (neat) Methyl methacrylate Acetic acid Acetaldehyde Ethylene dichloride Butanol Adipic acid Butadiene Styrene Maleic anhydride Furfural
Units
pounds pounds gallons gallons gallons gallons pounds pounds pounds pounds pounds pounds gallons pounds pounds gallons gallons gallons gallons pounds pounds pounds pounds pounds pounds pounds pounds pounds pounds
D�mand (10 units)
5,512.5 250.0 200.0 400.0
74,800.0 100.0
7,899.4 1,000.0
10.0 6,819.9 4,860.0 4,860.0
90.0 2,454.0
247.9 905.4 256.0
10.0 50.0
1,120.0 1,479.6
562.0 1,840.0
823.0 1,200.0 1,830.0 5,870.0
304.0 140.0
The base-case supplies and prices of renewable resources are presented in Tables 9
and 10, respectively. The supplies and prices of the two major categories-corn grain and
lignocellulose-are broken down into the amounts for the 10 federal census regions so
that it is possible to derive information from the model about the optimal feedstock
combinations. Moreover, the regional structure makes possible analyses of where a
renewable industry might emerge, given the specific feedstocks available and the product
demands.
19

TP-2147
Table 8. Base-Case Nonrenewable Feedstock Supplies and Prices
Feedstock Units S�pply Price
(10 units) (1982 $/unit)
Gasoline Refinery gallons 79,615 1.00 Imports gallons 2, 792 1.01
Jet fuel Refinery barrels 284 45.15 Imports barrels 4 45.57
Ethane Refinery pounds 7,825 0.11 Imports pounds 0
Kerosene Refinery barrels 52 45.15 Imports barrels 5 45.57
Distillate Refinery barrels 963 41.87 Imports barrels 34 42.29
Residual Refinery barrels 516 34.27 Imports barrels 272 34.69
Naphtha. barrels 346 46.45 Gas oil barrels 31 42.00 Propane pounds 4,100 0. 1'15 Butane pounds 812 0.26 LPG (liquified petro-
leum gas} Refinery pounds 16,615 0.15 Imports pounds 13,828 0.16
Miscellaneous refinery barrels 447 20.00 products
Natural gas scf 18,000,000 0.003
Process routes link the available feedstocks to the exogenous demands. That is, the
model seeks to fill exactly the expressed final demands by utilizing the available produc-
tion processes and feedstocks. The optimizing criterion applied in choosing the structure
of the industry is cost minimization. All processes are represented by an input-output
coefficient or yield of product per unit of feedstock, the unit cost (operations, capital
changes, and profit margin), and capacity. To find the solution that will fill final
20
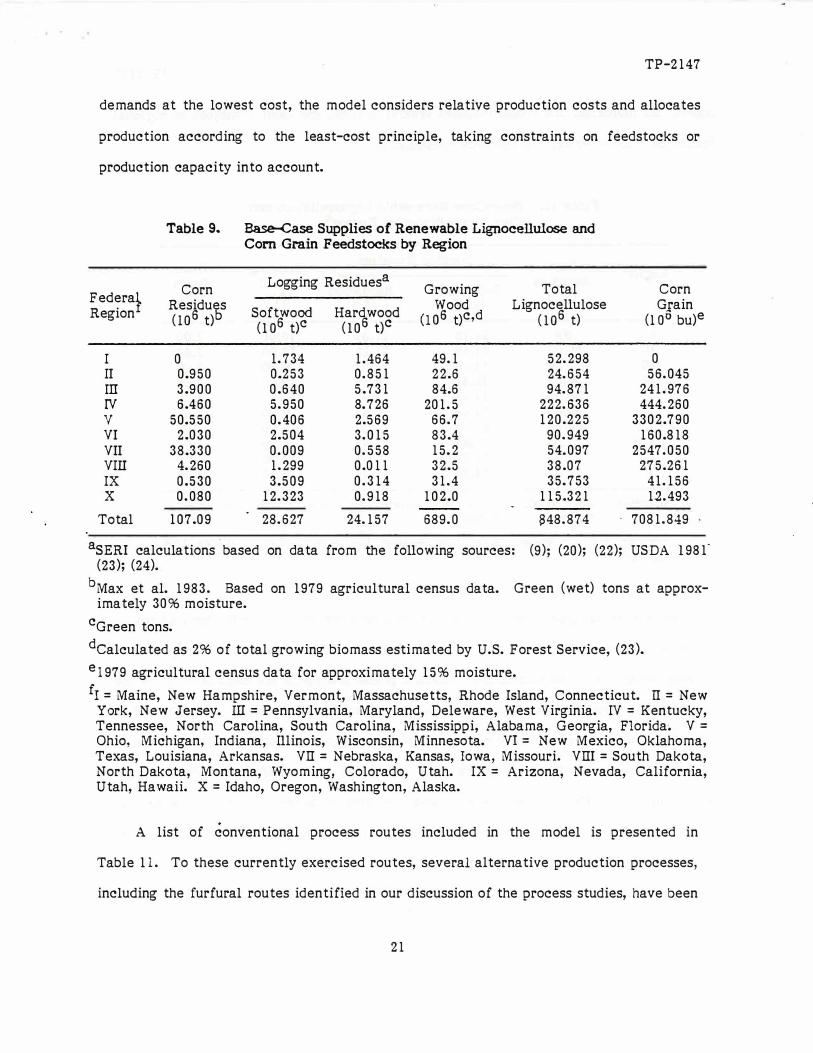
TP-2147
demands at the lowest cost, the model considers relative production costs and allocates
production according to the least-cost principle, taking constraints on feedstocks or
production capacity into account.
Table 9. Base-Case Supplies of Renewable Lignocellulose and Corn Grain Feedstocks by Region
Logging Residuesa Corn Growing Total Corn
Federat Residues Softwood Hardwood
Wood Lignocellulose Grain Region
(lo6 t)b 0 06 t)c,d (1 o6 t) (lo6 bu)e (lo6 t)c (106 t)C
I 0 1. 734 1.464 49.1 52.298 0 II 0.950 0.253 0.851 22.6 24.654 56.045 III 3.900 0.640 5. 731 84.6 94.871 241.976 rv 6.460 5.950 8. 726 201.5 222.636 444.260 v 50.550 0.406 2.569 66.7 120.225 3302.790 VI 2.030 2.504 3.015 83.4 90.949 160.818 VII 38.330 0.009 0.558 15.2 54.097 2547.050 VIII 4.260 1.299 0.011 32.5 38.07 275.261 IX 0.530 3.509 0.314 31.4 35.753 41.156 X 0.080 12.323 0.918 102.0 115.321 1.2.493
Total 107.09 28.627 24.157 689.0 S48.874 7081.849
asERI calculations based on data from the following sources: (9); (20); (22); USDA 1981 (23); (24).
b Max et al. 1983. Based on 1979 agricultural census data. Green (wet) tons at approx-ima tely 30% moisture.
cGreen tons. dcalculated as 2% of total growing biomass estimated by U.S. Forest Service, (23). el979 agricultural census data for approximately 15% moisture. fr = Maine, New Hampshire, Vermont, Massachusetts, Rhode Island, Connecticut. II = New
York, New Jersey. ill= Pennsylvania, Maryland, Deleware, West Virginia. IV= Kentucky, Tennessee, North Carolina, South Carolina, Mississippi, Alabama, Georgia, Florida. V = Ohio, Michigan, Indiana, Illinois, Wisconsin, Minnesota. VI= New Mexico, Oklahoma, Texas, Louisiana, Arkansas. VII= Nebraska, Kansas, Iowa, Missouri. VIII= South Dakota, North Dakota, Montana, Wyoming, Colorado, Utah. IX= Arizona, Nevada, California, Utah, Hawaii. X= Idaho, Oregon, Washington, Alaska.
A list of conventional process routes included in the model is presented in
Table 11. To these currently exercised routes, several alternative production processes,
including the furfural routes identified in our discussion of the process studies, have been
21

TP-2147
added. As indicated, the model includes several options, and each is subject to regional
feedstock price diversity and resource constraints.
Region
I II ill N v VI VII VIII IX X
Table 10.
Corn Residues
($/t)
NA 25.00 25.00 30.00 20.00 40.00 20.00 25.00 25.00
NA
Base-Case Renewable Lignocellulose and Com Grain Prices by Regiona
Logging Residues Growing Corn
Softwood Hardwood Wood Grain
($/t) ($/t) ($/t) ($/bu)
24.10 21.39 30.00 3.00 24.10 21.39 30.00 3.00 24.10 21.39 30.00 3.00 25.41 20.85 30.00 3.00 24.10 21.39 30.00 3.00 25.41 20.85 30.00 3.00 24.10 21.39 30.00 3.00 21.48 21.79 30.00 3.00 21.87 22.05 30.00 3.00 23.95 29.78 30.00 3.00
Sources: Max et al. (17) and SERI calculations based on sources listed in footnote a of Table 9. ·
·
aPrices are for green (wet) tons except for corn, which includes 15% moisture.
Before we analyze specific cases, we will consider the base-case implications of
the data. Because there is a lack of data on the supply functions for corn grain and
growing wood, these feedstocks, the feedstock prices and yields are considered to be the
same for all regions in this model. With the given feedstock cost and an assumed yield of
2.5 gal ethanol from each bushel of corn grain, the cost cf ethanol from fermentation of
grain in all regions is $1. 84/gal in the base case ( $1.20/gal feedstock cost and $0.64/gal
processing cost). The cost and yield of wood feedstocks, defined as 2% of growing tree
stock, are $30/t and 20 gal/t, respectively. Thus ethanol produced by acid hydrolysis of
wood costs $2.05/gal ($1.50/gal feedstock cost and $0.55/gal production cost).
22

Table 11.
Input
Oil
Natural gas
Ethane Propane Gas oil Butane LPG Ethylene
TP-2147
Conventional Petrochemical Process Routes Included in the PETNET Model
Product
Gasoline Jet fuel Ethane Kerosene Distillate Residual Naphtha Gas oil Furfural Ethene Methanol Propane Butane Ethylene Ethylene Ethylene Ethylene Ethylene Acetaldehyde Ethanol Ethylene oxide Ethyl benzene
· Ethylene dibrornide Vinyl chloride Ethylene dichloride Polyethylene Benzene Propylene Butadiene Butylene
Input
Benzene Butylene Propylene Benzene Butylene
Acetaldehyde Acetic acid Methanol
Furfural
Product
Styrene Butadiene Butanol Adipic acid Maleic anhydride
Acetic acid Ethyl acetate Methyl tertiary
butyl ether Formaldehyde Acetic acid Tetrahydro furan
The diversity of other lignocellulosic feedstock supplies and prices (Tables 9 and 1 0)
results in considerable diversity in the ethanol r;>roduction costs. Given the base-case
data, we can draw conclusions about the order in which the model will fill ethanol
demands.
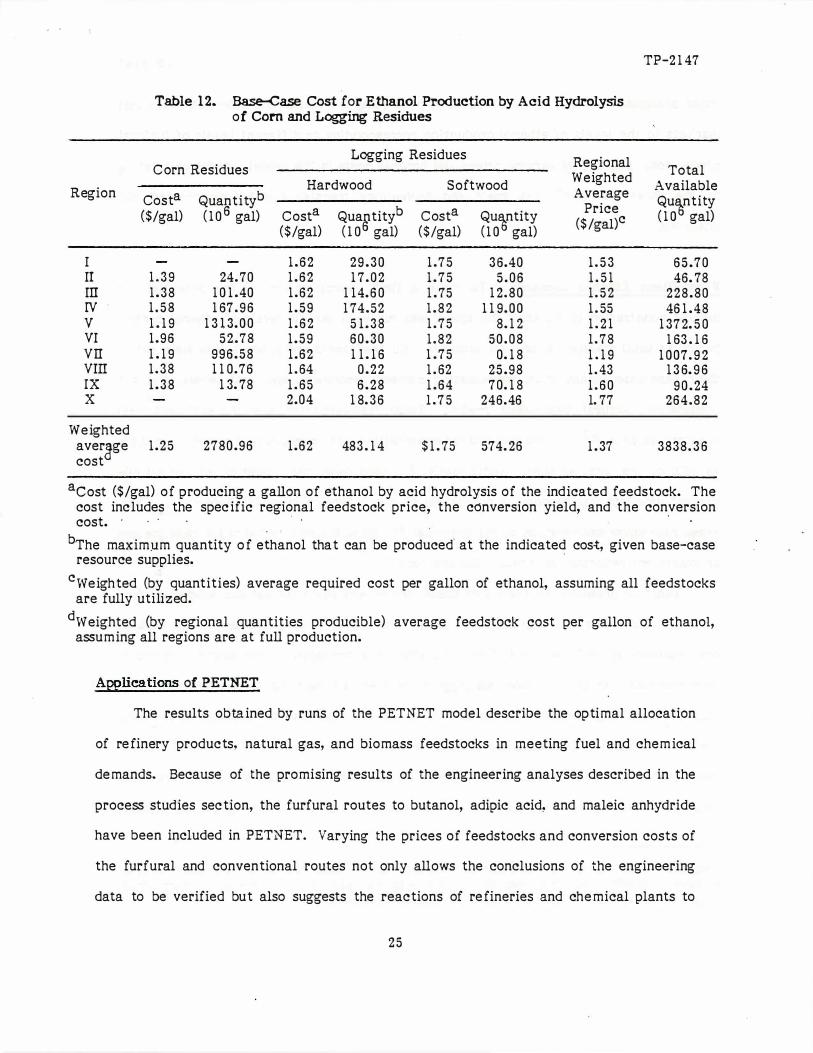
Regional ethanol production costs for acid hydrolysis processes using corn and
logging residues are listed in Table 12. A total of almost 4 x 10⁹ gallons of ethanol, at an
average [)rice of $1.36/gal, could potentially be r;>roduced using current acid hydrolysis
23

TP-2 1 47
technology. Although this price is higher than the price of gasoline ($ 1. 00 /gal), it is
below that of current ethanol production from fermentation of corn grain (about
$ 1 . 70/gal). Th is suggests that the first penetration of acid hydrolysis ethanol will be the
displacement of corn fermenta tion. That is, new acid hydrolysis ca!?acity will tend to
com!?ete with and displace existing alcohol production before augmenting current
supplies, resulting in no net reduction of oil use. We discuss the implications of this
displace ment in the m odel applications section of this paper.
Of the three feedstocks listed in Table 1 2, corn residues provide the largest contri
bution to ethanol .production (2 .8 x 1 0 9 gal, or 72% of the total) at the lowest average
ethanol price ($ 1 . 25 /gal). Most of the potential for ethanol production from corn resi
dues is in Regions V and VII-the Corn Belt states-which also have the lowest cost
sources ($ 20 /t). If extensive markets for ethanol could be found at about $ 1 . 2 0 /gal, the
corn-growing regions could benefit from acid hydrolysis technology. The use of corn
residues would increase agricultural revenues and provide locally produced fuels . to
d isplace gasoline. Acid hydrolysis industry m ost likely w�ll first develop and eventually
be concentrated in these regions. M ore in-depth analyses of the resources in these
regions are required to refine the values presented here and to predict the local impacts
and economic consequences.
Add itional sup!?lies of ethanol can be derived fro m logging residues but at higher
average prices (Table 1 2) that are not substantially lower than current corn grain-based
ethanol costs. The wide regional availability of these residues, however, suggests that
ethanol production by acid hydrolysis could become widely dispersed and provide locally
produced fuels in regions with low levels o f grain production.
24
Region
I II III IV v VI VII VIII IX X
Weighted avergge cost
Table 12. Base-Case Cost for Ethanol Production by Acid Hydrolysis of Com and Logging Residues
Logging Residues Regional C orn Residues
Hardwood Softwood Weighted
Costa Quantityb Average
($/gal) ( 1 o 6 gal) Costa Quantityb Costa Qu�ntity Price
($ /gal)c ($/gal) ( 1 0 6 gal) ($/gal) ( 1 0 gal)
1 . 6 2 2 9 . 3 0 1 . 7 5 3 6.40 1 . 5 3 1 . 3 9 24. 70 1 . 6 2 1 7. 0 2 1 . 7 5 5 . 0 6 1 . 5 1 1 . 38 1 0 1 .40 1 .62 1 1 4. 6 0 1 . 75 1 2. 8 0 1 . 5 2 1 . 5 8 1 67 . 9 6 1 . 59 1 74.52 1 . 8 2 1 1 9. 0 0 1 . 55 1 . 1 9 1 3 1 3. 0 0 1 . 6 2 5 1 . 3 8 1 . 75 8. 1 2 1 . 2 1 1 . 96 52 .78 1 .59 60 .30 1 .82 50 .08 l . 78 1 . 1 9 996 .58 1 .62 1 1 . 1 6 1 . 75 0. 1 8 1 . 1 9 1 . 3 8 1 1 0.76 1 . 64 0 .22 1 . 62 25 .98 1 .43 1 . 3 8 1 3. 78 1 . 65 6 .28 1 . 64 7 0. 1 8 1 . 6 0
2.04 1 8. 3 6 l . 7 5 246.46 l. 77
1 .25 2780 .96 1 .62 483 . 1 4 $ 1 . 75 574. 26 1 . 37
TP-2 1 47
Total Available Qu�ntity ( 1 0 gal)
6 5 . 7 0 46. 78
228 .80 46 1 .48
1 37 2. 5 0 1 63 . 1 6
1 0 07. 9 2 1 3 6. 9 6
9 0 . 24 264.82
3838. 3 6
acost ($/gal) o f producing a gallon of ethanol by acid hydrolysis of the indicated feedstock. The cos.t includes the spec ific regional feedstock price, the conversion yield, and the conversion cost. ·
· ·
bThe maxim.um quantity o f ethanol that can be produced at the indicated cost, given base-case resource supplies.
·
cweighted (by quantities) average required cost per gallon of ethanol, assuming all feedstocks are fully utilized.
dweighted (by regional quantities producible) average feedstock cost per gallon of ethanol, assuming all regions are at full production.
ApPlications of PETNET
The results obta ined by runs of the PETNET model describe the optimal allocation
of re finery products, natural gas, and biomass feedstocks in meeting fuel and chem ical
de mands. Because of the promising results of the engineering analyses described in the
process studies sec tion, the furfural routes to butanol, adipic acid, and maleic anhydride
have been included in PETNET. Varying the prices of feedstocks and conversion costs of
the furfural and conventional routes not only allows the conclusions of the engineering
data to be verified but also suggests the reactions of re fineries and che mical plants to
25

TP-2 1 47
these changes. PETNET is also capable of predicting the response of the petroche m ical
markets to the levels of ethanol production corresponding to different levels of furfural
produc tion. F inally, by varying prices and process costs in the m odel, scenarios relating
to the three levels of cost goals and technology transfer can be constructed and
analyzed.
Fixed-Blend Ethanol Demands. To make a first approximation of the potential for
market penetration by ethanol, the model was run with various levels of ethanol contri-
bution to total transportation fuel demands. All feedstocks and process data were set at
their base-case levels, thus, representing current technology and cost levels, and not
considering furfural by-product credit. Total transportation fuel de mand was held
constant at 80 x 1 09 gal, and the ethanol contribution was progressively raised fro m 0 .5%
to 25% of the total amount. Additionally, for each case, the supply of oil and all oil-
derived products was reduced �n proportion to the reduction in gasoline de mand. Thus, . .
.these runs allow exa mination o f the potential for substitution of ethanol for gasoline and
an equivalent reduction in refinery de mand for oil.
Table 1 3 presents the results of these fixed-blend cases for various sources of fuel
ethanol. As expected, corn residues supply the initial ethanol demands; for ethanol
contributions up to 2 .596 (2 x 1 0 9 gal), all ethanol is produced by the acid hydrolysis of
corn residues. At the 5% level, all logging residues are used and fermented corn grain
fills the re maining demand. At the 1 0 % level, wood comes into the solution as the limit
(in the base case) of corn used for ethanol is reached. To meet the 25% level of ethanol
contribution to vehicle fuels, all wood is exhausted and 1 3 % of the available corn grain
must be fermented to meet the 20 x 1 0 9 gal ethanol de mand.* In all cases, the solution
*The base case constrains corn-derived ethanol to 1 0 9 gal. To reach the 25% level of ethanol contribution, the constraint was 1elaxed, allowing all available corn grain (approximately 7 x 1 0 9 bu) to be used for ethanol if necessary.
2 6

TP-2 1 47
is feasible: all demands can be met even though oil and oil-derived products are reduced
in proportion to the gasoline de mand reduction. However, the structure of the industry
changes somewhat to adjust to the changes in petrochemical feedstock availability.
F irst, natural gas consumption increases to provide feedstocks for olefin produc tion.
Reduced oil availability reduces the supplies of oil-derived propane, butane, naphtha,
etc., and natural gas refining must increase to make up the difference. Although the
supplies of natural gas are more than sufficient to substitute for the reduced avail-
abilities of petroleu m products, forc ing the model to utilize more expensive ethanol and
natural gas makes it more expensive to fill final demands.
Table 1 3. Feedstock Contributions to Fixed-Blend Ethanol Deman�
F eedstock
Corn residues ·
Logging residues Softwood ·
Hardwood Wood C orn grain
Total ethanol
Relative objective func tion
0 .5%
400
0 0 0 0
400
value 1 . 0 0
E thanol Contribution t o 80 x 1 0 9 gal Fuel Demand
1 . 2 5 % 2.5% 596 1 0% 25%
1 , 0 0 0 2 ,000 2 , 720 2, 784b 2 , 784b
0 0 574a 574b 574b
0 0 469 48 3a 483b
0 0 0 3, 1 60 1 3, 77'gb
0 0 237 1 , o o ob 2,38 l c --
1 , 0 0 0 2 , 0 0 0 4, 0 0 0 8 ,000 2 0 , 0 0 0
1 . 0 0 1 1 . 0 0 2 1 . 00 8 1 . 03 1 . 1 3
aunits of entries are 1 06 gal ethanol. bResource at base-case capacity. cBase-case constraint relaxed, allowing all available corn grain
(approximately 7 x 1 0 9 bu) to be used for ethanol if necessary. The level of corn-derived ethanol in the solution requires approximately 1 3% of the available corn grain.
The relative objective func tion value over these cases provides a rough estimate of
the cost of forcing (e.g., by legislative mandate and curtailment of imports) the econo my
27
TP-2147
to substitute ethanol for gasoline and reducing oil consumption accordingly. The relative
cost of meeting fuels and chemicals demands varies only slightly from the base case to
the 5% ethanol contribution. Of course the average cost per gallon of fuel is increased
because the cost of ethanol is greater than that of gasoline. However, at low levels of
ethanol contribution, the low-cost routes to ethanol predominate, and the increment to
average fuel cost is low. At higher levels of ethanol demand, more costly routes (wood
and com grain) are required, and the average fuel cost and total industry cost rise
accordingly.
Free-Market Ethanol Demands. The analyses in the previous section involved
determining the effect of increasing the pool of ethanol exogenously. That is, the system
was forced to substitute ethanol for gasoline, and the results therefore pertain to forced
market penetration. In the runs described in this section the free market is simulated;
ethanol and gasoline compete for the (fixed) transportation fuel demand. The model
seeks the minimum-cost solution for meeting final demands, given the alternative
processes, feedstocks, and costs.
The results of two different experimental designs are reported below. In the first
design natural gas and oil prices are varied to examine the effect of increased nonrenew
able feedstock costs on the role of ethanol in the optimized economy. The second design
addresses the benefits derived from technology improvements achieved through further
R&D that would expand ethanol fuel consumption: in particular, process yield improve
ment and feedstock cost reductions. Both of these experiments were run with two
important constraints. The first relates to the role of fermentation ethanol. Currently,
a production capacity of about 500 x 1 06 gal ethanol produced from fermentation of
starch or sugar feedstocks is available. As demonstrated above, the first acid hydrolysis
plants will probably compete with the existing plants using corn grain. However, to
estimate the potential for supplementing current corn grain ethanol with acid hydrolysis
capacity, the model is restricted to utilizing all 500 x 1 0 6 gai of corn grain capacity in
28

. . .
TP-2 1 47
all experiments. Th is allows exa m ination of capac ity-augm enting effects; but for this
situation to materialize, corn fermen tation plants would require a production subsidy (up
to $ 1 . 00 /gal) or cheaper corn (as low as $0 .50/bu) to compete with corn residues in a
proven co m merc ial ac id hydrolysis facility.
The second constraint involves the by-product credit for furfural. To derive a
steady-state solution for the credit, the model was run with progessively lower furfural
costs, starting at $0 . 2 9 /lb, to determine the maximum furfural penetration. This
occurred at $ 0 . 08 /lb, where 2.48 x 1 0 8 lb furfural are utilized. G iven the fixed
proportion production rate of 3 .5 lb furfural per gallon of ethanol, 7 1 0 x 1 0 6 gal of
ethanol can be subsidized by furfural at a rate of $0 .28/gal. According to the data in
Table 1 2, the cheapest source of ethanol is corn residues. So, the model was supplied
with 7 1 0 x 1 06 gal of corn residue-based ethanol priced at $0 . 9 1 . Additional ethanol was
unsubsidized and therefore priced at the base-case cost.
To sum marize, the base case for the exp�ri111ents reported below involves 500 x 1 06
gal of corn grain-based ethanol and 958 X 1 0 6 gal of furfurai-subsidized corn residue
based ethanol. A dd itional penetration of ethanol can be ascribed to the particular
para meters applied in a spec ific case.
SUMMARY
To sum marize the impacts of a furfural credit on the selling price of e thanol and
co mpare this research gain with the benefit derived fro m xylose fermentation, we have
estimated supply curves. The e ffects of these R&:D options are evaluated in terms of the
ability of these options to improve the competitive position of ethanol fro m the base
case.
2 9

TP-2147
The base-case supply curve (as shown as the uppermost curve in Figure 1) is con
structed from the information in Table 1 3. The points along the supply curve show the
quantities of ethanol that could be produced from lignocellulosic feedstocl<s and the
corresponding ethanol selling prices. The curve is drawn as a step function because the
prices of the feedstocks vary regionally and there are yield differences in the various
feedstocks. The horizontal line segments measure the amounts of ethanol available at
each price while the vertical line segments show the incremental price change required
to make additional amounts of ethanol available. These price changes result from deple
tion of the least expensive feedstocks.
Figure 1 also shows in addition to the base-case curve three supply curves: the
base case with a furfural credit, the base case with a 30% yield increase, and the base
case with a 60% yield increase. Each case is discussed in greater detail below.
The Furfural Credit
With the assumptions of 3.5 lb of ·furfural produced per gallon of ethanol a.t a sell
ing price of $0.08/lb, the ethanol production cost credit is $0.28/gal. Since the size of
the furfural market being considered is 3354 x 106 lb, the price of approximately
960 x 106 gal of ethanol is reduced from $1.19/gal to $0.91/gal (reference line a in
Figure 7). The impact of this shift is that almost 1.0 x 10⁹ gal of ethanol (which is
competitive as an octane enhancer at a price of $1.19/gal) would be competitive as a
neat fuel at a price of $0.9 1/gal. At this price ethanol is more than marginally competi
tive as a neat fuel, a competitive position might be maintained at prices as high as
$1.00/ga1 This implies substantial profit for the initial entrants into the production of
ethanol and furfural. The furfural credit creates one additional step in the supply
curve. Because there are no other changes, the base-case supply curve remains
unchanged at ethanol levels greater than 960 x 106 gal.
30
. . .

TP-2 1 47
If additional markets for furfural could be developed, larger levels of ethanol I
production would earn a credit. Reference lines b and c sho w the effec ts of 1 00 % and
200% increases in the size of the furfural market in terms of the larger levels of ethanol
production that would earn a credit. Corresponding to a 1 00 96 increase in the size of the
furfural market is a level of ethanol production that is less than the total ethanol avail
able at $ 1. 1 9 /gal. The effects of the furfural credit are therefore the sa me: ethanol
that was competitive as an oc tane enhancer is now competitive as a neat fuel. At a
200% increase in the size of the furfural market, the balance of the lowest-cost ethanol
is made competitive as a neat fuel and the next two more costly sources of ethanol,
which were formerly not competitive as oc tane enhancers, become competitive as a
result of the credit.
Thirty Percent Increase in Ethanol Yield
A 3 0 % increase in ethanol yield might be achieved through resea�ch efforts in
xylose fermentation or increased cellulose yield fro m .the feedstocks. Since· xylose
fermentation is an alternative use of the xylose strea m, no furfural credit ·can be applied
in addition to the gains fro m the xylose fermentation. As opposed to the furfural credit,
which only lowers the price of ethanol, the 3 0 % increase in yield decreases prices and
produces m ore ethano1 This causes the supply curve to shift down and to the right; just
over 3 x 1 0 9 gal are c�mpetitive as a neat fuel and 1 0 9 additional gal are co mpetitive as
octane enhancer as a result of the yield increase from xylose fermentation. If the 3 0 %
yield increase is the result of increased cellulose recovery, the shift of the supply curve
is the same as that for xylose fermentation except that it is also possible to incorporate
the different uses of the xylose frac tion. The downward shift of this curve results fro m
the e ffect o f the $0 . 2 8 /gal furfural credit on the levels o f ethanol production, as denoted
by re ference lines a, b, and c. Past !)Oint c, no cred it is earned and the remainder of the
supply curve is unchanged. As a result of the increased ethanol yield, the least-cost
3 1

TP-2147
ethanol is now increased from about 2.3 x 10⁹ gal to almost 3.0 x 10⁹ gal. This allows
the furfural credit earned from a 200% increase in the furfural market to be earned
completely by the ethanol produced by the least-cost feedstock. In this case, the ethanol
cost is lower than that from any other case, with 3 x 1 o9 gal priced below $0. 70/gal.
Again, since this ethanol could be priced close to $1.00/gal, the furfural credit is a large
source of profit for the producers of the first 3 x 10⁹ gal of ethanol.
In conclusion, it appears that furfural's best contribution will be as a source of
intermediate-term profit for ethanol/furfural producers. This promise of profit should
serve as a strong incentive in the development and implementation of the acid hydrolysis
technology. The maximum ethanol penetration in the longer term, however, will result
from technologies capable of increasing ethanol yields.
CONCLUSIONS AND RECOMMENDATIONS
Fu.rfural is an economically attractive coproduct in the acid hydrolysis of cellulose
for fuel-grade ethanol production, provided large-volume markets can be developed. A
single 50 x 106 gal/yr ethanol plant would produce 140 to 200 x 106 lb/yr of furfural, an
amount equal to the total current domestic market. Thus, new outlets for furfural in
substantial quantities would be needed to support large-scale development of an ethanol
from-cellulose industry. Furfural is a versatile, reactive chemical with a history of
utility as a precursor that predates the petrochemicals era. This study uncovered some
of the old laboratory work on upgrad Lng furfural and established its present-day economic
potential as a large-volume, low-cost by-product (2, 1 0).
This study indicates a favorable economic j?rognosis for manufacture of n-butanol,
adipic acid, and maleic anhydride from furfural. The information used to make the
appraisals is old and of uncertain quality, and in no case did it extend beyond laboratory
32
TP-2 1 47
demonstrations of the che mical reactions. Nevertheless, the results indicate that these
primitive processes have enough pro fitability potential to ultimately displace the conven
tional hydrocarbon-based processes and provide significant support to the econom ics of
fuel-grade ethanol production.
Develop ment of industrial production of n-butanol, adipic acid, and maleic anhy
dride from furfural could expand the furfural market to 3354 x 1 06 lb. The analysis of
furfural potential, within the context o f an optimally organized fuels and chemicals
industry, indicates that these three most attractive processes could thus subsidize
approximately 960 x 1 0 6 gal of ethanol to a selling price as low as $0 .9 1 /gal. This
ethanol cost is based on a furfural cred it of $0 .28/lb and utilization of the lowest-cost
biomass feedstocks (corn residues at $ 20 /ton). This production level exhausts slightly
less than one-half of the available corn residues, the most economic feedstock for
ethanol production. If additional furfural markets of about 5 x 1 0 9 lb, with a value of at
least $0. 08/lb, could be identified, then over 2.5 x 1 0 9 gal of ethanol could be marketed
at about $ 1 . 0 0 /gal.
The phenolic resin market is another possible outlet for large quantities of
furfura1 Current do mestic volu me is 1 . 2- 1 . 5 x 1 0 9 lb/yr with prices in the $ 2.00-$ 2.50/lb
range. The market has been dominated since its beginning by phenol-formaldehyde
formulations and has become firmly established on this foundation. Furfural, an
aldehyde, can be substituted for for maldehyde to yield a different group of thermo
se tting phenolic resins. A related potential new product group could be furan resins,
based on substitution of furfural alcohol (fro m furfural) for phenol. A large number of
formulations were invented many years ago, but they re main undeveloped. It is possible
that, given very low cost furfural, a new compe titive line of phenolic resins would find a
place in the market. However, estimates of such penetration are difficult because of the
3 3

TP-2 1 47
complex interactions of formulations, performance properties and prices, and the tradi
tional and strong resistance of the resin business to changes. The place of furfural in the
thermo-se tting resin business was beyond the scope of this study.
C onverting U1e xylose stream to ethanol has about the sa me effect on the selling
price of ethanol as the furfural credit. The major difference between these two research
op tions is the increased availability of ethanol derived fro m all feedstocks through xylose
fermentation, while the furfural credit lowers only the price of ethanol derived fro m the
cheapest feedstocl< (corn residues). However, the impact of xylose fer mentation is
restricted to the fuels markets, while the coproduction and sale of furfural not only
makes ethanol more competitive, but also provides substitutes for other petroleu m-based
products that are che mical precursors. The greatest ethanol penetration will result from
xylose fermentation, while the furfural credit offers large near-term profits as an incen
tive to ethanol producers and has a m ore diversified impact on reduced petroleum
product de mand.
REFERENCES
1. A m erican P etroleum Institute, 1 9 83, Basic P etroleum Data Book, Washington,
D. C. : A merican Petroleu m Institute.
2. British Intelligence Objectives Subcom mittee, "Preparation of Adipic Acid fro m
Tetrahydrofuran and Carbon M onoxide, " BIOS 3 5 1 , 1 948.
3. Brownlee, H. J. and Miner, C. S., Ind. Eng. Che rn. 40, 20 1 ( 1 948 ).
4. Cass, 0. W., Chemical Industries 60 , 6 1 2 ( 1 947).
5. Che mical and Engineering News, 1 1 ( 1 98 3 ) May 2.
6. Chem ical and Engineering News, 35 ( 1 982) June 1 4.
7. Che mical Marketing Reporter, 4 ( 1 98 2) Sept. 27.
34

TP-2 1 47
8. Che mical M arketing Reporter, ( 1 9 83) May 1 6.
9. Cost, N. D. and McClure, J. P ., Multiresource Inventories: Techniques for Estimat
ing Biomass on a S tatewide Basis, Research Publication SE-228, 1 982.
1 0 . Dunlap, A. P . and P eters, F. N ., The Furans, New York: Reinhold Publishing C orpo
ration, 1 953.
1 1 . Farina, R., "Biomass Alcohols as Potential Petroleu m Alternatives in the Fuel and
Petrochemical Industries: A G eneralized Network M odel, " unpublished dissertation,
Boulder, CO: University of C olorado, 1 982 .
1 2. Gaines, L. L ., et al., Energy and Materials Flows in the Production of Olefins and
Their Derivatives, A NL /C NS U-9, Chicago, IL : Argonne National Laboratory, 1 98 0 .
1 3. G illiland, E. R. and Lavender, H. M ., Jr. , India Rubber World TII (No. 1 ), 67 ( 1 944).
1 4. Hasche, R. L., Chemical and Engineering News 2 3 (No. 2 0), 1 840 ( 1 945).
1 5. Johnson, R. C., et al., Che micals from W ood: The Policv Imolications of Federal
Subsidy II, MTR-83 W2-02, McLean, VA: MIT RE Corporation, 1 9 83.
1 6. Kirshenbaum, I . , "Butadiene, It Encycloped ia of Che mical Technology, 3 rd edition, . ·
Vol. 4, ed ited by Kirk and O th mer, 3 1 3, 1 978.
1 7. Max, W ., et al., 1 983, Feasibility of Using Agricultural Residues For Energy P roduc
tion, unpublished internal technical report, Golden, CO: Solar Energy Research
Institute.
1 8. Mc Killip, W. J., and Sherman, E., "Furan Derivatives, " Encyclopedia of Che mical
Technology, 3 rd ed ition, Vol. 1 1 , edited by Kirk and O thmer, 499, 1 978.
1 9. Milas, N. A. and Walsh, W. L., J. A m. Che rn. S oc. 57, 1 38 9 ( 1 93 5 ).
20. M onteith, D. B., The Availability of F orest Bio mass in New York, Albany, NY: New
York S ta te Energy Office, 1 98 1 .
2 1 . S m ith, H. A. and Fuzek, J. F ., J Che rn. S oc. 7 1 , 4 1 5 ( 1 949).
22. U.S. Department of Agriculture, "Forest S tatistics -of the United S tates, 1 977 ,"
review draft, Washington, DC: USDA, 1 978.
3 5

TP-2 1 47
23. U.S. Department of Agriculture, Tree Bio mass: A S ta te-of-the-Art Compilation,
G eneral Technical Report W0-33, Washington, DC: US DA, 1 98 1 .
24. U.S. Depart ment of Agriculture, An Analysjs of the Timber Situation in the United
States 1 9 5 2-2 0 3 0,_ F orest Resource Report No. 23 , Washington, DC: US DA, 1 982 .
3 6