Value-in-use model for chlorination of titania feedstocks · · 2015-06-11and a gas scrubber. The...
10
Introduction Approximately 90% of all TiO 2 extracted from titanium-bearing minerals is used to produce white pigment (TZMI, 2012). A significant portion of this pigment is produced through the chloride process. This involves chlorination of TiO 2 feedstocks such as natural and synthetic rutile, ilmenite, and high-titania slag in a fluidized-bed reactor to produce TiCl 4 , which is subsequently purified and oxidized to produce TiO 2 . The chloride process has stringent feedstock quality specifications to ensure that it can be operated in a stable and economical manner. As a major TiO 2 feedstock producer, Exxaro Heavy Minerals (now part of Tronox) needed to gain a thorough understanding of how their products would behave in their customers’ chlorination reactors. This understanding would firstly assist in ensuring that an acceptable product is produced. Secondly, it would make it possible to gauge the value of the products in the hands of customers. To improve this understanding, it was decided to develop a techno-economic model of the chloride process that could be used to study the influence of different feedstock characteristics on the performance of the pigment production process. Process analysis This section presents details of the process analysis done with the purpose of collecting information that could be used as the basis of the modelling work. Process description The purpose of the chloride TiO 2 pigment production process is to extract the maximum amount of titanium from the TiO 2 -containing feed material in the form of titanium dioxide, while rejecting as much of the impurities (e.g. Ca, Mg, Si, Al, etc.) as possible to the waste streams, based on differences in the phase transition temperatures of different metal chlorides (Table I). An overview of the process is shown in Figure 1. The process consists of the following five stages (Lee 1991). ➤ Chlorination. This first stage is the focus of this paper. Chlorination converts feed materials to a solid waste stream and a crude liquid stream containing most of the titanium as TiCl 4 ➤ Purification. The crude TiCl 4 produced in chlorination contains a wide range of impurities, which include solid iron and manganese chlorides, and unreacted ore, coke, and silicates, as well as soluble vanadium. Vanadium is converted to an insoluble chloride, and all the solid impurities are removed by vaporizing the TiCl 4 and condensing it again ➤ Oxidation. Liquid TiCl 4 from purification is vaporized and reacted with pre-heated oxygen to produce TiO 2 and chlorine (Equation [1]). Chemicals are added for Value-in-use model for chlorination of titania feedstocks by S. Maharajh*, J. Muller*, and J.H. Zietsman † Synopsis In the chlorination process for TiO 2 pigment production, blends of titania feedstocks such as ilmenite, synthetic rutile (SR), natural rutile, upgraded slag, and chloride-grade slag are reacted with coke and chlorine at a temperature of around 1000°C to form TiCl 4 (the main product) and other waste metal chlorides. The TiCl 4 is the main feed material for the TiO 2 pigment-making process. Feeding different titania materials to the chlorinator affects the amount of coke and chlorine required for the process, the amount of waste generated, waste disposal costs, the amount of TiCl 4 produced, and bed build-up rates. These factors influence the value of the feedstock. Generally, a higher TiO 2 feedstock is more valued since less waste is generated and less reagents are consumed. To quantify the impact of different feedstocks on the chlorinator, a techno-economic model was developed to describe the chlorination process and estimate process variables at steady state. This paper describes the development of the model and studies in which the model has been used to quantify effects of using different feedstocks. Keywords titania feedstock, chlorination, process modelling TiCl 4 , value-in-use. * Exxaro Resources, Pretoria, South Africa. † University of Pretoria, Pretoria, South Africa. © The Southern African Institute of Mining and Metallurgy, 2015. ISSN 2225-6253. This paper was first presented at the, Pyrometallurgical Modelling Principles and Practices, 4–5 August 2014, Emperors Palace Hotel Casino Convention Resort, Johannesburg. 385 The Journal of The Southern African Institute of Mining and Metallurgy VOLUME 115 MAY 2015 ▲
-
Upload
dangkhuong -
Category
Documents
-
view
215 -
download
0
Transcript of Value-in-use model for chlorination of titania feedstocks · · 2015-06-11and a gas scrubber. The...

IntroductionApproximately 90% of all TiO2 extracted fromtitanium-bearing minerals is used to producewhite pigment (TZMI, 2012). A significantportion of this pigment is produced throughthe chloride process. This involves chlorinationof TiO2 feedstocks such as natural andsynthetic rutile, ilmenite, and high-titania slagin a fluidized-bed reactor to produce TiCl4,which is subsequently purified and oxidized toproduce TiO2. The chloride process hasstringent feedstock quality specifications toensure that it can be operated in a stable andeconomical manner.
As a major TiO2 feedstock producer,Exxaro Heavy Minerals (now part of Tronox)needed to gain a thorough understanding ofhow their products would behave in theircustomers’ chlorination reactors. Thisunderstanding would firstly assist in ensuringthat an acceptable product is produced.Secondly, it would make it possible to gaugethe value of the products in the hands ofcustomers. To improve this understanding, itwas decided to develop a techno-economicmodel of the chloride process that could beused to study the influence of different
feedstock characteristics on the performance ofthe pigment production process.
Process analysisThis section presents details of the processanalysis done with the purpose of collectinginformation that could be used as the basis ofthe modelling work.
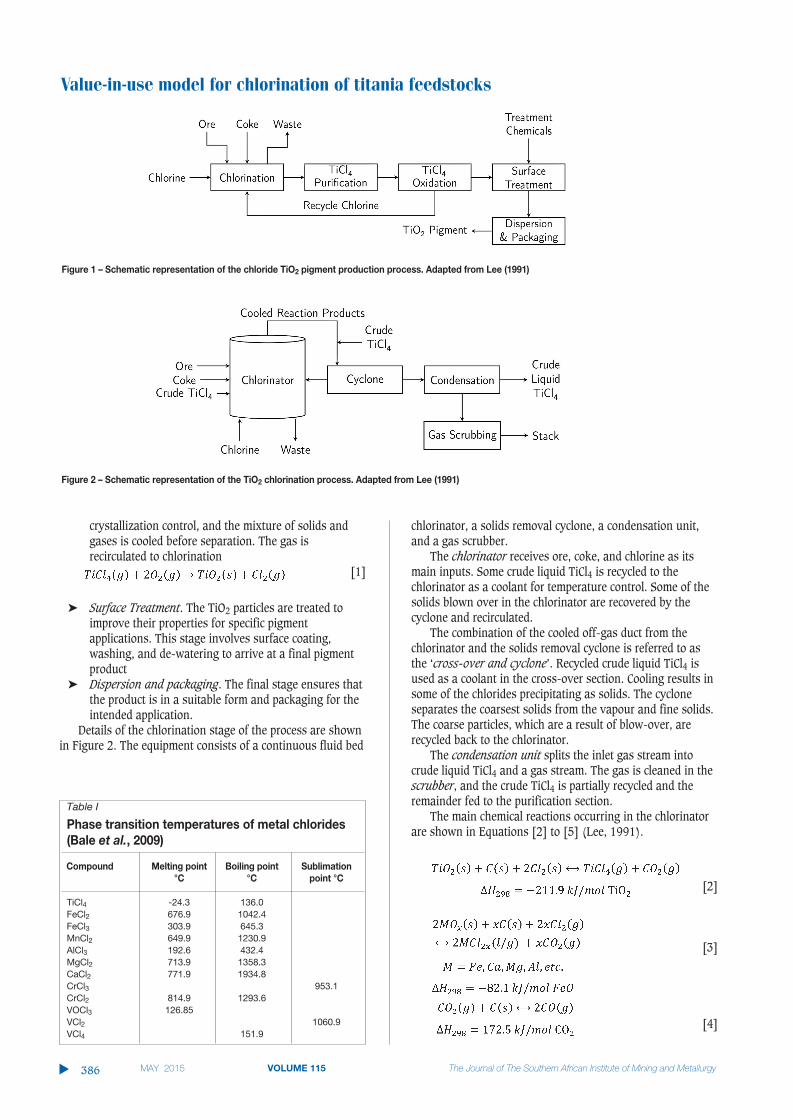
Process descriptionThe purpose of the chloride TiO2 pigmentproduction process is to extract the maximumamount of titanium from the TiO2-containingfeed material in the form of titanium dioxide,while rejecting as much of the impurities (e.g.Ca, Mg, Si, Al, etc.) as possible to the wastestreams, based on differences in the phasetransition temperatures of different metalchlorides (Table I). An overview of the processis shown in Figure 1. The process consists ofthe following five stages (Lee 1991).
➤ Chlorination. This first stage is the focusof this paper. Chlorination converts feedmaterials to a solid waste stream and acrude liquid stream containing most ofthe titanium as TiCl4
➤ Purification. The crude TiCl4 produced inchlorination contains a wide range ofimpurities, which include solid iron andmanganese chlorides, and unreacted ore,coke, and silicates, as well as solublevanadium. Vanadium is converted to aninsoluble chloride, and all the solidimpurities are removed by vaporizingthe TiCl4 and condensing it again
➤ Oxidation. Liquid TiCl4 from purificationis vaporized and reacted with pre-heatedoxygen to produce TiO2 and chlorine(Equation [1]). Chemicals are added for
Value-in-use model for chlorination oftitania feedstocksby S. Maharajh*, J. Muller*, and J.H. Zietsman†
SynopsisIn the chlorination process for TiO2 pigment production, blends of titaniafeedstocks such as ilmenite, synthetic rutile (SR), natural rutile, upgradedslag, and chloride-grade slag are reacted with coke and chlorine at atemperature of around 1000°C to form TiCl4 (the main product) and otherwaste metal chlorides. The TiCl4 is the main feed material for the TiO2pigment-making process. Feeding different titania materials to thechlorinator affects the amount of coke and chlorine required for theprocess, the amount of waste generated, waste disposal costs, the amountof TiCl4 produced, and bed build-up rates. These factors influence thevalue of the feedstock. Generally, a higher TiO2 feedstock is more valuedsince less waste is generated and less reagents are consumed. To quantifythe impact of different feedstocks on the chlorinator, a techno-economicmodel was developed to describe the chlorination process and estimateprocess variables at steady state. This paper describes the development ofthe model and studies in which the model has been used to quantifyeffects of using different feedstocks.
Keywordstitania feedstock, chlorination, process modelling TiCl4, value-in-use.
* Exxaro Resources, Pretoria, South Africa.† University of Pretoria, Pretoria, South Africa.© The Southern African Institute of Mining and
Metallurgy, 2015. ISSN 2225-6253. This paperwas first presented at the, PyrometallurgicalModelling Principles and Practices, 4–5 August2014, Emperors Palace Hotel Casino ConventionResort, Johannesburg.
385The Journal of The Southern African Institute of Mining and Metallurgy VOLUME 115 MAY 2015 ▲
Value-in-use model for chlorination of titania feedstocks
crystallization control, and the mixture of solids andgases is cooled before separation. The gas isrecirculated to chlorination
[1]
➤ Surface Treatment. The TiO2 particles are treated toimprove their properties for specific pigmentapplications. This stage involves surface coating,washing, and de-watering to arrive at a final pigmentproduct
➤ Dispersion and packaging. The final stage ensures thatthe product is in a suitable form and packaging for theintended application.
Details of the chlorination stage of the process are shownin Figure 2. The equipment consists of a continuous fluid bed
chlorinator, a solids removal cyclone, a condensation unit,and a gas scrubber.
The chlorinator receives ore, coke, and chlorine as itsmain inputs. Some crude liquid TiCl4 is recycled to thechlorinator as a coolant for temperature control. Some of thesolids blown over in the chlorinator are recovered by thecyclone and recirculated.
The combination of the cooled off-gas duct from thechlorinator and the solids removal cyclone is referred to asthe ‘cross-over and cyclone’. Recycled crude liquid TiCl4 isused as a coolant in the cross-over section. Cooling results insome of the chlorides precipitating as solids. The cycloneseparates the coarsest solids from the vapour and fine solids.The coarse particles, which are a result of blow-over, arerecycled back to the chlorinator.
The condensation unit splits the inlet gas stream intocrude liquid TiCl4 and a gas stream. The gas is cleaned in thescrubber, and the crude TiCl4 is partially recycled and theremainder fed to the purification section.
The main chemical reactions occurring in the chlorinatorare shown in Equations [2] to [5] (Lee, 1991).
[2]
[3]
[4]
▲
386 MAY 2015 VOLUME 115 The Journal of The Southern African Institute of Mining and Metallurgy
Figure 1 – Schematic representation of the chloride TiO2 pigment production process. Adapted from Lee (1991)
Table I
Phase transition temperatures of metal chlorides(Bale et al., 2009)
Compound Melting point Boiling point Sublimation °C °C point °C
TiCl4 -24.3 136.0FeCl2 676.9 1042.4FeCl3 303.9 645.3MnCl2 649.9 1230.9AlCl3 192.6 432.4MgCl2 713.9 1358.3CaCl2 771.9 1934.8CrCl3 953.1CrCl2 814.9 1293.6VOCl3 126.85VCl2 1060.9VCl4 151.9
Figure 2 – Schematic representation of the TiO2 chlorination process. Adapted from Lee (1991)
[5]
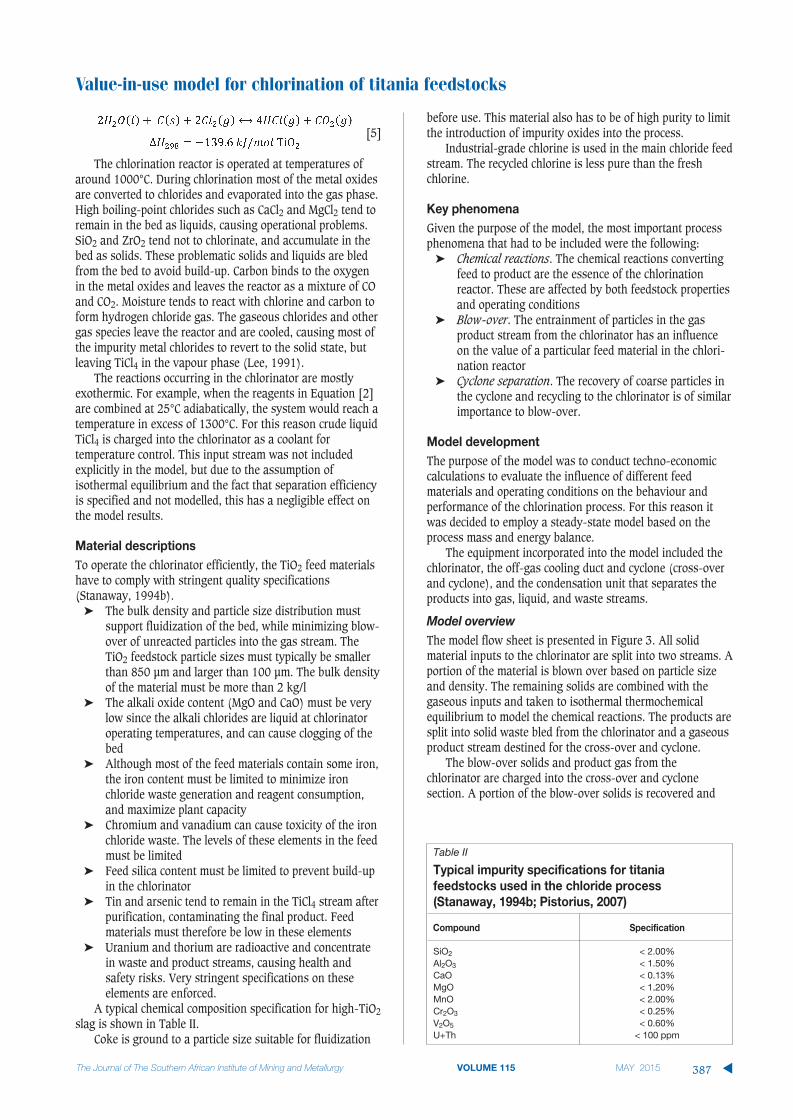
The chlorination reactor is operated at temperatures ofaround 1000°C. During chlorination most of the metal oxidesare converted to chlorides and evaporated into the gas phase.High boiling-point chlorides such as CaCl2 and MgCl2 tend toremain in the bed as liquids, causing operational problems.SiO2 and ZrO2 tend not to chlorinate, and accumulate in thebed as solids. These problematic solids and liquids are bledfrom the bed to avoid build-up. Carbon binds to the oxygenin the metal oxides and leaves the reactor as a mixture of COand CO2. Moisture tends to react with chlorine and carbon toform hydrogen chloride gas. The gaseous chlorides and othergas species leave the reactor and are cooled, causing most ofthe impurity metal chlorides to revert to the solid state, butleaving TiCl4 in the vapour phase (Lee, 1991).
The reactions occurring in the chlorinator are mostlyexothermic. For example, when the reagents in Equation [2]are combined at 25°C adiabatically, the system would reach atemperature in excess of 1300°C. For this reason crude liquidTiCl4 is charged into the chlorinator as a coolant fortemperature control. This input stream was not includedexplicitly in the model, but due to the assumption ofisothermal equilibrium and the fact that separation efficiencyis specified and not modelled, this has a negligible effect onthe model results.
Material descriptionsTo operate the chlorinator efficiently, the TiO2 feed materialshave to comply with stringent quality specifications(Stanaway, 1994b).
➤ The bulk density and particle size distribution mustsupport fluidization of the bed, while minimizing blow-over of unreacted particles into the gas stream. TheTiO2 feedstock particle sizes must typically be smallerthan 850 µm and larger than 100 µm. The bulk densityof the material must be more than 2 kg/l
➤ The alkali oxide content (MgO and CaO) must be verylow since the alkali chlorides are liquid at chlorinatoroperating temperatures, and can cause clogging of thebed
➤ Although most of the feed materials contain some iron,the iron content must be limited to minimize ironchloride waste generation and reagent consumption,and maximize plant capacity
➤ Chromium and vanadium can cause toxicity of the ironchloride waste. The levels of these elements in the feedmust be limited
➤ Feed silica content must be limited to prevent build-upin the chlorinator
➤ Tin and arsenic tend to remain in the TiCl4 stream afterpurification, contaminating the final product. Feedmaterials must therefore be low in these elements
➤ Uranium and thorium are radioactive and concentratein waste and product streams, causing health andsafety risks. Very stringent specifications on theseelements are enforced.
A typical chemical composition specification for high-TiO2slag is shown in Table II.
Coke is ground to a particle size suitable for fluidization
before use. This material also has to be of high purity to limitthe introduction of impurity oxides into the process.
Industrial-grade chlorine is used in the main chloride feedstream. The recycled chlorine is less pure than the freshchlorine.
Key phenomenaGiven the purpose of the model, the most important processphenomena that had to be included were the following:
➤ Chemical reactions. The chemical reactions convertingfeed to product are the essence of the chlorinationreactor. These are affected by both feedstock propertiesand operating conditions
➤ Blow-over. The entrainment of particles in the gasproduct stream from the chlorinator has an influenceon the value of a particular feed material in the chlori-nation reactor
➤ Cyclone separation. The recovery of coarse particles inthe cyclone and recycling to the chlorinator is of similarimportance to blow-over.
Model developmentThe purpose of the model was to conduct techno-economiccalculations to evaluate the influence of different feedmaterials and operating conditions on the behaviour andperformance of the chlorination process. For this reason itwas decided to employ a steady-state model based on theprocess mass and energy balance.
The equipment incorporated into the model included thechlorinator, the off-gas cooling duct and cyclone (cross-overand cyclone), and the condensation unit that separates theproducts into gas, liquid, and waste streams.
Model overviewThe model flow sheet is presented in Figure 3. All solidmaterial inputs to the chlorinator are split into two streams. Aportion of the material is blown over based on particle sizeand density. The remaining solids are combined with thegaseous inputs and taken to isothermal thermochemicalequilibrium to model the chemical reactions. The products aresplit into solid waste bled from the chlorinator and a gaseousproduct stream destined for the cross-over and cyclone.
The blow-over solids and product gas from thechlorinator are charged into the cross-over and cyclonesection. A portion of the blow-over solids is recovered and
Value-in-use model for chlorination of titania feedstocks
387The Journal of The Southern African Institute of Mining and Metallurgy VOLUME 115 MAY 2015 ▲
Table II
Typical impurity specifications for titaniafeedstocks used in the chloride process(Stanaway, 1994b; Pistorius, 2007)
Compound Specification
SiO2 < 2.00%Al2O3 < 1.50%CaO < 0.13%MgO < 1.20%MnO < 2.00%Cr2O3 < 0.25%V2O5 < 0.60%U+Th < 100 ppm

Value-in-use model for chlorination of titania feedstocks
recycled to the chlorinator. The remaining solids and gas arecombined with cooling TiCl4 and equilibrated to generate thefinal product stream from this section. The product from thecross-over and cyclone is split between waste solids, a gasproduct, and a crude liquid TiCl4 product.
Model variables and parametersThe material input variables supplied to the model by theuser are listed in Table III, and the remaining input variablesin Table IV. The model parameters are presented in Table V.
The material stream values calculated by the model areshown in Table VI. In addition to these variables, those listedin Table VII are also calculated.
AssumptionsThe following assumptions were made in the model.
➤ The content of the fluid bed reactor is homogeneous interms of temperature, particle size distribution, andchemical composition. This assumption is implicit inthe lumped parameter modelling approach applied. Theassumption is not true, but it does not have adetrimental influence on the modelling results, giventhe purpose of the model
➤ Chlorinator reactions run to equilibrium. Thisassumption and the next one were required to make itpossible to solve the model. Very little detail wasavailable on the actual chemical reaction behaviour ofthe process, since access to a plant was not possible.The model results based on this assumption weredeemed to be acceptable for the purpose of the work
➤ Material reaches equilibrium in the cross-over➤ Coke is assumed to be pure graphite. This assumption
was made to simplify the model, and to focus it on theinfluence of the TiO2 feedstock rather than the coke.This means that sulphur is ignored by the model.Sulphur leaves the system through the waste gassystem as sulphur species such as H2S, COS, and
SOCl2. It has a limited influence on the chlorinationphenomena of interest here
➤ Liquid phases are immiscible. For simplicity, all liquidcompounds were handled separately as puresubstances, and not as a mixture. This reduced thedriving force for liquid formation because the activitiesof all the liquid compounds are unity. This assumptionwould have introduced inaccuracies into theequilibrium calculations
➤ Particles are compositionally homogeneous➤ Chlorine slip is usually low and therefore was assumed
to be zero in the model.Chlorine slip occurs when chlorine passes through thechlorinator bed unreacted. This phenomenon reduceschlorine efficiency and indicates a chlorinator bed issue(e.g. high SiO2 content, low carbon content).
Material definitionsThe materials in the model were described with thermo-chemical data from the FACT pure substance database inFactSage 5.5. The compounds included in the model are listedin Table VIII.
Examples of TiO2 feedstock assays are shown in Table IX.Coke, chlorine, oxygen, and nitrogen were all treated as purestreams. Air was entered as a 79% N2, 21% O2 mixture onvolume basis.
Some examples of particulate material properties forsynthetic rutile and slag are shown in Tables X and XI.
Physical phenomenaChemical reactions were modelled very simply throughequilibrium calculations using the ChemApp thermochemistrylibrary (Petersen and Hack, 2007), and data from FactSage(Bale et al., 2009).
Blow-over of solids in the chlorinator and subsequentrecovery of coarse solids in the cyclone were the only physicalphenomena that were modelled in detail, and are describedhere.
In the chlorinator, solids are entrained in the fluidizinggas and elutriated out of the chlorinator unit. This mass issignificant and therefore had to be included in the model. Dueto the complexities and uncertainties surrounding elutriation,a simplified methodology was used based on the followingmodel input parameters for each feedstock material:
➤ Density – the solid density of the feedstock material➤ Particle size distribution – the particles sizes and mass
fraction of each size class for each feedstock➤ Particle size elutriation constants (Ki*) – the elutriation
constants for each particle size class for each feedstock➤ Particle size cyclone separation efficiency – the fraction
of material of each particle size class recovered in thecyclone
➤ Composition – the composition of the feedstockmaterial, which is assumed to be constant throughouteach particle and to remain the same until it is blownout of the reactor.
In test work, the particulate solids elutriation constantsare determined in units of kg/(s.m2). These constants are afunction of particle shape, density, and size. This implies thatfor a reactor of a given area, a certain flux of solids of aspecific particle size is expected in the outlet. Data on the
▲
388 MAY 2015 VOLUME 115 The Journal of The Southern African Institute of Mining and Metallurgy
Figure 3 – The process model flow sheet

fluidization of TiO2 feedstocks has been previouslyinvestigated (Moodley et al., 2012).
At steady-state operation the rate of particles blown overis limited to the incoming rate of particles of that size. Forthis system, the following are the sources of particles of aspecific size:
➤ Feed material. Material feed is classified, and theparticles of a certain average particle size enter at aspecified total feed rate multiplied by the fraction ofmaterial with that average particle size
➤ Recycled blow-over feed. Using the elutriation constantfor a particular particle size class, the rate at whichparticles are blown over is calculated, with only someof these being removed in the cross-over and cyclonesection. The blow-over rate is therefore multiplied withthe separation efficiency in the cyclone for a particlesize class to calculate the rate at which particles of asize class are recycled
➤ Larger size particles reacting. Chemical reactions in thechlorinator cause particles to shrink and hence fall intosmaller size classes. This feed rate of particles into alower size class is determined from the average particle
sizes of the current size class and the larger size class,and the total rate of particles falling into the larger sizeclass minus the rate blow-over rate.
Therefore, the blow-over rate of size class i (Equation[6]) is calculated as the minimum of the input rate ofparticles and the value calculated from the elutriationconstant. This approach ensures that the blow-over rate isconstrained by a mass balance over the chlorinator. Thevariable used in the blow-over and cyclone recoverycalculations are defined in Table XII.
[6]
Value-in-use model for chlorination of titania feedstocks
The Journal of The Southern African Institute of Mining and Metallurgy VOLUME 115 MAY 2015 389 ▲
Table III
Model material input variables. ‘X’ indicates user-specified input variables
Stream Feed rate Composition Temperature Compounds
TiO2 feed X X X TiO2, Ti2O3, FeO, Fe2O3, ZrO2, SiO2, Cr2O3, Al2O3, P2O5, MnO, CaO, MgO, V2O5, Nb2O5,
H2O, SnO2
Coke feeds X X CCl2(g) feed X X Cl2N2(g) X X X N2
O2(g) X X X O2
Air X X X N2, O2
Cl2(g) recycle XRecycle blow-over XChlorinator cooling TiCl4 X X TiCl4Cross-over cooling TiCl4 X X TiCl4
Table IVModel input variables
Variable Description Typical value Units
Feedstock basis
Operating temperatureCross-over temperatureProduct final temperatureOff-gas CO:CO2 molar ratioBed inerts cut-off fractionMass Ti oxides unreacted set-pointChlorinator TiCl4 coolingpercentage of product flowCross-over TiCl4 cooling ratio ofproduct flowPercentage Cl2 recoveredBlow-over reductant solidsremoval efficiencyReductant blow-overChlorine feed initial valueReductant feed initial valueChlorine recycle initial value
Total feedstock rate used as basis for the calculations. Each feedstock’s rate iscalculated using this value and the fraction of the feedstock in the mixTemperature at which the chlorinator is operated and the products exit from chlorinatorTemperature at which the material exits from the cross-over unitFinal temperature of the solid, liquid, and gas product out of the systemMolar ratio of CO and CO2 in the gas product out of the chlorinatorMaximum percentage of inerts in the bedAmount of unreacted Ti oxides in the chlorinator reaction mixture to solve the amountof chlorine required. Should be a small value larger than 0Fraction of the chlorinator product flow rate used to calculate the rate of TiCl4 cooling
Ratio of TiCl4 added to the cross-over for cooling relative to the TiCl4 production rate inthe chlorinatorPercentage of chlorine recovered from the circuitFraction of the reductant solid blow-over removed from the chlorinator output stream,and recycledFraction of reductant solids lost as blow-overInitial value of chlorine feed for the first iteration of the modelInitial value of reductant feed for the first iteration of the modelInitial value of recycled chlorine feed for the first iteration of the model
8100 kg/h
1050 °C200 °C70 °C140 %0.2 kg/h
0.025
1
99 %90 %
10 %13,660 kg/h1,439 kg/h
0 kg/h
Table V
Model parameters
Parameter Description Typical value Units
Bed volume Volume of the solids bed 20 m3
Bed area Area of the fluidized bed 7 m2
Value-in-use model for chlorination of titania feedstocks
▲
390 MAY 2015 VOLUME 115 The Journal of The Southern African Institute of Mining and Metallurgy
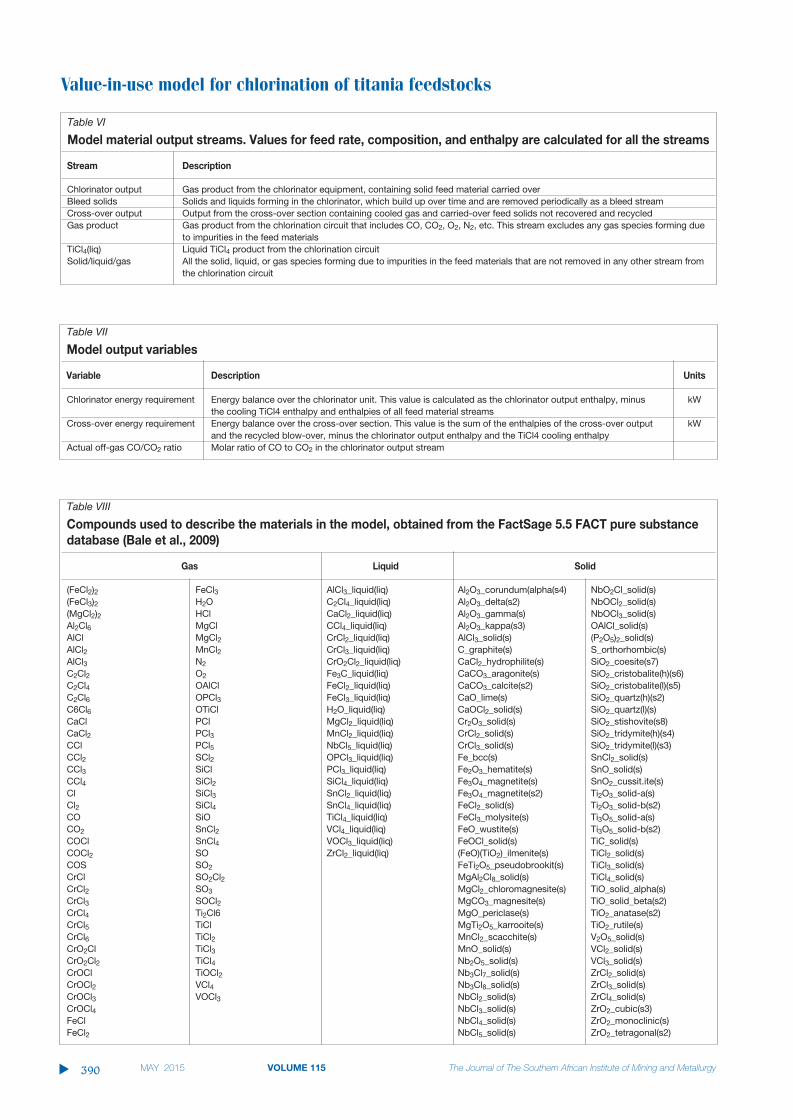
Table VI
Model material output streams. Values for feed rate, composition, and enthalpy are calculated for all the streams
Stream Description
Chlorinator output Gas product from the chlorinator equipment, containing solid feed material carried overBleed solids Solids and liquids forming in the chlorinator, which build up over time and are removed periodically as a bleed streamCross-over output Output from the cross-over section containing cooled gas and carried-over feed solids not recovered and recycledGas product Gas product from the chlorination circuit that includes CO, CO2, O2, N2, etc. This stream excludes any gas species forming due
to impurities in the feed materialsTiCl4(liq) Liquid TiCl4 product from the chlorination circuitSolid/liquid/gas All the solid, liquid, or gas species forming due to impurities in the feed materials that are not removed in any other stream from
the chlorination circuit
Table VII
Model output variables
Variable Description Units
Chlorinator energy requirement Energy balance over the chlorinator unit. This value is calculated as the chlorinator output enthalpy, minus kWthe cooling TiCl4 enthalpy and enthalpies of all feed material streams
Cross-over energy requirement Energy balance over the cross-over section. This value is the sum of the enthalpies of the cross-over output kWand the recycled blow-over, minus the chlorinator output enthalpy and the TiCl4 cooling enthalpy
Actual off-gas CO/CO2 ratio Molar ratio of CO to CO2 in the chlorinator output stream
Table VIII
Compounds used to describe the materials in the model, obtained from the FactSage 5.5 FACT pure substancedatabase (Bale et al., 2009)
Gas Liquid Solid
(FeCl2)2 FeCl3 AlCl3_liquid(liq) Al2O3_corundum(alpha(s4) NbO2Cl_solid(s)(FeCl3)2 H2O C2Cl4_liquid(liq) Al2O3_delta(s2) NbOCl2_solid(s)(MgCl2)2 HCl CaCl2_liquid(liq) Al2O3_gamma(s) NbOCl3_solid(s)Al2Cl6 MgCl CCl4_liquid(liq) Al2O3_kappa(s3) OAlCl_solid(s)AlCl MgCl2 CrCl2_liquid(liq) AlCl3_solid(s) (P2O5)2_solid(s)AlCl2 MnCl2 CrCl3_liquid(liq) C_graphite(s) S_orthorhombic(s)AlCl3 N2 CrO2Cl2_liquid(liq) CaCl2_hydrophilite(s) SiO2_coesite(s7)C2Cl2 O2 Fe3C_liquid(liq) CaCO3_aragonite(s) SiO2_cristobalite(h)(s6)C2Cl4 OAlCl FeCl2_liquid(liq) CaCO3_calcite(s2) SiO2_cristobalite(l)(s5)C2Cl6 OPCl3 FeCl3_liquid(liq) CaO_lime(s) SiO2_quartz(h)(s2)C6Cl6 OTiCl H2O_liquid(liq) CaOCl2_solid(s) SiO2_quartz(l)(s)CaCl PCl MgCl2_liquid(liq) Cr2O3_solid(s) SiO2_stishovite(s8)CaCl2 PCl3 MnCl2_liquid(liq) CrCl2_solid(s) SiO2_tridymite(h)(s4)CCl PCl5 NbCl5_liquid(liq) CrCl3_solid(s) SiO2_tridymite(l)(s3)CCl2 SCl2 OPCl3_liquid(liq) Fe_bcc(s) SnCl2_solid(s)CCl3 SiCl PCl3_liquid(liq) Fe2O3_hematite(s) SnO_solid(s)CCl4 SiCl2 SiCl4_liquid(liq) Fe3O4_magnetite(s) SnO2_cussit.ite(s)Cl SiCl3 SnCl2_liquid(liq) Fe3O4_magnetite(s2) Ti2O3_solid-a(s)Cl2 SiCl4 SnCl4_liquid(liq) FeCl2_solid(s) Ti2O3_solid-b(s2)CO SiO TiCl4_liquid(liq) FeCl3_molysite(s) Ti3O5_solid-a(s)CO2 SnCl2 VCl4_liquid(liq) FeO_wustite(s) Ti3O5_solid-b(s2)COCl SnCl4 VOCl3_liquid(liq) FeOCl_solid(s) TiC_solid(s)COCl2 SO ZrCl2_liquid(liq) (FeO)(TiO2)_ilmenite(s) TiCl2_solid(s)COS SO2 FeTi2O5_pseudobrookit(s) TiCl3_solid(s)CrCl SO2Cl2 MgAl2Cl8_solid(s) TiCl4_solid(s)CrCl2 SO3 MgCl2_chloromagnesite(s) TiO_solid_alpha(s)CrCl3 SOCl2 MgCO3_magnesite(s) TiO_solid_beta(s2)CrCl4 Ti2Cl6 MgO_periclase(s) TiO2_anatase(s2)CrCl5 TiCl MgTi2O5_karrooite(s) TiO2_rutile(s)CrCl6 TiCl2 MnCl2_scacchite(s) V2O5_solid(s)CrO2Cl TiCl3 MnO_solid(s) VCl2_solid(s)CrO2Cl2 TiCl4 Nb2O5_solid(s) VCl3_solid(s)CrOCl TiOCl2 Nb3Cl7_solid(s) ZrCl2_solid(s)CrOCl2 VCl4 Nb3Cl8_solid(s) ZrCl3_solid(s)CrOCl3 VOCl3 NbCl2_solid(s) ZrCl4_solid(s)CrOCl4 NbCl3_solid(s) ZrO2_cubic(s3)FeCl NbCl4_solid(s) ZrO2_monoclinic(s)FeCl2 NbCl5_solid(s) ZrO2_tetragonal(s2)

The first term in Equation [6], which is the maximumpossible blow-over rate according to the mass balance, isderived as follows:
The rate at which particles enter size class i (Fin,i) iscalculated as follows:
[7]
The rate at which particles leave the larger size class i+1(Fout,i+1) due to chemical reaction is calculated as follows:
[8]
The total blow-over rate of a feedstock is calculated as thesum of blow-over for all the particle size classes.
[9]The composition of the blow-over is derived from the
composition of the feed materials. The above methodology isbased on the following assumptions and simplifications:
➤ The composition of particles is that of the specified feedmaterial, and is constant throughout each particle
➤ particles are spheres and are evenly distributedthroughout each size class
➤ Particles do not break, and the only cause of particlesbecoming smaller is chemical reaction.
ImplementationThe model was implemented mostly in the Microsoft .NETenvironment with the C# programming language. MicrosoftExcel® was used as the front end because it is widelyavailable and used in industry. All thermochemicalcalculations were done using the ChemApp thermochemicallibrary (Petersen and Hack, 2007) and data exported fromFactSage (Bale et al., 2009).
ValidationThe model was validated qualitatively through interviewswith persons that have first-hand knowledge and experienceof the chlorination process. Quantitative validation wasplanned, but was ultimately cancelled for corporate reasons.
Modelling Studies
Value-in-use conceptsValue-in-use (VIU) models combine technical and financialinformation to provide a decision-making tool for productassessment and customer interaction. The concept aims toextract maximum sustainable value through knowledge andunderstanding of the value chain for the customer andproducer. One of the main uses of VIU models is to evaluateproduct changes against a base case and determine thefinancial impact of the change. VIU models can also be usedto compare and assess the value of different products in acustomer’s process. Examples where these two concepts havebeen practically used are provided in the following sections.
Example 1: production cost versus customer benefitThe first example evaluated the cost of producing a higherTiO2 grade slag versus the savings incurred by chlorideproducers.
Ilmenite (FeTiO3) is the most abundant titanium-bearingmineral and contains between 45 and 60% TiO2 (Moodley,2011). Ilmenite cannot be used directly in most pigmentproduction processes and has to be treated in order to
Value-in-use model for chlorination of titania feedstocks
The Journal of The Southern African Institute of Mining and Metallurgy VOLUME 115 MAY 2015 391 ▲
Table IX
Example TiO2 feedstock assays
Compound Slag Synthetic rutile
Al2O3 1.1% 2.5%CaO 0.2% 0.2%Cr2O3 0.0% 1.0%Fe2O3 0.0% 0.0%FeO 10.2% 0.0%H2O 0.1% 0.1%MgO 1.0% 1.8%MnO 2.0% 1.4%Nb2O5 0.1% 0.1%P2O5 0.0% 0.0%SiO2 4.0% 1.8%SnO2 0.0% 0.0%Ti2O3 46.5% 0.0%TiO2 34.4% 91.4%V2O5 0.3% 0.3%ZrO2 0.3% 0.2%Total 100.2% 100.8%
Table X
Example synthetic rutile properties
Density: 4260 kg/m3
Size class Ki* (kg/m2/s) Mass % Cyclone removal
+850 0 0.0% 90%-850+600 0 0.0% 90%-600+425 0 0.9% 90%-425+300 0 3.3% 90%-300+212 0 16.5% 90%-200+150 0.00005 50.9% 90%-150+100 0.00037 26.0% 90%-100+75 0.0017 2.4% 90%-75 0.0829 0.2% 0%
Table XI
Example titania slag properties
Density: 4260 kg/m3
Size class Ki* (kg/m2/s) Mass % Cyclone removal
850 0 3.35% 90%-250 0 16.65% 90%-175 0 19.70% 90%-125 0 20.20% 90%-88 0 16.15% 90%-50 0.000285 11.30% 90%-50 0.0023 7.00% 90%-25 0.00575 2.85% 90%-75 0.0202 1.85% 0%
Value-in-use model for chlorination of titania feedstocks
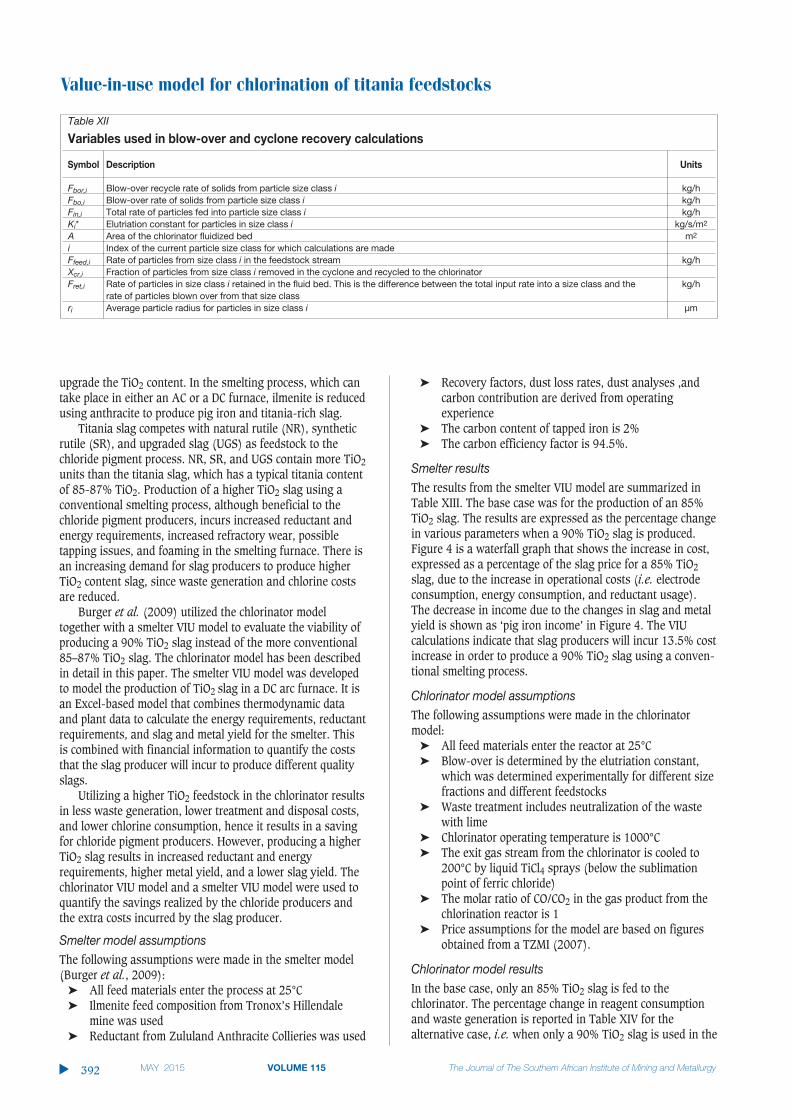
upgrade the TiO2 content. In the smelting process, which cantake place in either an AC or a DC furnace, ilmenite is reducedusing anthracite to produce pig iron and titania-rich slag.
Titania slag competes with natural rutile (NR), syntheticrutile (SR), and upgraded slag (UGS) as feedstock to thechloride pigment process. NR, SR, and UGS contain more TiO2units than the titania slag, which has a typical titania contentof 85-87% TiO2. Production of a higher TiO2 slag using aconventional smelting process, although beneficial to thechloride pigment producers, incurs increased reductant andenergy requirements, increased refractory wear, possibletapping issues, and foaming in the smelting furnace. There isan increasing demand for slag producers to produce higherTiO2 content slag, since waste generation and chlorine costsare reduced.
Burger et al. (2009) utilized the chlorinator modeltogether with a smelter VIU model to evaluate the viability ofproducing a 90% TiO2 slag instead of the more conventional85–87% TiO2 slag. The chlorinator model has been describedin detail in this paper. The smelter VIU model was developedto model the production of TiO2 slag in a DC arc furnace. It isan Excel-based model that combines thermodynamic dataand plant data to calculate the energy requirements, reductantrequirements, and slag and metal yield for the smelter. Thisis combined with financial information to quantify the coststhat the slag producer will incur to produce different qualityslags.
Utilizing a higher TiO2 feedstock in the chlorinator resultsin less waste generation, lower treatment and disposal costs,and lower chlorine consumption, hence it results in a savingfor chloride pigment producers. However, producing a higherTiO2 slag results in increased reductant and energyrequirements, higher metal yield, and a lower slag yield. Thechlorinator VIU model and a smelter VIU model were used toquantify the savings realized by the chloride producers andthe extra costs incurred by the slag producer.
Smelter model assumptionsThe following assumptions were made in the smelter model(Burger et al., 2009):
➤ All feed materials enter the process at 25°C➤ Ilmenite feed composition from Tronox’s Hillendale
mine was used➤ Reductant from Zululand Anthracite Collieries was used
➤ Recovery factors, dust loss rates, dust analyses ,andcarbon contribution are derived from operatingexperience
➤ The carbon content of tapped iron is 2%➤ The carbon efficiency factor is 94.5%.
Smelter resultsThe results from the smelter VIU model are summarized inTable XIII. The base case was for the production of an 85%TiO2 slag. The results are expressed as the percentage changein various parameters when a 90% TiO2 slag is produced.Figure 4 is a waterfall graph that shows the increase in cost,expressed as a percentage of the slag price for a 85% TiO2slag, due to the increase in operational costs (i.e. electrodeconsumption, energy consumption, and reductant usage).The decrease in income due to the changes in slag and metalyield is shown as ‘pig iron income’ in Figure 4. The VIUcalculations indicate that slag producers will incur 13.5% costincrease in order to produce a 90% TiO2 slag using a conven-tional smelting process.
Chlorinator model assumptionsThe following assumptions were made in the chlorinatormodel:
➤ All feed materials enter the reactor at 25°C➤ Blow-over is determined by the elutriation constant,
which was determined experimentally for different sizefractions and different feedstocks
➤ Waste treatment includes neutralization of the wastewith lime
➤ Chlorinator operating temperature is 1000°C➤ The exit gas stream from the chlorinator is cooled to
200°C by liquid TiCl4 sprays (below the sublimationpoint of ferric chloride)
➤ The molar ratio of CO/CO2 in the gas product from thechlorination reactor is 1
➤ Price assumptions for the model are based on figuresobtained from a TZMI (2007).
Chlorinator model resultsIn the base case, only an 85% TiO2 slag is fed to thechlorinator. The percentage change in reagent consumptionand waste generation is reported in Table XIV for thealternative case, i.e. when only a 90% TiO2 slag is used in the
▲
392 MAY 2015 VOLUME 115 The Journal of The Southern African Institute of Mining and Metallurgy
Table XII
Variables used in blow-over and cyclone recovery calculations
Symbol Description Units
Fbor,i Blow-over recycle rate of solids from particle size class i kg/hFbo,i Blow-over rate of solids from particle size class i kg/hFin,i Total rate of particles fed into particle size class i kg/hKi* Elutriation constant for particles in size class i kg/s/m2
A Area of the chlorinator fluidized bed m2
i Index of the current particle size class for which calculations are madeFfeed,i Rate of particles from size class i in the feedstock stream kg/hXcr,i Fraction of particles from size class i removed in the cyclone and recycled to the chlorinatorFret,i Rate of particles in size class i retained in the fluid bed. This is the difference between the total input rate into a size class and the kg/h
rate of particles blown over from that size classri Average particle radius for particles in size class i µm

chlorinator. A negative value indicates that consumption islower with the 90% TiO2 feedstock.
Figure 5 is a waterfall graph that shows the monetarycontributions of coke, chlorine, logistics, and waste cost tothe increase/decrease in value of the 90% TiO2 feedstock. Thecontribution is expressed as a percentage of the 85% TiO2slag price (i.e. the base case). Chloride producers will utilizemore coke to chlorinate a higher TiO2 feedstock, thereforepetroleum coke will have the opposite effect of the chlorineand waste costs and reduce the value of the higher TiO2feedstock as indicated in Figure 5. The impact of increasedpetroleum coke consumption is, however, low compared tothe waste and chlorine savings. The overall VIU calculationsindicate that the pigment producer’s costs will be 9.2% lowerif a 90% TiO2 slag is utilized instead of an 85% TiO2 slag.
The study indicates that the cost of producing a high-grade slag outweighs the savings realized at the pigmentplant. However, although production of a higher TiO2 slag isnot viable based on the assumptions and prices used in themodel, this could alter as prices change, and the use of VIUmodels will enable the changes to be quickly assessed.
Example 2: relative feedstock valuesIn the second example, the relative value of an 86% TiO2feedstock is compared with a 95% TiO2 feedstock. Utilizing ahigher TiO2 feedstock in the chlorinator results in less wastegeneration, lower treatment costs, lower disposal costs, and
lower chlorine consumption, and hence results in a saving forchloride producers. The value of TiO2 feedstock containingmore TiO2 units should therefore be higher. The chlorinatormodel was used to determine the relative value of using atitania slag (86% TiO2) compared to a natural rutile productcontaining 95% TiO2 in the chlorination process, consideringthe major cost elements (i.e. the costs of petroleum coke,chlorine, waste disposal and waste treatment).
Model assumptions➤ Same as in Example 1➤ Price assumptions are based on figures obtained from a
TZMI (2012) and escalated to present-day prices.
Model resultsThe major results from the chlorinator VIU model areprovided in Table XV. In the base case, only an 86% TiO2slag is fed to the chlorinator. The percentage change inreagent consumption and waste generation is reported inTable XV for the alternative case, i.e. when only natural rutileis used.
With natural rutile, less waste is generated, and less limeand make-up chlorine is required, but coke consumptionincreases.
The waterfall graph (Figure 6) shows the monetarycontribution of coke, chlorine, and waste cost to theincrease/decrease in value of the natural rutile. The contri-
Value-in-use model for chlorination of titania feedstocks
The Journal of The Southern African Institute of Mining and Metallurgy VOLUME 115 MAY 2015 393 ▲
Table XIII
Summary of smelter VIU results (Burger et al.,2009)
Parameter (per ton ilmenite) Change from 85% to 90% TiO2 slag
Slag yield -5.5%Metal yield +7.2%Electrode consumption +3.1%Energy consumption +3.8%Reductant consumption +7.1%
Table XIV
Summary of chlorinator VIU results
Parameter Change from 85% to 90% TiO2 slag
Petroleum coke consumption +3%Chlorine gas consumption -7%Lime consumption for neutralization -24%Waste generated -24%
Figure 4 – Breakdown of smelting costs and income to produce high-grade slags (Burger et al., 2009)
Figure 5 – Breakdown of cost elements for the chlorination of a high-grade slag, corrected (Burger et al., 2009)

Value-in-use model for chlorination of titania feedstocks
bution is expressed as a percentage of the 86% TiO2 slagprice (i.e. the base case).
VIU calculations show that for the given set ofassumptions and prices, the value of natural rutile in thechlorinator is 6.7% higher than that of the slag. This islargely due to the chlorine costs, which account for 4.80% ofthe 6.7% change. In the Burger et al. (2009) study, thecontribution from waste treatment costs (Figure 5) was thehighest, but due to the decrease in waste treatment costs(TZMI, 2012), the chlorine costs are now the major costdriver.
Knowledge of the relative value of the feedstocks isimportant for suppliers to position themselves in the marketand understand the value of their feedstock.
ConclusionsModelling of the chlorination process facilitates the quickassessment of different feedstocks and provides valuableinsight into a process that feedstock producers normally donot have access to.
Although VIU models are a powerful-decision makingtool, care must be taken to ensure that the assumptions arevalid and are regularly updated.
References
BALE C. W., BÉLISLE, E., CHARTRAND, P., DECTEROV, S.A., ERIKSSON, G., HACK, K.,
JUNG, I. H., KANG, Y.B., MELANÇON, J., PELTON, A.D., ROBELIN, C., and
PETERSEN, S. 2009. FactSage thermochemical software and databases -
recent developments. Calphad, vol. 33. pp. 295–311. www.factsage.com
BURGER, H., BESSINGER, D., and MOODLEY, S. 2009. Technical considerations and
viability of higher titania slag feedstock for the chloride process. 7thInternational Heavy Minerals Conference, ‘What Next’. Champagne Sports
Resort, Drakensberg, South Africa, 20–23 September 2009. Southern
African Institute of Mining and Metallurgy, Johannesburg. pp. 187–194.
HAMOR, L. 1986. Titanium dioxide manufacture. Australia: A World Source ofIlmenite, Rutile, Monazite and Zircon Conference, Perth, Australia.
Australasian Institute of Mining and Metallurgy. pp. 143–146.
KOTZÉ, H., BESSINGER, D., and BEUKES, J. 2006. Ilmenite smelting at Ticor SA.
Southern African Pyrometallurgy Conference, Cradle of Humankind, South
Africa, 5–9 March 2006. Southern African Institute of Mining and
Metallurgy, Johannesburg. pp. 203–214.
LEE, R.F. 1991. Chloride route titanium dioxide pigments. Process and
properties. Fifth AusIMM Extractive Metallurgy Conference. Perth,
Australia, October 1991. Australasian Institute of Mining and Metallurgy.
pp. 35–38.
MOODLEY, S. 2011. A study of the chlorination behaviour of various titania
feedstocks. MSc thesis, University of the Witwatersrand, Johannesburg.
MOODLEY, S., KALE, A., BESSINGER, D., KUCUKKARAGOZ, C., and ERIC, R.H. 2012.
Fluidization behaviour of various titania feedstocks. Journal of theSouthern African Institute of Mining and Metallurgy, vol. 112, no. 6. pp.
467–471.
PETERSEN S. and HACK, K. 2007. The thermochemistry library ChemApp and its
applications. International Journal of Materials Research, vol. 98, no. 10.
pp. 935–945.
PISTORIUS, P.C. 2007. Ilmenite smelting: the basics. 6th International HeavyMinerals Conference ‘Back to Basics’, Hluhluwe, South Africa, 9–14
September 2007. Southern African Institute of Mining and Metallurgy,
Johannesburg. pp. 35–43.
STANAWAY, K.J. 1994a. A titanium pigment feedstock overview. SME AnnualMeeting, Albuquerque, New Mexico, 14–17 February 1994. pp. 1–6.
STANAWAY, K.J. 1994b. Overview of titanium dioxide feedstocks. MiningEngineering, vol. 46. pp. 1367–1370.
TZMI. 2007. Global TiO2 Pigment Producers - Comparative Cost and
Profitability Study. TZ Minerals International Pty Ltd, Victoria Park, WA,
Australia.
TZMI. 2012. Global TiO2 Pigment Producers - Comparative Cost and
Profitability Study. TZ Minerals International Pty Ltd, Victoria Park, WA,
Australia. ◆
▲
394 MAY 2015 VOLUME 115 The Journal of The Southern African Institute of Mining and Metallurgy
Table XV
Results from the chlorinator VIU model
Parameter Change from 86% to95% TiO2
slag
Petroleum coke consumption +12%Chlorine gas consumption -73%Lime consumption for neutralization -67%Waste generated -67%
Figure 6 – Breakdown of cost elements in the chlorinator for 86% TiO2
slag and natural rutile