Value for customers and value for investors - SSE...
21
Value for customers and value for investors
Transcript of Value for customers and value for investors - SSE...
Value for customers and value for investors

Alistair Phillips-Davies Chief Executive
2
Topics for today Simplifying our business and securing efficiencies through a value programme GA Focusing on value in investment decision-making, including offshore wind GA Easing the burden on bill-payers through our price freeze to 2016 APD Demonstrating our appetite for reform and our commitment to having a voice in the debate around UK energy markets and policy APD

Today is about all of SSE’s stakeholders
3
•Provide energy people need in a reliable and sustainable way
Core purpose
•Deliver efficient operation of, and investment in, a balanced range of businesses
Strategy
• Increase annually the dividend by at least RPI inflation
Financial objective
Customers
Politicians Regulators
Investors Employees
Setting a positive agenda
Addressing concerns

The GB energy debate has changed
4
2008 2014 Carbon
reduction
Carbon reduction
Affordability
Affordability Security of
supply Security of
supply
Constructive engagement - SSE is part of the solution

5
Gregor Alexander Finance Director
Topics for today Simplifying our business and securing efficiencies through a value programme GA Focusing on value in investment decision-making, including offshore wind GA Easing the burden on bill-payers through our price freeze to 2016 APD Demonstrating our appetite for reform and our commitment to having a voice in the debate around UK energy markets and policy APD

2013/14 results set to be in line with expectations*
6
2013/14 outlook *
Dividend up by around 3% (nominal)
Adjusted EPS up by between 2-4%
Adjusted PBT up around 9%
Capex over £1.5bn
Net Debt to increase to £7.8bn
Retail operating profit *
Down by around 25%
Higher wholesale costs and lower energy consumption
Wholesale operating profit *
Up by around 20% Mainly due to April 2013 E&P acquisition and higher renewables output
Networks operating profit *
Up by around 10%
Mainly due to capital investment in Transmission
* Forecast; comparisons with 2012/13

Building on SSE’s track record of efficiency
7
99.3%
102.4% 102.4%
106.9%
113.7% 123.5%
*Based on Ofgem’s assessment of July 13 ED1 business plans. 100% being target efficiency
Networks * Retail**
**SSE assessment based on data published in Consolidated Segmental Statements year ended Dec 12 & Mar 13
£0
£50
£100
Gas Electricity
Industry Average SSE
SSE 21% lower
SSE 28% lower
Cost to serve domestic customers Efficiency assessment
Operational and financial discipline remain important

A value programme to ensure effective use of people and capital
8
Identified businesses not core to future plans
Identified businesses which result in a disproportionate financial burden
Identified opportunities to recycle capital
Expected financial benefit £1bn (proceeds received/ debt reduction)
SIMPLIFICATION
Day to day benefits of simplification
Focus on what’s important
Reduction of around 500 jobs across the businesses on previous plan
Expected £100m annual saving in overheads by March 2016
EFFICIENCY

Focusing on value in capital expenditure: Offshore wind development
9
• Limited support for offshore wind under Levy Control Framework
• Construction costs have not reduced proportionately
Cost and risks of development remain high
• Near term focus on up to 375MW at Beatrice
• Work with partners on other projects to secure value
Reduce offshore development portfolio
• 350MW offshore wind in operation
Assets in operation performing well

Focusing on value in capital expenditure: 2014/15
10
Committed • Regulated networks
• Completion of wholesale projects in construction
• Wholesale maintenance
• Other committed spend
Expected • Caithness Moray project
Uncommitted • ROCable onshore wind
• Other discretionary spend
0
300
600
900
1200
1500
1800
Mar-2015
Forecast capex
Committed Expected Uncommitted
56% 30%
5% 9%
Forecast capex split
Networks Wholesale Retail Other

Focusing on value in capital expenditure: Future plans
11
Average net capex in the three years to March 18 expected to comprise:
Committed • Regulated networks
• Completion of wholesale projects in construction
• Wholesale maintenance
• Other committed spend
Expected • Caithness Moray project
Uncommitted • ROCable onshore wind
• Other discretionary spend
Disposals • Non-core assets and businesses
• ‘Re-cycling ‘ onshore wind
Net capex up to £1.3bn per annum
0
300
600
900
1200
1500
1800
Gross capex Disposals Net capex
Average net capex * 3 years to March 18
Committed Expected Uncommitted
Disposals Net capex
* Forecast

Focusing on value in capital expenditure: ‘Recycling’ and sale of non-core assets
12
Sale of non-core assets
Street-lighting
SSE Pipelines
Target £1bn proceeds and net debt reduction from disposal of assets and businesses
Discipline around the balance sheet and capital constraint
Over 1,800 MW* of wind in operation
390 MW** in construction & pre-
construction
Over 300 MW** consented
SSE’s Wind Portfolio
• Disposals of street lighting PFI contracts will reduce debt
SSE has:
• Expertise in developing and building onshore wind
• Portfolio of ROCable developments
• Demonstrated value through Greencoat transaction
Disposals
*on and offshore ** onshore only

Financial discipline for strong foundations
13
Four key steps
• Reduction in net capex
• Reduction in offshore wind development
• Renewed focus on operational efficiencies
• Drive to simplify and streamline the business
36%
53%
6%
4%
Last 4 years capex
Networks
Wholesale
Retail
Other
61% 25%
7%
7%
Next 4 years capex*
Networks
Wholesale
Retail
Other
* Forecast net capex
Lower risk investments and re-balancing the business

Alistair Phillips-Davies Chief Executive
14
Topics for today Simplifying our business and securing efficiencies through a value programme GA Focusing on value in investment decision-making, including offshore wind GA Easing the burden on bill-payers through our price freeze to 2016 APD Demonstrating our appetite for reform and our commitment to having a voice in the debate around UK energy markets and policy APD

Easing the burden on energy bill payers Making a difference to customers and creating opportunity to influence the energy debate
15
Government can help
Move environmental and social costs to tax
Price freeze could be extended
Helps customers
Price freeze
Price freeze until 2016
Lower Retail margins
Working with politicians and regulators

Demonstrating SSE’s appetite for reform
16
Energy industry is complex
Reform that is in the interest of customers
Trade all electricity on
external exchange
Free credit commitment for small suppliers
Customer Service Guarantee
End of cold calling
Wholesale/Retail legal separation

A strong business with the essential features
SSE has:
•a balanced range of businesses;
• clear geographical focus in GB and Ireland;
•operational and investment efficiency; and
• strong financial management.
Our job:
•deliver the best possible service for customers;
•maintain and build the right assets for the future energy needs of the country; and
•pay dividends to the shareholders who invest in SSE.
17
0
200
400
600
800
1000
1200
1400
1600
1800
2000
2005 2006 2007 2008 2009 2010 2011 2012 2013
Economically-regulated Market-based
Balanced operating profit £m (FY)
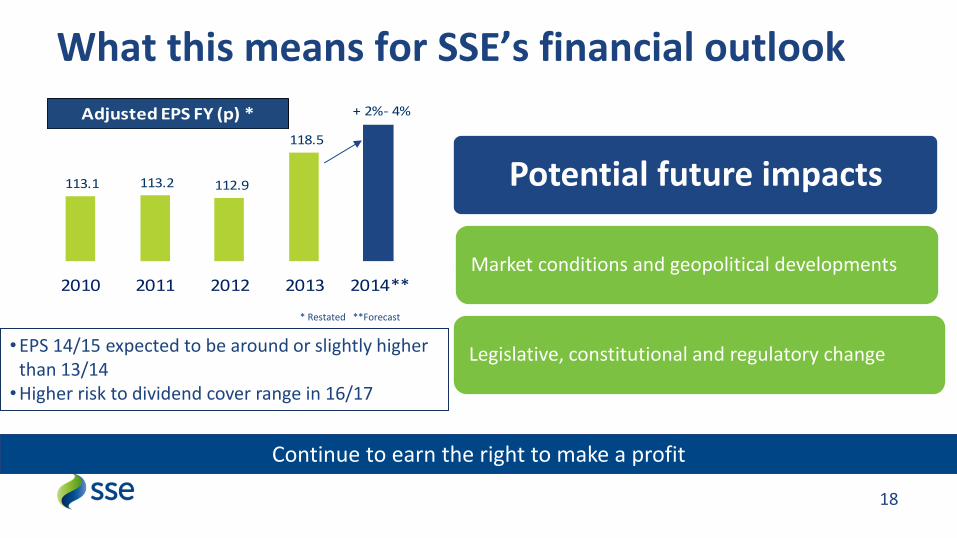
What this means for SSE’s financial outlook
18
•EPS 14/15 expected to be around or slightly higher than 13/14 •Higher risk to dividend cover range in 16/17
113.1 113.2 112.9
118.5
+ 2%- 4%
2010 2011 2012 2013 2014**
Adjusted EPS FY (p) *
* Restated **Forecast
Potential future impacts
Market conditions and geopolitical developments
Legislative, constitutional and regulatory change
Continue to earn the right to make a profit

Deliver dividend growth over the long term
• Acting in the best interest of all stakeholders for the long term
The energy debate has changed
• Annual dividend increases of at least RPI inflation targeted
Giving shareholders a return on their investment
19
66.0 70.0 75.0
80.1 84.2
2009 2010 2011 2012 2013 2014*
RPI
1.57 1.57 1.5 1.41 1.4
2009 2010 2011 2012 2013
Dividend cover FY
Dividend per share FY (p)
84.2p + 3%
* Forecast

A positive practical approach to deliver dividend growth
20
25.7 27.5 30.0
32.4 35.0
37.7 42.5
46.5
55.0
60.5
66.0 70.0
75.0 80.1
84.2
1999 2000 2001 2002 2003 2004 2005 2006 2007 2008 2009 2010 2011 2012 2013 2014*
RPI +
*forecast
84.2p + 3%
Still targeting dividend growth
Dividend Per Share FY (p)

Value for customers and value for investors
Q and A
21