VALUE FOCUS - Mercer Capitalmercercapital.com › assets › Mercer-Capital_2014-Q1... · The...
19
VALUE FOCUS FOOD AND BEVERAGE Q1: Non-Alcoholic Beverages Q2: Alcoholic Beverages Q3: Food Processing Q4: Fast Food & Casual Restaurants 2014
Transcript of VALUE FOCUS - Mercer Capitalmercercapital.com › assets › Mercer-Capital_2014-Q1... · The...

VALUE FOCUSFOOD AND BEVERAGE
Q1: Non-Alcoholic BeveragesQ2: Alcoholic BeveragesQ3: Food ProcessingQ4: Fast Food & Casual Restaurants
2014

© 2014 Mercer Capital 1 www.mercercapital.com
Segment Focus
2014 First Quarter
Non-Alcoholic Beverages
BUSINESS VALUATION & FINANCIAL ADVISORY SERVICES
The non-alcoholic beverage industry is characterized by innovation and major shifts in beverage trends. For example, bottled water sales
may soon overtake carbonated soft drinks (“CSDs”) in terms of volume based on current growth rates. In 2013, CSDs continued to struggle
amidst negative consumption trends, necessitating healthier product offerings from CSD producers. As a whole, fruit juice consumption
continues to fall while RTD tea and coffee maintain positive volume growth.1
Sugar and corn are major inputs the industry. The price of corn decreased during the latter part of 2013 and is expected to continue
decreasing in 2014, while the price of sugar is expected to increase in 2014. Input prices for beverage packaging also greatly affect industry
profitability. Aluminum prices have been volatile in recent years and the price of plastic has steadily risen.2 For beverage distributors across
the industry, customized software for route optimization and intensive data collection are low-hanging fruit when it comes to managing
fuel costs.3
While Coca-Cola, Dr. Pepper Snapple,
and Monster all struggled to make year-
over-year gains in the market, PepsiCo
enjoyed an 8.5% increase in part due its
portfolio diversification outside of CSDs
and its growing presence in international
markets.
Although Starbucks shares enjoyed a
31% increase year-over-year, at the end
of the first quarter, shares were down
6.0% from year-end 2013, in part due
to rising coffee prices and difficulty with
this year’s Brazilian coffee crop. National
Beverage saw a 39% annual increase
amid speculation that the company
or its LaCroix brand could be sold to
Coca-Cola.
Public Company Performance
-100%
0%
100%
200%
300%
400%
500%
600%
700%
800%
3/31/09 9/30/09 3/31/10 9/30/10 3/31/11 9/30/11 3/31/12 9/30/12 3/31/13 9/30/13 3/31/14
PepsiCo The Coca- Cola Co. Dr. Pepper Snapple Group Inc. Monster Beverage Corp. National Beverage Corp. Starbucks Corp.
5 Year Change in Stock Prices for Publicly Traded Non-Alcoholic Beverages

Mercer Capital’s Value Focus: Food and Beverage Industry First Quarter 2014
© 2014 Mercer Capital 2 www.mercercapital.com
According to Bloomberg, the non-alcoholic beverage industry had
63 pending or completed deals with an average value of $27 million
between March 31, 2013 and 2014. Deal volume is up 18.9% from
the previous twelve months when the industry had 53 deals with an
average value of $22.6 million.
Major recent transactions include Coca-Cola’s 10% interest in Green
Mountain Coffee Roasters. Coca-Cola’s acquisition comes as Green
Mountain is expected to expand its popular Keurig coffeemakers into
cold beverages.
Merger and Acquisitions
Acquirer Target Date Consideration Price/
RevenuePrice/
EBITDA
The Coca-Cola Company Green Mountain Coffee Roasters
2/27/14 $1.25 billion 2.84x 12x
Crestview Partners LP DS Waters of America Inc. 9/3/13 $920 million na na
Post Holdings Premier Nutrition Corpora-tion
9/1/13 $180 million na na
Source: Bloomberg
Non-Alcoholic Beverage Transactions

Mercer Capital’s Value Focus: Food and Beverage Industry First Quarter 2014
© 2014 Mercer Capital // Chart Data Source: Beverage World 3 www.mercercapital.com
Soda (CSDs)
According to Beverage World’s most
recent industry report, CSDs have expe-
rienced eight straight years of volume
and sales declines in the US, largely
due to changing consumer tastes and
continued negative publicity. Mid- cal-
orie offerings are the only CSDs that
exhibit more positive performance.
Pepsi’s, “Pepsi Next” sold 24 million
cases in 2012 and accounted for roughly
1% of Pepsi’s total volume. Coke has
also entered the market with mid-calorie
Sprite and Fanta offerings, but its most
successful product continues to be Coke
Zero with 8% sales growth in 2012.4
While CSDs still maintain the largest
market share within the non-alcoholic
beverage sector, continuous volume
and sales loss threatens their position.
In order to combat poor performance,
the industry is expected to adopt new
technology such as hybrid palletizing
and hot-fill technology for PET bottles
as a means of improving efficiency and
minimizing cost.5
New alternative sweeteners the at-home
carbonation trend may be ways to
increase CSD consumption. Home car-
bonation system manufacturer Soda-
Stream reported an uptick in first quarter
revenues in comparison to the prior year
and PepsiCo and Coca-Cola have both
entered partnerships with similar com-
panies in hopes of making their prod-
ucts accessible via home carbonation
systems in 2014.6
U.S. CSD Volume (Billions of Gallons)
U.S. CSD Brand Market Share
12,500
13,000
13,500
14,000
14,500
15,000
2007 2008 2009 2010 2011 2012
Source: State of the Beverage Market 2013, Beverage World
17.5%
9.9%
9.7%
7.2%
6.7% 5.9%
4.6%
2.5%
2.1%
1.9%
32.1%
Coca-‐ Cola
Diet Coke
Pepsi
Mountain Dew
Dr. Pepper
Sprite
Diet Pepsi
Coke Zero
Diet Mountain Dew
Diet Dr. Pepper
Others
Source: State of the Beverage Market 2013, Beverage World
Mercer Capital’s Value Focus: Food and Beverage Industry First Quarter 2014
© 2014 Mercer Capital // Chart Data Source: Beverage World 4 www.mercercapital.com
Bottled Water
The bottled water segment greatly bene-
fited from shifting consumer preferences
and industry efforts to implement “light
weight” bottles in 2013. In the past the in-
dustry was plagued by environment con-
cerns about the amount of plastic used in
bottles; however, through extensive effort
the average water bottle now weighs less
than 9 grams, ultimately lowering produc-
tion costs and overall reliance on resin.7
According to Beverage World’s most
recent industry report, bottled water vol-
ume sales were up nearly 6% annually.
In addition to increasing sales volumes,
the industry has also increased profitabil-
ity by controlling supply chain cost, using
high speed manufacturing lines, and ex-
panding private label production. More-
over, bottled water’s competitive pricing
has driven sales increases by making it
very affordable for consumers.
While private labels continue to make up
the majority of sales in the market, Da-
none grew its market share in 2013 and
Coca-Cola continues to defend its mar-
ket share through its Dasani, smartwater,
and vitaminwater brands.
U.S. Bottled Water Volume (Millions of Gallons)
Leading Brands
Brand2012 Sales
(in Millions)
Private Label $1,634.1
Nestle Pure Life $939.3
Dasani $900.9
Aquafina $896.0
Glaceau Vitaminwater $677.9
Poland Springs $557.9
Glaceau Smartwater $487.4
Deer Park $411.2
Ozarka $320.9
Glaceau Vitaminwater Zero $255.2
Others 63.00
*Coca-Cola owns smartwater/vitaminwater
Source: Beverage World via Symphony IRI Group
Company
7,800
8,000
8,200
8,400
8,600
8,800
9,000
9,200
9,400
9,600
9,800
2007 2008 2009 2010 2011 2012
Source: State of the Beverage Market 2013, Beverage World

Mercer Capital’s Value Focus: Food and Beverage Industry First Quarter 2014
© 2014 Mercer Capital 5 www.mercercapital.com
Bottled Water (continued)
Bottled Water Global Market Share (%)
Company 2013 2012 2011 2010 2009 2008
Danone 10.27 10.05 10.09 10.01 9.74 10.85
Coca-Cola Co/The 7.66 7.72 7.63 7.50 7.74 7.40
Nestle SA 7.28 7.63 7.88 8.20 8.12 8.41
PepsiCo Inc 3.59 3.69 3.77 3.75 3.76 4.16
Ting Hsin International Group 1.77 1.58 1.64 1.56 1.29 1.09
Hangzhou Yangshengtang Co Ltd 1.68 1.56 1.39 1.19 1.11 1.03
Hangzhou Wahaha Group Co Ltd 1.24 1.28 1.28 1.28 1.19 na
Acqua Minerale San Benedetto S 1.25 1.30 1.33 1.30 1.39 1.50
China Resources Enterprise Ltd 1.12 0.92 0.74 0.59 0.51 0.46
Bisleri International Pvt Ltd 1.12 0.96 0.86 0.77 0.70 0.59
Others 63.00 63.32 63.40 63.87 64.47 64.51
Source: Bloomberg

Mercer Capital’s Value Focus: Food and Beverage Industry First Quarter 2014
© 2014 Mercer Capital // Chart Data Source: Beverage World 6 www.mercercapital.com
Energy Drinks
The energy drink segment saw a 14% in-
crease in volume sales in the most recent
year, highlighting the continued recent
success within the segment. Despite the
increase in volume sales, this number is
lower than previous years’ growth, sug-
gesting that the market is quickly becom-
ing highly saturated.
New product innovation was a staple of
the segment between 2007 and 2009
and served to widen the scope of the
segment’s target consumer.8 However,
according to Beverage World’s 2013 in-
dustry report, the past year had the sec-
ond fewest new product innovations in
the last six years. Moreover, FDA pres-
sures with respect to caffeine content
and ingredient claims may have slowed
industry growth.
Overall, continued FDA scrutiny and a
potentially saturated market are expect-
ed to slow growth in the segment over the
coming years.
U.S. Energy Drink Volume (Millions of Gallons)
Leading Brands
Brand2012 Sales
(in Millions)
Red Bull $3,182.5
Monster $1,884.9
Monster Rehab $409.9
Rockstar $324.9
NOS $264.2
Java Monster $251.2
Monster Mega $231.7
AMP Energy $184.0
Red Bull Total Zero $147.3
Rockstar Sugar Free $144.2
Others 63.00
Source: Beverage World via Symphony IRI Group
US Energy Drink Volume
0
100
200
300
400
500
600
2006 2007 2008 2009 2010 2011 2012
Source: State of the Beverage Market 2013, Beverage World

Mercer Capital’s Value Focus: Food and Beverage Industry First Quarter 2014
© 2014 Mercer Capital 7 www.mercercapital.com
Top 10 Brands Global Market Share (%)
Company 2013 2012 2011 2010 2009 2008
PepsiCo Inc 30.80 31.64 33.38 33.11 35.03 36.82
Coca-Cola Co/The 17.94 18.41 18.51 19.21 17.69 18.42
Red Bull GmbH 6.81 6.62 6.22 5.90 5.82 5.59
Otsuka Holdings Co Ltd 5.43 5.26 5.38 5.86 5.91 5.73
Monster Beverage Corp 5.23 4.93 3.86 3.29 2.88 2.14
TC Pharmaceutical Industries C 4.56 4.05 3.78 3.08 2.73 2.58
Suntory Holdings Ltd 2.98 0.90 0.95 1.04 1.30 na
Uni-President Enterprises Corp 1.90 1.80 1.77 1.75 1.50 1.46
Rockstar Inc 1.76 1.79 1.61 1.37 1.32 1.33
Thai Beverage PCL 1.34 0.08 0.08 0.09 0.09 0.05
Others 21.24 24.53 24.47 25.30 25.74 25.90
Source: Bloomberg
Energy Drinks (continued)

Mercer Capital’s Value Focus: Food and Beverage Industry First Quarter 2014
© 2014 Mercer Capital 8 www.mercercapital.com
RTD Coffee and Tea
Tea
In 2012, RTD tea experienced another
period of modest growth as volume sales
grew almost 5%. RTD tea has enjoyed
this consistent growth pattern in the last
few years thanks to its perceived health
status and low calorie offerings.
Going forward however, experts think that
RTD tea growth will likely slow as RTD
coffee provides additional competition.9
For example, in 2013 PepsiCo launched
its Starbucks-branded low calorie iced
coffee line, adding more options to the
growing RTD tea and coffee segment.10
Coffee
Within the RTD coffee segment,
Starbucks branded products remain
the leader in the U.S. The segment is
experiencing a resurgence in popularity,
reporting double-digit gains for the first
time since 2007.11 Near-term profitability
for RTD coffee beverages may be limited
due to continued increases in the coffee
prices. The price of Brazilian Arabica
soared to $1.75 per pound, up 74%
since year-end due to drought in Brazil
and concerns about the size of the 2015
crop.12
U.S. RTD Tea Volume (Millions of Gallons)
CompanyTing Hsin International GroupUni-President Enterprises CorpUnilever NVCoca-Cola Co/The
0
200
400
600
800
1,000
1,200
2006 2007 2008 2009 2010 2011 2012
Source: Beverage World
Starbucks
Brand Market Share (%) 2012 Sales (in Millions)
Starbucks Frappuccino Cappuccino 61.1 $763.5
Starbucks Doubleshot Cappuccino 28.3 $353.5
Starbucks 5.9 $73.8
Starbucks Frappuccino Light 2.1 $25.8
Starbucks Doubleshot Light 0.8 $10.1
Other 1.8 na
Source: Beverage Industry and Information Resources Inc.

Mercer Capital’s Value Focus: Food and Beverage Industry First Quarter 2014
© 2014 Mercer Capital 9 www.mercercapital.com
RTD Tea Global Market Share (%)
Company 2013 2012 2011 2010 2009 2008
Ting Hsin International Group 10.86 9.75 14.16 15.02 11.82 9.58
Uni-President Enterprises Corp 7.76 7.01 6.02 5.70 5.00 5.36
Unilever NV 6.47 6.90 6.94 7.39 7.68 8.08
Coca-Cola Co/The 6.44 6.68 6.71 6.65 7.54 8.24
The JDB Group 6.19 5.95 na na na na
Ito En Ltd 4.99 5.38 5.02 4.95 5.02 5.31
Suntory Holdings Ltd 4.59 4.87 5.08 5.25 5.45 5.79
Nestle SA 3.70 4.03 4.43 4.42 4.88 5.29
Guangzhou Pharmaceutical Holdings 3.06 1.31 4.96 4.59 4.42 4.51
Kirin Holdings Co Ltd 2.90 3.16 3.22 3.27 3.49 3.83
Others 43.05 44.95 43.46 42.75 44.71 44.01
Source: Bloomberg
RTD Coffee and Tea (continued)

Mercer Capital’s Value Focus: Food and Beverage Industry First Quarter 2014
© 2014 Mercer Capital 10 www.mercercapital.com
Fruit and Sports Drinks
Based on the most recent data from
Beverage World, sports drink volume
sales were up 2.3% annually due to the
success attributed to revamping the Ga-
torade brand and expanding low calorie
Powerade options. Gatorade continues
to dominate the market, controlling over
half the segment’s market share. The
future of the sports drinks segment will
likely continue to be defined by Gatorade
and Powerade as well as numerous small
volume, premium priced brands.13
On the other end of the market, fruit
drinks continued to decline in both sales
and volume, recently losing over 4% of
total non-alcoholic beverage market
share. The segment is largely affected
by the same growing health concerns
that push CSD drinkers towards other
products, including concerns about the
amount of sugar and caloric content.14
Leading Brands
Brand2012 Sales
(in Millions)
Gatorade G Series Perform $2,765.4
Powerade Ion4 $878.1
Gatorade G2 Perform $515.7
Gatorade $408.3
Powerade Zero $233.8
G2 $143.9
Gatorade Frost $105.7
Gatorade Cool Blue $68.8
Gatorade Fierce $66.1
Gatorade All Stars $56.1
Others 63.00
Source: State of the Beverage Market 2013, Beverage World
RTD Tea Global Market Share (%)
Company 2013 2012 2011 2010 2009 2008
Ting Hsin International Group 10.86 9.75 14.16 15.02 11.82 9.58
Uni-President Enterprises Corp 7.76 7.01 6.02 5.70 5.00 5.36
Unilever NV 6.47 6.90 6.94 7.39 7.68 8.08
Coca-Cola Co/The 6.44 6.68 6.71 6.65 7.54 8.24
The JDB Group 6.19 5.95 na na na na
Ito En Ltd 4.99 5.38 5.02 4.95 5.02 5.31
Suntory Holdings Ltd 4.59 4.87 5.08 5.25 5.45 5.79
Nestle SA 3.70 4.03 4.43 4.42 4.88 5.29
Guangzhou Pharmaceutical Holdings 3.06 1.31 4.96 4.59 4.42 4.51
Kirin Holdings Co Ltd 2.90 3.16 3.22 3.27 3.49 3.83
Others 43.05 44.95 43.46 42.75 44.71 44.01
Source: Bloomberg

Mercer Capital’s Value Focus: Food and Beverage Industry First Quarter 2014
© 2014 Mercer Capital 11 www.mercercapital.com
Food and beverage companies generally outperformed the market
in first quarter 2014. While the S&P 500 was up 1.3% from year-end
2013, food processing companies were up 1.6% and beverage com-
panies were up 5.5% (as measured by the Bloomberg Global Food
and Beverage Indices respectively). Beverage multiples continued to
expand during the first quarter along with an 18.9% increase in M&A
activity compared to the prior year.
Shares for Hillshire Brands increased 11% this quarter as both Tyson
Foods and Pilgrim’s Pride made bids for the company. Despite head-
winds in the carbonated soft drink sector and relatively flat sales,
Dr. Pepper Snapple Group was able to report a 46% increase in Q1
earnings in comparison to the prior year as the company benefited
from lower commodity prices and decreased spending on labor and
marketing, emphasizing the importance of cost controls for major
CSD producers. Consensus estimates for consumer staples in 2014
reflect decreasing expectations with earnings estimated to grow
5.1% (down from 5.8% at year-end 2013) and revenues estimated to
decreased by 6.5%.15
For restaurants, March brought positive results after severe weather
deterred consumers throughout the winter. 55% of restaurant opera-
tors surveyed reported same-store gains in March and 46% reported
an increase in traffic. 49% of operators expected to see an increase
in sales in the next six months, the highest level reported in nearly
two years.16
General Food & Beverage Overview
1 “State of the Beverage Market 2013,” Beverage World, May 2013. 2 “Soda Production in the US,” IBISWorld, June 2014.3 “Fleet managers turn to route optimization to cut delivery costs,”
Beverage Industry. May 2014.4 “State of the Beverage Market 2013,” Beverage World, May 2013. 5 “Soda Production in the US,” IBISWorld, June 2014.6 “Carbonated Soft Drinks Face Challenges And Critical Partnership
Decisions,” Seeking Alpha, April 2014.7 “State of the Beverage Market 2013,” Beverage World, May 2013. 8 Ibid.9 Ibid.10 “Starbucks Launches New Iced Coffee Line,” BevNet, Online,
Available http://www.bevnet.com/news/2013/starbucks-launches-
new-iced-coffee-line, Accessed July 23, 2014.
11 “2014 State of the Industry: Coffee and RTD Coffee,” Beverage
Industry. Online. Available http://www.bevindustry.com/arti
cles/87615-state-of-the-industry-coffee-and-rtd-coffee.12 ICO Indicator Prices. Online. Available, http://www.ico.org/prices/
p2.htm.13 “State of the Beverage Market 2013,” Beverage World, May 2013. 14 Ibid.15 “Can Consumer Staples Rebound?” Zacks, Online, Available
http://www.zacks.com/commentary/32930/can-consumer-sta
ples-rebound.16 “Restaurant sales, traffic rebound in March,” Nation’s Restaurant
News, Online, Available http://nrn.com/rpi/nra-restaurant-sales-
traffic-rebound-march.
References and Data Sources
Mercer Capital’s Value Focus: Food and Beverage Industry First Quarter 2014
© 2014 Mercer Capital // Data Source: Bloomberg 12 www.mercercapital.com
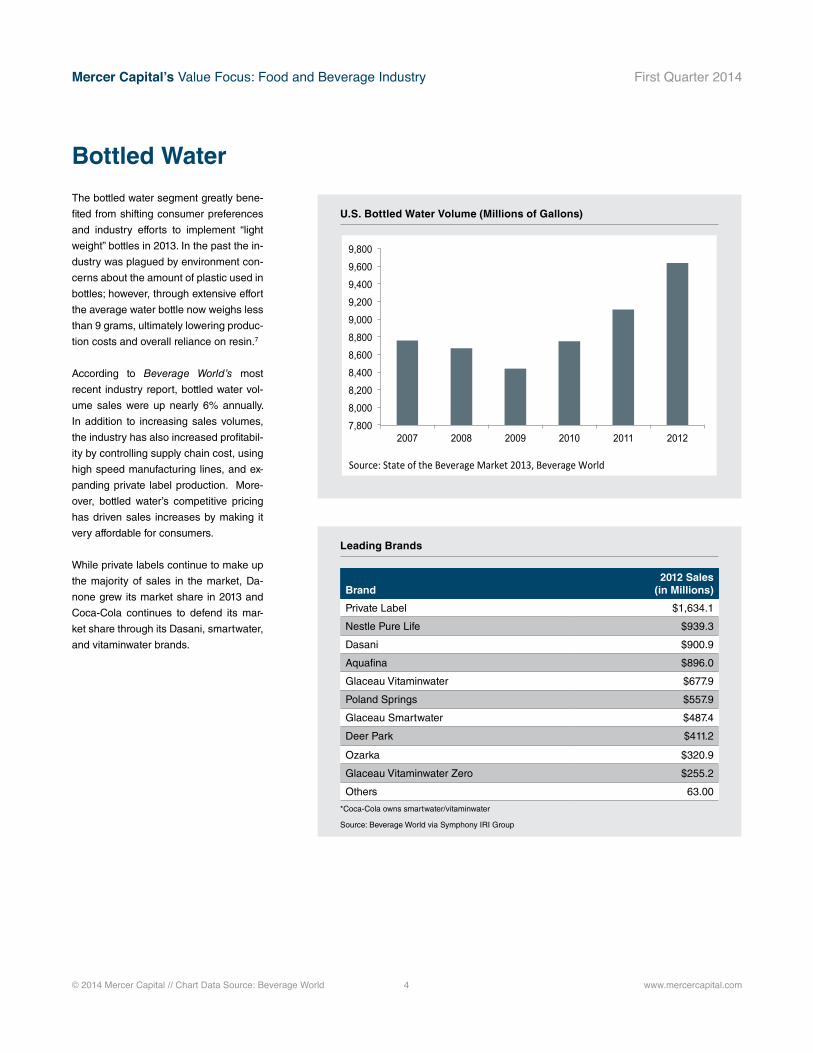
Change in Bloomberg Global Food Index vs. S&P 500
-10%
0%
10%
20%
30%
40%
50%
60%
70%
80%
90%
9/30/09 3/31/10 9/30/10 3/31/11 9/30/11 3/31/12 9/30/12 3/31/13 9/30/13 3/31/14
Bloomberg Food Index S&P 500
9.99
7.31 7.69 8.3 9.3 9.69
12.44 12.1
2007 2008 2009 2010 2011 2012 2013 Q1 2014
Change in Bloomberg Global Food Index vs. S&P 500
Historical EV/EBITDA Multiple for Global Food Index
Examples of companies in Bloomberg’s Global Food Index include Grupo Bimbo, Kikkoman, ConAgra Foods, Hillshire Brands, Tyson Foods,
General Mills, Diamond Foods, Sanderson Farms, Kellogg, Nestle, and Hormel Food Corp.

Mercer Capital’s Value Focus: Food and Beverage Industry First Quarter 2014
© 2014 Mercer Capital // Data Source: Bloomberg 13 www.mercercapital.com
Examples of companies in Bloomberg’s Global Food Index include Grupo Bimbo, Kikkoman, ConAgra Foods, Hillshire Brands, Tyson Foods,
General Mills, Diamond Foods, Sanderson Farms, Kellogg, Nestle, and Hormel Food Corp.
-20%
0%
20%
40%
60%
80%
100%
120%
140%
9/30/09 3/31/10 9/30/10 3/31/11 9/30/11 3/31/12 9/30/12 3/31/13 9/30/13 3/31/14
Bloomberg Beverage Index S&P 500
Historical EV / EBITDA MultipleBloomberg Beverage Index
8.51 9.57
10.96 10.29 10.81 11.44 11.85
2008 2009 2010 2011 2012 2013 Q1 2014
Change in Bloomberg Beverage Index vs. S&P 500
Historical EV/EBITDA Multiple for Beverage Index
© 2014 Mercer Capital // www.mercercapital.com 14
Mercer Capital’s Value Focus: Food and Beverage Industry First Quarter 2014
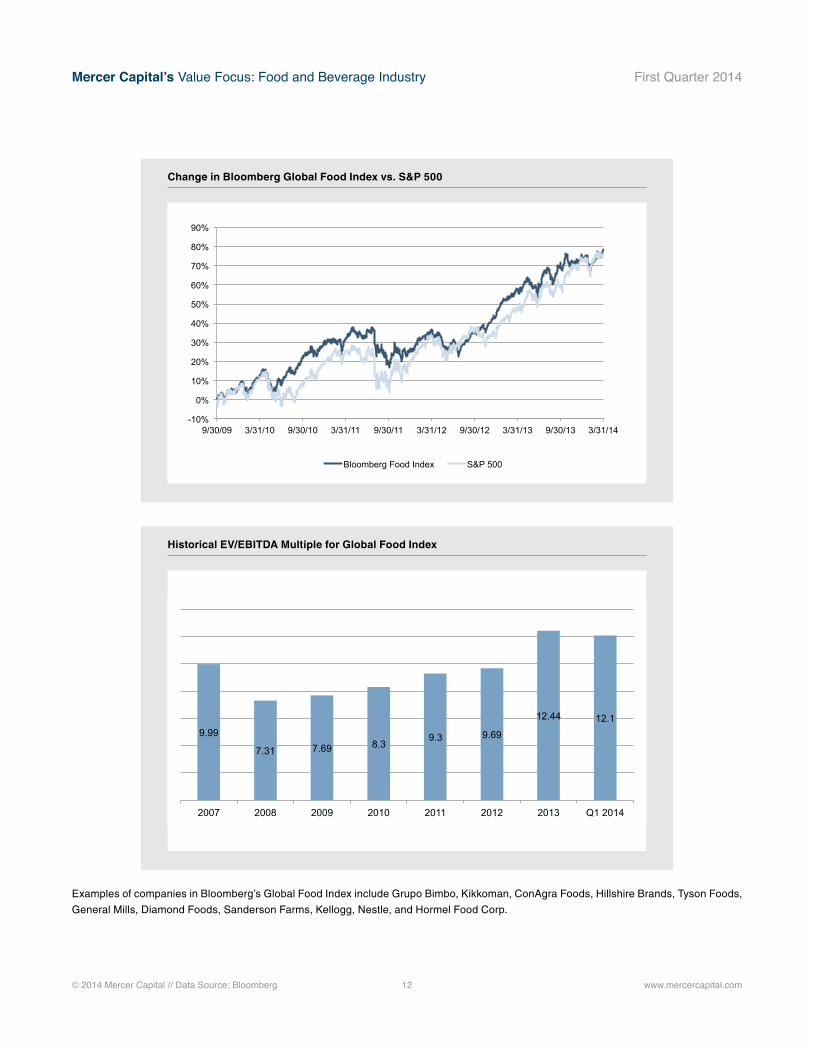
Appendix A: Public Company Performance & Pricing
Food Processors
Food Processors TickerPrice at 3/31/14
High Price
3/31/14
% of High
3/31/14EV/
RevenueEV/
EBITDA Enterprise
Value LTM
RevenueLTM
EBITDA
Forward Revenue YE 2014
Forward EBITDA YE 2014
Revenue Growth
(from LTM)
EBITDA Growth
(from LTM)
PepsiCo Inc PEP $83.50 $86.80 96.2% 2.4 12.7 158,949.5 66,457.0 12,498.0 67,133.1 12,968.7 1.0% 3.8%
ConAgra Foods Inc CAG $31.03 $37.28 83.2% 1.3 10.7 22,559.8 17,868.7 2,111.7 17,719.8 2,348.5 -0.8% 11.2%
Grupo Bimbo SAB de CV GRBMF $35.24 $45.80 76.9% 1.2 13.2 203,591.4 176,887.2 15,395.0 190,010.6 19,786.1 7.4% 28.5%
Tyson Foods Inc TSN $44.01 $34.38 128.0% 0.5 8.2 17,299.5 35,418.0 2,122.0 37,340.1 2,162.0 5.4% 1.9%
Hormel Foods Corp HRL $49.27 $46.18 106.7% 1.5 13.9 13,253.7 8,878.1 956.3 9,279.6 1,045.4 4.5% 9.3%
Sanderson Farms Inc SAFM $78.49 $75.53 103.9% 0.7 5.6 1,850.2 2,672.1 330.4 2,781.3 448.0 4.1% 35.6%
Darden Restaurants Inc DRI $50.76 $55.25 91.9% 1.2 11.3 9,426.9 8,033.9 837.5 8,780.2 945.8 9.3% 12.9%
Unilever NV UN $41.12 $42.99 95.7% 2.6 14.8 128,082.8 49,797.0 8,668.0 50,224.6 8,365.6 0.9% -3.5%
Nestle SA NESN $66.55 $69.50 95.8% 2.5 13.0 234,030.8 92,373.0 17,936.0 92,233.9 17,495.0 -0.2% -2.5%
Average $53.33 $54.86 97.6% 1.5 11.5 87,671.6 50,931.7 6,761.7 52,833.7 7,285.0 3.5% 10.8%
Median $49.27 $46.18 95.8% 1.3 12.7 22,559.8 35,418.0 2,122.0 37,340.1 2,348.5 4.1% 9.3%
Source: Bloomberg

© 2014 Mercer Capital // www.mercercapital.com 15
Mercer Capital’s Value Focus: Food and Beverage Industry First Quarter 2014
Appendix A: Public Company Performance & Pricing
Restaurants
Restaurants TickerPrice at 3/31/14
High Price
3/31/14
% of High
3/31/14EV/
RevenueEV/
EBITDA Enterprise
Value LTM
RevenueLTM
EBITDA
Forward Revenue YE 2014
Forward EBITDA YE 2014
Revenue Growth
(from LTM)
EBITDA Growth
(from LTM)
Frisch's Restaurants Inc FRS $23.67 $26.44 89.5% 0.7 6.3 133.4 204.4 21.0 206.0 na 0.8% nm
Ruby Tuesday Inc RT $5.61 $9.90 56.7% 0.5 nm 611.6 1,177.5 -0.9 1,165.3 39.8 -1.0% nm
Darden Restaurants Inc DRI $50.76 $55.25 91.9% 1.2 11.3 9,426.9 8,033.9 837.5 8,780.2 945.8 9.3% 12.9%
Denny's Corp DENN $6.43 $7.51 85.6% 1.6 11.1 740.8 460.0 66.9 464.8 81.7 1.0% 22.2%
Bob Evans Farms Inc/DE BOBE $50.03 $60.22 83.1% 1.2 11.7 1,658.7 1,336.1 141.7 1,334.5 142.7 -0.1% 0.6%
DineEquity Inc DIN $78.07 $85.74 91.1% 4.5 11.5 2,871.4 644.5 249.4 644.0 270.3 -0.1% 8.4%
Red Robin Gourmet Burgers Inc RRGB $71.68 $86.83 82.6% 1.1 10.8 1,118.1 1,017.2 103.5 1,148.8 118.9 12.9% 14.8%
Cracker Barrel Old Country Store Inc CBRL $97.24 $118.63 82.0% 1.0 10.1 2,716.3 2,662.1 269.0 2,679.6 283.8 0.7% 5.5%
Average $47.94 $56.31 82.8% 1.5 10.4 2,409.6 1,942.0 211.0 2,052.9 269.0 2.9% 10.7%
Median $50.40 $57.73 84.4% 1.1 11.1 1,388.4 1,097.4 122.6 1,157.0 142.7 0.7% 10.7%
Source: Bloomberg

© 2014 Mercer Capital // www.mercercapital.com 16
Mercer Capital’s Value Focus: Food and Beverage Industry First Quarter 2014
Non-Alcoholic Beverages
Non-Alcoholic Beverages TickerPrice at 3/31/14
High Price
3/31/14
% of High
3/31/14EV/
RevenueEV/
EBITDA Enterprise
Value LTM
RevenueLTM
EBITDA
Forward Revenue YE 2014
Forward EBITDA YE 2014
Revenue Growth
(from LTM)
EBITDA Growth
(from LTM)
PepsiCo Inc PEP $83.50 $86.80 96.2% 2.4 12.7 158,949.5 66,457.0 12,498.0 67,133.1 12,968.7 1.0% 3.8%
Dr Pepper Snapple Group Inc DPS $54.46 $54.46 100.0% 2.2 10.0 13,463.8 6,015.0 1,346.0 6,038.3 1,396.6 0.4% 3.8%
National Beverage Corp FIZZ $19.51 $21.47 90.9% 1.5 12.1 936.0 644.7 77.6 na na nm nm
Coca-Cola Co/The KO $38.66 $43.43 89.0% 4.5 17.1 208,235.7 46,395.0 12,173.0 46,655.7 13,173.9 0.6% 8.2%
Monster Beverage Corp MNST $69.45 $74.79 92.9% 5.0 18.2 11,603.3 2,298.3 638.6 2,454.2 725.7 6.8% 13.6%
Starbucks Corp SBUX $73.38 $82.50 88.9% 3.7 18.1 57,383.9 15,650.1 3,167.8 16,500.0 3,771.2 5.4% 19.0%
Average $56.49 $60.58 93.0% 3.2 14.7 75,095.4 22,910.0 4,983.5 27,756.3 6,407.2 2.8% 9.7%
Median $61.96 $64.63 91.9% 3.0 14.9 35,423.9 10,832.6 2,256.9 16,500.0 3,771.2 1.0% 8.2%
Source: Bloomberg
Appendix A: Public Company Performance & Pricing

© 2014 Mercer Capital // www.mercercapital.com 17
Mercer Capital’s Value Focus: Food and Beverage Industry First Quarter 2014
Alcoholic Beverages
Alcoholic Beverages TickerPrice at 3/31/14
High Price
3/31/14
% of High
3/31/14EV/
RevenueEV/
EBITDA Enterprise
Value LTM
RevenueLTM
EBITDA
Forward Revenue YE 2014
Forward EBITDA YE 2014
Revenue Growth
(from LTM)
EBITDA Growth
(from LTM)
Anheuser-Busch InBev NV BUD $105.30 $106.83 98.6% 5.1 12.7 218,427.34 43,195.0 17,188.0 47,764.5 19,234.2 10.6% 11.9%
Craft Brew Alliance Inc BREW $15.27 $18.70 81.7% 1.6 20.5 301.60 186.4 14.7 207.0 na 11.1% nm
Constellation Brands Inc STZ $84.97 $84.97 100.0% 4.8 18.4 23,289.71 4,867.7 1,262.6 4,863.2 1,369.7 -0.1% 8.5%
Diageo PLC DEO $124.59 $134.08 92.9% 28.6 83.5 322,580.95 11,260.0 3,863.0 10,519.9 3,680.7 -6.6% -4.7%
Boston Beer Co Inc/The SAM $244.73 $265.53 92.2% 4.0 21.9 3,173.53 787.0 144.8 917.0 175.0 16.5% 20.9%
Molson Coors Brewing Co TAP $58.86 $58.86 100.0% 3.6 14.6 15,111.48 4,193.6 1,032.9 4,234.6 1,285.4 1.0% 24.4%
Brown-Forman Corp BF/B $89.69 $89.74 99.9% 6.8 20.0 20,173.38 2,961.0 1,010.9 3,987.2 1,024.6 34.7% 1.4%
Average $103.34 $108.39 95.0% 7.8 27.4 86,151.1 9,635.8 3,502.4 10,356.2 4,461.6 9.6% 10.4%
Median $89.69 $89.74 98.6% 4.8 20.0 20,173.4 4,193.6 1,032.9 4,234.6 1,327.6 10.6% 10.2%
Source: Bloomberg
Appendix A: Public Company Performance & Pricing
Mercer CapitalFood & Beverage Industry Services
Contact Us
Copyright © 2014 Mercer Capital Management, Inc. All rights reserved. It is illegal under Federal law to reproduce this publication or any portion of its contents without the publisher’s permission. Media
quotations with source attribution are encouraged. Reporters requesting additional information or editorial comment should contact Barbara Walters Price at 901.685.2120. Mercer Capital’s Industry
Focus is published quarterly and does not constitute legal or financial consulting advice. It is offered as an information service to our clients and friends. Those interested in specific guidance for legal or
accounting matters should seek competent professional advice. Inquiries to discuss specific valuation matters are welcomed. To add your name to our mailing list to receive this complimentary publication,
visit our web site at www.mercercapital.com.
Mercer Capital has expertise providing business valuation and financial advisory services to companies in the food and beverage industry.
Industry Segments
Mercer Capital serves the following industry segments:
• Food processing
• Restaurants
• Nonalcoholic Beverages
• Malt, Wine, and Spirits
Services Provided
• Valuation of food and beverage industry companies
• Transaction advisory for acquisitions and divestitures
• Valuations for purchase accounting and impairment testing
• Fairness and solvency opinions
• Litigation support for economic damages and valuation and shareholder disputes
Contact a Mercer Capital professional to discuss your needs in confidence.
Matthew R. Crow, CFA, [email protected]
Timothy R. Lee, [email protected]
Nicholas J. Heinz, [email protected]
Travis W. Harms, CFA, CPA/[email protected]
Mercer Capital5100 Poplar Avenue, Suite 2600Memphis, Tennessee 38137901.685.2120 (P)
www.mercercapital.com
BUSINESS VALUATION & FINANCIAL ADVISORY SERVICES