Value Chain Analysis · value chain, in both directions.13 Value chain analysis separates the...
47
Value Chain Analysis The wild capture mud crab fishery of Madagascar’s Menabe region
Transcript of Value Chain Analysis · value chain, in both directions.13 Value chain analysis separates the...
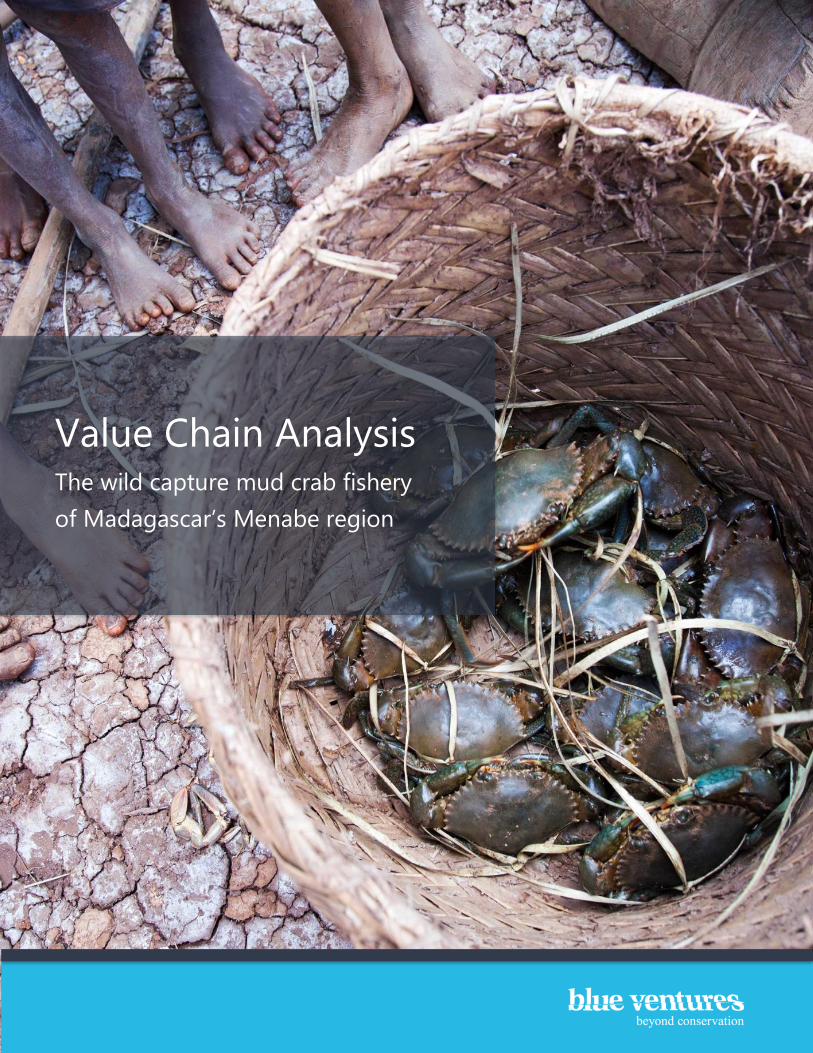
Value Chain Analysis The wild capture mud crab fishery
of Madagascar’s Menabe region
2
Contents
Executive Summary 3
1. Introduction 5
2. Methodology 7
2.1 Framework 7
2.2 Study area 9
3. Results and Discussion 10
3.1 Value chain 10
3.1.1 Key stakeholders 10
3.1.2 Stakeholder interactions 12
3.2 Stakeholder groups 13
3.2.1 Fishers 13
3.2.2 Market vendors 16
3.2.3 Local collectors 17
3.2.4 Regional collectors 17
3.2.5 Hotels 18
3.3 Buyer requirements 18
3.4 Seasons 19
3.5 Adding value 19
3.6 Value loss 21
3.6.1 Mortality and damage 21
3.6.2 Expenses 23
3.7 Stakeholder perceptions 24
3.8 Gender roles 25
4. Conclusions 27
5. Recommendations 28
5.1 Diversify markets 28
5.2 Ranching and fattening 29
5.3 Mortality and damage 29
5.4 Mortality for license holding local collectors 30
5.5 Reduce indebtedness 30
Appendix A 31
References 47
3
Executive Summary
Madagascar's fishers are some of the poorest people in
the world. In some regions, such as Menabe, around
41% of the adult population in coastal communities is
reliant on fishing as their primary source of income or
protein. The mud crab (Scylla serrata) fishery in this
region is an important source of income for many
fishers, as it requires minimal investment to catch and
sell crab, and there is consistent demand, driven
primarily by international markets. However, despite the
lucrative market for mud crab, fishers are unable to
capture the majority of financial benefits and are instead
often locked in cycles of debt and poverty. This study
presents an analysis of the mud crab value chain, with
the aim of better understanding market issues and the
challenges faced by different stakeholders. This report
also makes recommendations about how these can be
overcome.
Although the fishery only accounts for a small
proportion of local employment, it is associated with
high levels of dependence by its key stakeholders. Of
the 98 crab fishery stakeholders interviewed, 90% of
crab fishers, 81% of market vendors, 89% of local collectors and 100% of regional collectors were reliant
on mud crabs for the majority of their income.
This study found that mud crabs are sometimes consumed by the fishers’ families, but more often stored
in mud and sold to a range of buyers. Fishers primarily reported selling to local collectors based in the
community (96% of those surveyed), and a smaller proportion also selling to local hotels. The reliance
fishers have on a single buying group has encouraged a buyers' market, where local collectors dictate
prices. This imbalance in market power is compounded by the advanced pay used to purchase crabs,
creating a cycle of debt that further entrenches the dependence fishers have on local collectors. At each
subsequent level in the value chain, routes to market diversified and dependence between stakeholder
groups became less pronounced.
4
The value of crab increased as it moved along the value chain. Grading (paying a higher price for better
quality crabs) was the only mechanism used to add value to crabs, practiced almost solely by collectors.
Within the value chain it was more common for value to be lost than added. Mortality and damage during
storage and transportation represent the largest losses in the value chain, with an estimated cost for
fishers and local collectors equal to around 21% of their total profits. Although it was not possible to
calculate the cost of this loss to regional collectors, again mortality and spoilage increased in frequency at
every stage in the value chain. It is therefore likely that this cost is even greater for regional collectors than
for local collectors.
At present, demand for mud crab outstrips availability. This highlights a market appetite for higher
volumes of crab, including value added products, and presents the greatest opportunity to increase the
value within the value chain. However, this imbalance also presents the greatest threat to sustainability of
the fishery. Higher levels of exploitation are the obvious tool to meet demand, but are likely to exacerbate
the current level of over-exploitation. This could result in reduced crab availability and even stock
collapse. If demand could instead be met by reducing mortality and spoilage, the value of this currently
wasted portion of the catch could be realised within the value chain. Recommendations made in this
report include assessing opportunities for freezing, ranching and fattening of crabs, in addition to
exploring more direct routes to market for local fishers.

5
1. Introduction
Madagascar’s marine environment supports globally important and threatened biodiversity and provides
livelihoods and food to over 500,000 people.1 The country’s fishers include some of the poorest people on
earth2, and many coastal communities have no alternative livelihood to fishing. The island is ranked
among the tropical coastal nations with the lowest adaptive capacity and highest vulnerability to climate
change.3
This study is focused on the Morondava district within the Menabe region of Madagascar, an isolated, arid
area on the west coast of the island. Levels of formal education are very low in the region and income for
many households is below the international poverty line of $1.90 (purchasing power)4. A recent census5
conducted by Blue Ventures found that 42% of the adult resident population (>15 years old) depends on
fishing as a primary source of food and/or income. It is also common for people in other occupations to
fish, as a means to diversify their source of income and food.
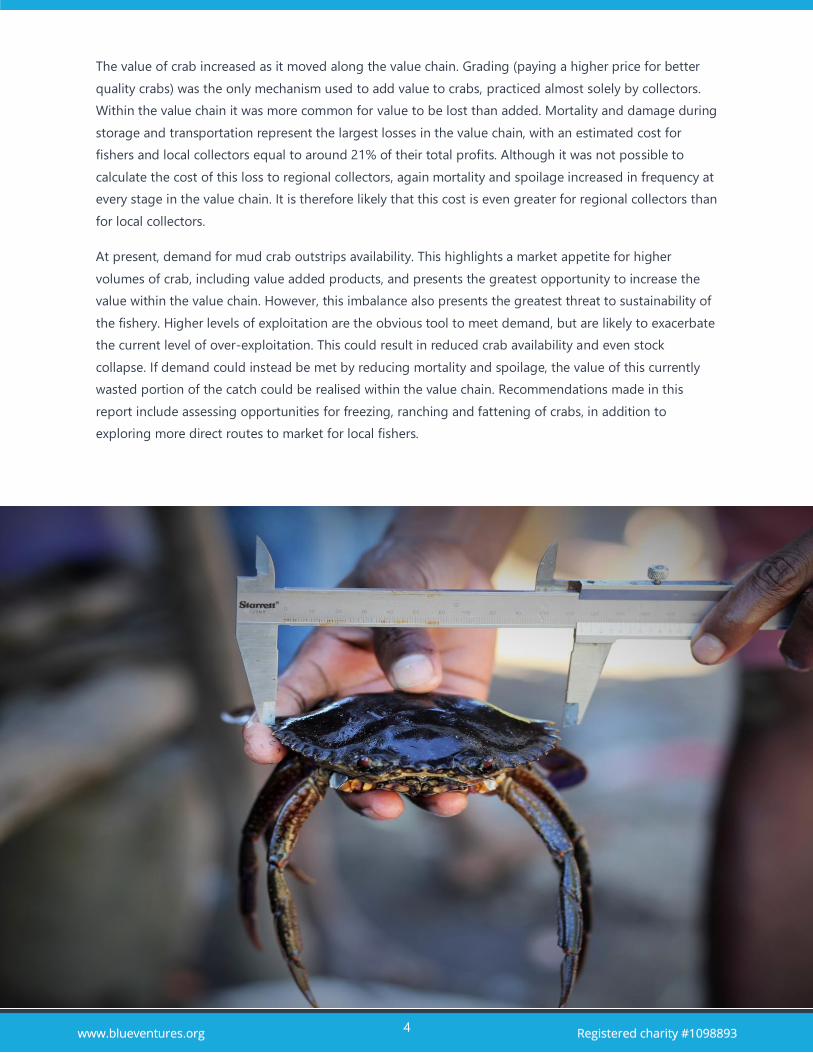
Mud crabs (Scylla serrata) are opportunistic scavenger feeders, living in burrows in the mangroves that
fringe much of the coast within the study area (Figure 1). A local fishery has developed around this
particular species, which supports around 12% of the local fishing community as their primary source of
income.6 This is a small-scale, artisanal fishery, based around traditional fishing methods, with fishers
operating on foot or from small dugout canoes in mangrove forests. Collectors and most sellers operate
locally, often within informal markets, selling their produce to a range of buyers including seafood
exporters. Most of the catch is ultimately destined for foreign markets7, particularly China (receiving 70%
of exports in 20168) and the European Union9 (France received 21% of mud crab exports in 2016).
High international demand for mud crab and the minimal barriers to entering the fishery, due to
expansive low-tech local supply chains, have resulted in the fishery becoming critical to a large number of
poor, mangrove-dependent communities. However, fishers have to-date been unable to take advantage
of the lucrative mud crab market. They operate within an unpredictable local market, where prices
fluctuate greatly over the year, and in some cases even over a single week. At the bottom of the supply
chain, fishers have very little power to secure better value for their product. Instead, they are often forced
to catch more, and increasingly smaller, mud crabs, just to generate enough income to provide food for
their families. This is a contributing factor to crab fisher households being some of the poorest in the
region and often in debt.
Fisheries management and historic information on the fishery in the region is very limited. A legal
minimum landing size of 10 cm was introduced in 2010, and this was subsequently increased to 11 cm in
2014 as a management measure for the fishery. However, compliance is low and undersized crabs are a

6
common sight at local markets. Recent work by Blue Ventures10 and Smartfish11 has found that the stock
is showing signs of overfishing, with observed declines in Catch Per Unit Effort (CPUE) and crab size in
recent years. If left unchecked, this could potentially lead to complete collapse of the mud crab stock,
fishery, and the value chain that has grown around it, within the next few years.
Value chain analysis was identified as a tool to better understand the specific barriers to improving value
along the chain, in order to design new strategies for incentivising marine conservation and fisheries
management. Value chain analysis looks at every step in the chain that a fisheries “product” goes through,
from the raw materials to the eventual end user. The process identifies the value flows through the chain,
and specifically, areas where value is added and lost. The main aims of this study are to identify the key
stakeholders involved in the value chain and understand the relationships (e.g. the flow of payment) and
linkages between them.
7
2. Methodology
2.1 Framework
The value chain is the full spectrum of activities that take place as a product is brought from production,
through intermediary stakeholders and actors, to its delivery with the final customer.12 This is driven by
the market-oriented interactions between key stakeholders such as commodity producers (fishers in this
study), producers, processors and buyers. Although these stakeholders hold varying levels of market
power, they are all intrinsically involved in the processes that produce and add value to the product. In
this report, fishers are those people who declared themselves as fishers, or are designated by the
community as fishers (unless otherwise noted, for example, in the census data).
This value chain analysis was carried out for the wild capture mud crab fishery in the Menabe region of
Madagascar. This is a descriptive process that charts the flow of products and related services along the
value chain, in both directions.13 Value chain analysis separates the activities in the value chain, making it
possible to identify areas where value is added and lost. This helps to foster a better understanding of the
constraints and opportunities for each stakeholder group, within each stage of the value chain.
A four-part process for the value chain analysis was used for this study. These steps are as follows:
1. Preparation
Preparatory work was undertaken to determine and outline the objectives of the value chain analysis, the
timeline, and the resources requirements and availability.
2. Desk research and preliminary value chain mapping
Research was carried out to understand what is already known about the value chain and what will need
to be determined using primary research techniques including semi-structured interviews and
questionnaires. Subsequently, an initial value chain map was produced for later refinement. This included
a list of known stakeholders, such as exporters, traders, retailers, hotels, resorts, restaurants and villages in
the region that are active in the fishery.
3. Primary data collection and research
8
Building on the results of the previous two steps, a questionnaire was produced targeting the various
stakeholders identified throughout the chain. After translating and pre-testing the questionnaires, data
collection was piloted. Following pilot surveys, the team met again to discuss any problems with the
questionnaires and refined them accordingly. Once the pilot was complete, the main research phase
began.
4. Mapping, analysis and write up
Primary data collected in stage three were analysed and combined with the results from step two, to
produce the value chain analysis and refine the initial value chain map. A key component of this stage
involved the analysis of constraints and opportunities for upgrading the chain, and the priorities and
recommendations for doing so.
The final questionnaires (Appendix A) provided a framework for collecting quantitative data necessary to
answer five critical questions (adapted from a previous value chain analysis14):
1. Who are the key stakeholders in the value chain, what role does each play and what relationships
do they have with each other?
2. What and where in the chain are the activities that add value to the crab product?
3. What are the buyer requirements for the crab products (volume, grades, packaging etc.)?
4. What is the flow of payment along the value chain and how are prices determined?
5. What are the challenges faced by different stakeholders (especially fishers) along the value chain
and how can these can be overcome?
All prices are in Malagasy Ariary (MGA), unless otherwise stated. At the time of writing, £1 GBP was worth
approximately 4400 MGA (September 2018).
9
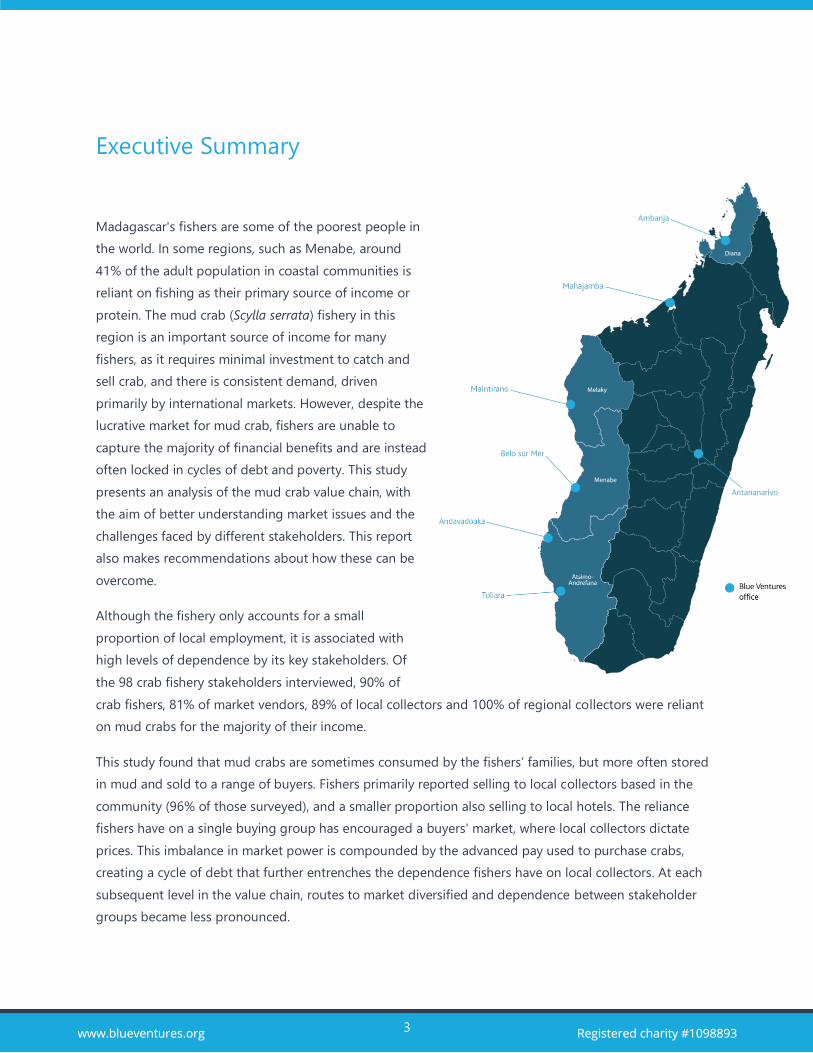
2.2 Study area
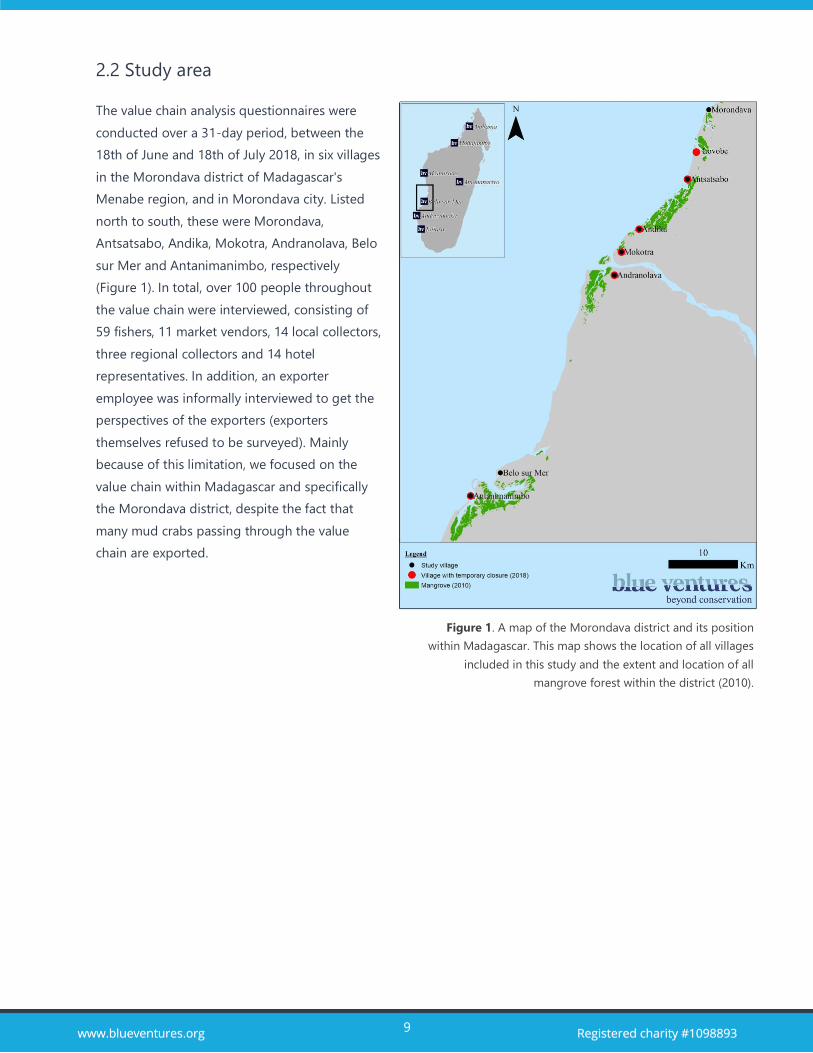
The value chain analysis questionnaires were
conducted over a 31-day period, between the
18th of June and 18th of July 2018, in six villages
in the Morondava district of Madagascar's
Menabe region, and in Morondava city. Listed
north to south, these were Morondava,
Antsatsabo, Andika, Mokotra, Andranolava, Belo
sur Mer and Antanimanimbo, respectively
(Figure 1). In total, over 100 people throughout
the value chain were interviewed, consisting of
59 fishers, 11 market vendors, 14 local collectors,
three regional collectors and 14 hotel
representatives. In addition, an exporter
employee was informally interviewed to get the
perspectives of the exporters (exporters
themselves refused to be surveyed). Mainly
because of this limitation, we focused on the
value chain within Madagascar and specifically
the Morondava district, despite the fact that
many mud crabs passing through the value
chain are exported.
Figure 1. A map of the Morondava district and its position
within Madagascar. This map shows the location of all villages
included in this study and the extent and location of all
mangrove forest within the district (2010).
10
3. Results and Discussion
3.1 Value chain
3.1.1 Key stakeholders
The value chain mapping identified six key stakeholders in the local mud crab value chain: fishers, local
collectors, regional collectors, market vendors, hotels and exporters. The first four stakeholders were
defined as follows:
● Fishers include those people who declared themselves as crab fishers, or those designated by the
community as crab fishers.
● Local collectors operate solely within the local district of Morondava. This work is associated with
a "mareyeur" (local collectors) license.
● Regional collectors operate within the wider Menabe region or national market and typically hold
a “permis de collecte” (collection permit).
● Market vendors include both the more formal market in Morondava as well as informal markets in
Belo sur Mer and Mokotra. The informal markets involve fishers in the two latter towns selling
some crabs directly to other consumers. In both cases, however, the crabs sold are those that
cannot be sold to collectors or exporters, sometimes called “reject” crabs, and opportunities for
increasing value to the fishers will be the same. Hence, we have combined them into one
stakeholder group for this study.
There is some overlap between stakeholder groups. For example, regional collectors often export crabs
but not all regional collectors are also exporters, and likewise, some exporters also operate as regional
collectors (though all require a collection permit). It was not possible to obtain information from any
stakeholders who were acting solely as exporters, with the exception of one employee of an exporter, so
regional collectors represent the upper limit of this value chain analysis. Specific notes from the interview
with the employee of the exporter are mentioned in this report, where appropriate.
Key stakeholders were interviewed in five villages, plus Morondava town, Menabe region’s capital, which
is the main commercial centre in the region. It is also home to the largest and only formal mud crab
market, the majority of hotels, and all of the regional collectors of the district/region (Table 1). All other
villages identified in Table 1 are principally fishing villages with varying levels of commercial
diversification. Belo sur Mer, with several hotels and local collectors, is the second most commercially
diverse village in the value chain. It is around 65 km south of Morondava.
11
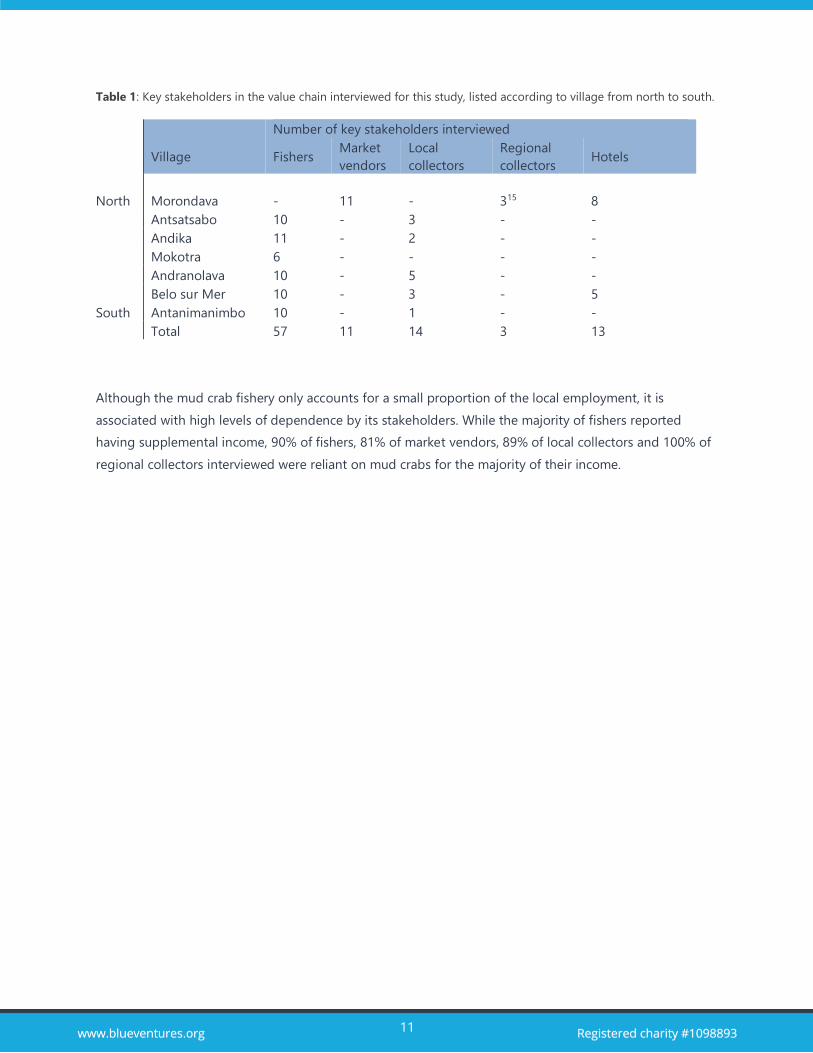
Table 1: Key stakeholders in the value chain interviewed for this study, listed according to village from north to south.
Number of key stakeholders interviewed
Village Fishers Market
vendors
Local
collectors
Regional
collectors Hotels
North Morondava - 11 - 315 8
Antsatsabo 10 - 3 - -
Andika 11 - 2 - -
Mokotra 6 - - - -
Andranolava 10 - 5 - -
Belo sur Mer 10 - 3 - 5
South Antanimanimbo 10 - 1 - -
Total 57 11 14 3 13
Although the mud crab fishery only accounts for a small proportion of the local employment, it is
associated with high levels of dependence by its stakeholders. While the majority of fishers reported
having supplemental income, 90% of fishers, 81% of market vendors, 89% of local collectors and 100% of
regional collectors interviewed were reliant on mud crabs for the majority of their income.
12
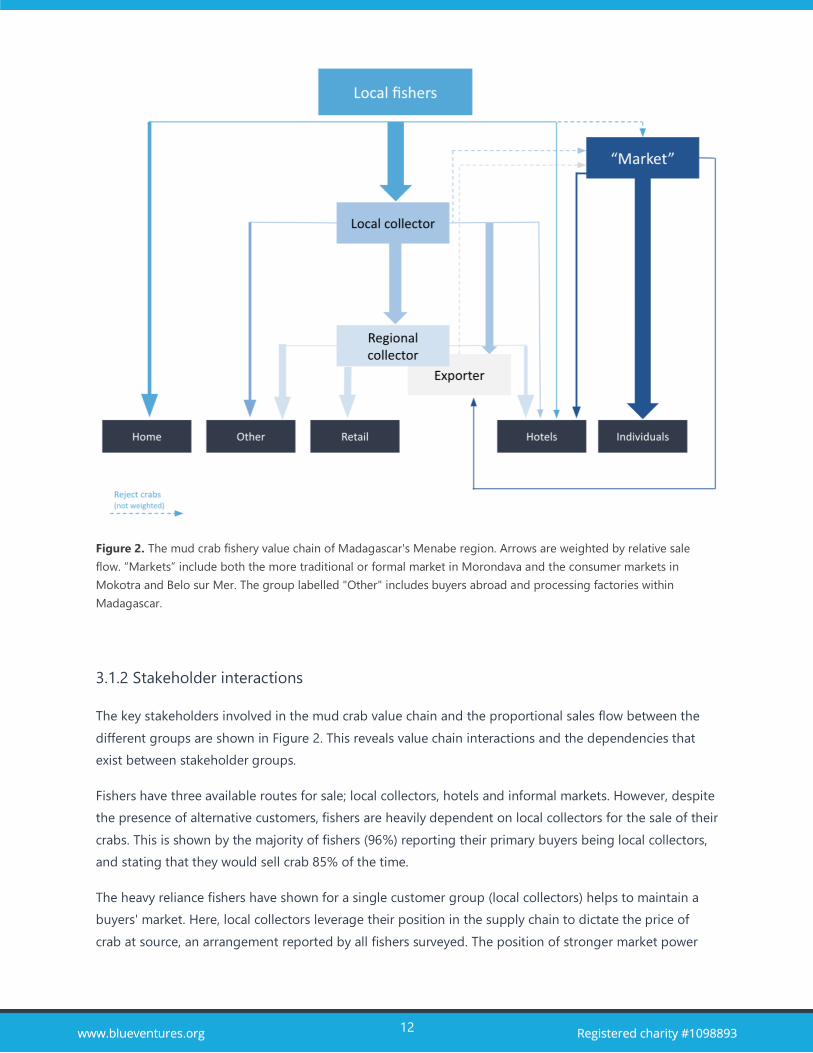
Figure 2. The mud crab fishery value chain of Madagascar's Menabe region. Arrows are weighted by relative sale
flow. “Markets” include both the more traditional or formal market in Morondava and the consumer markets in
Mokotra and Belo sur Mer. The group labelled "Other" includes buyers abroad and processing factories within
Madagascar.
3.1.2 Stakeholder interactions
The key stakeholders involved in the mud crab value chain and the proportional sales flow between the
different groups are shown in Figure 2. This reveals value chain interactions and the dependencies that
exist between stakeholder groups.
Fishers have three available routes for sale; local collectors, hotels and informal markets. However, despite
the presence of alternative customers, fishers are heavily dependent on local collectors for the sale of their
crabs. This is shown by the majority of fishers (96%) reporting their primary buyers being local collectors,
and stating that they would sell crab 85% of the time.
The heavy reliance fishers have shown for a single customer group (local collectors) helps to maintain a
buyers' market. Here, local collectors leverage their position in the supply chain to dictate the price of
crab at source, an arrangement reported by all fishers surveyed. The position of stronger market power
13
displayed by local collectors when dealing with fishers is compounded by the advanced pay used to
purchase crabs, where collectors offer money in advance of future catches that fishers accept in order to
keep their families solvent during seasonal dips in crab abundance. This creates a cycle of debt, and
further entrenches the dependence fishers have on collectors.
At each subsequent level in the value chain, stakeholders take greater advantage of the various routes to
market and their dependence on any one buyer becomes less pronounced. Local collectors have two main
buyers – regional collectors and exporters – who represent 53% and 38% of sales respectively, while
regional collectors sell their crabs across a relatively diverse portfolio of buyers, none accounting for more
than 40% of sales. Regional collectors and local collectors are known to sell crabs to the market, but this
represents only the sale of otherwise rejected crabs (that is, otherwise unsold, for reasons including but
not limited to quality or size).
3.2 Stakeholder groups
3.2.1 Fishers
The average fisher income from mud crab (by village) was found to rise with increasing proximity to
Morondava (Figure 3). The fishers surveyed in Antsatsabo, the village closest to Morondava, represent
only 17% of those in the study, yet account for 42% of the total earnings reported. This is a stark
comparison to the 17% of fishers in this study that come from Antanimanimbo. This is the village furthest
from Morondava, and fishers here account for only 9% of the earnings reported by all fishers in this study.
Note that percentages reported are only for those interviewed in this study, and may not represent the
population exactly.
Fisher income is dependent on the volume of crabs caught and sold, the price received per kilogram,
expenses and, to a lesser extent, pre-sale crab mortality. All of these metrics were found to be highly
variable between individual fishers and between villages. However, when analysed by proximity to
Morondava, some clear patterns emerged.
The volume of crab caught on an average day ranged from 2.5 kg to 17.5 kg with an average of 7 kg,
though more extensive data collection in the field carried out over several years did not provide a
consistent trend in catch volume between the villages over the study period.16 The costs associated with
fishing, however, were found to decrease with increasing proximity to Morondava (Figure 4). This might
be partially explained by the villages closer to Morondava having a shorter transport time and subsequent
lower transport cost to reach buyers (Figure 5). The shorter transport time could also result in higher
quality crabs reaching the buyers and thus could explain the observed trend of fishers in villages closer to
Morondava receiving a higher average price per kilogram (Figure 6). The veracity of this potential link
between transport time, quality, and therefore price, requires further investigation.

14
Figure 3. The average fishers annual income
(MGA) by village. Villages are ranked from south
to north with 1 being the furthest south, and so
furthest from Morondava.
Figure 4. The average annual mud crab fishing
related expenses (MGA) by village. Villages are
ranked from south to north with 1 being the
furthest south, and so furthest from Morondava.
Figure 6. The average price per kg (MGA) of mud
crab by village. Villages are ranked from south to
north with 1 being the furthest south, and so
furthest from Morondava. There was one notable
exception which may have skewed the last data
point - a fisher from Antsatsabo sold his crabs for
3.7 times the average rate, and was one of only
two fishers to sell the more highly prized
"whole/full" grade.
Figure 5. The average transport time to the
buyer (hours) by village. Villages are ranked
from south to north with 1 being the furthest
south, and so furthest from Morondava.

15
While there is a pattern for fishers earning more money in villages closer to Morondava, Figure 7 shows
that there is huge variation in fisher annual incomes across all villages. Of the fishers surveyed, 74% had
annual earnings of between 1.50 million and 9 million MGA. However, when combined, these earnings are
almost 100 million MGA lower than that of the remaining 26%, who had an average annual income of
18.99 million MGA.
Figure 7. The income profiles of fishers within each village, by income band.
The average for the entire group is displayed as a line.
16
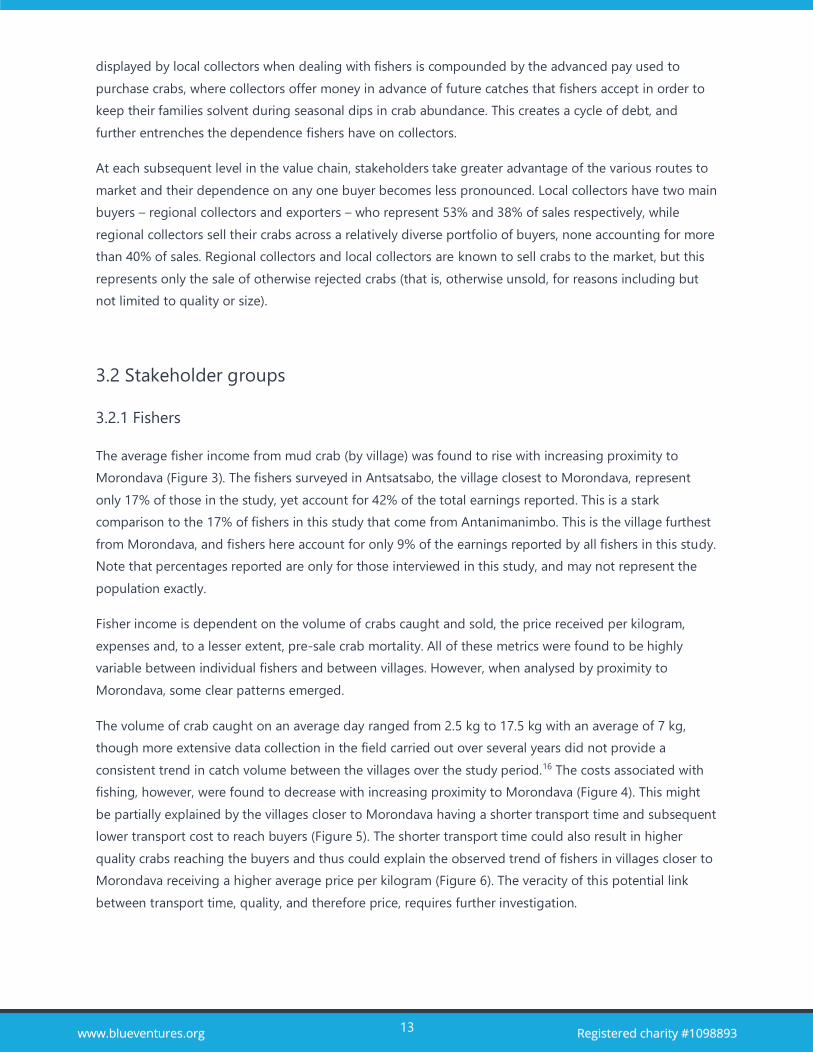
Surprisingly, although the number of days spent fishing crabs per week varied between fishers (Figure 8),
fishing days were not found to have a strong effect on income.
Of the 59 fishers that were interviewed, only 12 reported that they owned a license to fish crabs, and 59%
reported having received a training on mud crab biology, life cycle or management from either Blue
Ventures or Smartfish. Neither possessing this education nor the license seemed to have an influence on
income. There was, however, a link between licenses and training, and only one fisher held a license
without having received any training. This link requires further examination to determine a cause.
3.2.2 Market vendors
Grading, the practice of separating crabs into groups based on quality and size, is not common for market
vendors who sell only the lowest value grade of mud crabs (mixed grade). Mixed grade crabs include all
qualities and often all sizes (see Table 2 for other grade definitions). Generally, market vendors sell crabs
by the pile (toko – an arbitrary unit used locally as a measure for crab), with a very low operating profit
margin. They sell primarily to individual buyers (representing around 81% of their business), and two even
stated that they sometimes sell directly to hotels and exporters.
Anecdotal evidence (from all market vendors interviewed and from the one exporter employee
interviewed) along with other field experience, suggests that mixed crabs, including those that are broken,
are sent to the market by stakeholders throughout the value chain as a last resort for sale. Markets are
Figure 8. Shows the percentage of fishers that recorded fishing crabs a certain number of days per week.

17
also known to buy and sell crabs below the minimum legal landing size, despite 73% of vendors stating
that they were aware of the legal limit of 11 cm. Crabs as small as 6 cm are reportedly sold at the market
at a lower price per kilogram than crabs above the minimum landing size.
3.2.3 Local collectors
Local collectors purchase mud crabs directly from fishers and sell mainly to regional collectors and
exporters, with some sales to local hotels (Figure 2). This is the first stage in the value chain where crabs
are routinely graded by quality and size, and where sustainability of the catch becomes potentially
marketable (Table 2). This potential was stated directly by one local collector from Andranolava, who said
that he would be willing to pay an extra 500 MGA per kg for crab from a sustainably managed source.
Mortality and damage (broken or not whole) were reported at a higher rate by the five license-holding
local collectors when compared to those without a license. This finding requires further examination to
determine the cause, although our experience in the field suggests that local collectors with licenses tend
to be better educated. This would leave them better placed to quantify, and therefore report, loss through
mortality and damage.
Grade Description
Mixed Mixed quality
Light Crabs with little meat
Full Crabs with lots of meat
Part Broken crabs
Whole Whole crabs
3.2.4 Regional collectors
There are 12 regional collectors in the Morondava area that purchase mud crabs directly from local
collectors, selling their crabs to retailers, hotels, exporters and to "other" buyers (Figure 2). Although sales
data is limited for regional collectors, it appears that crabs are being graded further once they reach this
stage. This is, for example, the first time that a differentiation is made between broken and unbroken
crabs being sold.
Two of the three regional collectors surveyed stated a willingness to pay a premium for crabs from a
sustainably managed source. One regional collector put this premium at an additional 1100 MGA per kg.
Table 2. All grades of crab identified in the value chain analysis and
their descriptive characteristics.

18
Other regional collectors stated that they freeze some or all of their crabs prior to sale. Our surveys
showed about 15%, by weight, of all crab sold by collectors in the Morondava area is frozen. This presents
a potential opportunity as a new market for fishers. If fishers could sell frozen crabs directly to collectors,
especially Sopemo (the main seller of frozen crabs17), this could provide a higher value alternative to the
existing market for damaged stock.
3.2.5 Hotels
Hotels are only found in Morondava and Belo sur Mer. They source mud crabs from all other stakeholders
interviewed for this report, including regional collectors, local collectors, markets and, in Belo sur Mer
only, fishers.
Dishes made with whole crabs could demand a higher price than those that used a mixed grade, with
prices ranging from 3,000 to 20,000 MGA for mixed and 8,000 to 50,000 MGA for whole crabs. However,
the range in purchase price for mixed and whole crabs was the same, 2,500 to 4,000 MGA per kg.
Some hotels stated that they use frozen crab meat for some of their dishes. If frozen and shelled,
otherwise rejected crabs could be sold here and provide a higher value alternative to the market.
Additionally, over 60% of hotel representatives responded that they would pay a premium for crabs from
a sustainable source, although none were prepared to state an exact value.
3.3 Buyer requirements
None of the stakeholders interviewed expressed strong requirements for purchasing, such as a minimum
quantity, male or female (although some field experience suggests that female crabs were better for the
export market). All regional collectors stated that the minimum size they would purchase was 11 cm (the
minimum landing size). This was also the case for some local collectors and market vendors; however,
others were willing to purchase crabs at much smaller sizes.
19
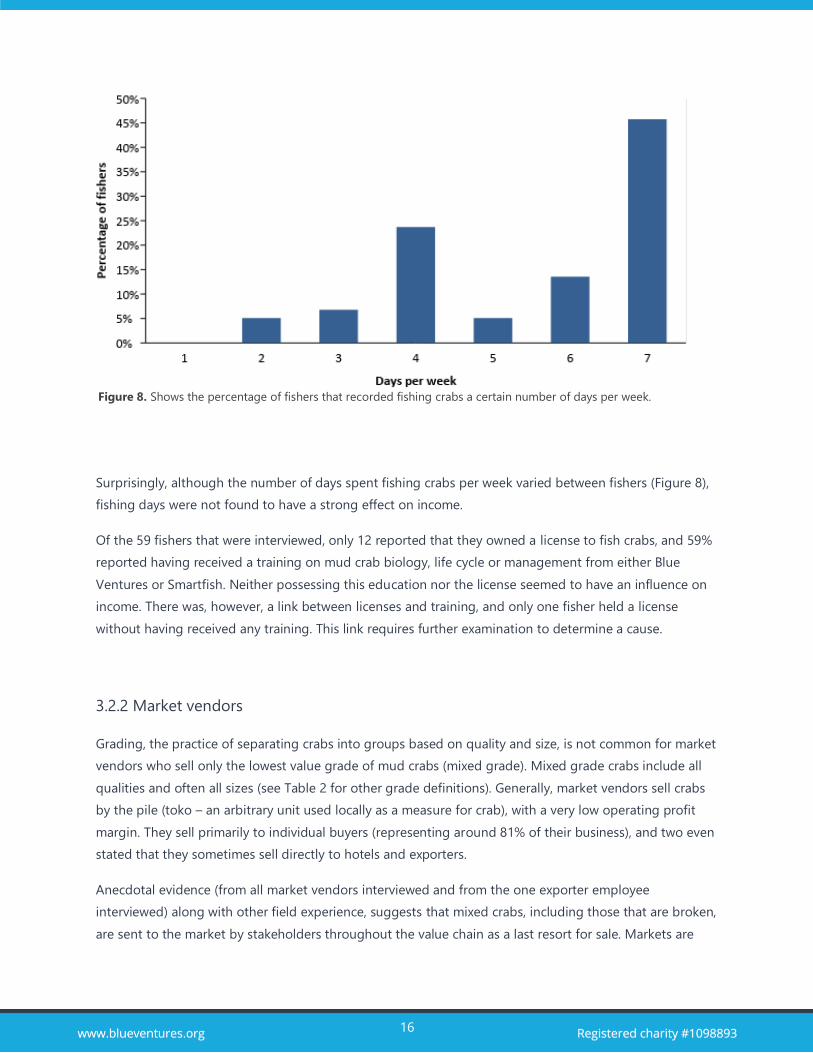
3.4 Seasons
Menabe has three distinct seasons; Asara (December to April), Asotry (May to August) and Faosa
(September to November). Asotry is the low season for catching mud crab (by volume). Around a quarter
of fishers stated they catch the most crabs during Faosa, and the remaining three quarters catch the most
during Asara (Figure 9). This pattern is fairly consistent across all villages and coincides with the lowest
price received by fishers for their mud crabs (Figure 10), as prices drop due to increased availability. From
field experience we know that other factors may play a role (e.g. tourist season for selling to hotels), but
we do not yet have data to support these correlations.
3.5 Adding value
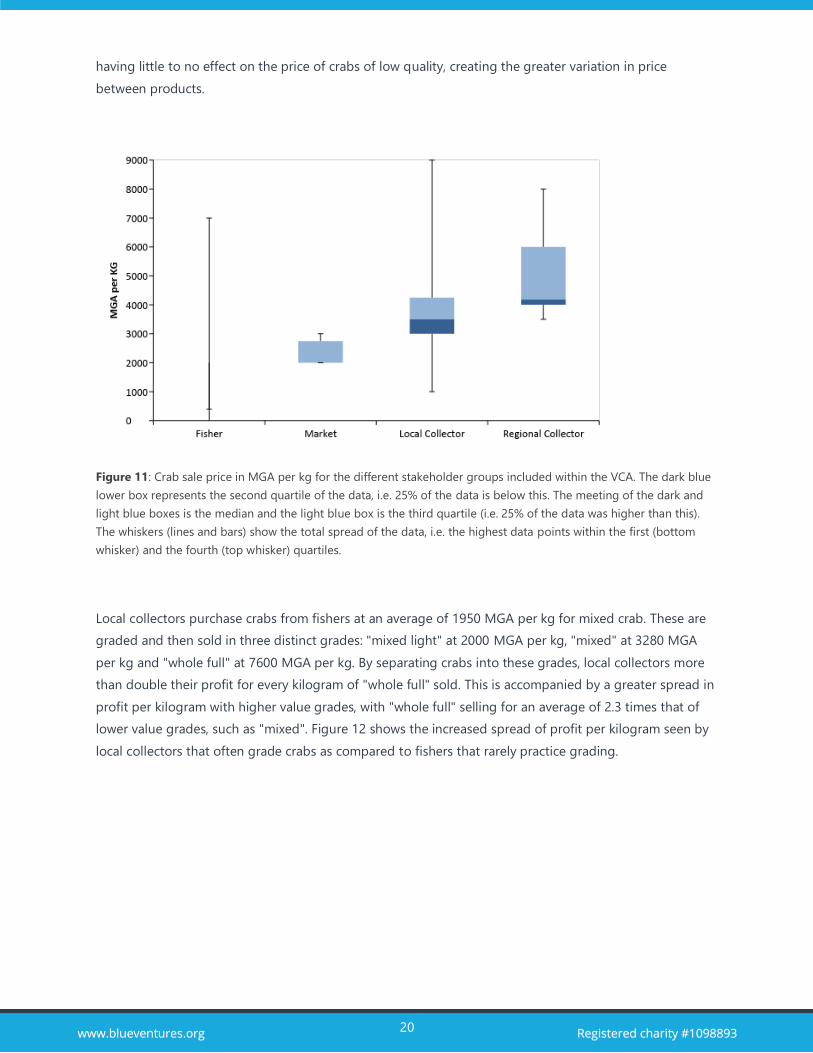
In general, as crabs moved through the supply chain their value increased (Figure 11). The median sale
price of crab was 2000 MGA per kg for fishers and market vendors, 3500 MGA per kg for local collectors
and 4200 MGA per kg for regional collectors.
The only process for adding value to mud crabs currently used in the supply chain is grading. Grading
leads to stratification of prices, as higher value grades can be sold at an increased markup compared to
those of a lower value grade.
Fishers and market vendors were not observed grading their crabs or carrying out any other practices that
added value to their goods. This is illustrated by the low variance in value for crabs among these
stakeholders (Figure 11). For these fishers and market vendors, prices remain fairly consistent and they
offer mainly mixed or ungraded crabs. One notable exception is a fisher from Antsatsabo who sold his
crabs for 3.7 times the average rate. He was one of only two reported fishers to sell the more highly prized
"whole/full" grade. Local and regional collectors, by contrast, routinely separate crabs into multiple grades
based on quality and size. This has the effect of adding value to crabs in the new premium grades while
Figure 9. Seasons in which fishers reported
catching the most crabs.
Figure 10. Season in which fishers reported
receiving the lowest price for their crabs.
20
having little to no effect on the price of crabs of low quality, creating the greater variation in price
between products.
Figure 11: Crab sale price in MGA per kg for the different stakeholder groups included within the VCA. The dark blue
lower box represents the second quartile of the data, i.e. 25% of the data is below this. The meeting of the dark and
light blue boxes is the median and the light blue box is the third quartile (i.e. 25% of the data was higher than this).
The whiskers (lines and bars) show the total spread of the data, i.e. the highest data points within the first (bottom
whisker) and the fourth (top whisker) quartiles.
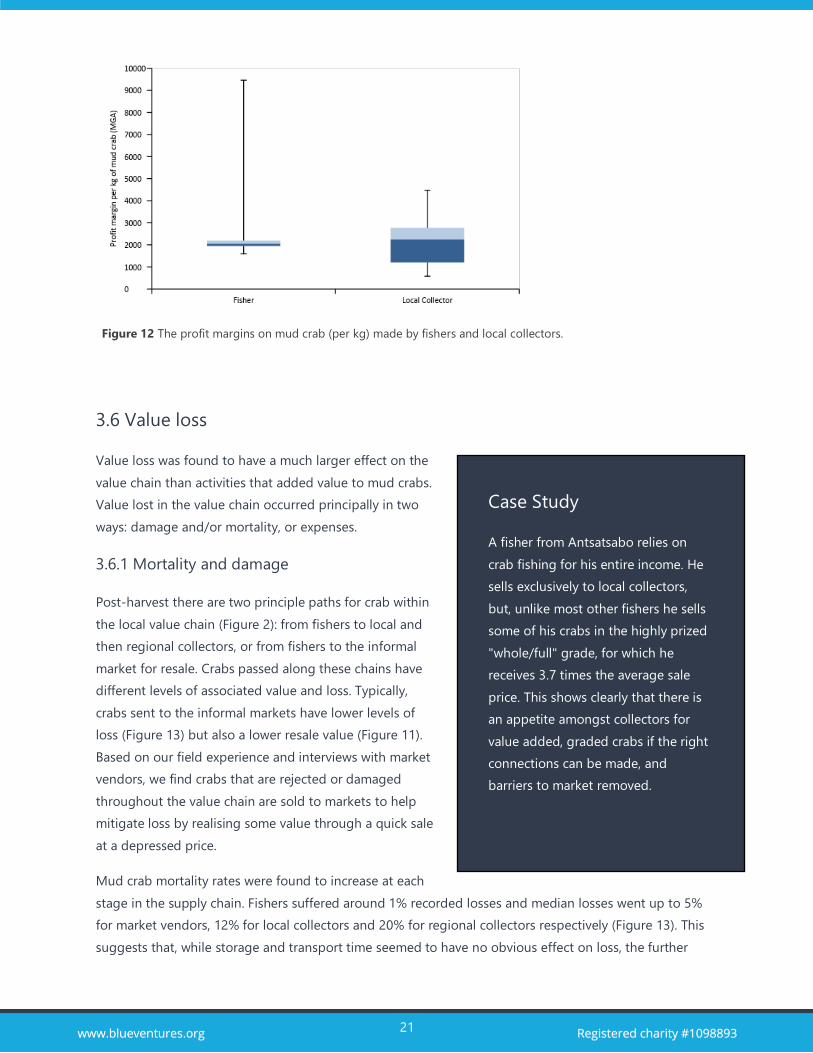
Local collectors purchase crabs from fishers at an average of 1950 MGA per kg for mixed crab. These are
graded and then sold in three distinct grades: "mixed light" at 2000 MGA per kg, "mixed" at 3280 MGA
per kg and "whole full" at 7600 MGA per kg. By separating crabs into these grades, local collectors more
than double their profit for every kilogram of "whole full" sold. This is accompanied by a greater spread in
profit per kilogram with higher value grades, with "whole full" selling for an average of 2.3 times that of
lower value grades, such as "mixed". Figure 12 shows the increased spread of profit per kilogram seen by
local collectors that often grade crabs as compared to fishers that rarely practice grading.
21
3.6 Value loss
Value loss was found to have a much larger effect on the
value chain than activities that added value to mud crabs.
Value lost in the value chain occurred principally in two
ways: damage and/or mortality, or expenses.
3.6.1 Mortality and damage
Post-harvest there are two principle paths for crab within
the local value chain (Figure 2): from fishers to local and
then regional collectors, or from fishers to the informal
market for resale. Crabs passed along these chains have
different levels of associated value and loss. Typically,
crabs sent to the informal markets have lower levels of
loss (Figure 13) but also a lower resale value (Figure 11).
Based on our field experience and interviews with market
vendors, we find crabs that are rejected or damaged
throughout the value chain are sold to markets to help
mitigate loss by realising some value through a quick sale
at a depressed price.
Mud crab mortality rates were found to increase at each
stage in the supply chain. Fishers suffered around 1% recorded losses and median losses went up to 5%
for market vendors, 12% for local collectors and 20% for regional collectors respectively (Figure 13). This
suggests that, while storage and transport time seemed to have no obvious effect on loss, the further
Figure 12 The profit margins on mud crab (per kg) made by fishers and local collectors.
Case Study
A fisher from Antsatsabo relies on
crab fishing for his entire income. He
sells exclusively to local collectors,
but, unlike most other fishers he sells
some of his crabs in the highly prized
"whole/full" grade, for which he
receives 3.7 times the average sale
price. This shows clearly that there is
an appetite amongst collectors for
value added, graded crabs if the right
connections can be made, and
barriers to market removed.

22
along the value chain and thus longer out of the mangrove, the weaker, more stressed and therefore
more susceptible to mortality crabs become.
Once crabs pass through the hands of both local and regional collectors they have, on average, suffered
losses through mortality of around 28% (Table 3). This represents a huge sink in the value chain and a
major barrier, but also an opportunity for stakeholders in the fishery to realise higher profits and returns
on their effort. The opportunity cost of mortality and damage for local collectors was calculated at
138,261,707 MGA annually, between the 14 local collectors surveyed. Reducing this loss to zero would
increase the group’s combined income by 77%.
Mortality and damage were reported at a higher rate by the five license-holding local collectors when
compared to those without a license. It is not currently known what is causing this. One license-holding
local collector reported such a high rate of mortality and damage, around 70%, that his business was
found to be losing tens of millions of MGA a year.
Figure 13. Shows the crabs lost, as a percentage of the total held, by various stakeholders in the value chain.

23
Table 3. Crab loss through the supply chain from fishers to local and then regional collectors.
Stakeholder Stage where loss
occurs Loss
Fisher Transport 1%
Local collectors Storage 7%
Transport 4%
Regional collectors Storage 4%
Transport 15%
Remaining 72%
Cumulative Loss 28%
Table 4. Crab loss through the supply chain for fishers to markets
Stakeholder Stage where loss
occurs Loss
Fisher to Transport 1%
Market Storage 6%
Remaining 93%
Loss 7%
3.6.2 Expenses
The most costly overall, and most widely reported, expense for fishers was their boat, accounting for 43%
of all reported expenses at an average cost of 61,923 MGA per fisher. However, for the 31 fishers that
reported fishing lures as an expense, this was their largest overhead at 91,897 MGA a year on average.
This expense is directly linked to the fishing method they use. Overall, expenses do not appear to have a
large effect on fishers, acting as a value sink of around 2% (in total) of the revenue generated by crab
fishing.
For local collectors, transport was by far the highest reported expense, at an average of ~1 million MGA
per year. This represents a value sink of around 8% of the average annual revenue of a local collector.
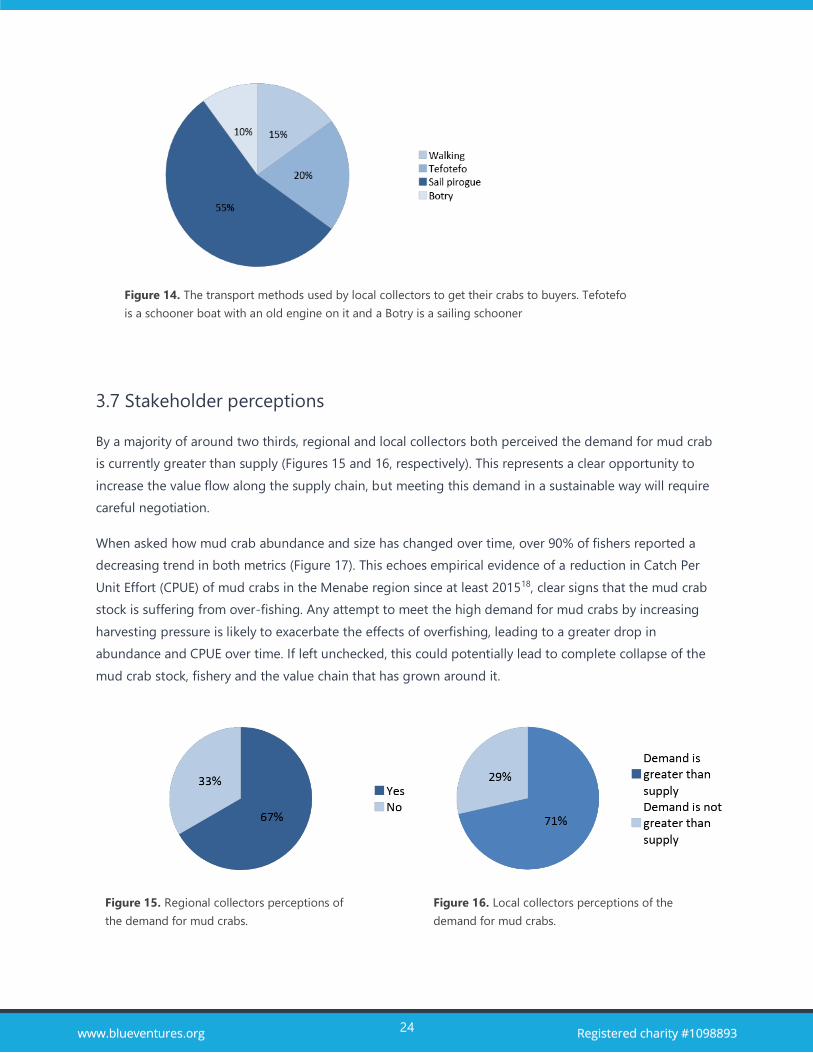
Figure 14 shows the modes of transport used by local collectors to get their mud crabs to the buyers.
24
3.7 Stakeholder perceptions
By a majority of around two thirds, regional and local collectors both perceived the demand for mud crab
is currently greater than supply (Figures 15 and 16, respectively). This represents a clear opportunity to
increase the value flow along the supply chain, but meeting this demand in a sustainable way will require
careful negotiation.
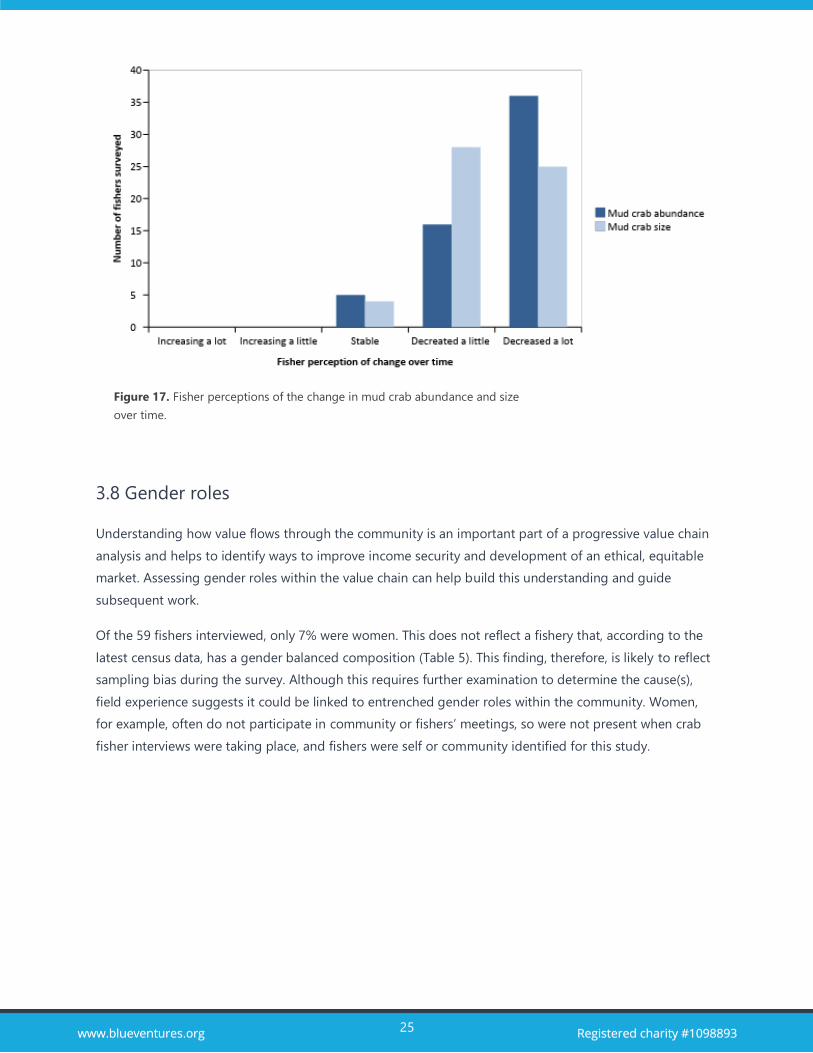
When asked how mud crab abundance and size has changed over time, over 90% of fishers reported a
decreasing trend in both metrics (Figure 17). This echoes empirical evidence of a reduction in Catch Per
Unit Effort (CPUE) of mud crabs in the Menabe region since at least 201518, clear signs that the mud crab
stock is suffering from over-fishing. Any attempt to meet the high demand for mud crabs by increasing
harvesting pressure is likely to exacerbate the effects of overfishing, leading to a greater drop in
abundance and CPUE over time. If left unchecked, this could potentially lead to complete collapse of the
mud crab stock, fishery and the value chain that has grown around it.
Figure 14. The transport methods used by local collectors to get their crabs to buyers. Tefotefo
is a schooner boat with an old engine on it and a Botry is a sailing schooner
Figure 15. Regional collectors perceptions of
the demand for mud crabs.
Figure 16. Local collectors perceptions of the
demand for mud crabs.
25
3.8 Gender roles
Understanding how value flows through the community is an important part of a progressive value chain
analysis and helps to identify ways to improve income security and development of an ethical, equitable
market. Assessing gender roles within the value chain can help build this understanding and guide
subsequent work.
Of the 59 fishers interviewed, only 7% were women. This does not reflect a fishery that, according to the
latest census data, has a gender balanced composition (Table 5). This finding, therefore, is likely to reflect
sampling bias during the survey. Although this requires further examination to determine the cause(s),
field experience suggests it could be linked to entrenched gender roles within the community. Women,
for example, often do not participate in community or fishers’ meetings, so were not present when crab
fisher interviews were taking place, and fishers were self or community identified for this study.
Figure 17. Fisher perceptions of the change in mud crab abundance and size
over time.
26
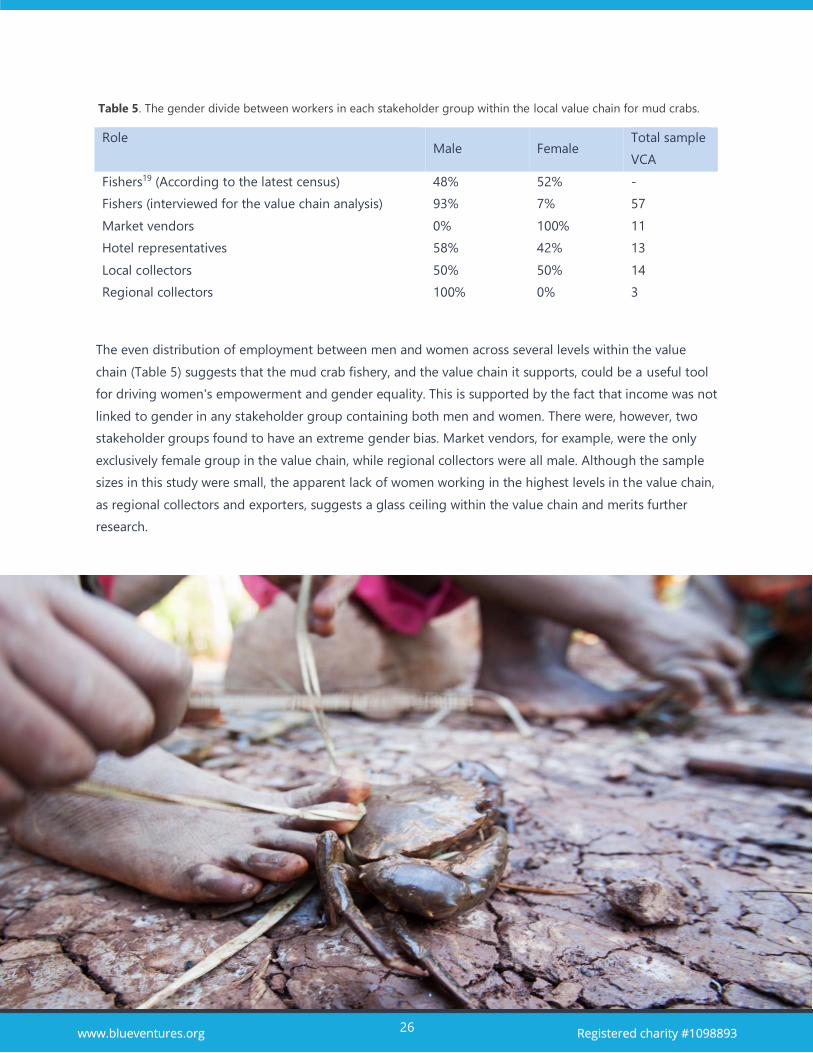
Role Male Female
Total sample
VCA
Fishers19 (According to the latest census) 48% 52% -
Fishers (interviewed for the value chain analysis) 93% 7% 57
Market vendors 0% 100% 11
Hotel representatives 58% 42% 13
Local collectors 50% 50% 14
Regional collectors 100% 0% 3
The even distribution of employment between men and women across several levels within the value
chain (Table 5) suggests that the mud crab fishery, and the value chain it supports, could be a useful tool
for driving women's empowerment and gender equality. This is supported by the fact that income was not
linked to gender in any stakeholder group containing both men and women. There were, however, two
stakeholder groups found to have an extreme gender bias. Market vendors, for example, were the only
exclusively female group in the value chain, while regional collectors were all male. Although the sample
sizes in this study were small, the apparent lack of women working in the highest levels in the value chain,
as regional collectors and exporters, suggests a glass ceiling within the value chain and merits further
research.
Table 5. The gender divide between workers in each stakeholder group within the local value chain for mud crabs.

27
4. Conclusions
The mud crab fishery in the south of Madagascar's Menabe region is a high value but largely unmanaged
fishery that has been showing increasing signs of over-exploitation. Fishers collect mud crabs from local
mangroves, and are sometimes consumed by the family, but more often stored in mud and sold to local
collectors, or – to a lesser extent – directly to a range of customers including hotels. The fishery and
resulting industries are fairly evenly split between men and women. The exceptions are that women
dominate the low-value market sales while men appear to dominate the higher value regional collector
roles.
Stakeholders across the value chain are highly dependent on mud crab for their income, but it is the
fishers that hold the lowest market power. One possible factor contributing to this is the cycles of lending
and debt between local collectors, offering advanced payments that fishers accept in order to keep their
families solvent during seasonal dips in crab abundance. The result of this disparity in market power is
that prices are set by buyers and fishers currently have very little ability to affect this.
As crabs move from one stakeholder in the supply chain to another, they increase in value. Grading is
currently the only mechanism for adding value used by any stakeholder assessed in this study. It is clear,
however, that there are other ways in which value can be added. For example, activities such as mud crab
ranching or freezing, would allow fishers to catch crabs and sell during the low season when prices are
high. These should be assessed for their potential to add value within the chain and give fishers greater
market power.
It is much more common for crabs to lose value than have value added. Mortality and damage represent
the largest sink in the value chain with an opportunity cost (for fishers and local collectors) equal to
around 21% of their combined profits. Although it was not possible to calculate the opportunity cost for
regional collectors, mortality and damage increase in frequency with every stage in the supply chain, so it
is likely the cost is even greater than that observed for local collectors. Damage is the most important
factor determining whether crabs were sold (if healthy and mainly unbroken) or consumed by the family
(if damaged). Consumption as a result of damage may have social and community benefits; however, it
still represents a clear loss in monetary value.
Demand represents the greatest opportunity to increase the value within, but is also the greatest threat
to, the value chain. This is currently higher than supply, meaning that there is an unmet need for a higher
volume of crabs, and possibly value-added products. However, current trends in CPUE and fisher
perceptions show signs of over-exploitation and therefore the industry will have to be careful how this
demand is met. Higher levels of exploitation, an obvious path to meet demand, are likely to exacerbate
28
the situation, resulting in medium- to long-term reduced crab availability and even stock collapse.
Demand could, instead, be met by ranching and/or reducing mortality and damage, realising the value in
this currently wasted portion of the catch.
Finally, geographical location appears to play an important role in fisher earnings, with proximity to the
main commercial hub of Morondava affecting prices, expenses, transport time and overall annual income.
The precise mechanisms for this are not clear, so additional research is necessary to understand what the
drivers are.
5. Recommendations
Based on the value chain analysis of the Menabe mud crab fishery, a number of recommendations have
been listed below that could be used to help improve the value flow within the industry. Other ideas are
already being explored by Blue Ventures, including governance strategies, size limits and other catch
restrictions, and addressing mangrove and ecosystem health. These will not be discussed in this report
but will continue to be considered in future phases of this work.
5.1 Diversify markets
We recommend diversifying markets in the following three ways:
A. Encouraging fishers to practice grading and to sell directly to regional collectors
Explore the avenues available to connect fishers directly to a wider range of buyers. Examine the tactics
used by some fishers already identified as successfully selling crabs above the average sale price, and by
high value grades. This may offer a path for other fishers to charge higher prices for their crabs.
B. Frozen crab meat
Freezing crabs, or shelling for meat and then freezing when crabs are broken or too weak to survive
transport, could be a way to mitigate the losses associated with damage and mortality. One risk to this
process is that undersized crabs could also be taken for frozen crabs, having a negative impact on the
fishery.
C. Hotels
Hotels represent a local market with a demand for healthy premium crabs and crab meat. Fishers,
especially those near the hotels of Belo sur Mer or Morondava, could sell directly to these buyers.
29
5.2 Ranching and fattening
We show in section 3.4 that seasonality has a twofold impact on crab fishers:
A. During periods of high abundance of crabs their value decreases
B. Fishers accept advances from collectors in periods of low crab abundance to maintain family
income, creating cycles of debt
Seasonality can alternatively present an opportunity for increasing the value of mud crabs sold by fishers.
Some of the most effectively managed and most profitable fisheries worldwide are also highly seasonal,
such as the bluefin tuna fishery in the Mediterranean. This fishery, and others like it, avoid flooding the
market with their produce during the high season by ranching. Ranching involves catching wild fish
during the high season and then containing them within ranches for several months before they are
slaughtered or sold to order. For the crab fishery, this practice could have multiple benefits, providing
time for crabs to grow in size so that they obtain a higher price when they are eventually sold, and it
would allow crabs to be fed into the market slowly, keeping their price high. This would increase the
market power held by fishers, who would be able to have an influence on how prices are set.
Ranching could have the added benefit of reducing levels of dependency seen between fishers and local
collectors. One explanation given for the reliance fishers have on advances from local collectors was that
they keep families solvent during the low season when crabs (and therefore income) are scarce. Ranching
could help artificially smooth seasonal peaks and troughs in supply and price, allowing fishers a constant
source of income without reliance on advances during the low season.
This being said, although ranching has the potential to provide clear benefits to fishers, the practice is
currently illegal in Madagascar, and we are not able to recommend it as a feasible option. Fattening, on
the other hand, is legal and easier to put in place, with low-yield crabs kept for a couple of weeks only, in
order to be fed until they reach full-yield. Given the current legal context in Madagascar, we recommend
exploring fattening as way to increase crab value at the village level.
5.3 Mortality and damage
In section 3.6.1 we show that rates of crab mortality and damage are extremely high within the fishery and
associated value chain. There is a huge opportunity cost associated with this that could be reduced within
the value chain if a method for decreasing mortality and damage can be found. Work should be carried
out with local fishers, collectors and possibly academic institutions, to explore opportunities for
addressing this issue.

30
5.4 Mortality for license holding local collectors
Crab mortality and damage were reported at greater rates by local collectors who own a license when
compared to those that do not. It is important to know if the observed relationship reflects reality, or in
fact represents bias as some point in the survey.
5.5 Reduce indebtedness
We recommend promoting a culture of money management and saving amongst fishers to reduce
indebtedness, fishers’ vulnerability and their dependency on collectors. This will empower fishers within
the market, creating the opportunity for fishers to set crab prices. Loan and savings groups among crab
fishermen have been identified as a potentially efficient way to reach this objective.
31
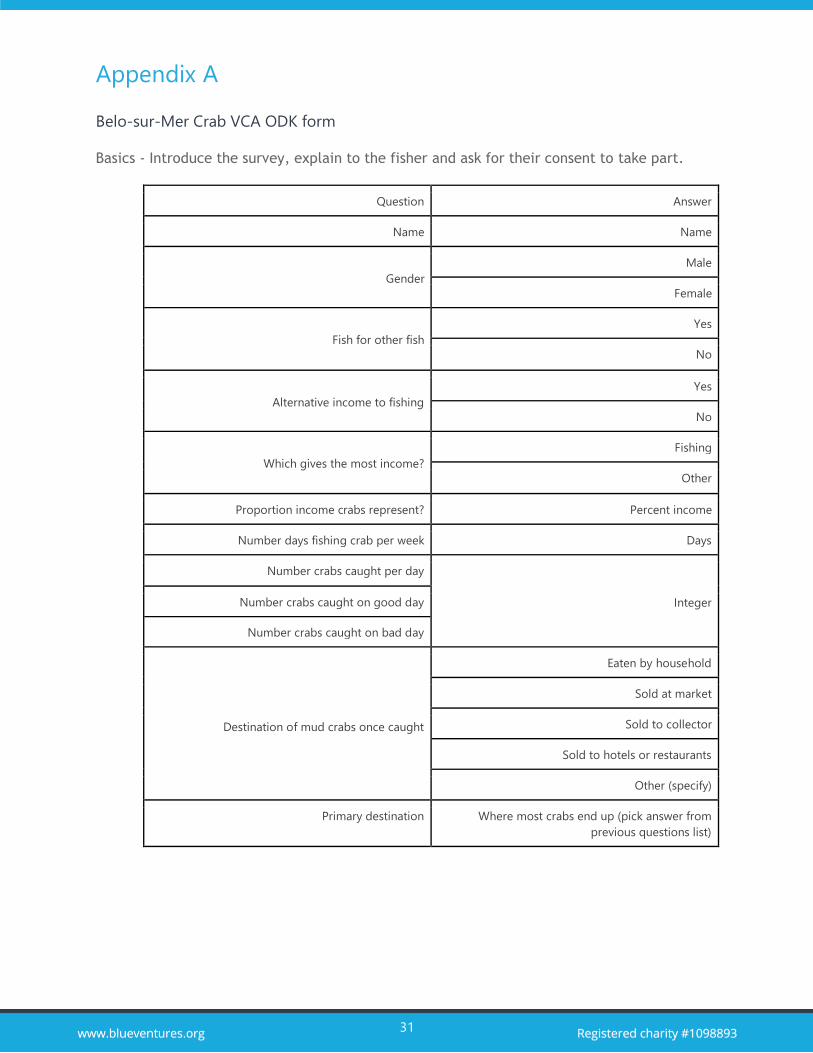
Appendix A
Belo-sur-Mer Crab VCA ODK form
Basics - Introduce the survey, explain to the fisher and ask for their consent to take part.
Question Answer
Name Name
Gender
Male
Female
Fish for other fish
Yes
No
Alternative income to fishing
Yes
No
Which gives the most income?
Fishing
Other
Proportion income crabs represent? Percent income
Number days fishing crab per week Days
Number crabs caught per day
Integer Number crabs caught on good day
Number crabs caught on bad day
Destination of mud crabs once caught
Eaten by household
Sold at market
Sold to collector
Sold to hotels or restaurants
Other (specify)
Primary destination Where most crabs end up (pick answer from
previous questions list)

32
Destination market
Question Answer
Who sells your crabs? Myself
Family
Other
How often do your crabs get sold?
Every trip
More than once per week
Once per week
Three times a month
Twice a month
Once a month
Less than once a month
How much crabs sold? Volume
Then repeat questions on crab info, see page 37
Destination collector
Question Answer
Number regular collectors crab sold to
Integer
Number opportunistic collectors crab sold to
Number/ weight crabs sold in a week Integer/ weight
When is high season for collectors?
Month(s)
When is low season for collectors?
Collector name Text (name)
Collector location Text (location)
Collector phone Telephone number
Collector type Regular
Opportunistic
Yes

33
Does collector live in this village? No
If no, how do you sell crabs to them?
Collector visits village
You go to collector’s village
How often does collector come?
Every trip
More than once per week
Once per week
Three times a month
Twice a month
Once a month
Less than once a month
Where do you deliver crabs? Village(s)
How often do you deliver the crabs?
Every trip
More than once per week
Once per week
Three times a month
Twice a month
Once a month
Less than once a month
How are the crabs transported?
Sailing pirogue
Rowing pirogue
Motor pirogue
Botry
Tuftuf
Motor boat
Car
Zebu
Walking
Other (specify)
Rice bag
34
Then repeat questions on crab info, see page 37
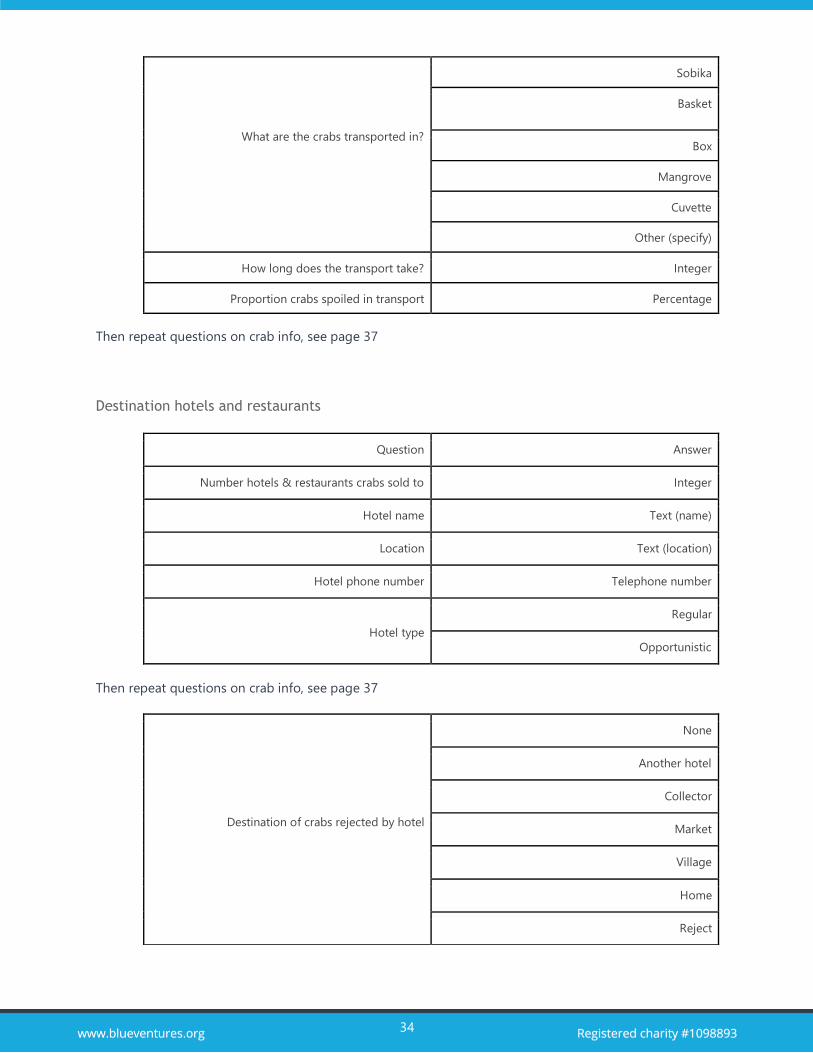
Destination hotels and restaurants
Question Answer
Number hotels & restaurants crabs sold to Integer
Hotel name Text (name)
Location Text (location)
Hotel phone number Telephone number
Hotel type
Regular
Opportunistic
Then repeat questions on crab info, see page 37
What are the crabs transported in?
Sobika
Basket
Box
Mangrove
Cuvette
Other (specify)
How long does the transport take? Integer
Proportion crabs spoiled in transport Percentage
Destination of crabs rejected by hotel
None
Another hotel
Collector
Market
Village
Home
Reject
35
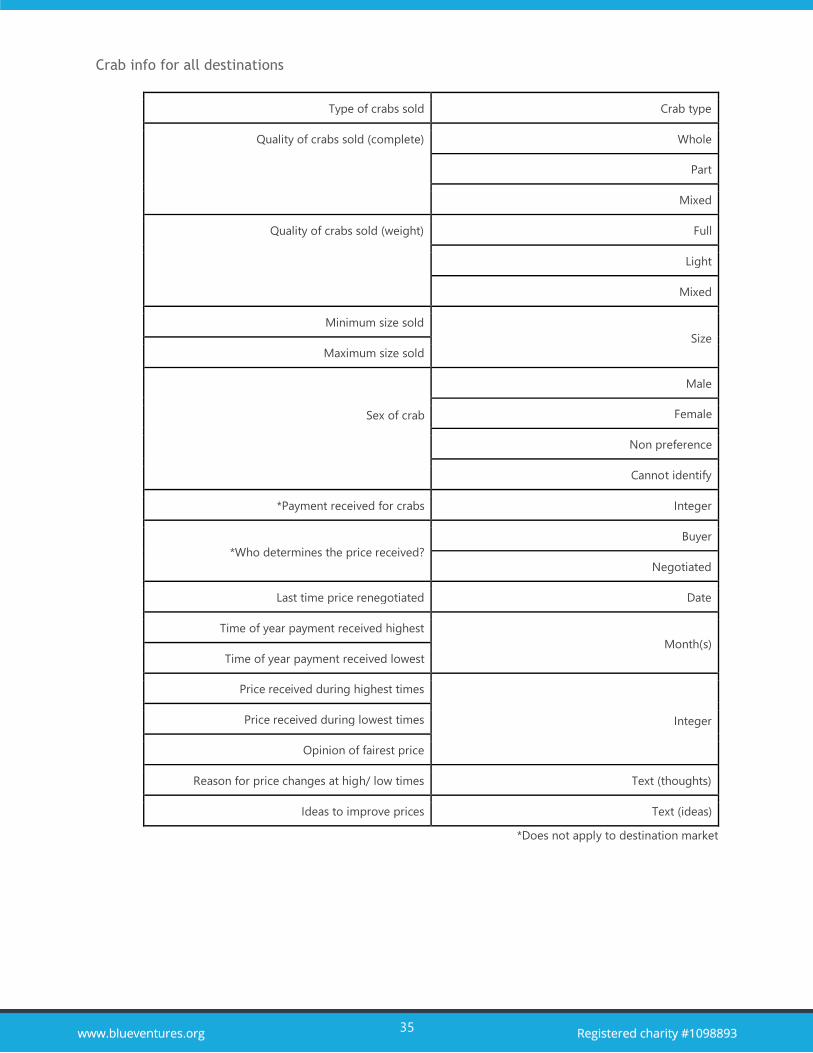
Crab info for all destinations
Type of crabs sold Crab type
Quality of crabs sold (complete) Whole
Part
Mixed
Quality of crabs sold (weight) Full
Light
Mixed
Minimum size sold
Size
Maximum size sold
Sex of crab
Male
Female
Non preference
Cannot identify
*Payment received for crabs Integer
*Who determines the price received?
Buyer
Negotiated
Last time price renegotiated Date
Time of year payment received highest
Month(s)
Time of year payment received lowest
Price received during highest times
Integer Price received during lowest times
Opinion of fairest price
Reason for price changes at high/ low times Text (thoughts)
Ideas to improve prices Text (ideas)
*Does not apply to destination market
36
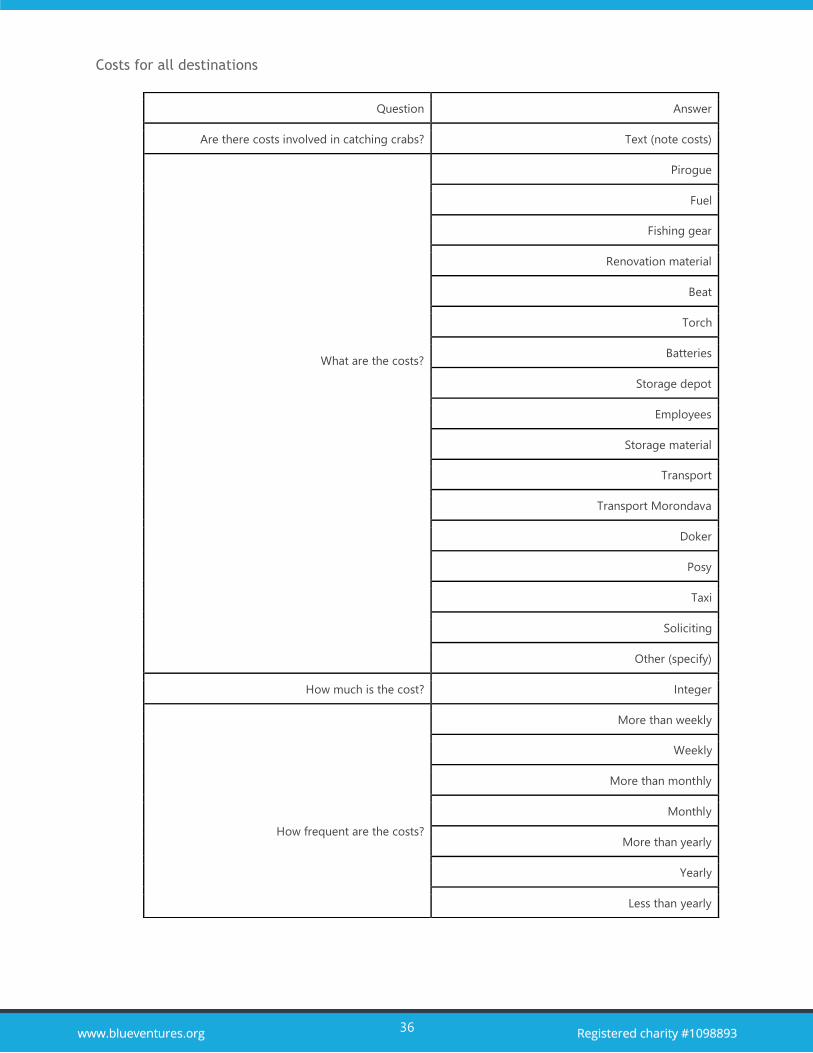
Costs for all destinations
Question Answer
Are there costs involved in catching crabs? Text (note costs)
What are the costs?
Pirogue
Fuel
Fishing gear
Renovation material
Beat
Torch
Batteries
Storage depot
Employees
Storage material
Transport
Transport Morondava
Doker
Posy
Taxi
Soliciting
Other (specify)
How much is the cost? Integer
How frequent are the costs?
More than weekly
Weekly
More than monthly
Monthly
More than yearly
Yearly
Less than yearly
37
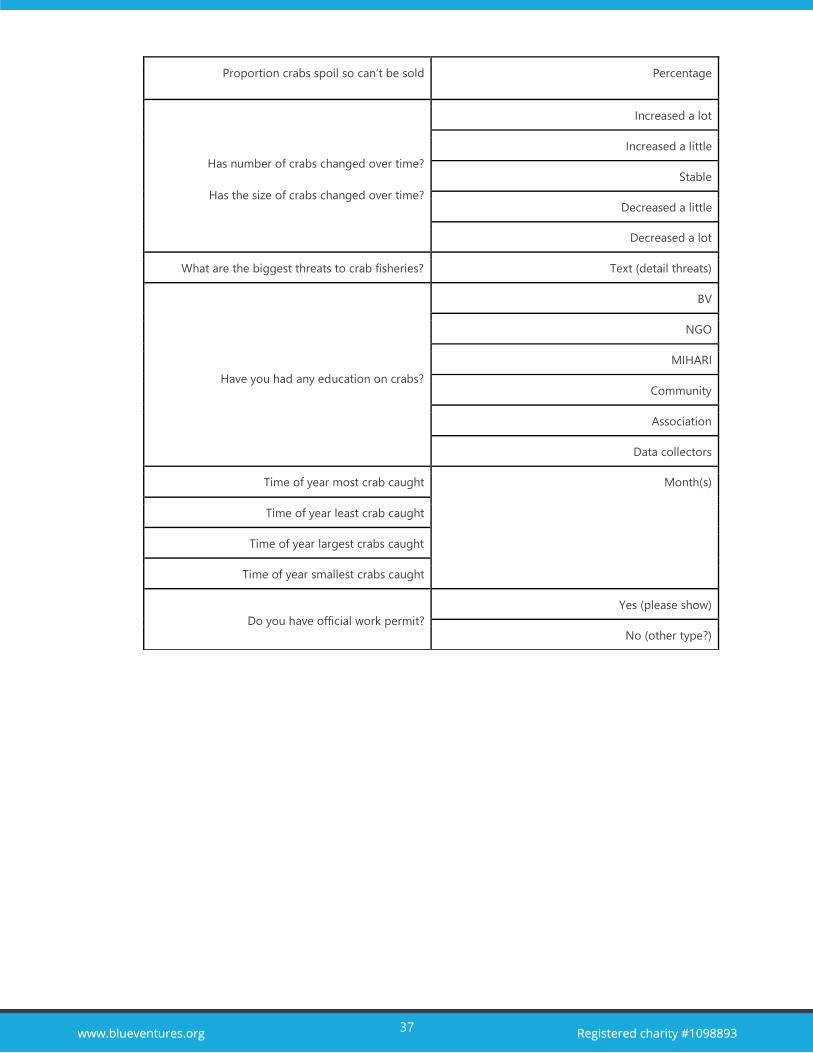
Proportion crabs spoil so can’t be sold Percentage
Has number of crabs changed over time?
Has the size of crabs changed over time?
Increased a lot
Increased a little
Stable
Decreased a little
Decreased a lot
What are the biggest threats to crab fisheries? Text (detail threats)
Have you had any education on crabs?
BV
NGO
MIHARI
Community
Association
Data collectors
Time of year most crab caught Month(s)
Time of year least crab caught
Time of year largest crabs caught
Time of year smallest crabs caught
Do you have official work permit?
Yes (please show)
No (other type?)

38
Collector Survey
Question Answer
Name Text (name)
Gender
Male
Female
How long have you been trading in crabs? Text (note years and months)
Is crab collection your only activity?
Yes
No
What proportion of your activities is seafood trade?
Percent What proportion of your seafood purchases is
crabs?
Which villages do you collect crab? Text (village)
Do you travel to collect crabs yourself?
Yes
No
How are the crabs transported?
Sailing pirogue
Rowing pirogue
Motor pirogue
Botry
Tuftuf
Motor boat
Car
Zebu
Walking
Other (specify)
What are the crabs transported in?
Rice bag
Sobika
Basket
Box
Mangrove
39
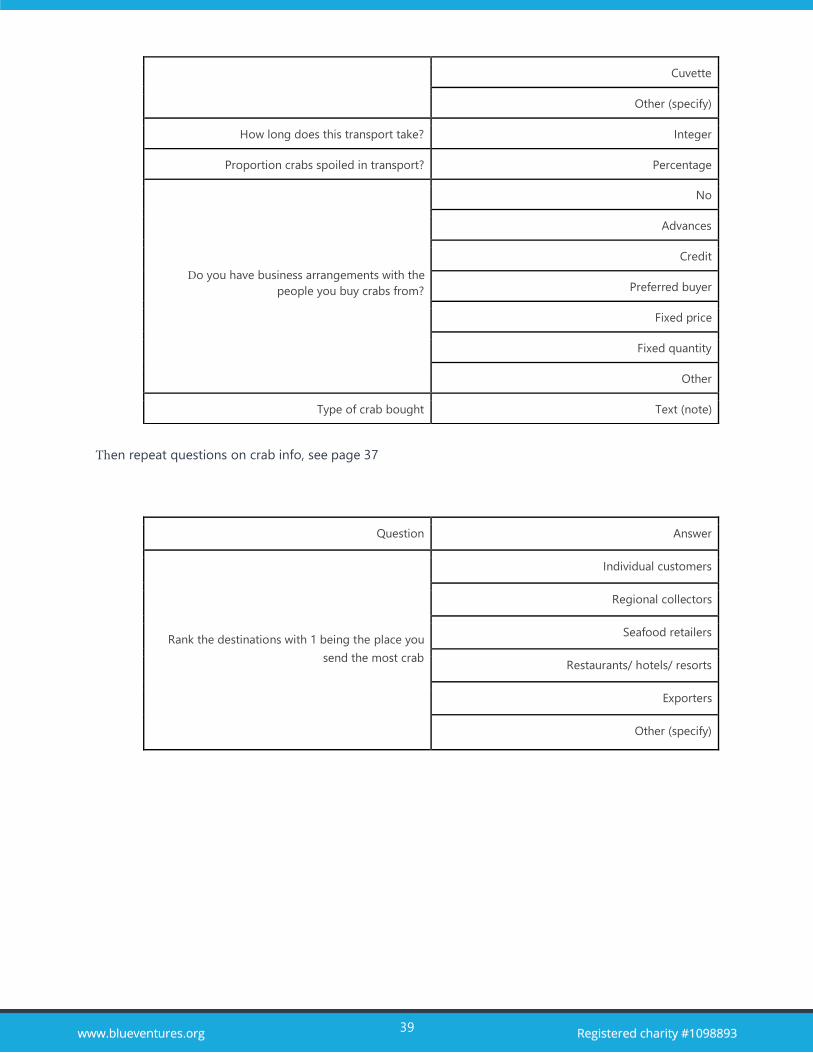
Then repeat questions on crab info, see page 37
Question Answer
Rank the destinations with 1 being the place you
send the most crab
Individual customers
Regional collectors
Seafood retailers
Restaurants/ hotels/ resorts
Exporters
Other (specify)
Cuvette
Other (specify)
How long does this transport take? Integer
Proportion crabs spoiled in transport? Percentage
Do you have business arrangements with the
people you buy crabs from?
No
Advances
Credit
Preferred buyer
Fixed price
Fixed quantity
Other
Type of crab bought Text (note)
40
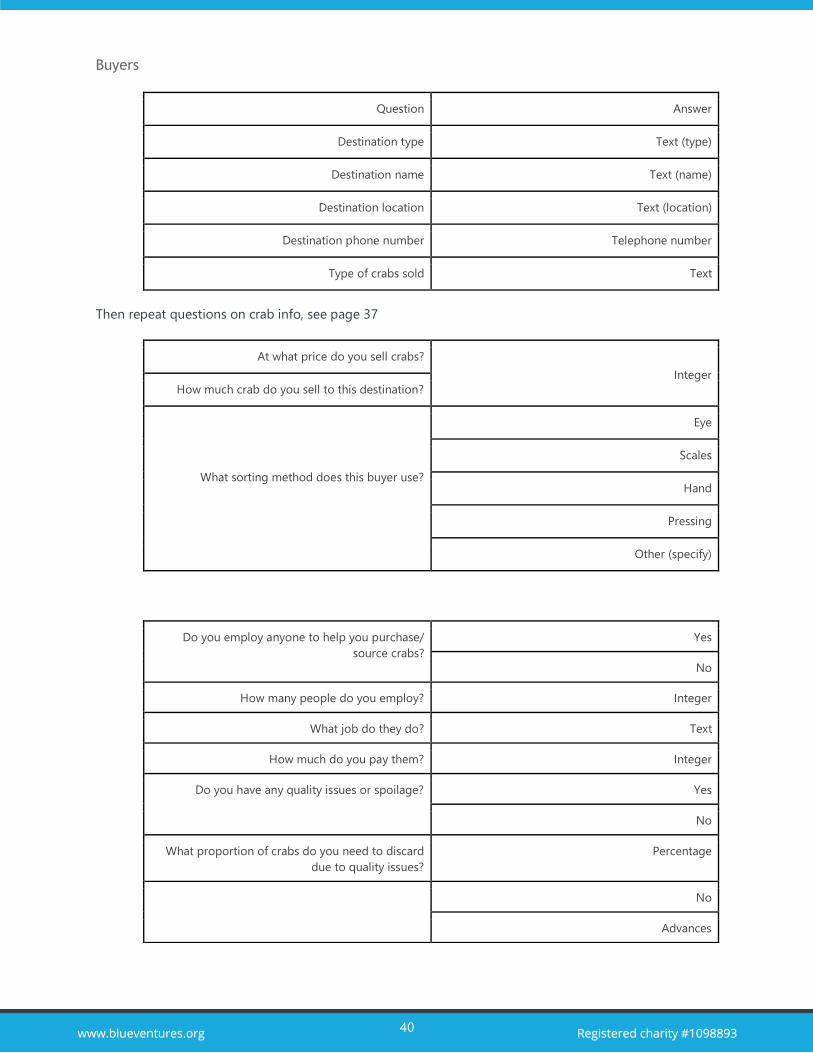
Buyers
Question Answer
Destination type Text (type)
Destination name Text (name)
Destination location Text (location)
Destination phone number Telephone number
Type of crabs sold Text
Then repeat questions on crab info, see page 37
At what price do you sell crabs?
Integer
How much crab do you sell to this destination?
What sorting method does this buyer use?
Eye
Scales
Hand
Pressing
Other (specify)
Do you employ anyone to help you purchase/
source crabs?
Yes
No
How many people do you employ? Integer
What job do they do? Text
How much do you pay them? Integer
Do you have any quality issues or spoilage? Yes
No
What proportion of crabs do you need to discard
due to quality issues?
Percentage
No
Advances

41
Do you have any pre-arrangement with your
buyers?
Credit
Preferred buyer
Fixed price
Fixed quantity
Other (specify)
What do you do with crabs refused by sellers?
Eat
Sell in village
Reject
Market
Hotel
Buyer
Other (specify)
Are you always able to buy enough crabs to meet
your sales demands?
Yes (detail)
No (detail)
Does demand change through the year?
Yes
No
When is demand highest?
Month(s)
When is demand lowest?
Last time you sell crabs how many did you sell?
Integer
How much was this total?
What do you think is a fair price to sell crab?
Do you have ideas to improve prices? Text (ideas)
Do you store crabs? Yes
No
How long do you store crabs? Integer
Where do you store crabs?
House
Building
Shelter
Mangrove

42
Fridge
Kitchen
Other
In what do you store the crabs?
Rice bag
Sobika
Basket
Box
Mangrove
Cuvette
Other (specify)
Do you store the crabs with mud?
Yes
No
Proportion crabs spoiled during storage? Percentage
Do you deliver crabs to buyers?
Yes
No
Where do you deliver crabs? Text (villages)
How are the crabs transported?
Sailing pirogue
Rowing pirogue
Motor pirogue
Botry
Tuftuf
Motor boat
Car
Zebu
Walking
Other (specify)
Rice bag
Sobika
Basket
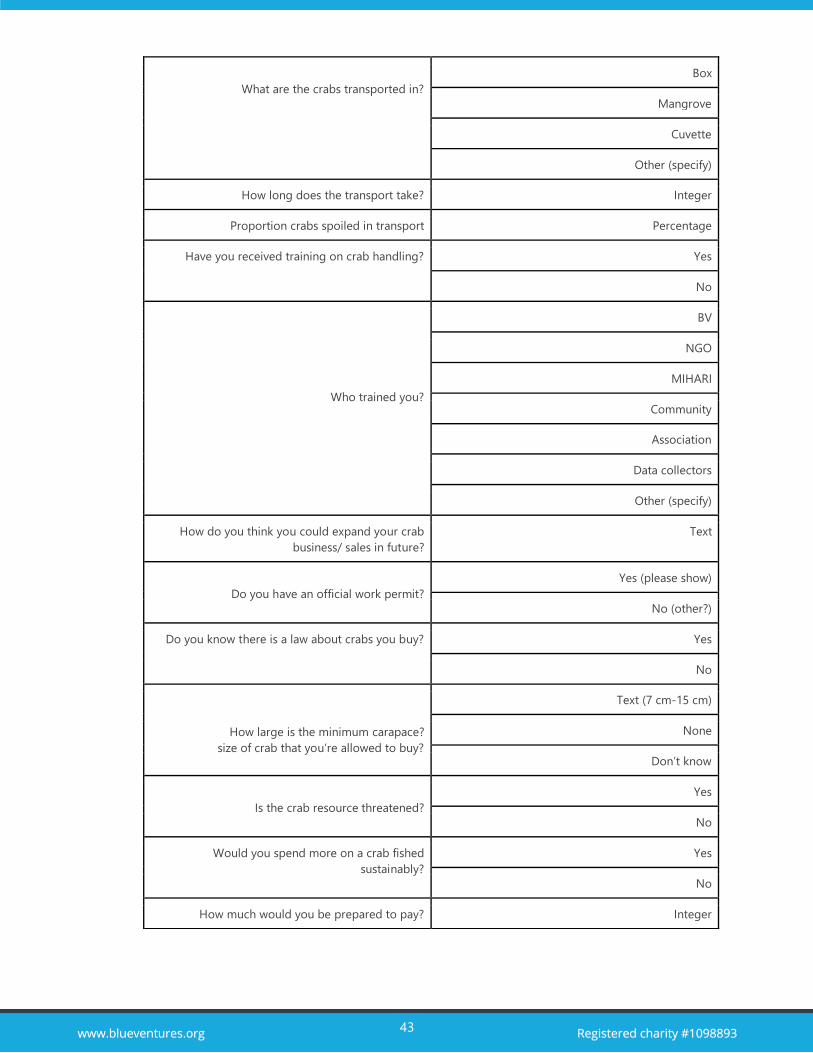
43
What are the crabs transported in?
Box
Mangrove
Cuvette
Other (specify)
How long does the transport take? Integer
Proportion crabs spoiled in transport Percentage
Have you received training on crab handling? Yes
No
Who trained you?
BV
NGO
MIHARI
Community
Association
Data collectors
Other (specify)
How do you think you could expand your crab
business/ sales in future?
Text
Do you have an official work permit?
Yes (please show)
No (other?)
Do you know there is a law about crabs you buy? Yes
No
How large is the minimum carapace?
size of crab that you’re allowed to buy?
Text (7 cm-15 cm)
None
Don’t know
Is the crab resource threatened?
Yes
No
Would you spend more on a crab fished
sustainably?
Yes
No
How much would you be prepared to pay? Integer

44
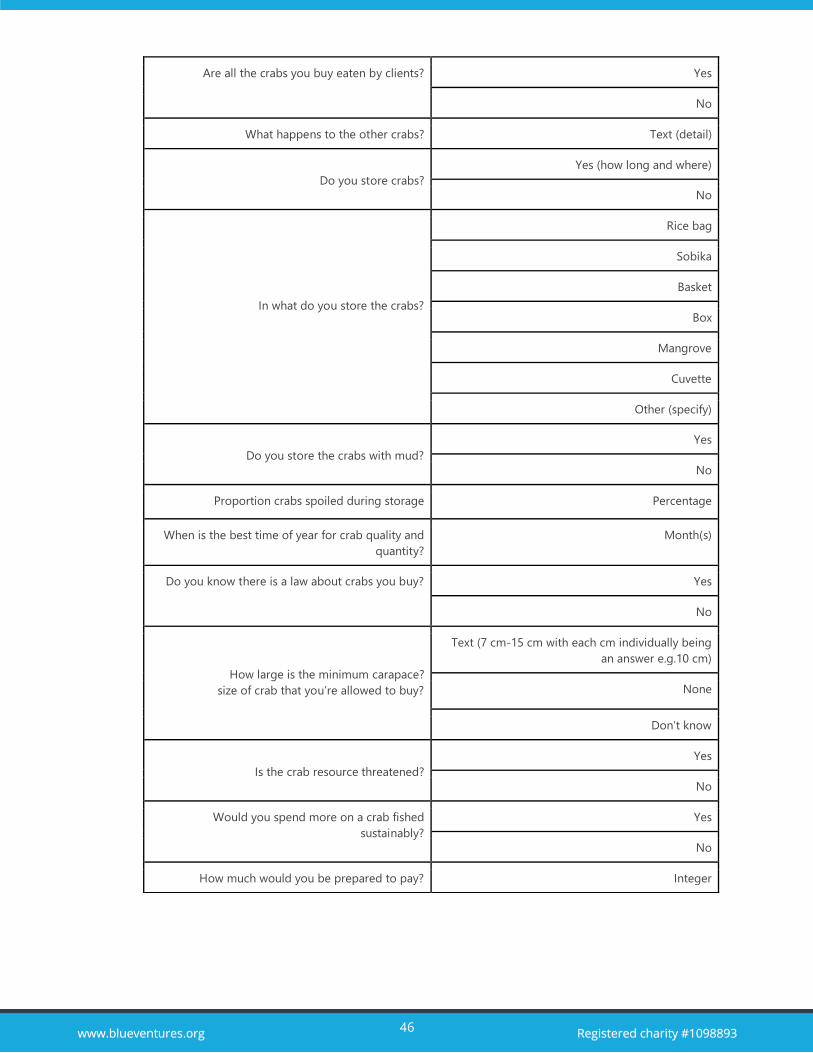
Hotel survey
Question Answer
Hotel name Text (name)
Hotel location Text (location)
Hotel interviewee Name of interviewee
Role/ job of interviewee Role/ job of interviewee
Do you propose a menu or do you work like a
‘table d’hote’?
Menu
Table d’hote
How many crab dishes do you prepare? Integer
How many dishes require…
...parts of crab. ...shelled crab ...whole crab Integer
List dishes that require…
...parts of crab ...shelled crab ...whole crab Text (list dishes)
What type of crab do you need for this dish? Text (specify)
Do you need more male or female?
Male
Female
What is the minimum size needed for this dish?
Integer What is the maximum size needed for this dish?
What is the mean number of crabs you use for this
dish?
Decimal
How much is the average price of these types of
meals?
Integer
For dishes that require shelled crabs what type of
crabs do you need?
Text (specify)
What is the minimum size needed for this dish?
Integer What is the maximum size needed for this dish?
What is the mean number of crabs you use for this
dish?
Decimal
How much is the average price of these types of
meals?
Integer
Male
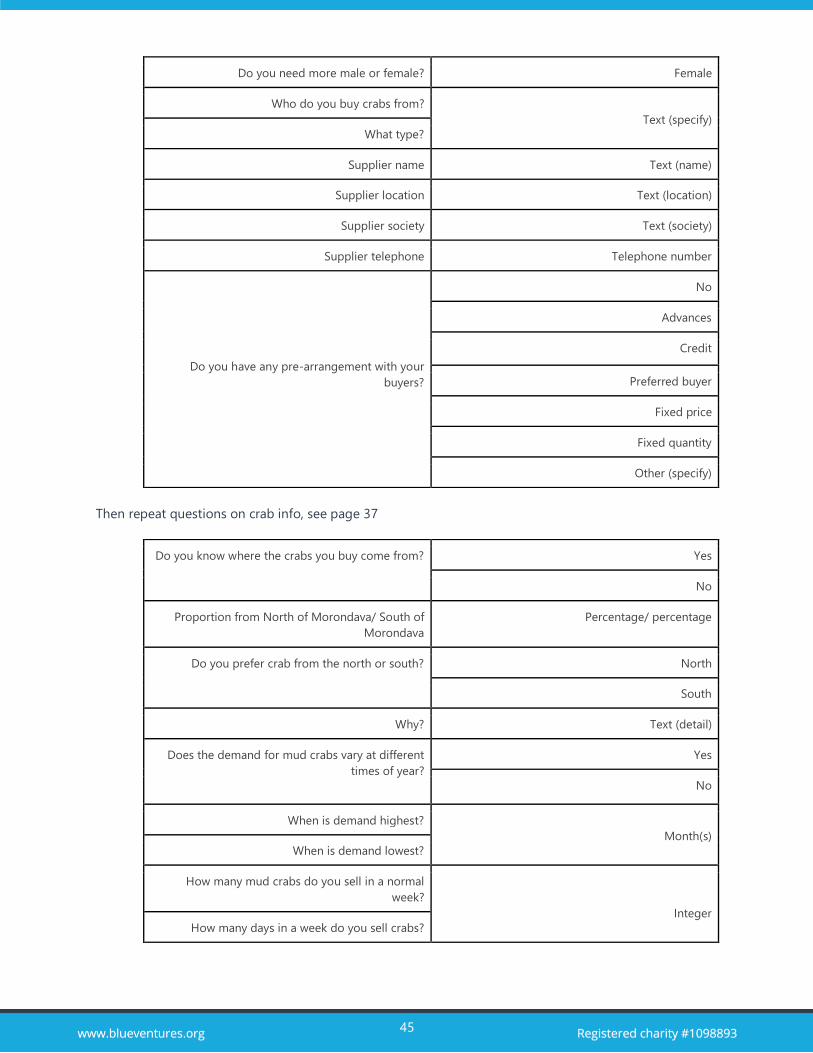
45
Then repeat questions on crab info, see page 37
Do you need more male or female? Female
Who do you buy crabs from?
Text (specify)
What type?
Supplier name Text (name)
Supplier location Text (location)
Supplier society Text (society)
Supplier telephone Telephone number
Do you have any pre-arrangement with your
buyers?
No
Advances
Credit
Preferred buyer
Fixed price
Fixed quantity
Other (specify)
Do you know where the crabs you buy come from? Yes
No
Proportion from North of Morondava/ South of
Morondava
Percentage/ percentage
Do you prefer crab from the north or south? North
South
Why? Text (detail)
Does the demand for mud crabs vary at different
times of year?
Yes
No
When is demand highest?
Month(s)
When is demand lowest?
How many mud crabs do you sell in a normal
week?
Integer
How many days in a week do you sell crabs?
46
Are all the crabs you buy eaten by clients? Yes
No
What happens to the other crabs? Text (detail)
Do you store crabs?
Yes (how long and where)
No
In what do you store the crabs?
Rice bag
Sobika
Basket
Box
Mangrove
Cuvette
Other (specify)
Do you store the crabs with mud?
Yes
No
Proportion crabs spoiled during storage Percentage
When is the best time of year for crab quality and
quantity?
Month(s)
Do you know there is a law about crabs you buy? Yes
No
How large is the minimum carapace?
size of crab that you’re allowed to buy?
Text (7 cm-15 cm with each cm individually being
an answer e.g.10 cm)
None
Don’t know
Is the crab resource threatened?
Yes
No
Would you spend more on a crab fished
sustainably?
Yes
No
How much would you be prepared to pay? Integer
47
References
1Gardner, C.J., Rocliffe, S., Gough, C., Levrel, A., Singleton, R.L., Vincke, X. and Harris, A., (2017) Value Chain Challenges
in Two Community-Managed Fisheries in Western Madagascar: Insights for the Small-Scale Fisheries Guidelines.
In The Small-Scale Fisheries Guidelines (pp. 335-354). Springer, Cham.
2Ibid.
3University of Notre Dame, Notre Dame Global Adaptation Initiative, 2018 - University of Notre Dame Notre Dame
Global Adaptation Initiative (last accessed 17/09/2018).
4 Jones, B. (2011) Socio-economic Monitoring: A baseline assessment of the fishing villages of the Kirindy-Mite MPA,
Blue Ventures Conservation Report.
5Blue Ventures 2018 unpublished data.
6Ibid.
7 Signa, D; Yvergniaux, Y; Kasprzyk, Z. FAO Aquaculture Newsletter; Rome Iss. 52, (2014): 24-26.
8Blue Ventures 2018 unpublished data.
9Global wild capture production peaked at about 44,670 tonnes in 2011 and then decreased to about 38,652 tonnes
in 2014. Wild capture fishing also supports an enormous aquaculture industry, where wild caught juveniles are
fattened to adult size, producing 183,852 tonnes in 2014.
https://public.tableau.com/profile/abigail.leadbeater#!/vizhome/crab_workshop_export/StatistiquesNationales?publis
h=yes
10 Lévêque, Emeline (2017). Crab population and fishery diagnostic, Belo sur Mer, Madagascar.
11 Yvergniaux Y, Signa D., Enhancing value-chain performance for mud crab in Madagascar, Smartfish -
http://www.fao.org/3/a-br806e.pdf (last accessed 17/09/2018)
12Kaplinsky R, Morris M (2000) A handbook for value chain research. Report for IDRC. 113 pp.
13 Ibid
14Brown EO, Perez ML, Garces LR, Ragaza RJ, Bassig RA, Zaragoza EC (2010) Value chain analysis for sea cucumber in
the Philippines. Studies & Reviews 2120. The WorldFishCenter, Penang Malaysia, 44 pp.
15 One of the regional collectors interviewed had recently switched to a local collector license. He was, however,
interviewed from his perspective as a regional collector, in which position he had more years of experience than the
other two regional collectors combined.
16 Blue Ventures, Unpublished data.
17 Direction Régionale des Ressources Halieutiques et de la Peche (DRRHP), Menabe, 2017. Statistique Recap, Tableau
Recapitulatif des Statistiques Annee 2016 (Morondava et Belo) (data shared internally).
18Blue Ventures, 2018 unpublished data.
19Blue Ventures 2018 unpublished data