Valuations for Financial Reporting
29
L ENS Valuations for Financial Reporting - Key considerations under COVID-19 Situation Disclaimer: This presentation captures the personal views / approaches / understanding of the presenter and does not necessarily represent the views of any organization. Case studies are based on hypothetical numbers and meant for illustration purposes only. L ENS An initiative by Unithos Business Advisors Private Limited L ENS
Transcript of Valuations for Financial Reporting

L ENS
Valuations for Financial
Reporting
- Key considerations under COVID-19
Situation
Disclaimer: This presentation captures the personal views / approaches / understanding of the presenter and does
not necessarily represent the views of any organization. Case studies are based on hypothetical numbers and meant
for illustration purposes only.
L ENS
An initiative by
Unithos Business Advisors Private LimitedL ENS
L ENSDisclaimer
Disclaimer:
• This presentation captures the personal views / approaches / understanding of the presenter and does not necessarily represent the views of any organization.
• This presentation is illustrative training material for informational purposes only and should not be copied, disclosed or circulated or referred to in whole or in
part in any correspondence or discussion or in any document or anywhere without prior written consent of Unithos Business Advisors Private Limited. Reader
should complete its own research and due diligence to the extent it considers necessary for any use or taking any action based on this presentation.
• While preparation of this note, we have drawn inspiration from inputs / approaches shared in public sources including presentations by Prof. Aswath
Damodaran.
• No copyright infringement is intended.
• Unithos Business Advisors Private Limited shall not be liable to anyone for any reason and under any circumstances.
2
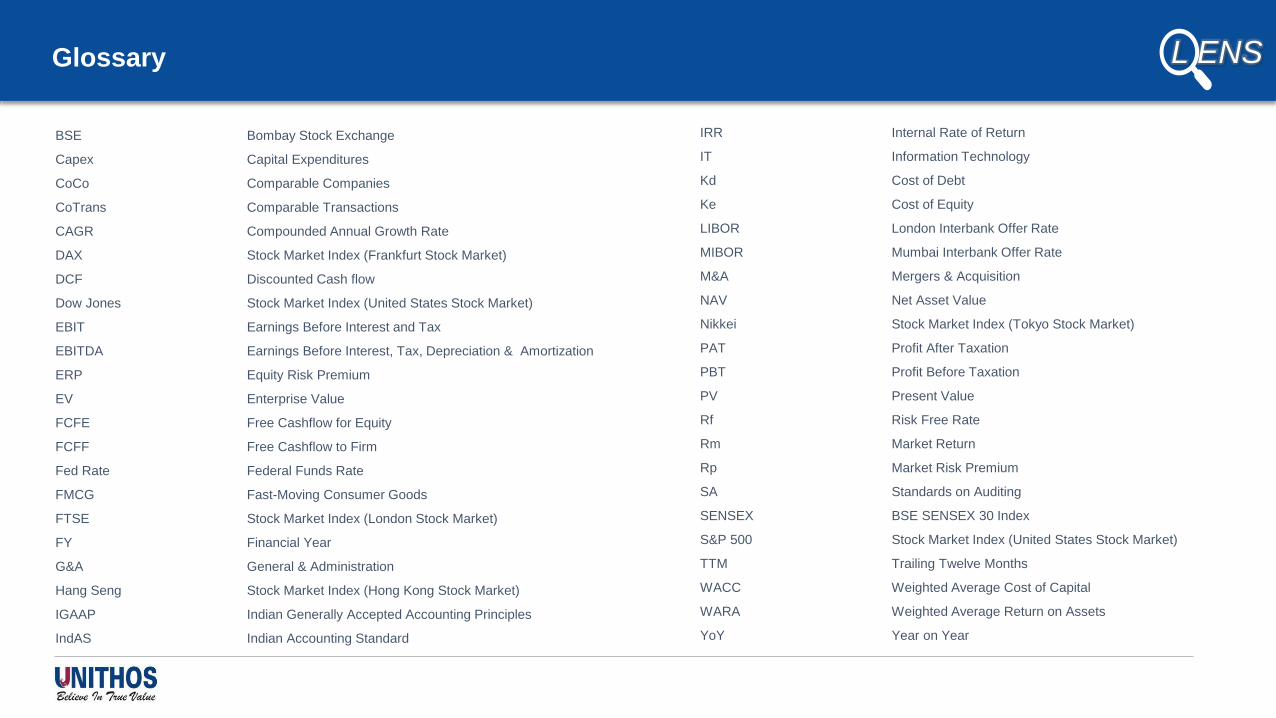
L ENSGlossary
BSE Bombay Stock Exchange
Capex Capital Expenditures
CoCo Comparable Companies
CoTrans Comparable Transactions
CAGR Compounded Annual Growth Rate
DAX Stock Market Index (Frankfurt Stock Market)
DCF Discounted Cash flow
Dow Jones Stock Market Index (United States Stock Market)
EBIT Earnings Before Interest and Tax
EBITDA Earnings Before Interest, Tax, Depreciation & Amortization
ERP Equity Risk Premium
EV Enterprise Value
FCFE Free Cashflow for Equity
FCFF Free Cashflow to Firm
Fed Rate Federal Funds Rate
FMCG Fast-Moving Consumer Goods
FTSE Stock Market Index (London Stock Market)
FY Financial Year
G&A General & Administration
Hang Seng Stock Market Index (Hong Kong Stock Market)
IGAAP Indian Generally Accepted Accounting Principles
IndAS Indian Accounting Standard
IRR Internal Rate of Return
IT Information Technology
Kd Cost of Debt
Ke Cost of Equity
LIBOR London Interbank Offer Rate
MIBOR Mumbai Interbank Offer Rate
M&A Mergers & Acquisition
NAV Net Asset Value
Nikkei Stock Market Index (Tokyo Stock Market)
PAT Profit After Taxation
PBT Profit Before Taxation
PV Present Value
Rf Risk Free Rate
Rm Market Return
Rp Market Risk Premium
SA Standards on Auditing
SENSEX BSE SENSEX 30 Index
S&P 500 Stock Market Index (United States Stock Market)
TTM Trailing Twelve Months
WACC Weighted Average Cost of Capital
WARA Weighted Average Return on Assets
YoY Year on Year

L ENS
-28.6%
-20.0%
-23.2%
-20.0%
-25.0%
-16.3%
-24.8%
SENSEX S&P 500 DOW JONES NIKKEI 225 DAX HANGSENG FTSE 100
Impact of COVID-19 in Key Global Indices
1 January 2020 to 31 March 2020
Stock Markets reaction to the COVID-19 situation – Most of the key global indices have recorded decline of over 20%, Key sector indices in India recorded a negative growth since 1 January 2020
Source: Secondary Research including BSE website, Yahoofinance
Basic Material
-32.3%
Consumer
Discretionary
-30.9%
Energy
-29.3%
FMCG
-10.1%
Finance
-38.5%
Healthcare
-9.5%
Telecom
-12.9%
Utilities
-27.0%
Industrials
-36.1%
IT
-17.0%
1 January 2020 to 31 March 2020
Source: Secondary Research including BSE website
L ENS
How does this impact Financial Reporting ?
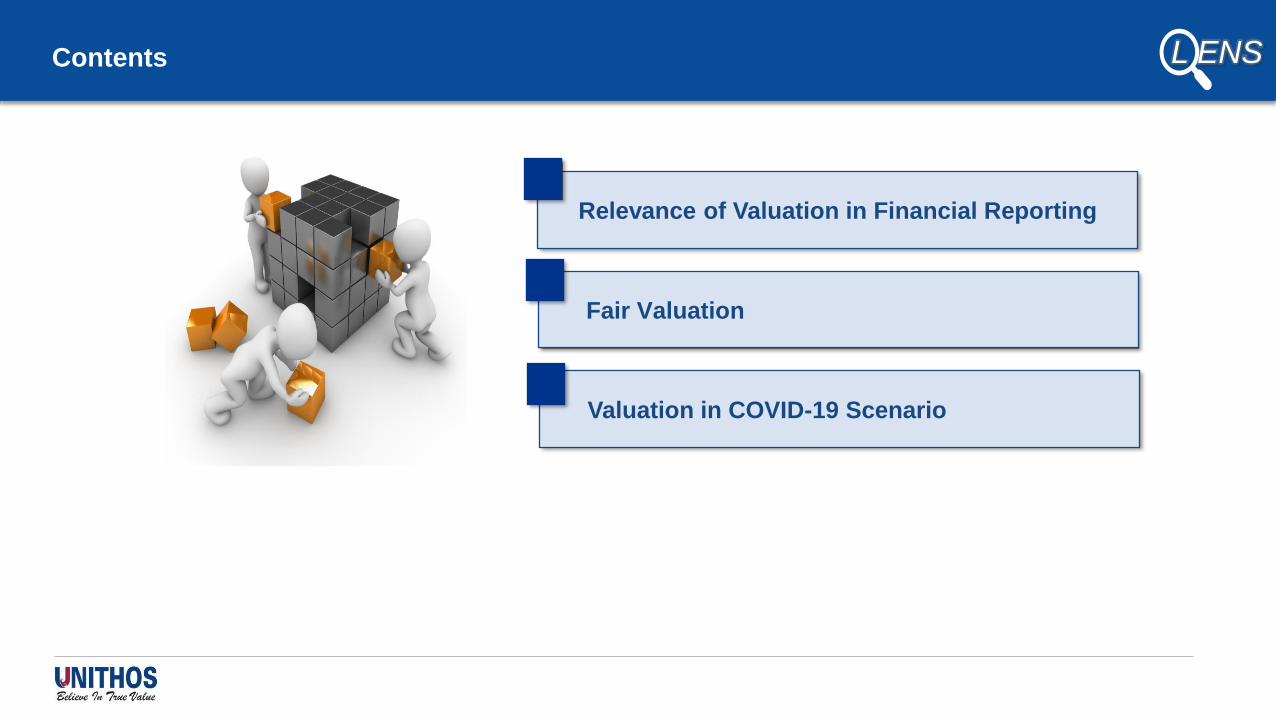
L ENSContents
Relevance of Valuation in Financial Reporting
Valuation in COVID-19 Scenario
Fair Valuation

L ENSContents
Relevance of Valuation in Financial Reporting

L ENSFinancial Reporting is in transition phase from reporting Historical Cost of investment to Fair Value of Invested Capital. However, Fair Value of the Business would include growth assets / self created intangibles
Equity
Debt
Fixed Assets (FA)
Net Working
Capital (NWC)
Goodwill on
amalgamation or
merger
Conventional accounting Ind AS / IFRS / USGAAP
Equity and
Other
Equity
Debt
Fixed Assets (FA)
Net Working
Capital (NWC)
Identified Intangible
Assets (merger,
acquisition,
consolidation)
Goodwill (merger,
acquisition,
consolidation)
Fair Valuation / Market
Valuation
Market
Capital
Market
Value of
Debt
Fixed Assets (FA)
Net Working
Capital (NWC)
Identified Intangible
Assets (Growth
assets)
Goodwill (Growth
prospects)
Historical cost of Assets (i.e
cost incurred)
Fair value of Assets (i.e
current value realizable)
Fair value of the Business
(value of future business
potential)

L ENSTransition to reporting Fair Value of Invested Capital has included some of the identified intangibles
Case Study - Infosys
Source: Secondary Research including
Ace Equity, Company Financials

L ENSMarket Capital factors value of future growth prospects representing growth assets (goodwill, human capital, intangible assets) not captured in the Financial Reports, which can be negative forecasts also
Net worth as at 31 March 2016
(INR Million)Indian GAAP INDAS Market Capital
Infosys 578,260 617,790 2,786,669
Wipro 449,110 468,302 1,391,756
Reliance Industries 2,469,050 2,349,120 3,081,397
Indian Oil Corporation 774,083 914,057 932,346
TCS 658,628 714,270 4,956,618
Bharti Airtel 497,441 708,285 1,402,687
Tata Steel 324,281 445,135 309,927
Source: Secondary Research including BSE website, Ace Equity, Company Financials

L ENSThese differences in book value and market capital mainly on account of investor expectation of returns and IRR estimate from the tangible and intangible assets
– IRR (Internal Rate of Return)
• Investor expectations of returns from Equity / Debt
– WACC (Weighted Average Cost of Capital
• Returns from assets based on the mix (whether or not recorded in the books)
– WARA (Weighted Average Return on Assets)
• Market premiums and discounts, alternate investment opportunities

L ENSValuer’s perspective is to capture Fair Value of Equity and Debt which would match the Fair Value of total assets (whether or not reported). Investment opportunity can then be evaluated for IRR
Market
value of
Equity
Market
value of
Debt
WARA
Fixed Assets
(FA)
Net Working
Capital (NWC)
Identified
Intangible Assets
Goodwill
Ke
Kd
Return on FA
Return on
identified
intangibles
Return on
Goodwill
Return on
NWC
Premiums (for
buying control,
synergies, etc)
Purchase
Consideration
IRRWACC
Fair Value
Discounts (for
small size, lack
of marketability/
control, etc)
Leverage for
negotiation

L ENSGiven the current transition towards Fair Value reporting, valuation is part of the
financial reporting process
Normal instances
where need for
valuation arises
• Fair Value reporting
• Revaluation of fixed assets (land, building, plant and equipment)
• Valuation of intangible assets (brand/trademark, customer relationships, technology, goodwill, etc)
• Business combinations (Purchase Price Allocations)
• Valuation of Investments
• Merger/Demerger situations
• Impairment testing
• Transfer Pricing (Transfer of IP, intangible, equity, related party transactions)
• Valuation of Investments
• Valuation financial assets or financial liabilities (likes compound instruments, options, contingent settlements,
puttable instruments, etc)
• Litigation
• Carve out / spin off / other restructuring situations
L ENSContents
Fair Valuation

L ENSWhat impact due to COVID-19? For answer to this question, we need to stay focused on the definition of Fair Value and normalize any aberrations due to uncertainties
Relative Value
Forced liquidation
Investment value
Transaction priceFair value
Orderly liquidation
Buyer’s Price Seller’s Price
The price that would be received to sell an asset or paid to transfer a liability in an orderly transaction between
market participants at the measurement date.

L ENSStandard Approaches and Methodologies for Valuation
Income based
approach
Market based
approaches
Discounted
Cashflow approach
Cost based
approaches
Net Asset Value (As
per books)
Price of recent
investments
Market multiples –
Comparable
Companies
Market multiples -
Comparable
Transactions
Net Asset Value
(Replacement cost)
Market cap. –
quoted share price
of listed companies
Market approachIncome approach Cost approach
Reproduction cost
method
Replacement cost
method
Relief from Royalty
method
Multi-period Excess
Earnings Method
With and Without
Method or Premium
profit method
Greenfield Method
Distributor Method
Price / Valuation
multiples/Cap rates
Guideline pricing
method
Business Valuation Intangible Asset Valuation
L ENSContents
Valuation in COVID-19 Scenario
L ENS
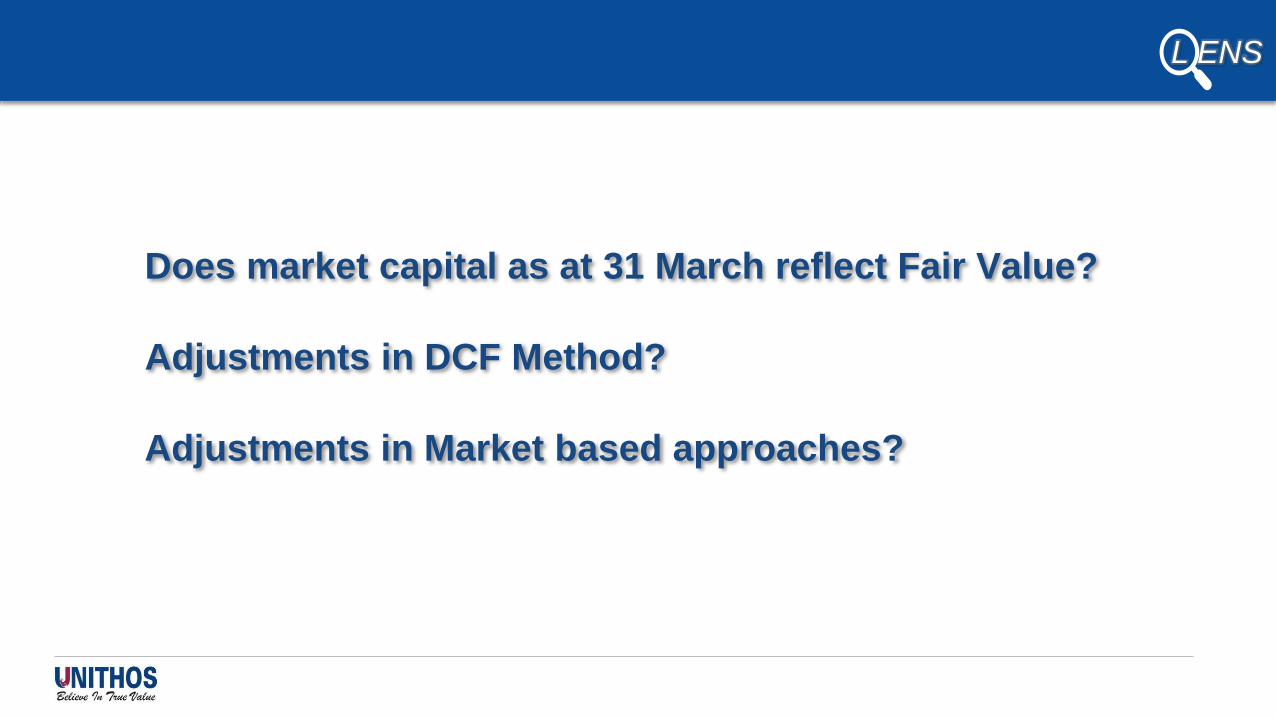
Does market capital as at 31 March reflect Fair Value?
Adjustments in DCF Method?
Adjustments in Market based approaches?

L ENSUnder Discounted Cash Flow (DCF) Method, the impact of the current situation can be studied under cashflows or discount rate
01 02
Impact on Cash Flows Impact on Discount RateOR
Important to avoid double dip effect by adjusting both the cashflows and the discount rate

L ENSKey considerations from overall approach and Cashflows
Impact on free cash flows in short term, medium term and long term
Time to stabilisation, plant capacity and utilizations
Going concern (factors like plant capacity, utilization, survival dependence on other stakeholders’ survival, dependency on exports, shift in demand, etc)
Revenue, pricing and cost estimates in the current scenario
Key Steps
Free Cashflows
Treasury (restart of working capital cycle)
Discount Rate
Cost of Equity:
• Decrease in Rf as investor preference shift towards Govt. Securities till better visibility
• Increase in Beta due to shift in investor priorities
• Increase in market risk premium to capture higher market risks
Cost of Debt:
• Decrease in cost of debt due to lower Rf and decrease in offtake of debt
Resilience vary for different geographies and different user industries

L ENSSome Considerations while evaluating Free Cashflows
Particulars Key Considerations
Revenue Enforceability of the contracts, Transaction Price, Feasibility of deliveries, Credit terms, Timing of
revenue recognition, liquidated damagers, forex fluctuations and any other specific matters
Inventories Abnormal costs incurred, valuation for perishable inventories, Year End inventory count
Tangible & Intangible Assets Impairment Testing, useful lives and residual values re-estimate
Financial Instruments Requirement for reclassification of Financial Assets, changes in interest rate, volatility and credit risk
been considered
Leases Impact of rent concessions, waivers, any modifications to contract terms
Employee Benefits Labour laws, Union settlements, cost of available of labour, Re- training or upskilling cost, ESOP plan
modifications which are linked to performance targets, provisions reverification
Taxes Profits uncertainty for accounting Deferred Tax Asset
Provisions Onerous contracts, measures to qualify as a restructuring activity
Government Grants Any expectations on government grants and its accounting and disclosure requirements
Selling and Marketing Spend on major advertisement or campaigns, discounts and dealer incentives
Presentation & Disclosures Specific disclosures on account of COVID-19 situation

L ENSKey movements in the discount rate - Risk Free Rate and Borrowing Rate have declined since the pre-COVID-19 scenario
Risk Free Rates
LT COMPOSITE (>10 Yrs) - US Rf 10 Year G-Sec Par Yield - India Rf
Borrowing Rates
LIBOR MIBOR Fed Rates
6.7% 5.8%6.7%
2.3%1.3%
1.3%
5.3% 4.8% 4.0%
2.0%
1.6%
0.9%
0.7%
0.7%
0.1%
Source: Secondary Research including RBI Website, US Treasury Source: Secondary Research including Fed Primate Rate, Fred Economic Research, FBIL
7.4%
2.9%
6.5%
3.0%
2.4%
Key Points
• We have analysed 10 Year Government Securities Yield Rate
of India and Long Term Composite (>10Years) of US :
– Risk Free Rate in US reduced from 2.3% in December
2019 to 1.3% in March 2020.
– Risk Free Rate in India reduced from 6.7% in December
2019 to 5.8% in May 2020.
Key Points
• We have analysed LIBOR, MIBOR and US Federal Rates as
benchmark rates for borrowing:
– LIBOR reduced from 3.0% in January 2019 to 2.0% in December
2019 and further to 0.9% in March 2020.
– MIBOR reduced from 6.5% in January 2019 to 5.3% in December
2019 and further to 4.8% in March 2020.
– US Federal Rate reduced from 2.4% in January 2019 to 1.6% in
December 2019 and further to 0.7% in March 2020.
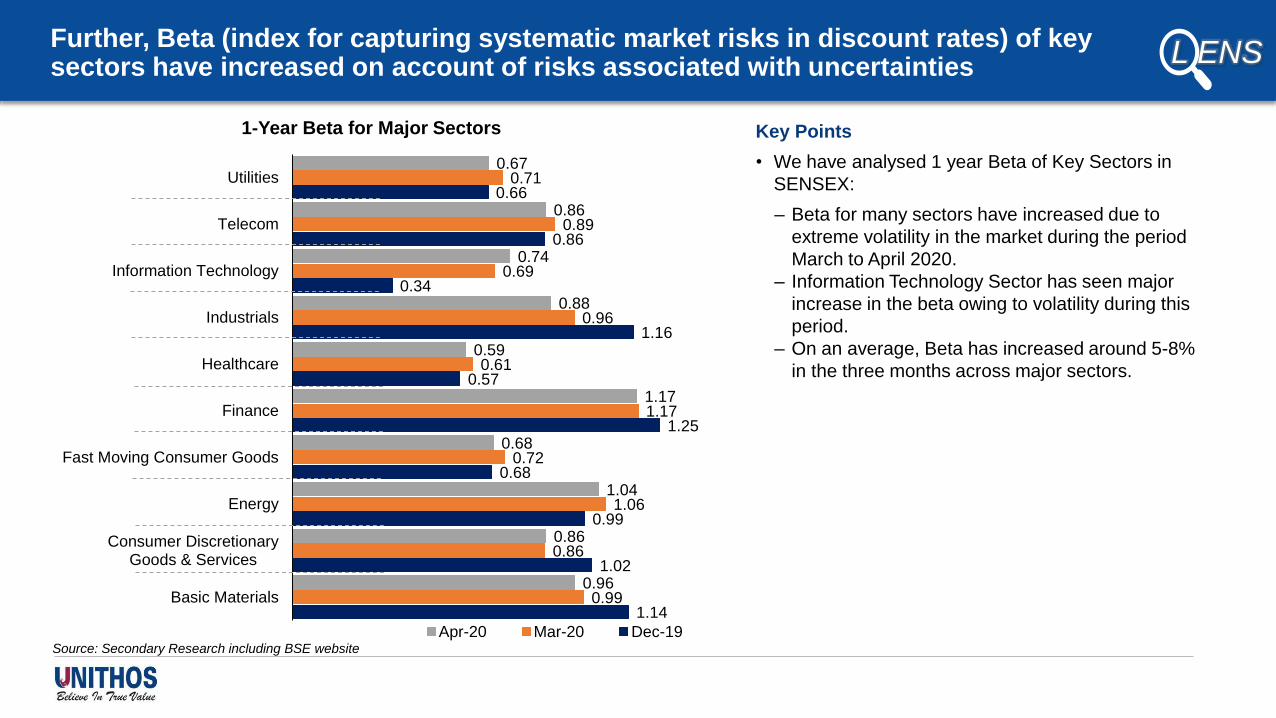
L ENSFurther, Beta (index for capturing systematic market risks in discount rates) of key sectors have increased on account of risks associated with uncertainties
Key Points
• We have analysed 1 year Beta of Key Sectors in
SENSEX:
– Beta for many sectors have increased due to
extreme volatility in the market during the period
March to April 2020.
– Information Technology Sector has seen major
increase in the beta owing to volatility during this
period.
– On an average, Beta has increased around 5-8%
in the three months across major sectors.
1.14
1.02
0.99
0.68
1.25
0.57
1.16
0.34
0.86
0.66
0.99
0.86
1.06
0.72
1.17
0.61
0.96
0.69
0.89
0.71
0.96
0.86
1.04
0.68
1.17
0.59
0.88
0.74
0.86
0.67
Basic Materials
Consumer DiscretionaryGoods & Services
Energy
Fast Moving Consumer Goods
Finance
Healthcare
Industrials
Information Technology
Telecom
Utilities
1-Year Beta for Major Sectors
Apr-20 Mar-20 Dec-19Source: Secondary Research including BSE website

L ENSWhile carrying out valuation using Market Approaches, impact can be captured either in the valuation parameter or the market multiple
01 02
Impact on Valuation Parameter
(Revenue, EBITDA, EBIT, PAT)Impact on the market multiple
Important to avoid double dip effect by adjusting both the valuation parameter and the market multiple
OR
L ENS
-28.6%
-20.0%
-23.2%
-20.0%
-25.0%
-16.3%
-24.8%
-18.3%
-9.9%
-14.7%-14.6%
-18.0%
-12.6%
-21.8%
-16.9%
-1.1%
-5.0%
-3.4% -3.0%
-12.1%-14.0%
SENSEX S&P 500 DOW JONES NIKKEI 225 DAX HANGSENG FTSE 100
Impact of COVID-19 in Key Global Indices
1 January 2020 to 31 March 2020 1 January 2020 to 30 April 2020 1 January 2020 to 5 June 2020
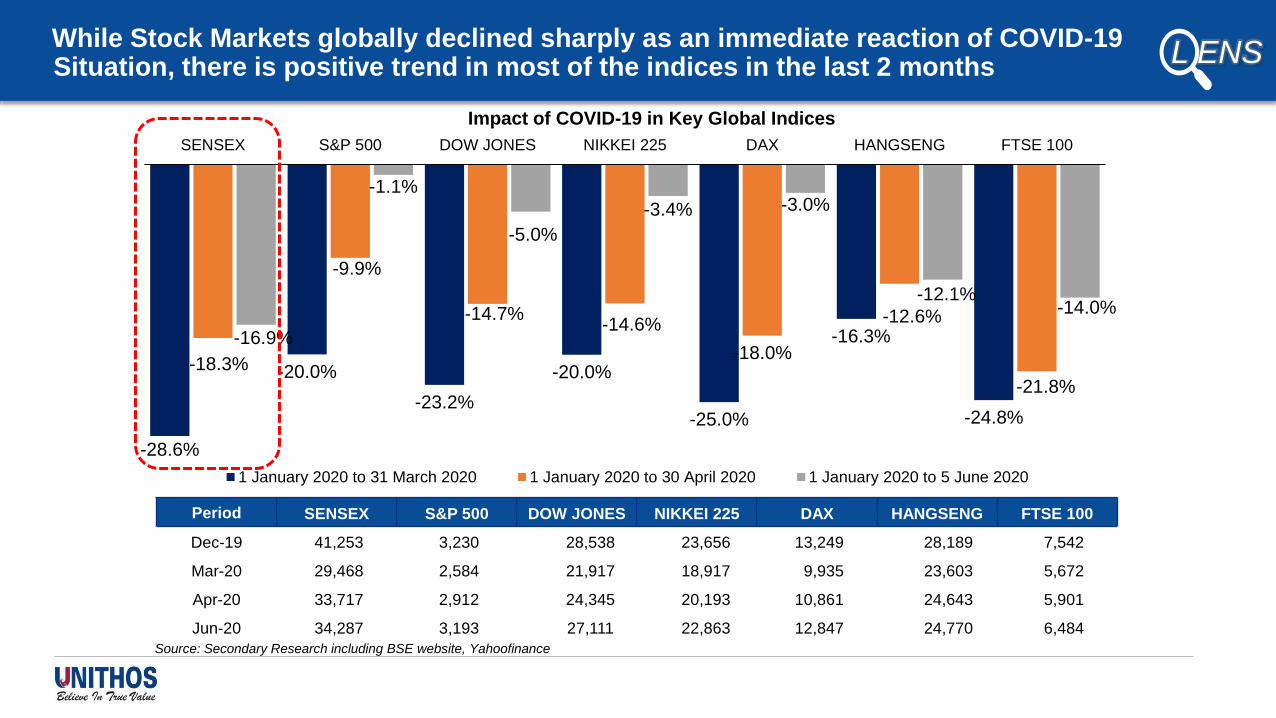
While Stock Markets globally declined sharply as an immediate reaction of COVID-19 Situation, there is positive trend in most of the indices in the last 2 months
Period SENSEX S&P 500 DOW JONES NIKKEI 225 DAX HANGSENG FTSE 100
Dec-19 41,253 3,230 28,538 23,656 13,249 28,189 7,542
Mar-20 29,468 2,584 21,917 18,917 9,935 23,603 5,672
Apr-20 33,717 2,912 24,345 20,193 10,861 24,643 5,901
Jun-20 34,287 3,193 27,111 22,863 12,847 24,770 6,484
Source: Secondary Research including BSE website, Yahoofinance
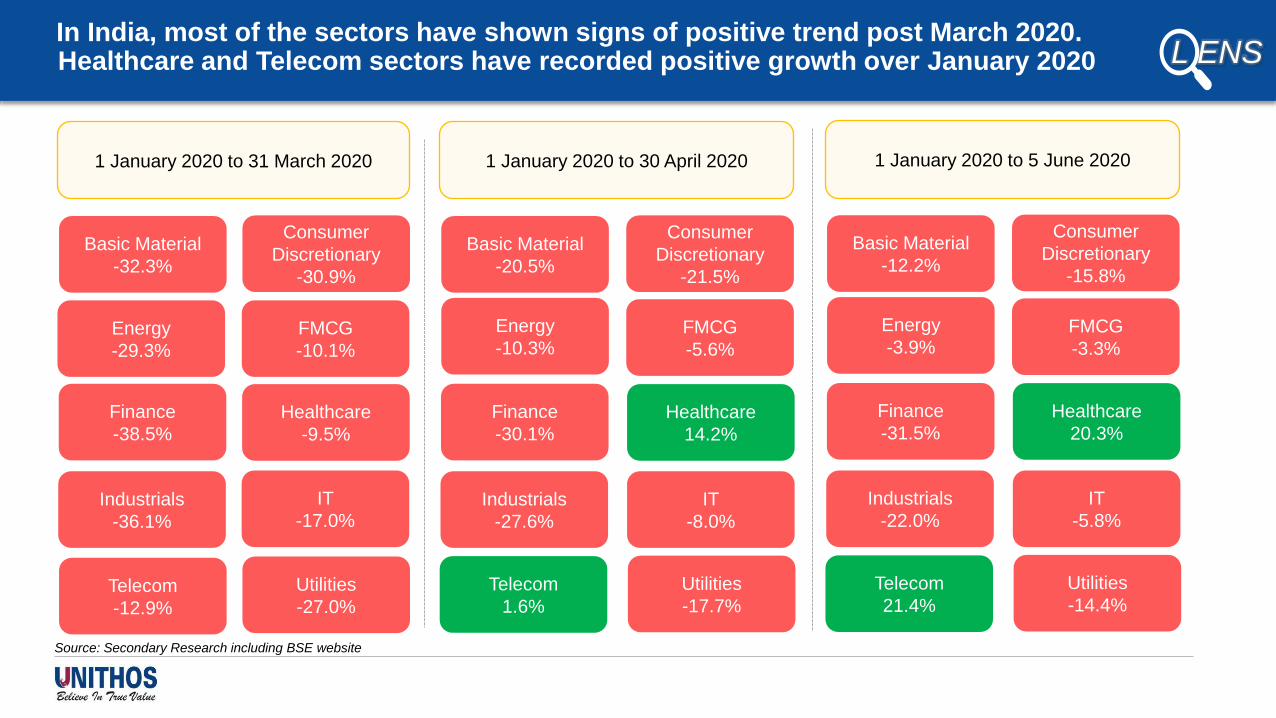
L ENSIn India, most of the sectors have shown signs of positive trend post March 2020. Healthcare and Telecom sectors have recorded positive growth over January 2020
Basic Material
-32.3%
Consumer
Discretionary
-30.9%
Energy
-29.3%
FMCG
-10.1%
Finance
-38.5%
Healthcare
-9.5%
Telecom
-12.9%
Utilities
-27.0%
Industrials
-36.1%
IT
-17.0%
Basic Material
-20.5%
Consumer
Discretionary
-21.5%
Energy
-10.3%FMCG
-5.6%
Finance
-30.1%
Healthcare
14.2%
Telecom
1.6%
Utilities
-17.7%
Industrials
-27.6%
IT
-8.0%
1 January 2020 to 31 March 2020 1 January 2020 to 30 April 2020
Source: Secondary Research including BSE website
Basic Material
-12.2%
Consumer
Discretionary
-15.8%
Energy
-3.9%FMCG
-3.3%
Finance
-31.5%
Healthcare
20.3%
Telecom
21.4%
Utilities
-14.4%
Industrials
-22.0%
IT
-5.8%
1 January 2020 to 5 June 2020

L ENSMarket Approach – Case Study of impact indicates the market multiple of companies in the Information Technology recorded sharp decline in December 2019 and recovery post March 2020
Source: Secondary Research including BSE website, Ace Equity, Company Annual Reports
EV/Revenue EV/EBITDA EV/Revenue EV/EBITDA EV/Revenue EV/EBITDA EV/Revenue EV/EBITDA
1 Mphasis Ltd. 1.9 10.5 1.3 6.8 1.4 7.5 1.7 9.3
2 Tech Mahindra 1.9 11.6 1.3 8.7 1.3 8.3 1.4 8.9
3 HCL Technologies Ltd 2.2 9.5 1.6 6.6 2.0 8.3 2.2 8.8
4 Wipro Ltd. 1.9 9.3 1.4 7.2 1.4 6.9 1.6 8.2
5 TCS 5.0 18.7 4.2 15.6 4.6 17.3 4.7 17.6
6 Infosys 3.3 13.4 2.8 9.7 3.1 11.0 3.1 10.8
7 L&T Infotech Ltd 1.6 8.8 1.2 6.5 1.4 7.3 1.1 6.0
8 Hexaware 1.8 11.3 1.2 7.3 1.4 8.9 1.6 9.9
Median 1.9 10.9 1.4 7.2 1.4 8.3 1.7 9.1
Mean 2.5 11.6 1.9 8.5 2.1 9.4 2.2 9.9
As on 5 June, 2020As on 31 December, 2019 As on 31 March, 2020 As on 30 April, 2020S No Company

L ENSHistorical Stock Market Crash and reaction of SENSEX
1,500
2,000
2,500
3,000
3,500
4,000
4,500
5,000
Jan-92 May-92 Sep-92 Jan-93 May-93 Sep-93 Jan-94 May-94
SENSEX during Harshad Mehta Scam
1,500
2,000
2,500
3,000
3,500
4,000
4,500
5,000
5,500
6,000
6,500
Jan-99 Aug-99 Mar-00 Oct-00 May-01 Dec-01 Jul-02 Feb-03 Sep-03
SENSEX during Dot-Com Crisis
6,500
8,500
10,500
12,500
14,500
16,500
18,500
20,500
22,500
Jan-07 Jun-07 Nov-07 Apr-08 Sep-08 Feb-09 Jul-09 Dec-09 May-10 Oct-10
SENSEX during Financial Crisis (Great Recession)
Around 15 to 18 months to recover Around 26 to 30 months to recover
Around 24 to 28 months to recover
Source: Secondary Research including BSE website
10,000
15,000
20,000
25,000
30,000
35,000
40,000
45,000
SENSEXSensex closed on Friday 5 June 2020 at 34,287 which
is similar level as at November 2018 levels - Going by
past trend markets need to catch up 14 months to reach
41,000 (Pre-COVID-19 levels January 2020)

CIN: U74990KA2018PTC119002
GST: 29AACCU3424D1ZK
Registered Office:
#812, Prestige Meridian
8th Floor,
No 29 M G Road,
Bangalore 560001.