VALUATIONS CHAPTER 6. © Correia, Flynn, Uliana & Wormald 2 Objectives n At the end of the chapter,...
37
VALUATIONS VALUATIONS CHAPTER 6 CHAPTER 6
-
Upload
vincent-noel-oconnor -
Category
Documents
-
view
214 -
download
0
Transcript of VALUATIONS CHAPTER 6. © Correia, Flynn, Uliana & Wormald 2 Objectives n At the end of the chapter,...

VALUATIONSVALUATIONS
CHAPTER 6CHAPTER 6

© Correia, Flynn, Uliana & Wormald 2
Objectives At the end of the chapter, you should be able to:At the end of the chapter, you should be able to:
Outline the Outline the conceptsconcepts applied in the valuation of assets applied in the valuation of assets Understand the Understand the effects of risk and returneffects of risk and return on valuations on valuations Value debenturesValue debentures Value preference sharesValue preference shares Use the Use the constant dividend growth model constant dividend growth model to value ordinary sharesto value ordinary shares Apply Apply a two stage valuation dividend model a two stage valuation dividend model to value ordinary to value ordinary
sharesshares Use the Use the Free Cash flow model Free Cash flow model to value a company and the to value a company and the
ordinary equity of a companyordinary equity of a company Use relative valuation methods such as Use relative valuation methods such as the price-earnings the price-earnings (P/E) (P/E)
ratio to value ordinary sharesratio to value ordinary shares Use Use the EVA the EVA approach to value the ordinary equity of a firmapproach to value the ordinary equity of a firm Understand how valuations Understand how valuations affect the role affect the role of the financial managerof the financial manager

© Correia, Flynn, Uliana & Wormald 3
OutlineOutline What are valuations?What are valuations?
Some valuation mythsSome valuation myths What is the effect of the risk and return relationship on value?What is the effect of the risk and return relationship on value?
Valuation of debenturesValuation of debentures Debentures in Debentures in perpetuityperpetuity and redeemable debentures and redeemable debentures
Valuation of preference sharesValuation of preference shares Cumulative and non-cumulative preference shares, redeemable and Cumulative and non-cumulative preference shares, redeemable and
convertible preference sharesconvertible preference shares
Valuation of ordinary sharesValuation of ordinary shares Dividend Growth model – constant growth and two stage valuation Dividend Growth model – constant growth and two stage valuation
modelmodel Free Cash Flow modelFree Cash Flow model
Free cash flow to the FirmFree cash flow to the Firm Free cash flow to EquityFree cash flow to Equity
Relative valuations – P/E ratio (earnings yield) approachRelative valuations – P/E ratio (earnings yield) approach The EVA approach to valuationsThe EVA approach to valuations

© Correia, Flynn, Uliana & Wormald 4
What are Valuations?
Determination of the value of an asset stated in Determination of the value of an asset stated in monetary termsmonetary terms
Value = Value = present value of present value of futurefuture cash flows cash flows
As the future is uncertain, valuations are subject to As the future is uncertain, valuations are subject to uncertaintyuncertainty
An An active market active market for assets creates a value due to for assets creates a value due to the actions of many buyers and sellersthe actions of many buyers and sellers

© Correia, Flynn, Uliana & Wormald 5
Valuation Myths
Valuations based on Valuations based on quantitativequantitative models are models are always accuratealways accurate
Valuations are Valuations are objectiveobjective Valuations are Valuations are preciseprecise Valuations are valid over Valuations are valid over extended time extended time
periodsperiods The The valuation numbervaluation number is the most important is the most important
aspect of any valuationaspect of any valuation
© Correia, Flynn, Uliana & Wormald 6
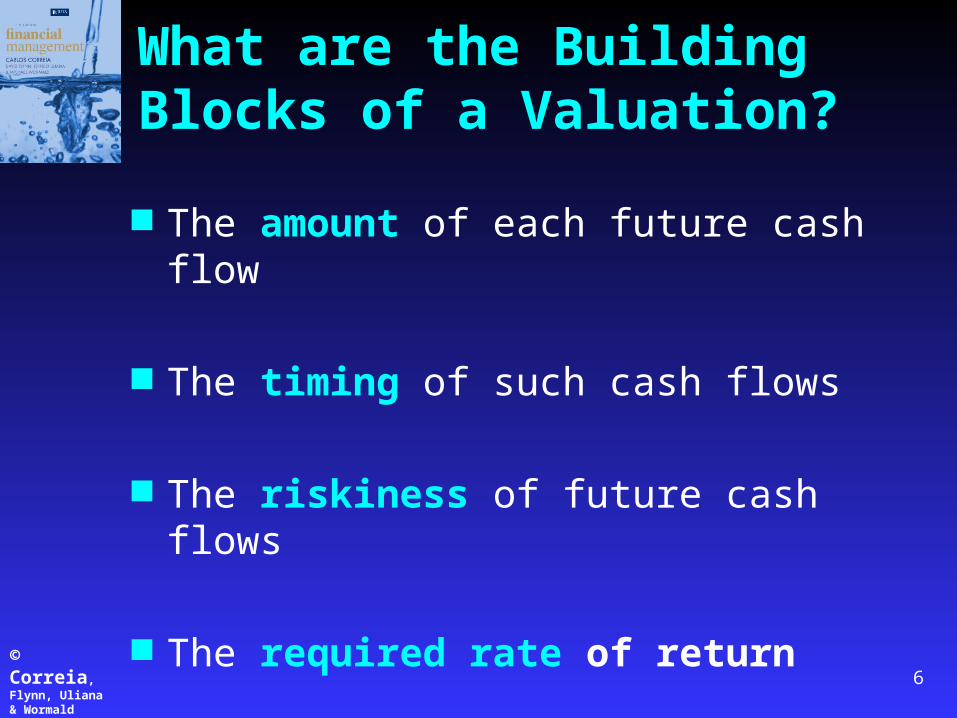
What are the Building Blocks of a Valuation?
The amount of each future cash flow
The timing of such cash flows
The riskiness of future cash flows
The required rate of return

© Correia, Flynn, Uliana & Wormald 7
How does Risk and Return Affect Value? Effect of Return on ValueEffect of Return on Value
If asset A is returning R1m per year and asset B is If asset A is returning R1m per year and asset B is returning R1.2m per year, then asset B will have a returning R1.2m per year, then asset B will have a HIGHER value if the assets are of similar riskHIGHER value if the assets are of similar risk
Effect of Risk on ValueEffect of Risk on Value If asset C and asset D are both offering R1m per If asset C and asset D are both offering R1m per
year, but C is more risky, then asset D will have a year, but C is more risky, then asset D will have a HIGHER valueHIGHER value
Value and rates of returnValue and rates of return Assume cost = R10m and annual return (forever) = Assume cost = R10m and annual return (forever) =
R1m. If required return = 12%, then value < 10m. R1m. If required return = 12%, then value < 10m. Why? Because the actual return is only 10%. To Why? Because the actual return is only 10%. To offer 12%, the price must fall to R8.333m.offer 12%, the price must fall to R8.333m.

© Correia, Flynn, Uliana & Wormald 8
Required Return
To determine the present value of future cash flows, To determine the present value of future cash flows, we need a we need a discount rate?discount rate? How do we determine the How do we determine the discount rate or required rate of return?discount rate or required rate of return?
Are there similar assets trading on financial markets?Are there similar assets trading on financial markets? Comparison of debentures to ordinary sharesComparison of debentures to ordinary shares The required return on ordinary shares is called the The required return on ordinary shares is called the
cost of equitycost of equity This is dealt with in Chapter 7 on the cost of capitalThis is dealt with in Chapter 7 on the cost of capital

© Correia, Flynn, Uliana & Wormald 9
Valuation of Debentures / Bonds
TERMSTERMS Par Value (Face Value)Par Value (Face Value) Coupon interest rateCoupon interest rate Maturity date (redemption date)Maturity date (redemption date) Yield to MaturityYield to Maturity Yield to CallYield to Call

© Correia, Flynn, Uliana & Wormald 10
Valuation of Debentures / Bonds Debentures in perpetuity (non-redeemable debentures)Debentures in perpetuity (non-redeemable debentures)
No redemption dateNo redemption date Face value = R100 and coupon rate = 15% per year. If Face value = R100 and coupon rate = 15% per year. If
the required return is 9%, then the value is;the required return is 9%, then the value is; R15/0.09 = R166.67R15/0.09 = R166.67
Redeemable debentures / bondsRedeemable debentures / bonds Face value is repaid on the set maturity date, plus interest Face value is repaid on the set maturity date, plus interest
until that date.until that date. Face value of R100, the coupon rate is 15% and the Face value of R100, the coupon rate is 15% and the
redemption date is in 5 years time. Market yield = 9%.redemption date is in 5 years time. Market yield = 9%. PV of interest: R15 x 3.8897 = R58.34PV of interest: R15 x 3.8897 = R58.34 PV of redemption of face value: R100 x 0.6499 = R64.99PV of redemption of face value: R100 x 0.6499 = R64.99 Total value = R58.34 + R64.99 = R123.34 Total value = R58.34 + R64.99 = R123.34 (slight rounding (slight rounding
difference)difference)

© Correia, Flynn, Uliana & Wormald 11
Valuation of Debentures / Bonds FormulaFormula
Using ExcelUsing Excel
6789
1011
A B C D E F GYear 0 1 2 3 4 5
Coupon interest 15 15 15 15 15Redemption 0 0 0 0 100Total cash flows 15 15 15 15 115Present value 123.34[Excel function: =NPV(9%,C9:G9)]

© Correia, Flynn, Uliana & Wormald 12
Debentures – Yield to Maturity
Assume that the debenture (bond) is trading at R118. What Assume that the debenture (bond) is trading at R118. What is the yield to maturity (YTM)?is the yield to maturity (YTM)?
Use the IRR function on a financial calculator OR use Excel. Use the IRR function on a financial calculator OR use Excel. You can also use trial and error (not recommended) You can also use trial and error (not recommended)
YTM = IRR. In Excel you need to indicate an estimate of YTM = IRR. In Excel you need to indicate an estimate of IRR. Then Excel starts with this will do many trial and error IRR. Then Excel starts with this will do many trial and error calculations (iterations) super quickly until it gets to IRRcalculations (iterations) super quickly until it gets to IRR
20212223
A B C D E F GYear 0 1 2 3 4 5
Bond cash flows -118 15 15 15 15 115YTM 10.2%[Excel function: =IRR(B21:G21,9%); Note - 9% is a guess]

© Correia, Flynn, Uliana & Wormald 13
Preference Shares Preference shareholders receive a fixed dividend whilst Preference shareholders receive a fixed dividend whilst
debenture (bond) holders receive interest.debenture (bond) holders receive interest.
Dividends are paid only after all expenses have been Dividends are paid only after all expenses have been incurred, including interest. This means that dividends incurred, including interest. This means that dividends are more risky and therefore preference shares need to are more risky and therefore preference shares need to offer a higher return.offer a higher return.
What is the effect of taxation?What is the effect of taxation? Types of preference sharesTypes of preference shares
CumulativeCumulative RedeemableRedeemable ParticipatingParticipating ConvertibleConvertible

© Correia, Flynn, Uliana & Wormald 14
Cumulative Preference Shares Cumulative Preference Shares In ArrearsIn Arrears
100 preference shares with an issue price of R1 each, is two 100 preference shares with an issue price of R1 each, is two years in arrears. The preference dividend rate is 12% and years in arrears. The preference dividend rate is 12% and similar shares are offering yields of 14%. similar shares are offering yields of 14%.
If non-redeemable and will be paid in the future, then the If non-redeemable and will be paid in the future, then the value would be; R12/0.14 = R85.71value would be; R12/0.14 = R85.71
If the next two years’ dividends will not be paid, then the If the next two years’ dividends will not be paid, then the value will be determined in two parts;value will be determined in two parts; Value of perpetuity at end of year 3 = R12/0.14 = R85.71Value of perpetuity at end of year 3 = R12/0.14 = R85.71 Dividend at end of year 3 = R12 x 3 = R36Dividend at end of year 3 = R12 x 3 = R36 Present value today: (R36.00 + R85.71) x 0.675 = R82.71Present value today: (R36.00 + R85.71) x 0.675 = R82.71
Note:Note: In terms of the new Companies Act, which is expected to come into force sometime In terms of the new Companies Act, which is expected to come into force sometime
in 2011, preference shares will no longer have a face value (par value). It will have in 2011, preference shares will no longer have a face value (par value). It will have an issue price and a redemption value (if applicable).an issue price and a redemption value (if applicable).

© Correia, Flynn, Uliana & Wormald 15
Valuation of Ordinary EquityValuation of Ordinary Equity
Dividend Discount ModelDividend Discount Model
Free Cash Flow ModelFree Cash Flow Model
Price Multiples (relative valuation)Price Multiples (relative valuation)
EVA Discount ModelEVA Discount Model

© Correia, Flynn, Uliana & Wormald 16
Valuation of Ordinary Equity – Valuation of Ordinary Equity – Zero Dividend GrowthZero Dividend Growth
Assume a company is expected to maintain Assume a company is expected to maintain the same dividend in future years. What are the same dividend in future years. What are we valuing?we valuing?
We are valuing a perpetuity.We are valuing a perpetuity. Value = D / kValue = D / k If dividend is R0.80 and the Cost of Equity is If dividend is R0.80 and the Cost of Equity is
11%, then the value is 0.80/.11 = R7.2711%, then the value is 0.80/.11 = R7.27

© Correia, Flynn, Uliana & Wormald 17
Valuation of Ordinary Equity Dividend Growth ModelDividend Growth Model
Value = PV of future dividendsValue = PV of future dividends If dividends are growing at a constant rate, If dividends are growing at a constant rate,
then; then; PV = D(1+g)/(k-g)PV = D(1+g)/(k-g)
Where Where • D(1+g) = next year’s dividendD(1+g) = next year’s dividend• k = cost of equityk = cost of equity• g = future constant growth rate in g = future constant growth rate in
dividendsdividends
© Correia, Flynn, Uliana & Wormald 18
Dividend Growth ModelDividend Growth Model
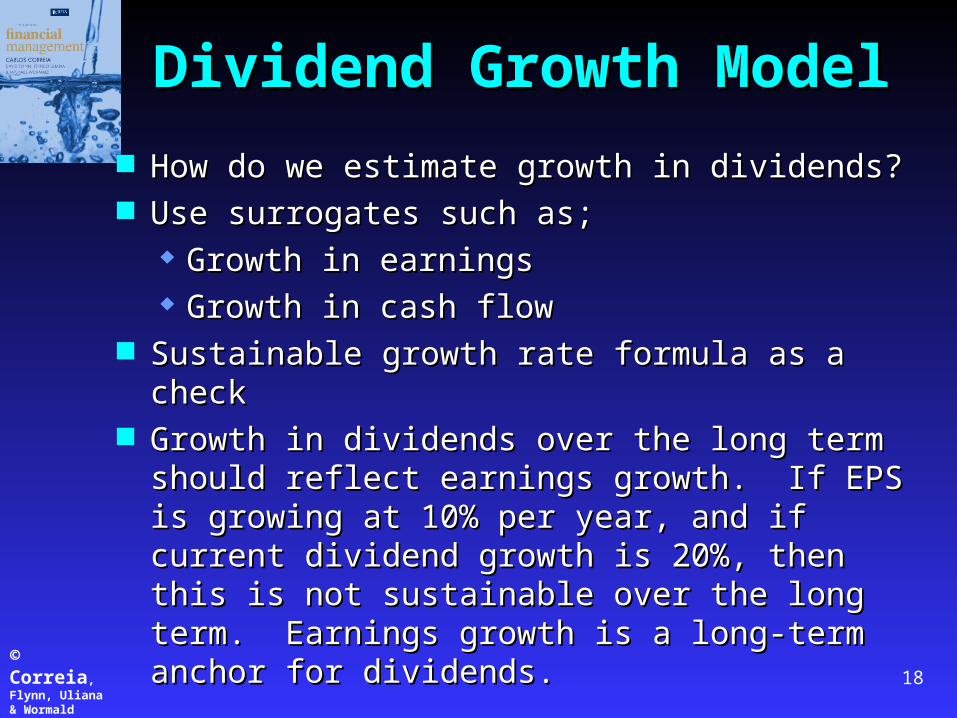
How do we estimate growth in dividends?How do we estimate growth in dividends? Use surrogates such as;Use surrogates such as;
Growth in earningsGrowth in earnings Growth in cash flowGrowth in cash flow
Sustainable growth rate formula as a checkSustainable growth rate formula as a check Growth in dividends over the long term should Growth in dividends over the long term should
reflect earnings growth. If EPS is growing at reflect earnings growth. If EPS is growing at 10% per year, and if current dividend growth is 10% per year, and if current dividend growth is 20%, then this is not sustainable over the long 20%, then this is not sustainable over the long term. Earnings growth is a long-term anchor for term. Earnings growth is a long-term anchor for dividends.dividends.

© Correia, Flynn, Uliana & Wormald 19
Dividend Growth – Two Stage Model
How do we value a company which is experiencing How do we value a company which is experiencing a high growth in dividends which is followed later a high growth in dividends which is followed later by a lower but stable growth rate in dividends?by a lower but stable growth rate in dividends?
Example: HiFly Ltd is expected to experience a Example: HiFly Ltd is expected to experience a growth rate of 30% for the next 3 years and growth rate of 30% for the next 3 years and thereafter will experience a growth rate of 6% per thereafter will experience a growth rate of 6% per year. The cost of equity is 12% and the current year. The cost of equity is 12% and the current dividend is 60 cents.dividend is 60 cents.

© Correia, Flynn, Uliana & Wormald 20
Two Stage Valuation Dividend per share in year 1, 2 and 3 will beDividend per share in year 1, 2 and 3 will be;;
Yr 1: 0.60 x 1.3 = 0.78Yr 1: 0.60 x 1.3 = 0.78 Yr 2: 0.78 x 1.3 = 1.01Yr 2: 0.78 x 1.3 = 1.01 Yr 3: 1.01 x 1.3 = 1.31Yr 3: 1.01 x 1.3 = 1.31
Present Value of future dividends in years 1-3 = R2.43Present Value of future dividends in years 1-3 = R2.43
What is the value of the ordinary equity at the end of year 3?What is the value of the ordinary equity at the end of year 3? ValueValue33 = D = D33(1+g)/(k-g)(1+g)/(k-g) ValueValue33 = 1.31(1.06)/(0.12-.06) = 23.17 = 1.31(1.06)/(0.12-.06) = 23.17 Present value today = 23.17/(1.12)Present value today = 23.17/(1.12)3 3 = 16.49= 16.49
Total Value of the shares = 16.49 + 2.43 = 18.92Total Value of the shares = 16.49 + 2.43 = 18.92
© Correia, Flynn, Uliana & Wormald 21
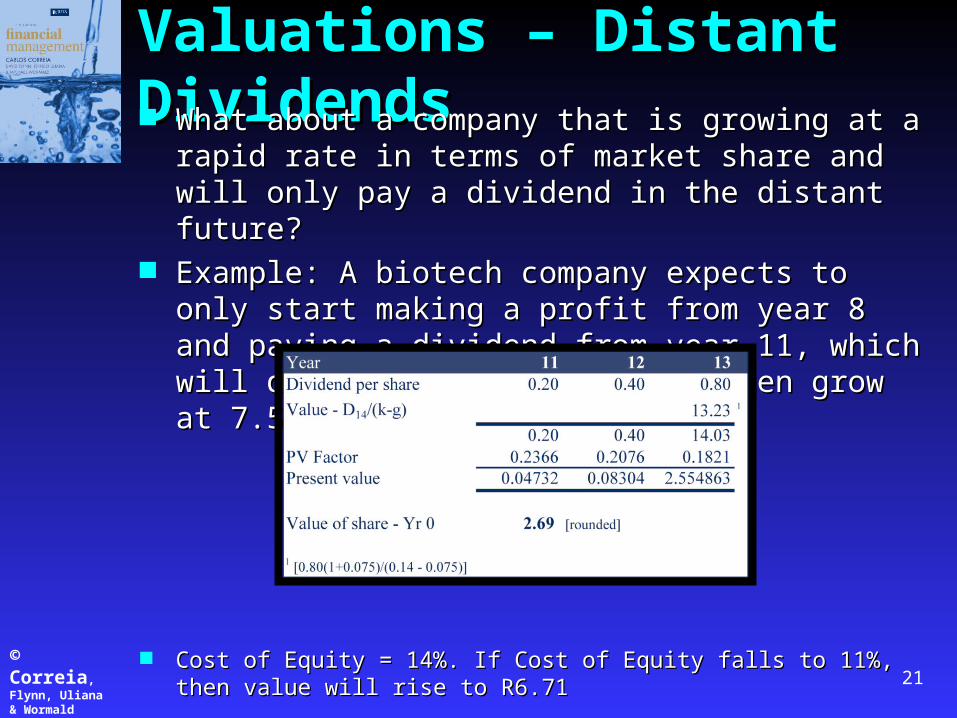
Valuations – Distant DividendsValuations – Distant Dividends What about a company that is growing at a rapid rate in What about a company that is growing at a rapid rate in
terms of market share and will only pay a dividend in the terms of market share and will only pay a dividend in the distant future?distant future?
Example: A biotech company expects to only start making Example: A biotech company expects to only start making a profit from year 8 and paying a dividend from year 11, a profit from year 8 and paying a dividend from year 11, which will double until year 13 and then grow at 7.5% per which will double until year 13 and then grow at 7.5% per year.year.
Cost of Equity = 14%. If Cost of Equity falls to 11%, then value will rise to Cost of Equity = 14%. If Cost of Equity falls to 11%, then value will rise to R6.71R6.71

© Correia, Flynn, Uliana & Wormald 22
Dividend Growth – From the real world Let’s apply the dividend growth model to Let’s apply the dividend growth model to
WoolworthsWoolworths Assume a long-term sustainable growth rate of 8% Assume a long-term sustainable growth rate of 8%
(approximately 4.5% inflation and 3.5% real growth). (approximately 4.5% inflation and 3.5% real growth). Assume the cost of equity is 13% (Risk free rate of 7.2% + Assume the cost of equity is 13% (Risk free rate of 7.2% + risk premium of 5%).risk premium of 5%).
Assume that the high growth in earnings and dividends will Assume that the high growth in earnings and dividends will continue for the next 5 years, before falling to 8% per year. continue for the next 5 years, before falling to 8% per year. Expected growth rate for 5 years is 15% per year, which Expected growth rate for 5 years is 15% per year, which reflects the growth in earnings and dividends 2004-2010. reflects the growth in earnings and dividends 2004-2010.
Compare to current listed priceCompare to current listed price

© Correia, Flynn, Uliana & Wormald 23
Use of price multiples such as price-earnings (P/E) Use of price multiples such as price-earnings (P/E) ratios and market to book ratios to determine ratios and market to book ratios to determine whether shares are over or under-valued.whether shares are over or under-valued.
A Co. with a high growth rate will normally have a A Co. with a high growth rate will normally have a high P/E ratio. Yet this may also be due to very low high P/E ratio. Yet this may also be due to very low earnings for a particular year.earnings for a particular year.
High P/E ratios may indicate that shares are over High P/E ratios may indicate that shares are over valued. Use P/E ratios of comparable companies.valued. Use P/E ratios of comparable companies.
Use of listed company P/E ratios to value unlisted Use of listed company P/E ratios to value unlisted companiescompanies
P/E is based on historical earningsP/E is based on historical earnings P/E is based on accounting earningsP/E is based on accounting earnings
Price Multiples - Price Earnings

© Correia, Flynn, Uliana & Wormald 24
Price Earnings
Assume a company has an EPS of 1.50 and Assume a company has an EPS of 1.50 and comparable firms have an average P/E ratio of 10. comparable firms have an average P/E ratio of 10. Value = R15.00Value = R15.00
Do high P/E ratios indicate that company shares Do high P/E ratios indicate that company shares are overvalued?are overvalued?
Research by Schiller of Yale indicates that high P/E Research by Schiller of Yale indicates that high P/E ratios generally do indicate over-valued sharesratios generally do indicate over-valued shares
Refer to Internet Bubble in year 2000.Refer to Internet Bubble in year 2000. Average P/E ratio in South Africa is about 17.Average P/E ratio in South Africa is about 17.
© Correia, Flynn, Uliana & Wormald 25
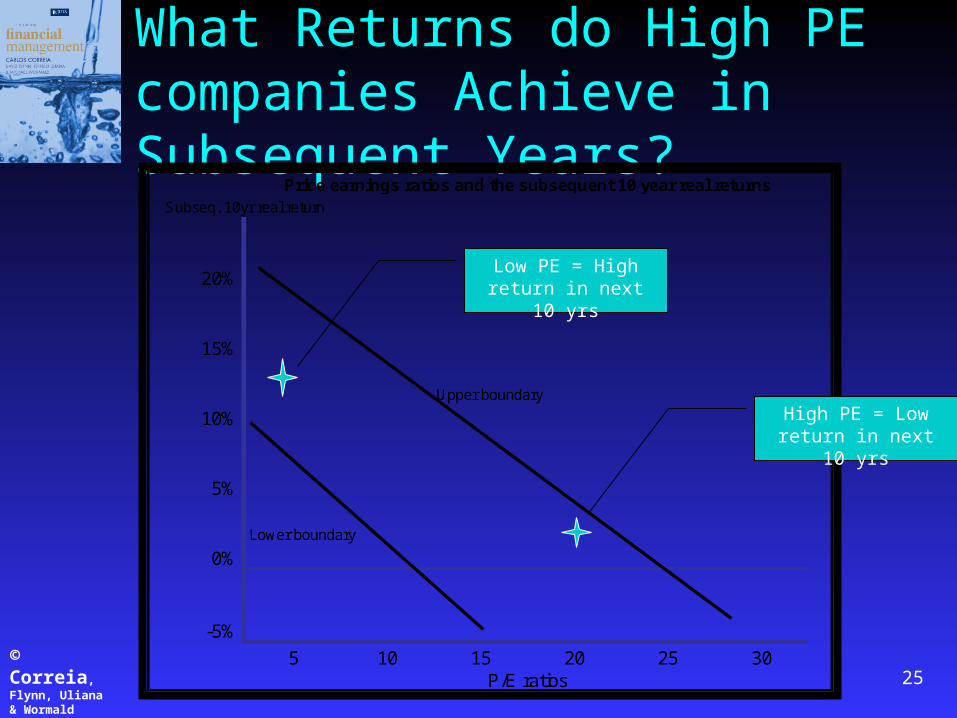
What Returns do High PE companies Achieve in Subsequent Years?
20%
15%
10%Upper boundary
5%
0%Lower boundary
-5%
5 10 15 20 25 30P/E ratios
Subseq. 10yr real return
Price earnings ratios and the subsequent 10 year real returns
Low PE = High return in next 10 yrs
High PE = Low return in next 10 yrs
© Correia, Flynn, Uliana & Wormald
Enterprise Value
P/E ratio used to value ordinary equityP/E ratio used to value ordinary equity Use EBIT or EBITDA multiples to determine Use EBIT or EBITDA multiples to determine
the value of the firm or enterprise valuethe value of the firm or enterprise value Use of EBITDA enables us to ignore differences Use of EBITDA enables us to ignore differences
in depreciation policies and use of EBIT or in depreciation policies and use of EBIT or EBITDA multiples means we can ignore EBITDA multiples means we can ignore differences in financial leveragedifferences in financial leverage
EBITDA of R240m x 7.5 = R1800m. Deduct EBITDA of R240m x 7.5 = R1800m. Deduct value of debt to get to value of equityvalue of debt to get to value of equity
26
© Correia, Flynn, Uliana & Wormald 27
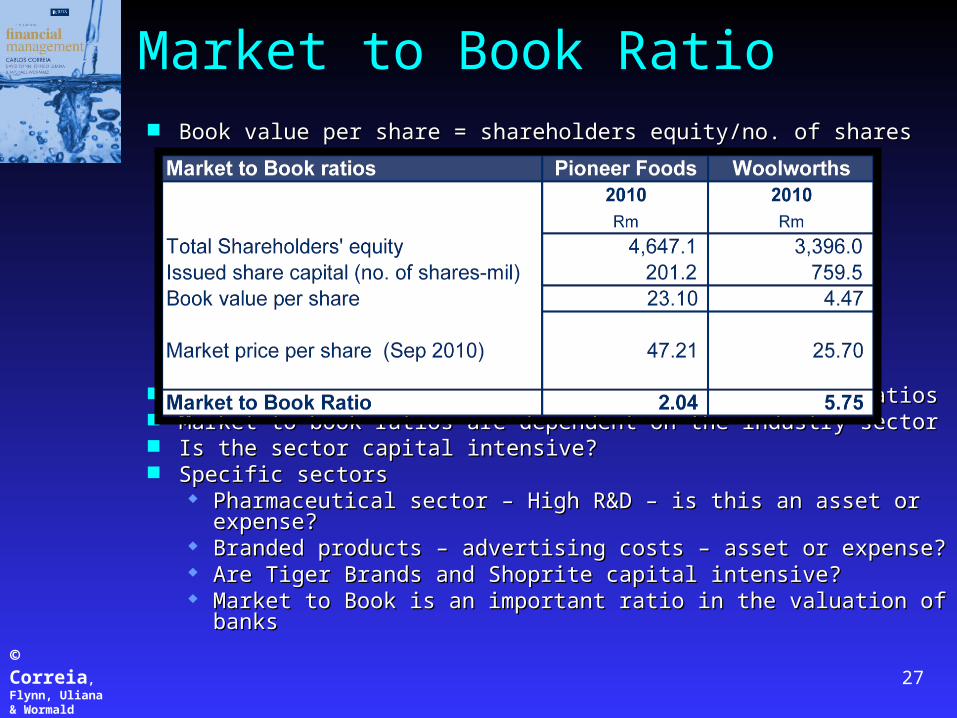
Market to Book Ratio Book value per share = shareholders equity/no. of sharesBook value per share = shareholders equity/no. of shares
High growth companies will have high market to book ratiosHigh growth companies will have high market to book ratios Market to book ratios are dependent on the industry sectorMarket to book ratios are dependent on the industry sector Is the sector capital intensive?Is the sector capital intensive? Specific sectorsSpecific sectors
Pharmaceutical sector – High R&D – is this an asset or expense?Pharmaceutical sector – High R&D – is this an asset or expense? Branded products – advertising costs – asset or expense?Branded products – advertising costs – asset or expense? Are Tiger Brands and Shoprite capital intensive?Are Tiger Brands and Shoprite capital intensive? Market to Book is an important ratio in the valuation of banksMarket to Book is an important ratio in the valuation of banks

© Correia, Flynn, Uliana & Wormald 28
Free Cash Flow Model Value of the Firm = present value of future Value of the Firm = present value of future
operating cash flows discounted at the firm’s cost operating cash flows discounted at the firm’s cost of capital (WACC)of capital (WACC)
FCF = Net operating profit after tax (NOPAT) + FCF = Net operating profit after tax (NOPAT) + depreciation – capital expenditure –increase in net depreciation – capital expenditure –increase in net working capitalworking capital
Value of Ordinary Equity = Value of Firm less Value of Ordinary Equity = Value of Firm less value of debtvalue of debt

© Correia, Flynn, Uliana & Wormald 29
Alternative: Free Cash Flow to Equity We can determine the We can determine the value of ordinary equityvalue of ordinary equity by by
discounting the cash flows due to shareholders after discounting the cash flows due to shareholders after financing costs and changes in financing flowsfinancing costs and changes in financing flows
FCFE = NOPAT + depreciation – capital FCFE = NOPAT + depreciation – capital expenditure – increase in net working capital – expenditure – increase in net working capital – financing costs plus (minus) increase (decrease) in financing costs plus (minus) increase (decrease) in debt financingdebt financing
Discount rate = cost of equityDiscount rate = cost of equity Recommended for valuing firms with high levels of Recommended for valuing firms with high levels of
debt and banks. For other firms, use FCF to debt and banks. For other firms, use FCF to operations to value the firm and then deduct debt.operations to value the firm and then deduct debt.
© Correia, Flynn, Uliana & Wormald 30
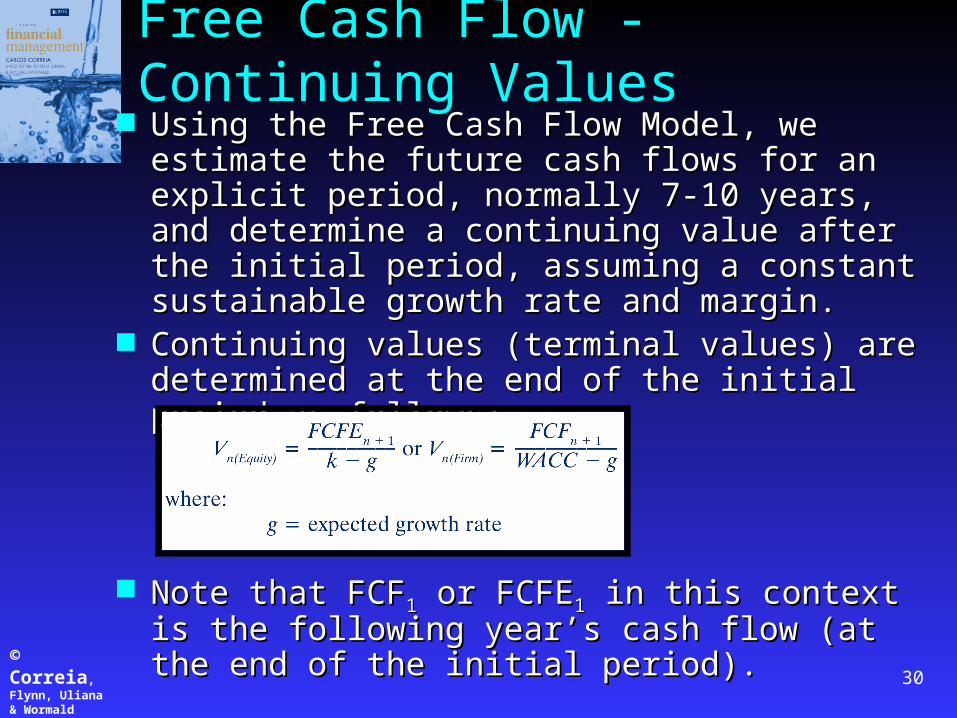
Free Cash Flow - Continuing Values Using the Free Cash Flow Model, we estimate the Using the Free Cash Flow Model, we estimate the
future cash flows for an explicit period, normally 7-future cash flows for an explicit period, normally 7-10 years, and determine a continuing value after the 10 years, and determine a continuing value after the initial period, assuming a constant sustainable initial period, assuming a constant sustainable growth rate and margin.growth rate and margin.
Continuing values (terminal values) are determined Continuing values (terminal values) are determined at the end of the initial period as follows;at the end of the initial period as follows;
Note that FCFNote that FCF11 or FCFE or FCFE11 in this context is the in this context is the following year’s cash flow (at the end of the initial following year’s cash flow (at the end of the initial period).period).

© Correia, Flynn, Uliana & Wormald 31
Free Cash Flows - Example
Assume a company, Stop-to-Shop Ltd, has Assume a company, Stop-to-Shop Ltd, has current earnings before interest and tax (EBIT) current earnings before interest and tax (EBIT) of R72m on sales of R600m. The following of R72m on sales of R600m. The following parameters apply;parameters apply;

© Correia, Flynn, Uliana & Wormald 32
Stop-to-Shop Ltd0 1 2 3 4 5
Stop-to-Shop Ltd Actual Forecast Forecast Forecast Forecast Forecast
Cash flows Rm 20x3 20x4 20x5 20x6 20x7 20x8Sales revenue 600.000 684.000 779.760 888.926 1,013.376 1,074.179
EBIT 12% 72.000 82.080 93.571 106.671 121.605 96.676Tax on EBIT 28% -20.160 -22.982 -26.200 -29.868 -34.049 -27.069Add: Depreciation 9.600 10.944 12.476 14.223 16.214Gross cash flows 68.698 78.315 89.279 101.779 85.821
Investment in NWC and PPENet increase in working capital 13.440 15.322 17.467 19.912 9.728Capital expenditure 26.400 30.096 34.309 39.113 28.375Investment cash flows 39.840 45.418 51.776 59.025 38.103
Free Cash Flows (FCF) 28.858 32.898 37.503 42.754 47.718PV factor 11% 0.9009 0.8116 0.7312 0.6587 0.5935PV of FCF (WACC) 25.998 26.700 27.422 28.163 28.318Sum of Years 1-4 (20x4-20x7) 108.283 Continuing Value (terminal value)PV of FCF in 20x8 (FCFn+1) 28.318
PV of CV -20x9 onwards 600.347 CV 20x8 = FCF20x8(1+g)/(WACC-g)Value of the Firm 736.948 FCF 20x9 50.581Less: Value of debt 320.000- WACC-g 5%Value of Ordinary Equity 416.948 PV of CV 1,011.620 0.59345 600.347
Note the effects of rounding, for example,
No. of shares in issue 280.000 FCF 20x9 47.717854 106% 50.580925
Value per ordinary share 1.49
= 1,011.620

© Correia, Flynn, Uliana & Wormald 33
Free Cash Flow - Workings
Stop-to-Shop LtdStop-to-Shop Ltd
414243444546474849
A B C D E F G HWorkings 20x3 20x4 20x5 20x6 20x7 20x8Net Inv. in working capital1
16% 96.000 109.440 124.762 142.228 162.140 171.869 Change in working capital 13.440 15.322 17.467 19.912 9.728 1.[0.18+0.12+.02-.16]
Capital Expenditure126.400 30.096 34.309 39.113 28.375
Closing net book value 20% 120.000 136.800 155.952 177.785 202.675 214.836 Depreciation 8% 9.600 10.944 12.476 14.223 16.214 1Capital expenditure = Closing net book value +depreciation -prior year's closing net book value
© Correia, Flynn, Uliana & Wormald 34
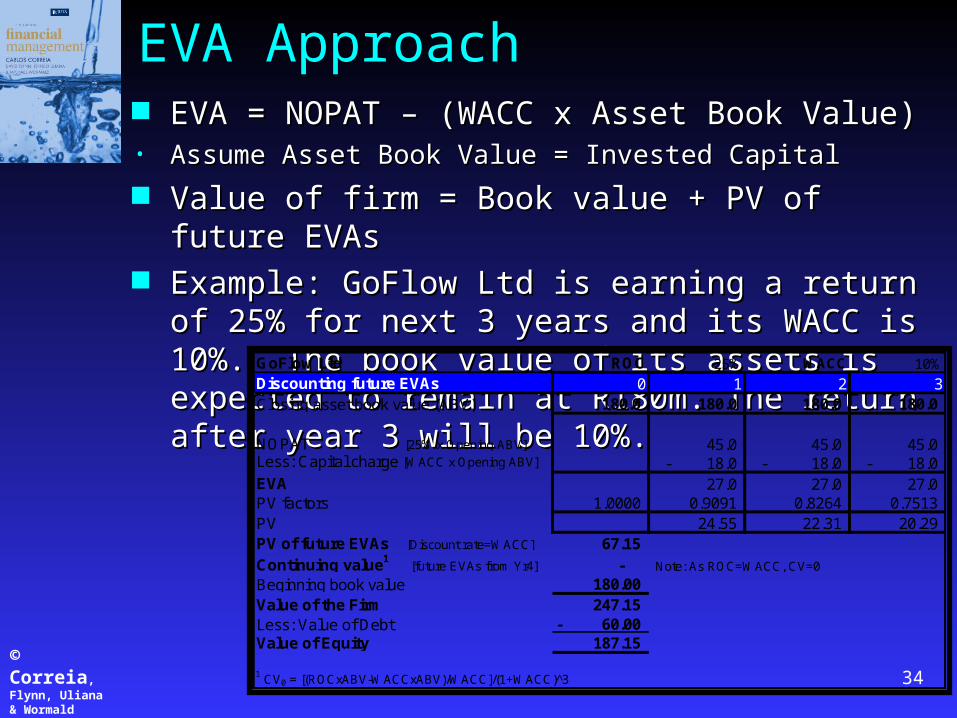
EVA Approach EVA = NOPAT – (WACC x Asset Book Value)EVA = NOPAT – (WACC x Asset Book Value)• Assume Asset Book Value = Invested CapitalAssume Asset Book Value = Invested Capital
Value of firm = Book value + PV of future EVAsValue of firm = Book value + PV of future EVAs Example: GoFlow Ltd is earning a return of 25% for next 3 Example: GoFlow Ltd is earning a return of 25% for next 3
years and its WACC is 10%. The book value of its assets is years and its WACC is 10%. The book value of its assets is expected to remain at R180m. The return after year 3 will be expected to remain at R180m. The return after year 3 will be 10%.10%. GoFlow Ltd ROC 25% WACC 10%
Discounting future EVAs 0 1 2 3Closing asset book value (ABV) 180.0 180.0 180.0 180.0
NOPAT [25% x Opening ABV] 45.0 45.0 45.0 Less: Capital charge [WACC x Opening ABV] 18.0- 18.0- 18.0- EVA 27.0 27.0 27.0 PV factors 1.0000 0.9091 0.8264 0.7513 PV 24.55 22.31 20.29 PV of future EVAs [Discount rate=WACC] 67.15 Continuing value1 [future EVAs from Yr4] - Note: As ROC=WACC, CV=0
Beginning book value 180.00 Value of the Firm 247.15 Less: Value of Debt 60.00- Value of Equity 187.15
1 CV0 = [(ROCxABV-WACCxABV)/WACC]/(1+WACC)^3

© Correia, Flynn, Uliana & Wormald 35
The Process of Valuation
Value Value what iswhat is and what and what could becould be.. Valuation QuestionsValuation Questions
How does the value change if the company undertakes financial restructurings?
What is the current share price?
Value of the company on basis of existing operations?
How does the value change if the company achieves industry best practice?
How does the value change if the company undertakes divestments or acquisitions?
How does the value change if the company changes its capital structure?

© Correia, Flynn, Uliana & Wormald 36
Valuations and the Financial Manager Focus on shareholder value means that the Focus on shareholder value means that the
financial manager will focus on value financial manager will focus on value maximisation.maximisation.
Why is valuation important?Why is valuation important? Valuation of company and divisions for listing Valuation of company and divisions for listing
purposespurposes Valuations for purpose of divestures or acquisitionsValuations for purpose of divestures or acquisitions Valuation for purpose of determining an optimal Valuation for purpose of determining an optimal
capital structurecapital structure Valuation for determining cost of equity and WACCValuation for determining cost of equity and WACC Share buybacksShare buybacks Managerial remunerationManagerial remuneration

© Correia, Flynn, Uliana & Wormald 37
Valuations - Pitfalls Confusing the valuation of equity with the valuation of the Confusing the valuation of equity with the valuation of the
firmfirm Using the wrong discount rate - use the cost of equity for Using the wrong discount rate - use the cost of equity for
cash flows to ordinary equity and the WACC for cash flows cash flows to ordinary equity and the WACC for cash flows to the firmto the firm
Adjusting for risk in the cash flows and the discount rateAdjusting for risk in the cash flows and the discount rate Not recognising the risk of a changing capital structure in Not recognising the risk of a changing capital structure in
the discount ratethe discount rate No comparable firmsNo comparable firms Double counting for synergy by increasing cash flows and Double counting for synergy by increasing cash flows and
reducing the discount ratereducing the discount rate Increasing the discount rate for country risk when this is Increasing the discount rate for country risk when this is
already included in the risk free ratealready included in the risk free rate Misestimating the value of control.Misestimating the value of control.