Valuation Through EVA and Conventional Measures an Empirical Study
12
An abstract on the proposed research paper on Valuation through EVA and conventional measures: An empirical study Submitted By: Dr. Ashish Joshi & Prof. Vishal Goel, Department of Management, Indus Institute of Technology & Engineering, Ahmedabad It is notable that many companies in India are focusing on value creation. The companies have adopted different methods of measuring shareholder value. A number of them measure and report Economic Value Added (EVA), Market Value Added (MVA) and shareholder return based on the market value of shares. Several researchers and practitioners have claimed that Economic Value Added (EVA) is superior to traditional accounting measures in driving shareholder value. EVA is one such innovation. Unlike conventional accounting measures of performance, EVA attempts to measure the value that firms create or destroy by subtracting a capital charge from the cash returns they generate on invested capital. The conventional measures are Return on Equity (ROE), Return on Net worth (RONW), Return on Capital Employed (ROCE) and Earnings per Share (EPS). EVA combines factors such as economy, accounting and market information in its assessment. This paper describes and compares the EVA with other measures. This study is attempts to calculate the EVA and conventional performance measures. Apart from this, taking the real financial data of a company, the paper shows how EVA calculations can be done to demonstrate whether the company is adding to shareholder value by generating profits over and above the capital charge. From the analysis it can observed that EVA can be treated as one of the best measure for measuring the value of shareholders. Key Terms: Earnings per Share (EPS), Economic Value Added (EVA), Return on Capital Employed (ROCE) and Return on Net worth (RONW).
-
Upload
goel76vishal -
Category
Documents
-
view
17 -
download
1
description
t is notable that many companies in India are focusing on value creation. The companies have adopted different methods of measuring shareholder value. A number of them measure and report Economic Value Added (EVA), Market Value Added (MVA) and shareholder return based on the market value of shares. Several researchers and practitioners have claimed that Economic Value Added (EVA) is superior to traditional accounting measures in driving shareholder value. EVA is one such innovation. Unlike conventional accounting measures of performance, EVA attempts to measure the value that firms create or destroy by subtracting a capital charge from the cash returns they generate on invested capital. The conventional measures are Return on Equity (ROE), Return on Net worth (RONW), Return on Capital Employed (ROCE) and Earnings per Share (EPS). EVA combines factors such as economy, accounting and market information in its assessment. This paper describes and compares the EVA with other measures. This study is attempts to calculate the EVA and conventional performance measures. Apart from this, taking the real financial data of a company, the paper shows how EVA calculations can be done to demonstrate whether the company is adding to shareholder value by generating profits over and above the capital charge. From the analysis it can observed that EVA can be treated as one of the best measure for measuring the value of shareholders.
Transcript of Valuation Through EVA and Conventional Measures an Empirical Study

An abstract on the proposed research paper on
Valuation through EVA and conventional measures: An empirical study
Submitted By:
Dr. Ashish Joshi & Prof. Vishal Goel,
Department of Management, Indus Institute of Technology & Engineering, Ahmedabad
It is notable that many companies in India are focusing on value creation. The companies have adopted different
methods of measuring shareholder value. A number of them measure and report Economic Value Added (EVA),
Market Value Added (MVA) and shareholder return based on the market value of shares.
Several researchers and practitioners have claimed that Economic Value Added (EVA) is superior to traditional
accounting measures in driving shareholder value. EVA is one such innovation. Unlike conventional accounting
measures of performance, EVA attempts to measure the value that firms create or destroy by subtracting a capital
charge from the cash returns they generate on invested capital. The conventional measures are Return on Equity
(ROE), Return on Net worth (RONW), Return on Capital Employed (ROCE) and Earnings per Share (EPS).
EVA combines factors such as economy, accounting and market information in its assessment. This paper
describes and compares the EVA with other measures. This study is attempts to calculate the EVA and
conventional performance measures.
Apart from this, taking the real financial data of a company, the paper shows how EVA calculations can be done
to demonstrate whether the company is adding to shareholder value by generating profits over and above the
capital charge. From the analysis it can observed that EVA can be treated as one of the best measure for
measuring the value of shareholders.
Key Terms: Earnings per Share (EPS), Economic Value Added (EVA), Return on Capital Employed (ROCE) and
Return on Net worth (RONW).

(I) Introduction
To create value for the entire company means to maximize the total value. A traditional measure reflects historical
performance, having a limited relevance for anticipate the future evolution of performance. Under conventional
accounting, most companies emerge profitable but many in fact are not. As Peter Drucker rightly remarked in a
Harvard Business Review article, “Until a business returns a profit that is greater than its cost of capital. It
operates at a loss. Never mind that it pays taxes as if it had a genuine profit. The enterprise still returns less to the
economy than it devours in resources….. Until then it does not create wealth; it destroy it.”
The Concept of EVA
EVA is a value based financial performance measure, an investment decision tool and a performance measure
reflecting the absolute amount of shareholder value created. It is computed as the product of the “excess return”
made on an investment or investments and the capital invested in that investment or investments. EVA is the net
operating profit minus an appropriate charge for the opportunity cost of all capital invested in an enterprise or
project. It is an estimate of true economic profit, or the amount by which earnings exceed or fall short of the
required minimum rate of return investors could get by investing in other securities of comparable risk (Stewart,
1990).
By taking all capital costs into account, including the cost of equity, EVA shows the monetary amount of wealth a
business has created or destroyed in each reporting period. In other words, EVA is the profit as defined by the
share holders.
The capital charge is the most distinctive and important aspect of EVA. Under conventional accounting, most
companies appear profitable but many in fact are not. EVA corrects this error by explicitly recognizing that when
managers employ capital they must pay for it, just as if it were a wage.
EVA Vs. Conventional Performance Measures
The development of the concept of EVA has added flexibility in measurement of Performance. The traditional
methods can continue side by side with EVA. Some of the traditional ways of measuring corporate performance
are described here.
Return on Capital Employed (ROCE)
Return on capital Employed is a very good and relatively good performance measure. Different companies
calculate this return with different formulae and call it also with different names like return on invested capital,

return on Investment, return on net assets, return on assets etc. The main shortcoming with all these rates of
return is that in all cases Maximizing rate of return does not necessarily maximize the return to shareholders.
Return on Net worth (RONW)
The level of RONW does not tell the owners if company is creating shareholders’ wealth or destroying it. With
RONW, this shortcoming is much more severe than with ROI, because simply increasing leverage can
increase the ROE. In other words, decreasing solvency does not always make shareholders’ position better
because of the increased financial risk.
Earning per Share (EPS)
EPS is raised simply by investing more capital in business. If the additional capital is equity (retained earnings)
then the EPS will rise if the rate of return of the invested capital is just positive. For example, let us assume that
as on March 31, 2007, company A has net worth of Rs 50 million and 5 million equity shares. At a profit after tax
of Rs 100 million for FY2007, the EPS would work out to be 20. The entire income can be ploughed back in the
business at a marginal return of 5%. Assuming that the return on previous net worth remains the same, the
profit after tax would be Rs 105 million and EPS would be 21. Though the performance has gone down, the
EPS has increased. If the additional capital is debt then the EPS will rise if the rate of return of the invested
capital is just above the cost of debt. In reality, the invested capital is a mix of debt and equity and the EPS will
rise if the rate of return on the additional investment is somewhere between the cost of debt and zero. Therefore
EPS is completely inappropriate measure of corporate performance and still is very common yardstick and even
a common bonus base.
Unlike conventional profitability measures, EVA helps the management and other employees to understand
the cost of equity capital. At least in big companies, which do not have a strong owner, shareholders have
often been perceived as free source of funds. These flaws are taken care of by the concept of economic value
added. The key feature of this concept is that for the first time any measure takes cares of the opportunity cost
of capital invested in business.
Comparison of different Conventional Performance Measures
Performance
Measures
Computation Includes
Returns Capital Employed (CE) Cost of CE
NOPAT Yes No No
ROCE Yes Yes No
EPS Yes Yes No
From the above table. It is clear that traditional measure of corporate performance does not consider cost
of capital in calculation of NOPAT whereas EVA includes the same.

(II) Literature Review
A number of studies have been conducted to establish the relationship between EVA and traditional
accounting measures
The pioneering studies of Stewart:
1. Stern’s comparison of EVA with popular accounting measures
In the study titled ‘Stern’s comparison of EVA with popular accounting measures’, Stern1 (1993:36) argues that the
key operating measure of corporate performance is not popular accounting measures such as earnings, earnings
growth, dividends, dividend growth, ROE, or even cash flow, but in fact EVA. The changes in the market value of a
selected group of companies (specifically their MVAs) have been shown to have a relatively low correlation with the
above accounting measures.
His research showed that the r2 for the relationship between MVA and various independent variables ranged from
9% for turnover growth to 25% for ROE rates. By comparison, the r2 for EVA relative to MVA was 50%. All the
results were based on averages and they are set out in Table 1.
Table 1 MVA vs other financial performance measures
Correlation with MVA r2
EVA 50%
ROE 25%
Cash flow growth 22%
EPS growth 18%
Asset growth 18%
Dividend growth 16%
Turnover growth 9%
Source: Adapted from Stern (1933:36)
Ashok Banerjee in his research titled as, “Economic Value Added (EVA): a better performance measure” 2
,has argued that for superiority of EVA over other traditional financial performance measures. Ten industries
have been chosen and each industry is represented by four/five companies. ROI and EVA have been
calculated for sample companies and a comparison of both has been undertaken, showing the superiority of
EVA over ROI. Indian companies are gradually recognizing the importance of EVA. Some of such companies
are Ranbaxy Laboratories, Samtel India Ltd and Infosys Technologies Ltd.
Pattanayak and Mukherjee3 (1998) in his research, found out that there are traditional methods to measure
corporate income or known as accounting concept and there is also a modern method to measure corporate
income or known as economic concept. EVA, which is based on economic concept, is professed to be a
superior technique to identify whether the organization’s NOPAT (Net Operating Profit after Tax) during a
period is covering its WACC (Weighted Average Cost of Capital), thus generating value for its owners. But it is
very tricky to calculate EVA. Companies trying to implement EVA are asked to incorporate 164 amendments to
their financial accounts.
Uyemura et al.4– EVA and wealth creation Uyemura et al. (1996:98) In his research he used a sample of the
100 largest US banks for the ten-year period from 1986 to 1995 to calculate MVA and to test the correlation
with EVA, as well as four other accounting measures, namely net income (amount), EPS, ROE and ROA. The
results of their regression analysis are set out in Table 2.
Performance Measure r2
EVA 40%
ROA 13%
ROE 10%
Net Income (amount) 8%
EPS 6%
Source: Uyemura et al. (1996:98)
The analysis above clearly shows that EVA is the measure that correlates the best by far
with shareholder wealth creation. In an alternative approach where changes in the performance measures were
regressed against standardized MVA, the results were not very different. Standardised EVA (EVA divided by
capital) again had an r2 of 40%, while for ROA it was 25%, for ROE it was 21%, for net income it was 3% and for
EPS it was 6%.
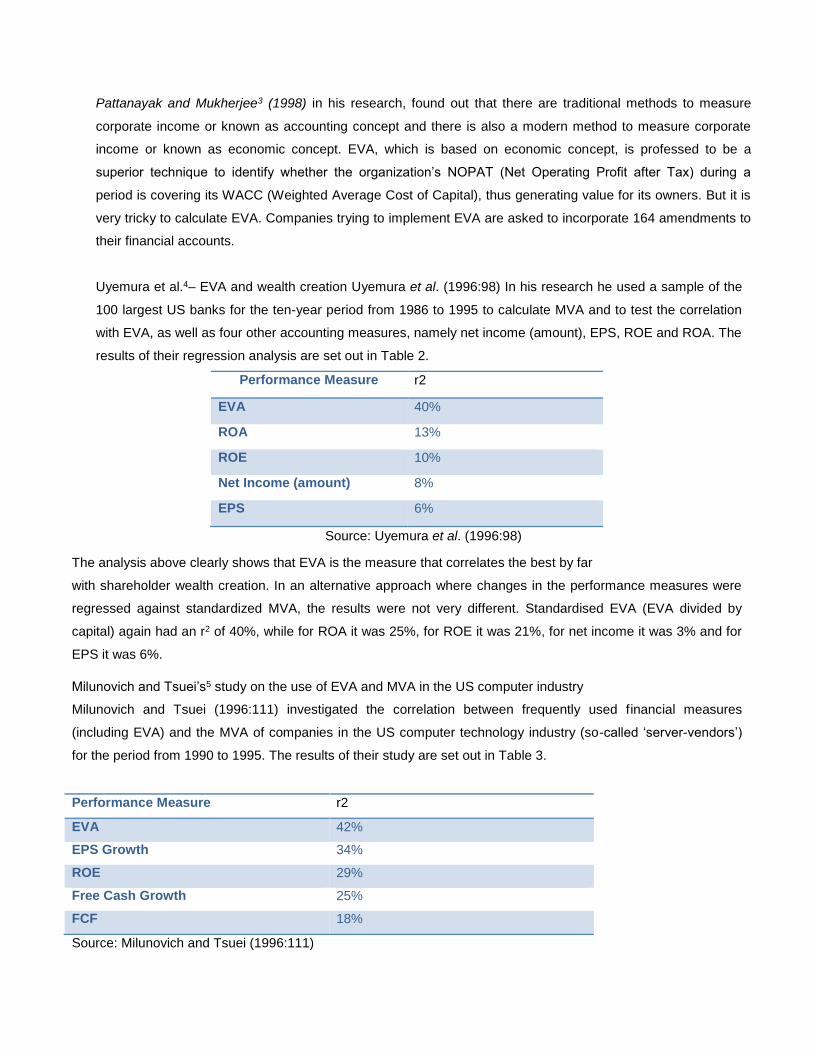
Milunovich and Tsuei’s5 study on the use of EVA and MVA in the US computer industry
Milunovich and Tsuei (1996:111) investigated the correlation between frequently used financial measures
(including EVA) and the MVA of companies in the US computer technology industry (so-called ‘server-vendors’)
for the period from 1990 to 1995. The results of their study are set out in Table 3.
Performance Measure r2
EVA 42%
EPS Growth 34%
ROE 29%
Free Cash Growth 25%
FCF 18%
Source: Milunovich and Tsuei (1996:111)

Clearly EVA demonstrated the best correlation and it would be fair to infer that a company that can consistently
improve its EVA should be able to boost its MVA and therefore its shareholder value. Milunovich and Tsuei
(1996:111) argue that the relatively weak correlation between MVA and FCF is due to the fact that FCF can be a
misleading indicator. They point out that a fast-growing technology start-up company with positive EVA investment
opportunities and a loss-making company on the verge of bankruptcy can have similar negative cash flows. They
concluded that growth in earnings is not enough to create value, unless returns are above the cost of capital. They
are of the opinion that EVA works best as a supplement to other measures when one is evaluating shares and that
EVA sometimes works when other measures fail.
Ghanbari and Sarlak6 (2006) studied economic value added in Indian automobile industry. The objectives of the
study are: to compute and analyze Economic Value Added (EVA) of firms in the automobile industry and to identify
the EVA trend of the industry the period of the study. The study found that the Economic Value Added (EVA) of
only 30 % of the selected companies is positive and 70 % of the selected companies have destroyed their
shareholders wealth by negative EVA. The study concluded that there has been a significant increasing trend in
EVA of the Automobile Industry firms which means that companies have a positive trend to improve their firm
values.
Dodd and Chen’s7 investigation of the explanatory power of EVA
Dodd and Chen (1996:27) used the 1992 Stern Stewart 1000 database as a starting point and added some
supplementary data for the ten years from 1983 to 1992. They gathered complete data for 566 US companies and
set out to test the claim that EVA is a superior measure of shareholder value performance. Although they did find a
correlation between share returns and EVA (an r2 of share returns and ROA, for which the r2 was 25%. The r2 of
20%), it was not as high as the r for the other accounting measures tested, namely EPS and ROE, was very low
(between 5% and 7%).
Based on the data for this large number of companies over as long a period as 10 years, it appears that EVA does
not relate well to share returns. The results that Dodd and Chen (1996) obtained imply that 80% of changes in
share returns could not be accounted for by changes in EVA. In their study (bearing in mind that unadjusted data
were used), the ROA displayed a better explanatory ability than EVA did. Dodd and Chen (1996:27) also found that
residual income, which is similar to EVA, except for the adjustments required to deal with the so-called accrual
accounting distortions, gave results almost identical to those achieved using EVA. The r2 of residual income
relative to share returns was 19%, compared to EVA’s r2 of 20%. Even when more complete multiple regression
models were used, the results for the two 2measures were almost the same. The r2 for EVA-based measures was
41% for residual income-based measures. Dodd and Chen (1996) concluded that EVA and residual income
performance measurement systems would, in general, yield similar results.

(III) Objectives:
1. To calculate the EVA and Traditional Performance measures like ROCE, EPS, RONW of ITC Ltd.
2. To compare EVA with the Traditional methods for evaluating a company’s financial performance
Introduction of FMCG Sector:
The Indian FMCG sector is the fourth largest in the economy and has a market size of US$13.1 billion. FMCG in
India has a strong and competitive MNC presence across the entire value chain. It has been predicted that the
FMCG market will reach to US$ 33.4 billion in 2015 from US $ billion 11.6 in 2003. The middle class and the rural
segments of the Indian population are the most promising market for FMCG, and give brand makers the
opportunity to convert them to branded products. Most of the product categories like jams, toothpaste, skin care,
shampoos, etc, in India, have low per capita consumption as well as low penetration level, but the potential for
growth is huge. The big firms are growing bigger and small-time companies are catching up as well.
According to the study conducted by AC Nielsen, 62 of the top 100 brands are owned by MNCs, and the balance
by Indian companies. Fifteen companies own these 62 brands, and 27 of these are owned by Hindustan Lever.
Pepsi is at number three followed by Thums Up. Britannia takes the fifth place, followed by Colgate (6), Nirma (7),
Coca-Cola (8) and Parle (9).
These are figures the soft drink and cigarette companies have always shied away from revealing. Personal care,
cigarettes, and soft drinks are the three biggest categories in FMCG. Between them, they account for 35 of the
top 100 brands.
Exhibit I THE TOP 10 COMPANIES IN FMCG SECTOR
S. NO. Companies
1. Hindustan Unilever Ltd.
2. ITC (Indian Tobacco Company)
3. Nestlé India
4. GCMMF (AMUL)
5. Dabur India
6. Asian Paints (India)
7. Cadbury India
8. Britannia Industries
9. Procter & Gamble Hygiene and Health Care
10. Marico Industries
Source: Naukrihub.com

Introduction of ITC Ltd.
This Company was earlier known as Imperial Tobacco Company of India Ltd. It is currently headed by Yogesh
Chander Deveshwar. ITC has a diversified presence in Cigarettes, Hotels, Paperboards & Specialty Papers,
Packaging, Agri-Business, Packaged Foods & Confectionery, Information Technology, Branded Apparel, Greeting
Cards, Safety Matches and other FMCG products. While ITC is an outstanding market leader in its traditional
businesses of Cigarettes, Hotels, Paperboards, Packaging and Agri-Exports, it is rapidly gaining market share
even in its nascent businesses of Packaged Foods & Confectionery, Branded Apparel and Greeting Cards. ITC
employs over 21,000 people at more than 60 locations across India. The Company continuously endeavors to
enhance its wealth generating capabilities in a globalizing environment to consistently reward more than
4,88,000 shareholders, fulfill the aspirations of its stakeholders and meet societal expectations. This over-arching
vision of the company is expressively captured in its corporate positioning statement: "Enduring Value. For the
nation and for the shareholder.
(IV) Research Methodology:
Source of Data:
This study is based on secondary data. For the purpose of present study, required financial data were collected
from ITC Ltd. website in the form of Annual reports and other relevant information has been collected from other
publications.
Tools of Analysis:
EVA calculation:
Every calculations are done under Microsoft Excel mostly with the help of inbuilt functions.
EVA Calculation
EVA = NOPAT - WACC (Capital Invested)
There are three stages involved in this they are
1. Calculation of NOPAT: Net Operating Profit after Taxes
2. Calculation of WACC: Weighted Average Cost of Capital
3. Calculation of Invested Capital
Following steps are followed: Calculating NOPAT (Net Operating Profit after Tax) using profit and loss account.
1) Calculating invested capital using Balance Sheet.
2) Extracting the risk free rate from sources.
3) Calculating cost of debt.
4) Calculating the cost of equity
5) Using the above information, calculating EVA.

EVA = NOPAT - WACC (Capital Invested)
1. Calculation of NOPAT:
Getting to NOPAT takes three basic steps:
1. Start with earning before interest and taxes (EBIT)
The formula adopted to calculate NOPAT is as follows
NOPAT = EBIT (1+ Tax rate)
2. Calculation of WACC:
It refers weighted average cost of capital (equity and debt). WACC used in the
Calculations are at book value of equity and debt. It is calculated as follows:
WACC = Ke *W1+ Kd *W2
Where,
W1 is weight of EQUITY
W2 is weight of DEBT
Ke is cost of EQUITY
Kd is cost of DEBT
W1 = Total equity / Total Capital.
W2 = Total debt / Total capital
Ke = Risk-Free Rate + (Beta x Equity Premium)
Equity Premium = Rf + β (Rm - Rf)
Where
Rf is Risk-Free Rate of Return.
Rm is Average Return from Sensex which is considered as proxy to Market.
β is Beta.
Kd = Interest expences (1- Tax rate) / Amount of Debt

Sources of Data
Particulars 2007 2008 2009 2010 2011
1.Debt 200.88 208.86 214.43 165.92 177.55
2. Equity 10437.08 12057.67 13735.08 14064.38 15953.27
3.Capital Employed 10637.96 12266.53 13949.51 14230.30 16130.82
4. Cost of Debt% 4.29 8.27 13.24 44 32.85
5. Cost of Equity 17.50 17.50 17.50 17.50 17.50
6. Weighted Average Cost of
Capital % (WACC)
17.25 17.34 17.34 17.81 17.67
7.COCE (3*6) 1835.11 2127.36 2432.02 2534.27 2850.14
8. Profit After Tax, before
exceptional items
2699.97 3120.10 3263.59 4061 4987.61
9. Add: Interest, After taxes 8.62 17.27 28.38 73 58.32
10. Net Operating profit After taxes
(NOPAT)
2708.59 3137.37 3291.97 4134 5045.93
11. COCE, as per (7) above 1835.11 2127.36 2432.02 2534.27 2850.14
12. EVA(10-11) 873.48 1010.01 859.95 1599.73 2195.79
Source: Data collected from Annual reports of ITC Ltd.
Interpretation
From the above table, it can be inferred that the company has been adding value to the shareholders
during the period of study (2007-2011). The calculation of EVA depends on the calculation of the
components of the EVA. The major components of EVA are NOPAT and COCE. The EVA of the
company has been increased from Rs.873.48 Crores for the year 2007 to Rs.2195.79 Crores for the
year 2011, indicating thereby a good economic earning capacity of the company. However, in the
year 2009 the EVA has indicated a significant decline it can be observed that the key reason behind
the same is sharp rise in cost of debt compared to last year. As mentioned in above table, in last two
years, the EVA has increased significantly.

(V) EVA Vs. Conventional Measures
Year EVA in
Crores ROCE (%)
RONW
(%) EPS
EVA as a
% of
Capital
Employed
EVA as a
% of Net
Worth
EVA as a %
of No. of
Shares
outstanding
2007 873.46 25.38 25.86 7.23 8.21 8.37 2.34
2008 1010.01 25.44 25.88 8.28 8.23 8.38 2.68
2009 859.95 23.40 23.76 8.64 6.16 6.26 2.28
2010 1599.73 28.54 28.74 10.64 11.24 11.24 4.19
2011 2195.78 30.92 31.26 6.45 13.61 13.61 2.84
Interpretation:
From the above table 2, it was observed that ITC Ltd. portrays a glowing picture in terms of Return on Capital
Employed, Return on Net worth and EPS. In the year 2007, ROCE is 25.8% i.e., for every Rs 100 investment the
return is Rs 25.38, where as EVA as a % of Capital Employed is only 8.21 i.e., for every Rs 100 investment, the
company has added value of Rs 8.21.On an average, the Return on Capital Employed during the study period is
26.74 % whereas average EVA as a % of Capital Employed is 9.6%. In the year 2007, RONW is 25.86 % i.e., for
every Rs 100 investment the return is Rs 25.86, whereas EVA as a % of Net Worth is only 8.37 i.e., for every Rs
100 investment, the company has added value of Rs 8.37. In the year 2007, EPS was 7.23% i.e., for every Rs
100 investment the return is Rs 7.23, whereas EVA as a % of Outstanding shares is only 2.34 i.e., for every
Rs100 investment, the company has added value of Rs 2.34. Thus the comparison shows that divergence exists
between the performance results given by traditional methods and EVA. The conventional measures do not
reflect the real value addition to shareholder’s wealth.
(VI) Conclusion
From the analysis, it is clearly observed that EVA, when compared with traditional measures, it gives exact figures
how much really the shareholder is going to get at the end of the accounting year by considering cost of capital
like cost of equity, cost of debt. Hence I conclude that EVA is the best appropriate measure for measuring the
value of shareholders.

References
1. [1] Stern, J, “The EVA Challenges, “New York: John Willey & Sons, 1993, pp. 25-35.
2. Banerjee, Ashok (1997), “Economic Value Added (EVA): a better performance
measure”, The Management Accountant, December 1997, pp. 886 – 888.
3. Pattanayak, J.K., Mukherjee, K. (1998), “Adding Value to Money”, The Chartered
Accountant, February 1998, pp. 812.
4. Uyemura, D. G., C. C. Kantor and J. M. Petit, “EVA for Banks: Value Creation, Risk
Management and Profitability Measurement,” Journal of Applied Corporate Finance,
9(2), 1996, pp. 94-111.
5. Milunovich, S. and A. Tsuei, “EVA in the Computer Industry,” Journal of Applied
Corporate Finance, 9(2), 1996 pp. 104-115.
6. Ghanbari, M. Ali and Sarlak, Narges (2006), “Economic Value Added: An Appropriate
Performance Measure in the Indian Automobile Industry”, The Icfain Journal of
Management Research, Vol. V, No. 8, March 2006, pp. 45-57.
7. Chen, S. and J. L. Dodd, “Economic Value Added: An Empirical Examination of a New
Corporate Performance Measure,” Journal of Managerial Issues, 9(3), 1996, pp. 318-
333.