The Study was completed by Economic Planning Systems (EPS ...
®
Page 1
5.5% 2.23
Return on Invested Capital (ROIC)
$3.27
$0.89
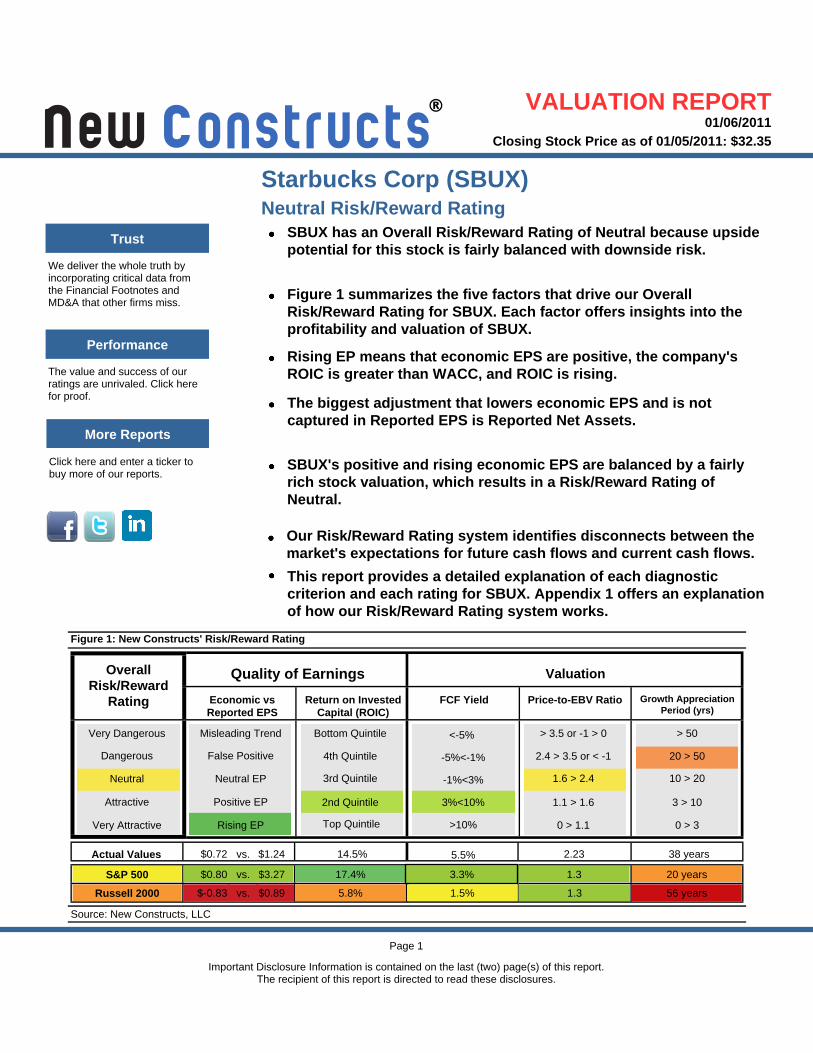
Our Risk/Reward Rating system identifies disconnects between the market's expectations for future cash flows and current cash flows.
5.8% 1.3
Growth Appreciation Period (yrs)
01/06/2011
ValuationQuality of EarningsOverall Risk/Reward
Rating
Figure 1 summarizes the five factors that drive our OverallRisk/Reward Rating for SBUX. Each factor offers insights into theprofitability and valuation of SBUX.
This report provides a detailed explanation of each diagnosticcriterion and each rating for SBUX. Appendix 1 offers an explanationof how our Risk/Reward Rating system works.
$-0.83
SBUX's positive and rising economic EPS are balanced by a fairlyrich stock valuation, which results in a Risk/Reward Rating ofNeutral.
> 50
3 > 10
0 > 3
20 > 50
10 > 20
$0.72
Closing Stock Price as of 01/05/2011: $32.35
14.5%
> 3.5 or -1 > 0
2.4 > 3.5 or < -1
1.6 > 2.4
1.1 > 1.6
0 > 1.1
S&P 500
Important Disclosure Information is contained on the last (two) page(s) of this report. The recipient of this report is directed to read these disclosures.
Russell 2000
20 years
We deliver the whole truth by incorporating critical data from the Financial Footnotes and MD&A that other firms miss.
Economic vs Reported EPS
Actual Values
1.3
Neutral Risk/Reward Rating
17.4%
Rising EP means that economic EPS are positive, the company'sROIC is greater than WACC, and ROIC is rising.
The biggest adjustment that lowers economic EPS and is notcaptured in Reported EPS is Reported Net Assets.
Click here and enter a ticker to buy more of our reports.
vs.
vs.
vs.
Source: New Constructs, LLC
Rising EP
Misleading Trend
False Positive
Neutral EP
Positive EP
Starbucks Corp (SBUX)
3.3%
Trust
Performance
More Reports
38 years
Top Quintile
2nd Quintile
3rd Quintile
4th Quintile
Bottom Quintile
$0.80
Price-to-EBV Ratio
<-5%
3%<10%
>10%
-5%<-1%
-1%<3%
SBUX has an Overall Risk/Reward Rating of Neutral because upsidepotential for this stock is fairly balanced with downside risk.
$1.24
FCF Yield
Very Dangerous
Attractive
Very Attractive
Dangerous
Neutral
The value and success of our ratings are unrivaled. Click here for proof.
Figure 1: New Constructs' Risk/Reward Rating
1.5% 56 years
VALUATION REPORT
®
Page 2: Economic vs Reported Earnings
Economic vs Reported Earnings
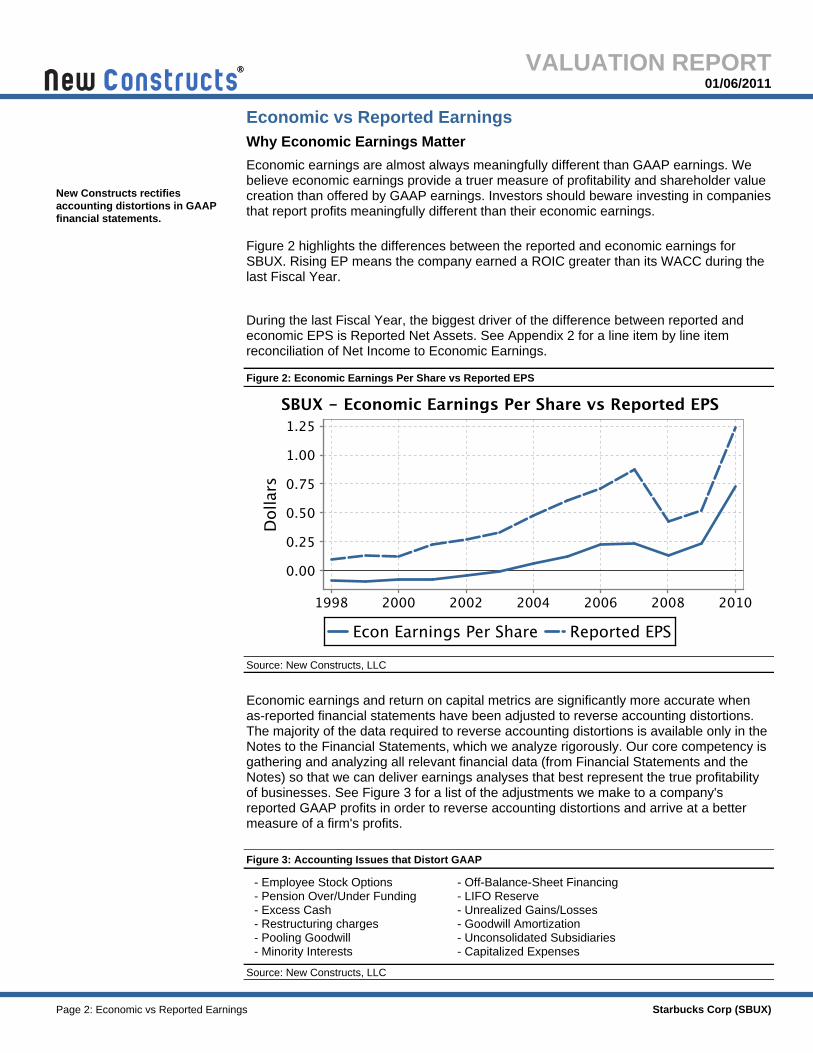
Economic earnings are almost always meaningfully different than GAAP earnings. We believe economic earnings provide a truer measure of profitability and shareholder value creation than offered by GAAP earnings. Investors should beware investing in companies that report profits meaningfully different than their economic earnings.
- Employee Stock Options - Pension Over/Under Funding - Excess Cash - Restructuring charges - Pooling Goodwill - Minority Interests
- Off-Balance-Sheet Financing - LIFO Reserve - Unrealized Gains/Losses - Goodwill Amortization - Unconsolidated Subsidiaries - Capitalized Expenses
01/06/2011
Figure 2 highlights the differences between the reported and economic earnings forSBUX. Rising EP means the company earned a ROIC greater than its WACC during thelast Fiscal Year.
Economic earnings and return on capital metrics are significantly more accurate when as-reported financial statements have been adjusted to reverse accounting distortions. The majority of the data required to reverse accounting distortions is available only in the Notes to the Financial Statements, which we analyze rigorously. Our core competency is gathering and analyzing all relevant financial data (from Financial Statements and the Notes) so that we can deliver earnings analyses that best represent the true profitability of businesses. See Figure 3 for a list of the adjustments we make to a company's reported GAAP profits in order to reverse accounting distortions and arrive at a better measure of a firm's profits.
Why Economic Earnings Matter
During the last Fiscal Year, the biggest driver of the difference between reported andeconomic EPS is Reported Net Assets. See Appendix 2 for a line item by line itemreconciliation of Net Income to Economic Earnings.
Source: New Constructs, LLC
Source: New Constructs, LLC
Starbucks Corp (SBUX)
New Constructs rectifies accounting distortions in GAAP financial statements.
Figure 2: Economic Earnings Per Share vs Reported EPS
VALUATION REPORT
Figure 3: Accounting Issues that Distort GAAP
®
Page 3: Economic vs Reported Earnings
01/06/2011
How We Measure Economic Earnings
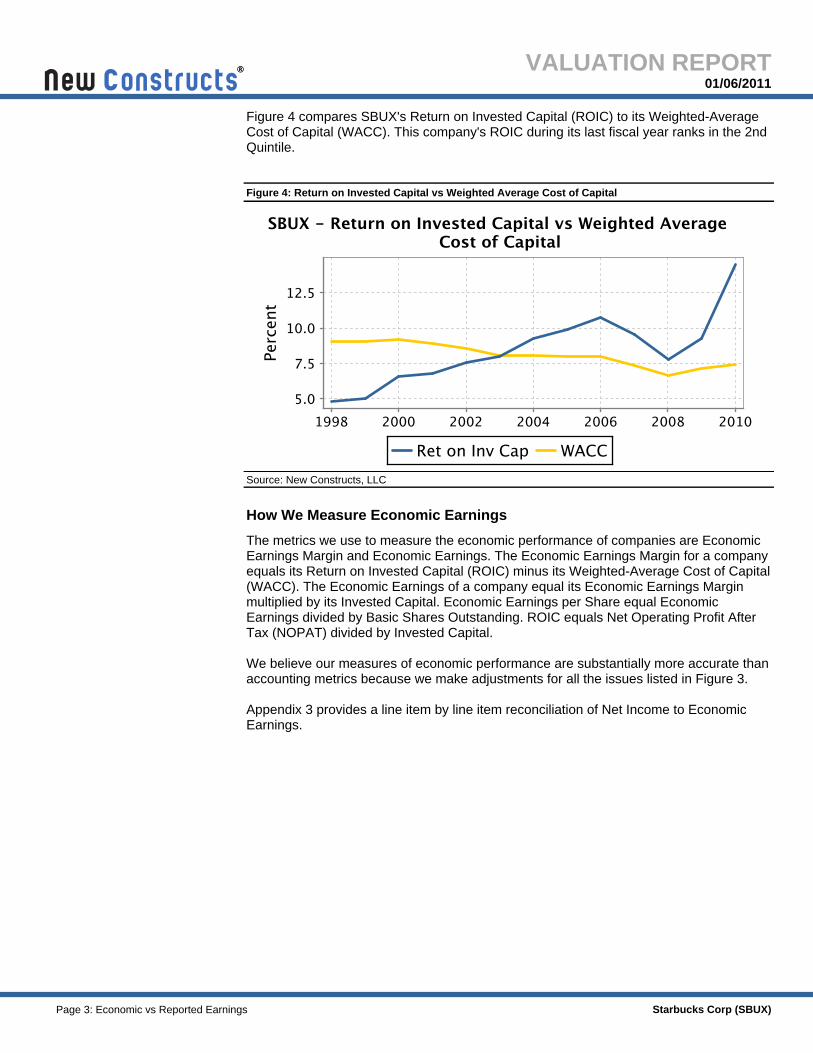
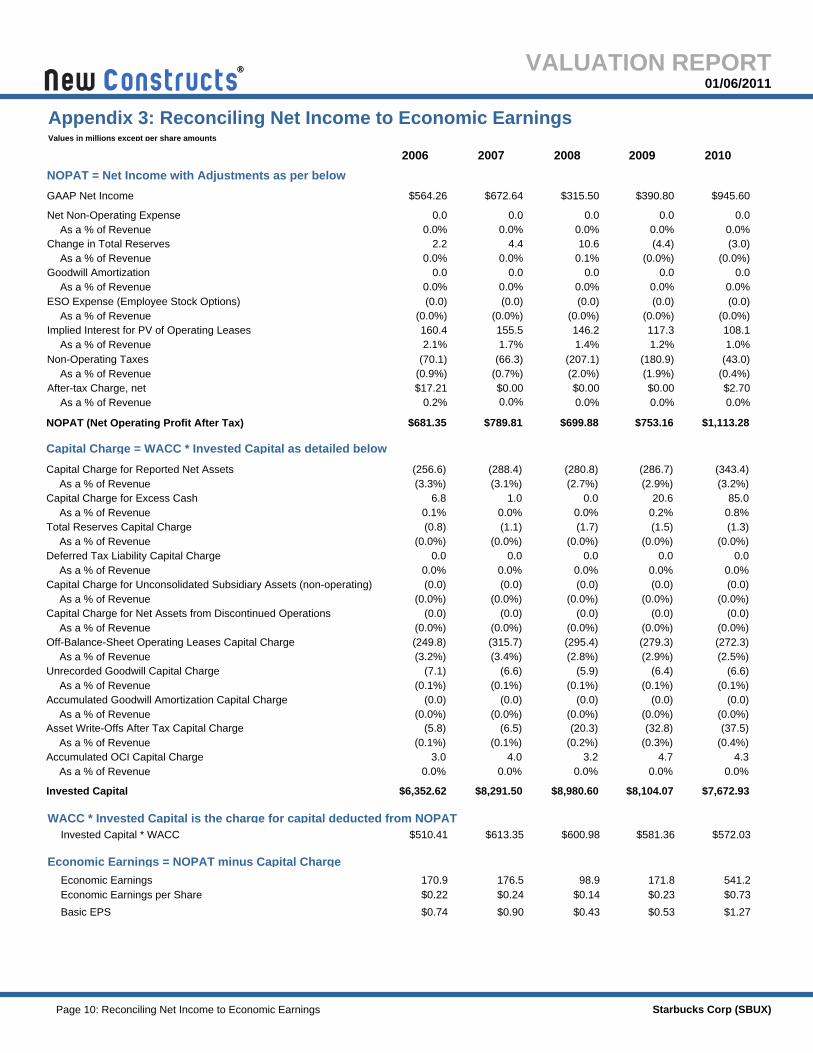
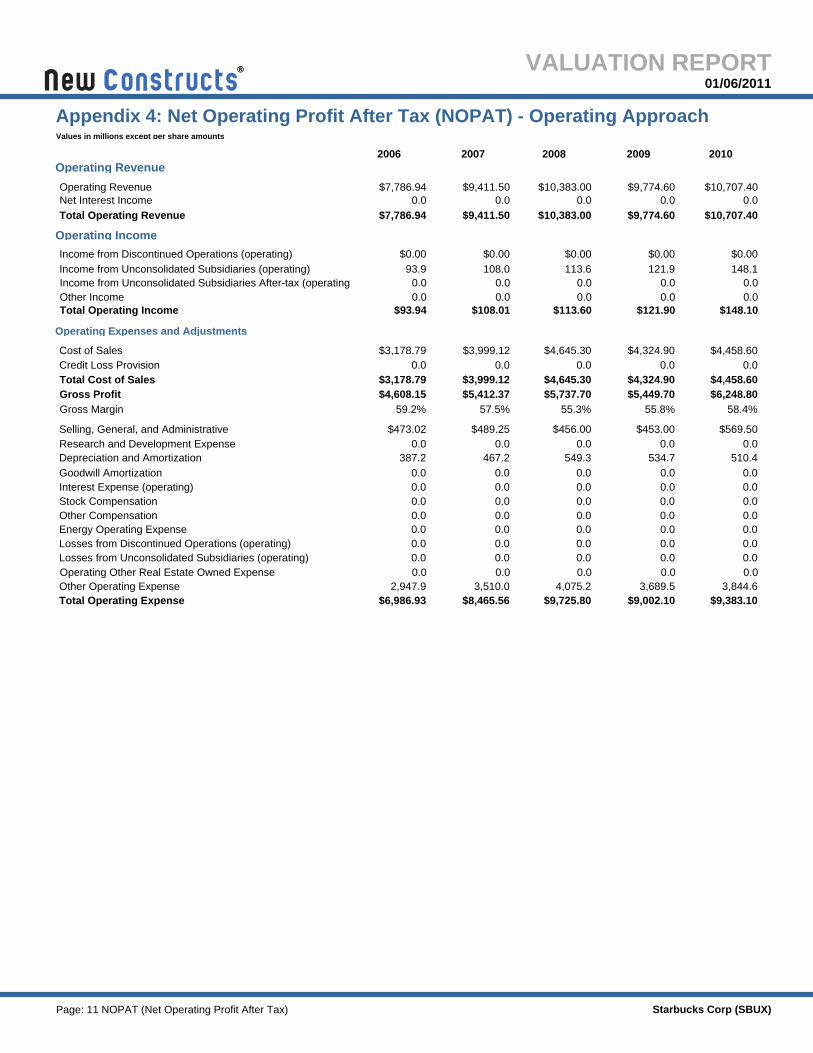
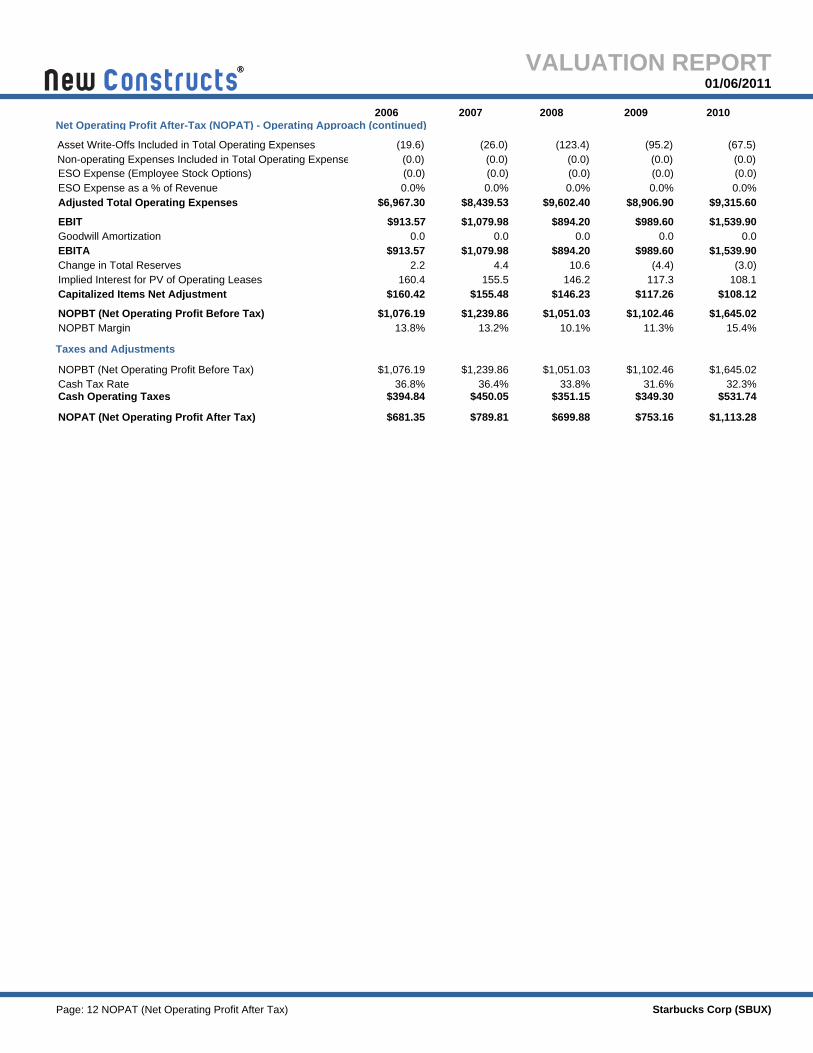
The metrics we use to measure the economic performance of companies are Economic Earnings Margin and Economic Earnings. The Economic Earnings Margin for a company equals its Return on Invested Capital (ROIC) minus its Weighted-Average Cost of Capital (WACC). The Economic Earnings of a company equal its Economic Earnings Margin multiplied by its Invested Capital. Economic Earnings per Share equal Economic Earnings divided by Basic Shares Outstanding. ROIC equals Net Operating Profit After Tax (NOPAT) divided by Invested Capital. We believe our measures of economic performance are substantially more accurate than accounting metrics because we make adjustments for all the issues listed in Figure 3. Appendix 3 provides a line item by line item reconciliation of Net Income to Economic Earnings.
Figure 4 compares SBUX's Return on Invested Capital (ROIC) to its Weighted-AverageCost of Capital (WACC). This company's ROIC during its last fiscal year ranks in the 2ndQuintile.
Source: New Constructs, LLC
Starbucks Corp (SBUX)
Figure 4: Return on Invested Capital vs Weighted Average Cost of Capital
VALUATION REPORT
®
Page 4: Free Cash Flow Yield
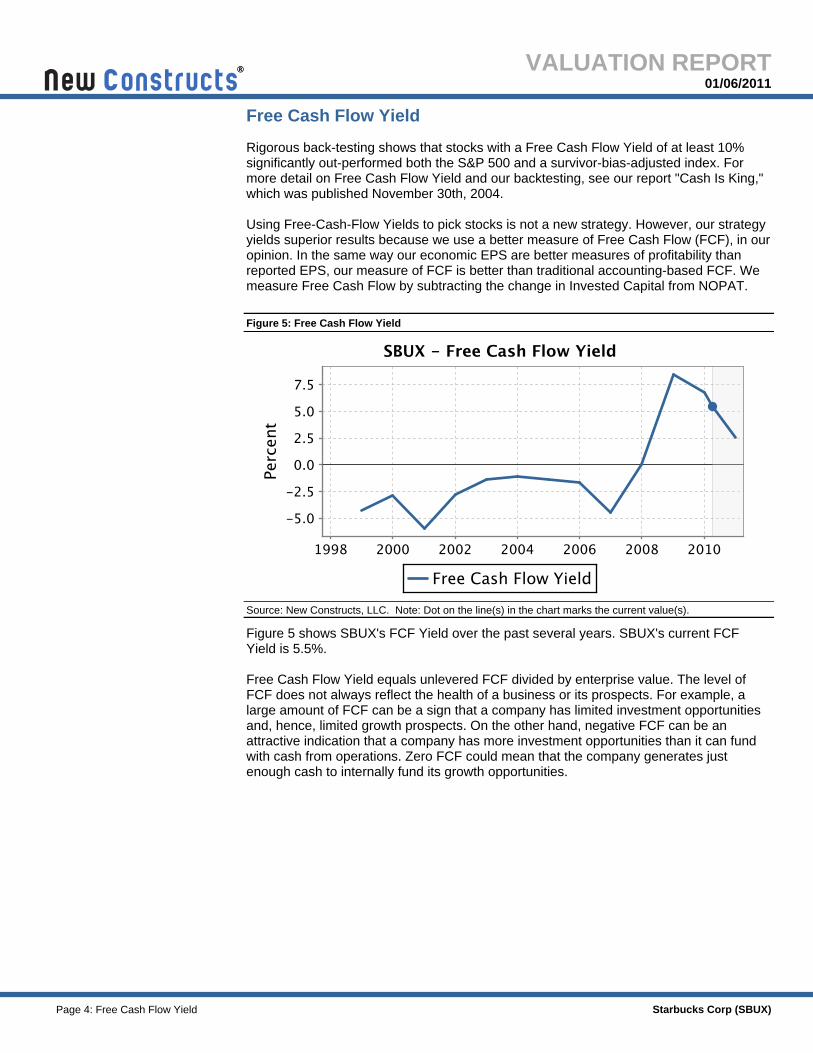
Figure 5: Free Cash Flow Yield
01/06/2011
Free Cash Flow Yield
Figure 5 shows SBUX's FCF Yield over the past several years. SBUX's current FCFYield is 5.5%.
Free Cash Flow Yield equals unlevered FCF divided by enterprise value. The level ofFCF does not always reflect the health of a business or its prospects. For example, alarge amount of FCF can be a sign that a company has limited investment opportunitiesand, hence, limited growth prospects. On the other hand, negative FCF can be anattractive indication that a company has more investment opportunities than it can fundwith cash from operations. Zero FCF could mean that the company generates justenough cash to internally fund its growth opportunities.
Rigorous back-testing shows that stocks with a Free Cash Flow Yield of at least 10% significantly out-performed both the S&P 500 and a survivor-bias-adjusted index. For more detail on Free Cash Flow Yield and our backtesting, see our report "Cash Is King," which was published November 30th, 2004. Using Free-Cash-Flow Yields to pick stocks is not a new strategy. However, our strategy yields superior results because we use a better measure of Free Cash Flow (FCF), in our opinion. In the same way our economic EPS are better measures of profitability than reported EPS, our measure of FCF is better than traditional accounting-based FCF. We measure Free Cash Flow by subtracting the change in Invested Capital from NOPAT.
Starbucks Corp (SBUX)
Source: New Constructs, LLC. Note: Dot on the line(s) in the chart marks the current value(s).
VALUATION REPORT
®
Page 5: Price-to-EBV Per Share
01/06/2011
Price-to-EBV Per Share
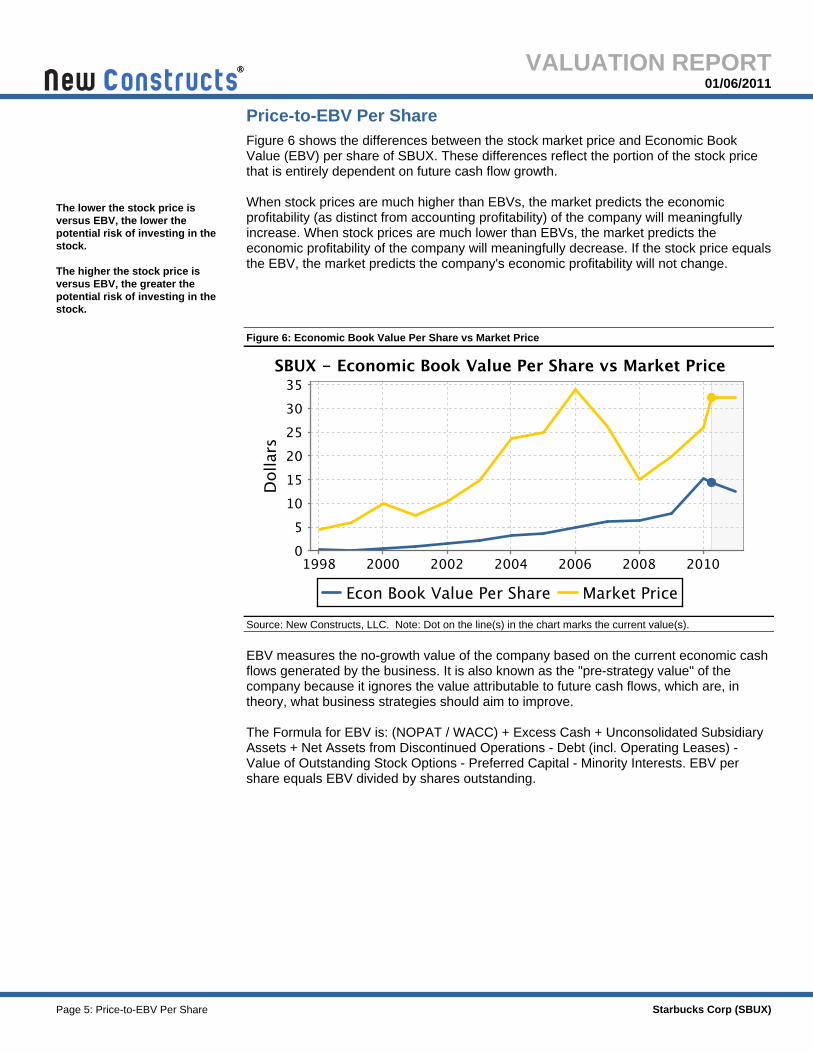
Figure 6: Economic Book Value Per Share vs Market Price
Figure 6 shows the differences between the stock market price and Economic BookValue (EBV) per share of SBUX. These differences reflect the portion of the stock pricethat is entirely dependent on future cash flow growth.
When stock prices are much higher than EBVs, the market predicts the economicprofitability (as distinct from accounting profitability) of the company will meaningfullyincrease. When stock prices are much lower than EBVs, the market predicts theeconomic profitability of the company will meaningfully decrease. If the stock price equalsthe EBV, the market predicts the company's economic profitability will not change.
Starbucks Corp (SBUX)
EBV measures the no-growth value of the company based on the current economic cash flows generated by the business. It is also known as the "pre-strategy value" of the company because it ignores the value attributable to future cash flows, which are, in theory, what business strategies should aim to improve. The Formula for EBV is: (NOPAT / WACC) + Excess Cash + Unconsolidated Subsidiary Assets + Net Assets from Discontinued Operations - Debt (incl. Operating Leases) - Value of Outstanding Stock Options - Preferred Capital - Minority Interests. EBV per share equals EBV divided by shares outstanding.
The lower the stock price is versus EBV, the lower the potential risk of investing in the stock. The higher the stock price is versus EBV, the greater the potential risk of investing in the stock.
Source: New Constructs, LLC. Note: Dot on the line(s) in the chart marks the current value(s).
VALUATION REPORT
®
Page 6: Qualifying Market Expectations
GAP measures the number of years implied by the stock price over which the companymust maintain an edge over its current and future competitors. Specifically, GAPmeasures the number of years a company will earn returns on invested capital greaterthan its cost of capital on new investments. The law of competition dictates that acompany can only grow its economic earnings for the finite period over which it canmaintain a competitive advantage.
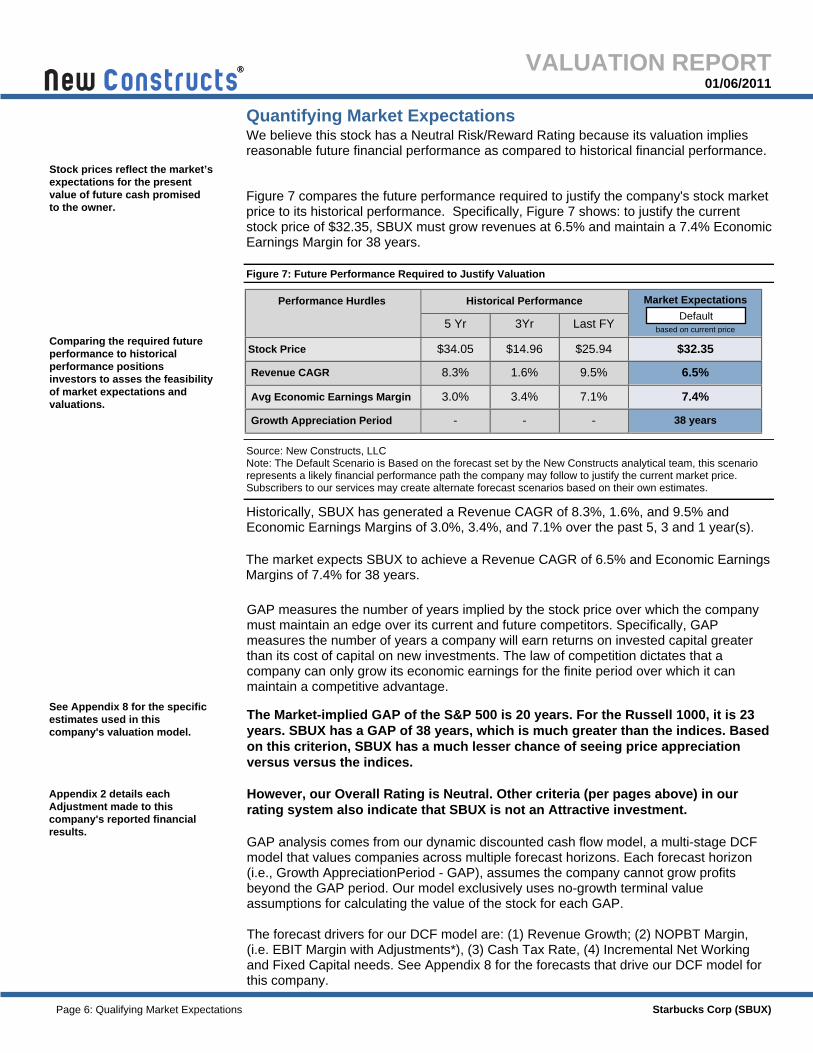
Historically, SBUX has generated a Revenue CAGR of 8.3%, 1.6%, and 9.5% andEconomic Earnings Margins of 3.0%, 3.4%, and 7.1% over the past 5, 3 and 1 year(s).
Market Expectations
$32.35
The Market-implied GAP of the S&P 500 is 20 years. For the Russell 1000, it is 23years. SBUX has a GAP of 38 years, which is much greater than the indices. Basedon this criterion, SBUX has a much lesser chance of seeing price appreciationversus versus the indices.
However, our Overall Rating is Neutral. Other criteria (per pages above) in ourrating system also indicate that SBUX is not an Attractive investment.
$34.05
01/06/2011
We believe this stock has a Neutral Risk/Reward Rating because its valuation impliesreasonable future financial performance as compared to historical financial performance.
Historical Performance
The market expects SBUX to achieve a Revenue CAGR of 6.5% and Economic EarningsMargins of 7.4% for 38 years.
Performance Hurdles
1.6%
$14.96
Revenue CAGR
3.0%
$25.94
9.5%
based on current price
Growth Appreciation Period
Quantifying Market Expectations
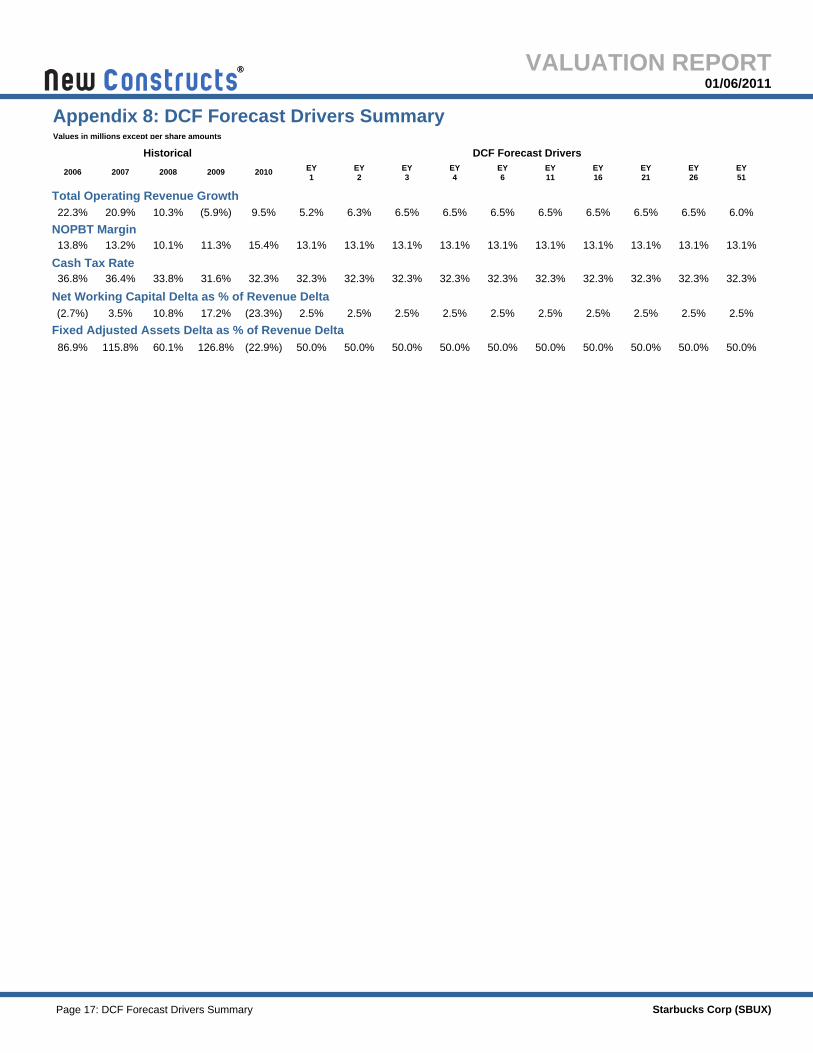
GAP analysis comes from our dynamic discounted cash flow model, a multi-stage DCF model that values companies across multiple forecast horizons. Each forecast horizon (i.e., Growth AppreciationPeriod - GAP), assumes the company cannot grow profits beyond the GAP period. Our model exclusively uses no-growth terminal value assumptions for calculating the value of the stock for each GAP. The forecast drivers for our DCF model are: (1) Revenue Growth; (2) NOPBT Margin, (i.e. EBIT Margin with Adjustments*), (3) Cash Tax Rate, (4) Incremental Net Working and Fixed Capital needs. See Appendix 8 for the forecasts that drive our DCF model for this company.
Figure 7 compares the future performance required to justify the company's stock marketprice to its historical performance. Specifically, Figure 7 shows: to justify the currentstock price of $32.35, SBUX must grow revenues at 6.5% and maintain a 7.4% EconomicEarnings Margin for 38 years.
7.1%
Stock Price
Starbucks Corp (SBUX)
Default
38 years
6.5%
7.4%
Stock prices reflect the market’s expectations for the present value of future cash promised to the owner.
Comparing the required future performance to historical performance positions investors to asses the feasibility of market expectations and valuations.
See Appendix 8 for the specific estimates used in this company's valuation model.
Appendix 2 details each Adjustment made to this company's reported financial results.
8.3%
Avg Economic Earnings Margin
Figure 7: Future Performance Required to Justify Valuation
Source: New Constructs, LLC Note: The Default Scenario is Based on the forecast set by the New Constructs analytical team, this scenario represents a likely financial performance path the company may follow to justify the current market price. Subscribers to our services may create alternate forecast scenarios based on their own estimates.
Last FY5 Yr
3.4%
3Yr
- --
VALUATION REPORT
®
Page 7: Qualifying Market Expectations
The Return On Invested Capital minus the weighted-average cost of capital.
Number of years the company can earn a positive Economic Earnings Margin on incremental investments, i.e. the number of years it can create economic value.
01/06/2011
3. Growth Appreciation Period
2. "How profitable will the company be?"
Compounded over the indicated time frame.
2. Economic Earnings Margin
An alternative way to conceptualize the three value drivers is:
1. "How fast will the company grow?"
3. "For how many years will the company grow economic earnings or create incremental value?"
Our Company Models value stocks based on the present value of expected free cash flows, with that free cash flow measured according to our economic (as distinct from conventional accounting) methodology. Website subscribers forecast economic free cash flow by assigning estimates to three value drivers:
Starbucks Corp (SBUX)
1. Revenue Growth
VALUATION REPORT
®
Page 8: New Constructs' Risk/Reward Rating
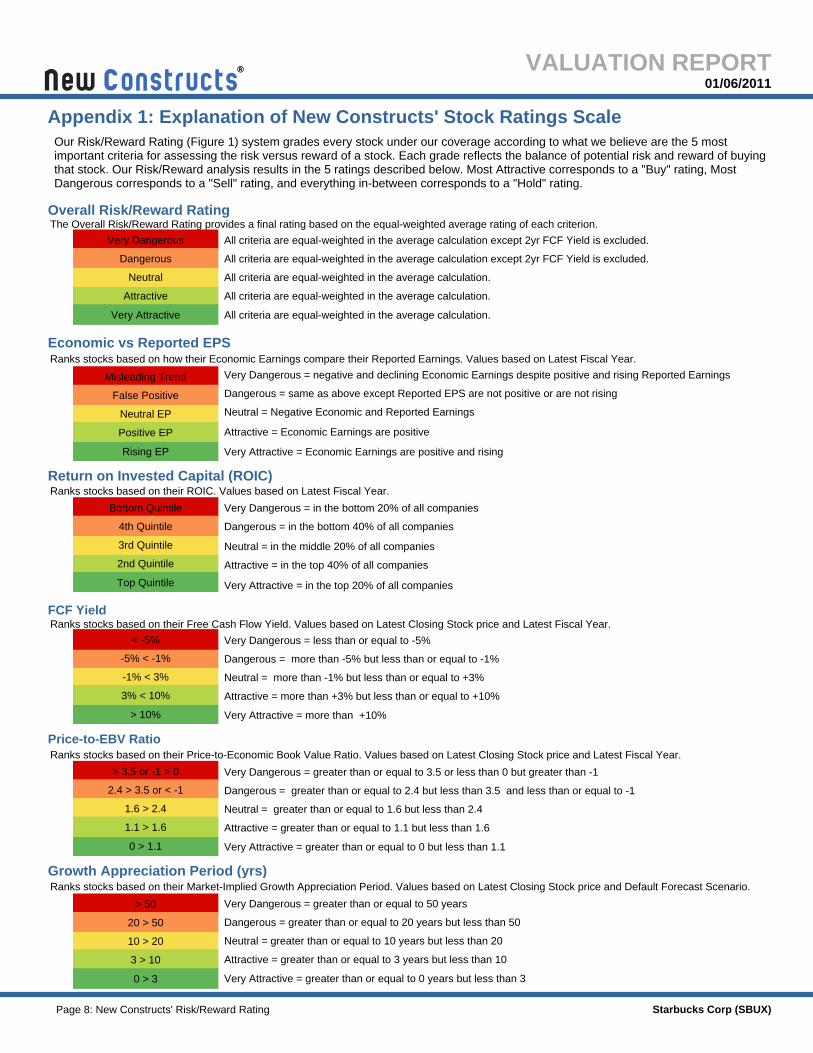
All criteria are equal-weighted in the average calculation except 2yr FCF Yield is excluded.
-1% < 3%
2nd Quintile
Ranks stocks based on their Market-Implied Growth Appreciation Period. Values based on Latest Closing Stock price and Default Forecast Scenario.
Overall Risk/Reward Rating
Neutral EP
Ranks stocks based on their Free Cash Flow Yield. Values based on Latest Closing Stock price and Latest Fiscal Year.
Very Dangerous = negative and declining Economic Earnings despite positive and rising Reported Earnings
Very Dangerous = in the bottom 20% of all companies
Attractive = in the top 40% of all companies
Top Quintile
Attractive = Economic Earnings are positive
01/06/2011
Return on Invested Capital (ROIC)
All criteria are equal-weighted in the average calculation except 2yr FCF Yield is excluded.
Very Attractive = greater than or equal to 0 years but less than 3
Very Dangerous = greater than or equal to 3.5 or less than 0 but greater than -1
All criteria are equal-weighted in the average calculation.
Very Attractive = Economic Earnings are positive and rising
> 10%
Growth Appreciation Period (yrs)
Ranks stocks based on their ROIC. Values based on Latest Fiscal Year.
10 > 20
Attractive = greater than or equal to 3 years but less than 10
3rd Quintile
The Overall Risk/Reward Rating provides a final rating based on the equal-weighted average rating of each criterion.
FCF Yield
Our Risk/Reward Rating (Figure 1) system grades every stock under our coverage according to what we believe are the 5 most important criteria for assessing the risk versus reward of a stock. Each grade reflects the balance of potential risk and reward of buying that stock. Our Risk/Reward analysis results in the 5 ratings described below. Most Attractive corresponds to a "Buy" rating, Most Dangerous corresponds to a "Sell" rating, and everything in-between corresponds to a "Hold" rating.
Ranks stocks based on their Price-to-Economic Book Value Ratio. Values based on Latest Closing Stock price and Latest Fiscal Year.
Attractive = greater than or equal to 1.1 but less than 1.6
-5% < -1%
Ranks stocks based on how their Economic Earnings compare their Reported Earnings. Values based on Latest Fiscal Year.
3% < 10%
Economic vs Reported EPS
0 > 1.1
Attractive = more than +3% but less than or equal to +10%
3 > 10
Neutral = greater than or equal to 1.6 but less than 2.4
Very Dangerous = less than or equal to -5%
Attractive
> 3.5 or -1 > 0
Misleading Trend
Very Dangerous = greater than or equal to 50 years
< -5%
2.4 > 3.5 or < -1
All criteria are equal-weighted in the average calculation.
Rising EP
Positive EP
Neutral
Dangerous = in the bottom 40% of all companies
Dangerous = greater than or equal to 20 years but less than 50
0 > 3
Very Attractive = more than +10%
Starbucks Corp (SBUX)
Neutral = Negative Economic and Reported Earnings
Price-to-EBV Ratio
1.6 > 2.4
Very Attractive
Very Dangerous
Neutral = in the middle 20% of all companies
1.1 > 1.6
All criteria are equal-weighted in the average calculation.
Dangerous = greater than or equal to 2.4 but less than 3.5 and less than or equal to -1
False Positive
Neutral = more than -1% but less than or equal to +3%
Dangerous = same as above except Reported EPS are not positive or are not rising
> 50
Very Attractive = in the top 20% of all companies
Dangerous = more than -5% but less than or equal to -1%
Bottom Quintile
4th Quintile
Neutral = greater than or equal to 10 years but less than 20
VALUATION REPORT
20 > 50
Dangerous
Appendix 1: Explanation of New Constructs' Stock Ratings Scale
Very Attractive = greater than or equal to 0 but less than 1.1
®
Page 9: Economic Adjustments Summary
After-tax Charge, net
Unconsolidated Subsidiary Assets (non-operating)
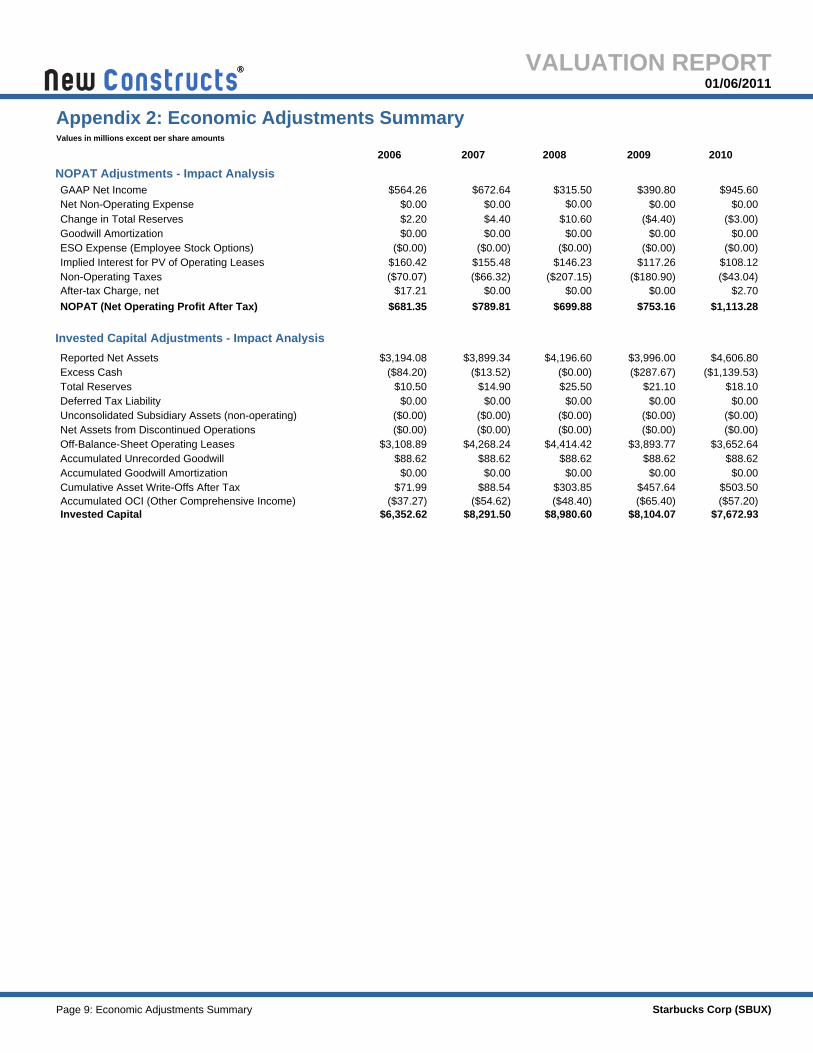
Appendix 2: Economic Adjustments Summary
$0.00($4.40) ($3.00)
$108.12
$0.00
$88.62
$681.35
$3,893.77
Invested Capital
$25.50
$4,414.42
01/06/2011
($84.20)
$8,291.50
Off-Balance-Sheet Operating Leases
($0.00)
($1,139.53)
$0.00
$945.60
$0.00
Total Reserves
($0.00)
($0.00)$3,108.89
$3,899.34
$0.00
($43.04)
($0.00)
Cumulative Asset Write-Offs After Tax
$21.10
$315.50
$8,980.60
ESO Expense (Employee Stock Options)
Accumulated Unrecorded Goodwill$3,652.64
$390.80
$0.00
$0.00$0.00
$17.21
$155.48
$0.00
$117.26
$0.00
$7,672.93($65.40)
$160.42
$0.00$303.85
$10.50
$4,268.24
$0.00
$0.00
Net Non-Operating Expense
2009
($57.20)
20102007 20082006
($0.00)
Non-Operating Taxes
$71.99
$0.00
$8,104.07
$0.00$672.64
$88.62
$789.81
($54.62)$457.64 $503.50
Accumulated Goodwill Amortization
$3,194.08
Net Assets from Discontinued Operations
($66.32)
$88.62
($0.00)
Excess Cash
$88.54($37.27)
Reported Net Assets
$0.00
$0.00
$88.62
Values in millions except per share amounts
Implied Interest for PV of Operating Leases
$4.40
($0.00)
$0.00
Goodwill Amortization$10.60
($0.00)
Deferred Tax Liability$14.90
($48.40)
($180.90)
($0.00)
$1,113.28
($0.00)
$88.62
$564.26
$4,606.80
$18.10
Accumulated OCI (Other Comprehensive Income)
$0.00
Starbucks Corp (SBUX)
($287.67)
($0.00)
$0.00$0.00
($13.52)
$753.16
$0.00
$0.00
Invested Capital Adjustments - Impact Analysis
($70.07)$2.70
($207.15)
$4,196.60
NOPAT (Net Operating Profit After Tax)
$146.23
$2.20
($0.00)
NOPAT Adjustments - Impact Analysis
Change in Total Reserves
$6,352.62
($0.00)
($0.00)
$3,996.00
GAAP Net Income
($0.00)
($0.00)
$699.88
VALUATION REPORT
®
(0.0%)
(0.0)
108.1
After-tax Charge, net
(0.0)
(315.7)
Economic Earnings per Share
(0.4%)
0.0% 0.0%
(0.0%)
(1.3)
(6.4)(0.1%)
0.0
0.2%
Economic Earnings
0.0
0.8%
0.1%
$0.00
(343.4)
(2.9%)
Deferred Tax Liability Capital Charge
$681.35
0.0
0.0
Invested Capital
(3.2%)
(0.3%)
(280.8)
(0.0%)
0.0
1.0%
01/06/2011
(2.9%)
155.5
0.0%
(0.0%)
$8,291.50
(1.7)
10.6
(6.6)
$0.00
$945.60
$0.14
0.0%
(1.9%)
0.0%
(5.8)
$581.36
(288.4)
(0.0%)
(32.8)
(2.7%)
(0.0%)
$0.53
$0.22
(0.0%)
(180.9)
$315.50
Capital Charge for Unconsolidated Subsidiary Assets (non-operating)
$8,980.60
4.0
ESO Expense (Employee Stock Options)
0.0
(0.0)
(6.6)
(3.0)
$600.98
0.0%
(0.0%)
(0.0%)
$390.80
0.0%
(0.1%)
$17.21
NOPAT = Net Income with Adjustments as per below
$510.41
$7,672.93
(0.8)
0.0%
(0.1%)
(0.0%)
0.0%
Net Non-Operating Expense
541.2
2009 20102007 20082006
As a % of Revenue
As a % of Revenue
As a % of Revenue
As a % of Revenue
As a % of Revenue
As a % of Revenue
As a % of Revenue
As a % of Revenue
As a % of Revenue
As a % of Revenue
As a % of Revenue
As a % of Revenue
As a % of Revenue
As a % of Revenue
As a % of Revenue
As a % of Revenue
As a % of Revenue
As a % of Revenue
(0.0%)
WACC * Invested Capital is the charge for capital deducted from NOPAT
Non-Operating Taxes
$0.00
Asset Write-Offs After Tax Capital Charge
(0.0)
(0.0)
Capital Charge for Net Assets from Discontinued Operations
$8,104.07
0.2%
(0.0%)
0.0%
$672.64
$789.81
(66.3)
(0.0)
Invested Capital * WACC
(0.0%)
(3.4%)
85.0(3.3%)
(0.4%)
0.0
(0.0%) (0.0%)
171.8
2.2
(0.0)
(2.0%)
0.0
0.0
3.2
(249.8)
$572.03
0.0%
1.7%
0.0%
Accumulated OCI Capital Charge
Values in millions except per share amounts
(2.5%)
$0.74
176.5
Implied Interest for PV of Operating Leases
0.0%(0.0)0.0%
0.0%
(3.1%)
Goodwill Amortization
0.0%
(0.0)
0.0%
0.0
(0.0)
(0.0)
(0.7%)
(286.7)
2.1%
(0.1%)
170.9
Page 10: Reconciling Net Income to Economic Earnings
(279.3)
$0.24
(0.0)
146.2
0.0%
(207.1)
4.4
Total Reserves Capital Charge (1.1)
0.0%
$1,113.28
$1.27
(0.0)
(0.0)
(4.4)
1.0
(0.0%)
(0.0%)
$0.73
$564.26
(0.0%)
1.4%
0.0
117.3
(0.0)
0.0%
(0.0%)
Starbucks Corp (SBUX)
Capital Charge for Reported Net Assets
0.0%
(0.0%)
Off-Balance-Sheet Operating Leases Capital Charge
$0.90
0.0%
(3.2%)
0.0
4.3
0.0
$613.35
(0.9%)
(5.9)
(0.0%)
$0.43
(43.0)
$753.16
0.0%
(295.4)
0.0%
Basic EPS
Capital Charge for Excess Cash
(0.0%)
0.0%
(272.3)
$2.70
(0.0%)
(70.1)
(7.1)
(0.0%)
(0.0)
$0.23
NOPAT (Net Operating Profit After Tax)
3.0
6.8
(256.6)
(0.0)
(0.1%)
0.0%
(0.0%)
0.1%
Accumulated Goodwill Amortization Capital Charge
(6.5)
(1.5)
(0.0)
(0.0)
(0.1%)
0.0%
Appendix 3: Reconciling Net Income to Economic Earnings
(37.5)
0.0
Economic Earnings = NOPAT minus Capital Charge
(0.0)
0.0
(0.1%)
1.2%
Change in Total Reserves
(0.0%)
0.0
$6,352.62
20.6
Unrecorded Goodwill Capital Charge
GAAP Net Income
4.7(0.2%)
$699.88
(0.0%)
VALUATION REPORT
(20.3)
(2.8%)
Capital Charge = WACC * Invested Capital as detailed below
0.0%
98.9
160.4
®
148.1
$3,999.12
3,510.00.0
387.2
Other Compensation
$10,707.40
510.4
0.0
$9,383.10
0.0
$3,178.79
0.0
$10,383.00
Other Income
0.0Cost of Sales
Total Operating Expense
$3,999.12
$9,411.50
01/06/2011
0.0
0.0
Operating Revenue
$489.25
0.0
0.0
0.0
$108.01 $113.60
534.7Depreciation and Amortization
Net Interest Income
$4,608.15
0.0
0.0Goodwill Amortization
0.0
93.9
$10,707.40
0.0
0.0
$4,324.90$5,737.70
3,689.5
57.5%
Research and Development Expense
$10,383.00
$0.00
3,844.6
0.0
Gross Margin
$4,324.90
$0.00
Total Operating Revenue
4,075.2
0.0
0.00.0
2009 20102007 20082006
0.00.0
55.8%
0.0
467.2
55.3% 58.4%
0.0
0.0
Gross Profit
0.0
$473.02
0.0
Losses from Discontinued Operations (operating)
0.0
0.0
0.0
$8,465.56
$569.50
0.0
0.0
Income from Unconsolidated Subsidiaries (operating)
$456.00
Operating Revenue
0.0
Stock Compensation
108.0
Energy Operating Expense
0.0
0.0
0.0
Interest Expense (operating)
Values in millions except per share amounts
0.0
0.00.0
0.0
Other Operating Expense
$4,458.60
$148.10
$7,786.94
$6,986.93
Page: 11 NOPAT (Net Operating Profit After Tax)
Total Cost of Sales $3,178.79
121.9
0.0
$93.94
$9,725.80
Operating Other Real Estate Owned Expense
0.0
0.0
Operating Expenses and Adjustments
0.0
Appendix 4: Net Operating Profit After Tax (NOPAT) - Operating Approach
0.0
$0.00
Starbucks Corp (SBUX)
0.0
$4,645.30
Operating Income
Credit Loss Provision
549.3
Income from Discontinued Operations (operating)
0.0
0.0
0.0
Total Operating Income
0.0
0.0
0.0
Losses from Unconsolidated Subsidiaries (operating)
0.0
$9,411.50
$121.90
0.0
0.0
113.6$0.00
$5,412.37
$9,774.60
0.0
$6,248.80
0.0
0.0
0.0
0.0
$7,786.94
0.0
$9,774.60
$5,449.70
0.0
0.0
$453.000.0
0.0
2,947.9
Income from Unconsolidated Subsidiaries After-tax (operating)
Selling, General, and Administrative
$0.00
$4,645.30
0.0
$9,002.10
VALUATION REPORT
$4,458.60
59.2%
®
(0.0)
108.1Capitalized Items Net Adjustment
33.8%
Non-operating Expenses Included in Total Operating Expenses(123.4)
(0.0)
0.0
0.0%
$1,539.90
$6,967.30
$349.30
0.0%
$681.35
$9,315.60
01/06/2011
0.0%
155.5
$1,539.90
(95.2)
10.6
13.2%
$160.42
(26.0)
32.3%
$8,906.900.0%
ESO Expense (Employee Stock Options)
0.0
(3.0)
Cash Tax Rate 36.8%
$1,645.02
$1,645.02
$1,076.19
$1,076.19
$117.26
2009 20102007 20082006
$8,439.53ESO Expense as a % of Revenue
$789.81
Taxes and Adjustments
Adjusted Total Operating Expenses
$1,239.86
$1,239.86
$894.20
(0.0)
$1,079.98
2.2
36.4%
$989.60
11.3%
$913.57
$394.84
Implied Interest for PV of Operating Leases
(0.0)
Goodwill Amortization
$108.12
31.6%
(0.0)
$531.74
Page: 12 NOPAT (Net Operating Profit After Tax)
146.24.4
NOPBT Margin
$1,113.28
Cash Operating Taxes
15.4%
(4.4)
10.1%
117.3
EBIT
Starbucks Corp (SBUX)
$146.23
$1,051.03
$1,051.03
$9,602.40
0.0EBITA
$1,102.46
$1,102.46
$753.16
$913.57
(0.0) (0.0)
$155.48
(19.6)
(0.0)
NOPAT (Net Operating Profit After Tax)
$989.60
(67.5)
(0.0)
$351.15
13.8%NOPBT (Net Operating Profit Before Tax)
NOPBT (Net Operating Profit Before Tax)
$450.05
0.0
Change in Total Reserves$894.20
0.0$1,079.98
$699.88
(0.0)
0.0%
VALUATION REPORT
Asset Write-Offs Included in Total Operating Expenses
Net Operating Profit After-Tax (NOPAT) - Operating Approach (continued)
160.4
®
$438.69 $666.10
0.0
0.0
0.0
5.0%
0.0
$1,674.90
169.2
Loan Loss Reserves
Long-Term Investments (non-operating)
0.0
19.9
0.0
0.0
Restricted Cash
01/06/2011
692.8
$1,879.60
0.0
Allowance for Doubtful Accounts
156.5
$0.00
0.0
$473.54
Separate Accounts
$0.00
$1,475.99
0.0
225.2
302.7
389.3
Required Cash as % of Revenue
LIFO Reserves
129.5
45.4
5.0%
110.3
25.5
0.0
$0.00
0.0
2009 20102007 20082006
Total Cash and Investments
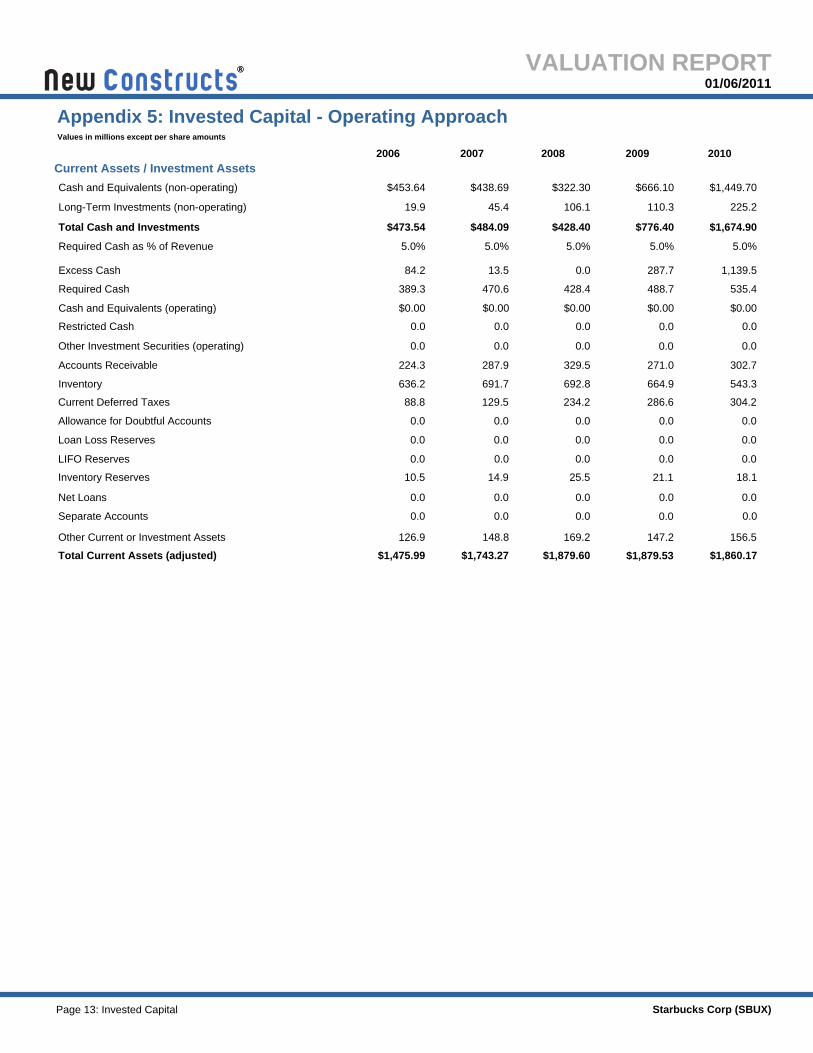
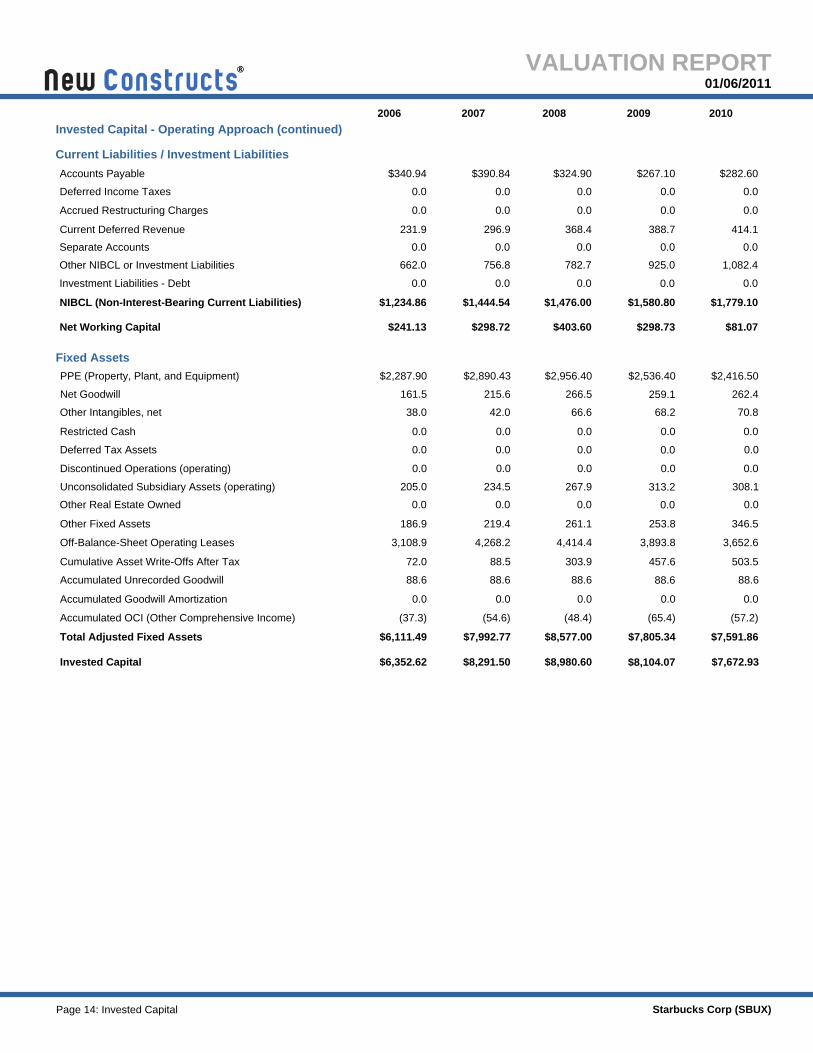
Appendix 5: Invested Capital - Operating Approach
0.0
Other Investment Securities (operating)
$1,743.27
0.0
$0.00
Inventory Reserves
0.0
286.6
0.0
0.0
126.9
14.9
$453.64
543.3
$776.40
$1,879.53
$484.09
Excess Cash
Values in millions except per share amounts
0.0
0.0
488.7
Accounts Receivable
0.0
5.0%
224.3
$1,449.70
Page 13: Invested Capital
234.2
0.0
10.5 18.1
5.0%
Current Assets / Investment Assets
0.0
287.7
Other Current or Investment Assets
535.4
147.2
0.0
0.0
Starbucks Corp (SBUX)
329.5
1,139.5
Net Loans
0.00.0
0.0
$1,860.17
0.0
$428.40
Inventory
13.5
$0.00
0.0
148.8
664.9
0.0
287.9
470.6
691.7
84.2
Required Cash
304.2
636.2
106.1
Total Current Assets (adjusted)
88.8
5.0%
428.4
0.0
0.0
Cash and Equivalents (non-operating)
Current Deferred Taxes
$322.30
VALUATION REPORT
0.0
0.0
271.0
21.1
Cash and Equivalents (operating)
0.0
0.0
®
219.4
Net Working Capital
$7,805.34
42.0
$2,536.40
261.1
$298.73
0.0
88.6
Invested Capital
0.0
$7,591.86
0.0
0.0
Unconsolidated Subsidiary Assets (operating)
01/06/2011
457.6
$1,580.80
$8,291.50
0.0
$1,444.54
Off-Balance-Sheet Operating Leases
0.0
(37.3)
267.9
$282.60
186.9
1,082.4
$6,111.49
0.0
Net Goodwill
88.6
0.0
Current Liabilities / Investment Liabilities
$1,234.86
0.0
38.0
259.1266.5
88.6
3,108.9
Cumulative Asset Write-Offs After Tax
296.9
0.0
Other NIBCL or Investment Liabilities
$8,980.60
Accumulated Unrecorded Goodwill 88.6
0.0
0.0
0.0
Other Intangibles, net
$1,779.10
$7,672.93
$241.13
0.0
0.0
$324.90
Current Deferred Revenue
925.0
0.0
$267.10
Investment Liabilities - Debt
70.8
161.5
$2,287.90
2009 20102007 20082006
0.0
0.0
$8,104.07
Discontinued Operations (operating)
88.6
$390.84
$8,577.00
68.2
0.0 0.0
262.4
Accumulated Goodwill Amortization
253.8
662.0
0.0
0.0
$2,416.50
234.5
0.0
(65.4)
0.0
(48.4)
$298.72
215.6
$403.60
414.1
0.0
72.0
PPE (Property, Plant, and Equipment)
231.9
(57.2)
0.0
4,268.2
(54.6)
Page 14: Invested Capital
0.0
Accrued Restructuring Charges
303.9
0.0
0.0
$1,476.00
308.1
Total Adjusted Fixed Assets
0.0
$2,890.43
$7,992.77
$340.94
66.6
Accumulated OCI (Other Comprehensive Income)
$81.07
Other Real Estate Owned
0.0
Starbucks Corp (SBUX)
Deferred Income Taxes
88.5
205.0
0.0
0.0
782.7
Invested Capital - Operating Approach (continued)
Separate Accounts
0.0
Accounts Payable
0.0
4,414.4
NIBCL (Non-Interest-Bearing Current Liabilities)
388.7
0.0
Fixed Assets
0.0
756.8
346.5Other Fixed Assets
368.4
0.0
503.5
0.0
313.2
0.0
Restricted Cash
3,652.6
0.0
0.0
$2,956.40
$6,352.62
0.0
Deferred Tax Assets
VALUATION REPORT
0.0
3,893.8
0.0
®
Preferred Capital
8.50%
33.75%
Adjusted Total Debt
0.998.50%
Cost of Preferred Capital
0.0
$26,086.1878.03%
01/06/2011
1.01%
Weighted Cost of Equity Capital
12.75%
7.60%
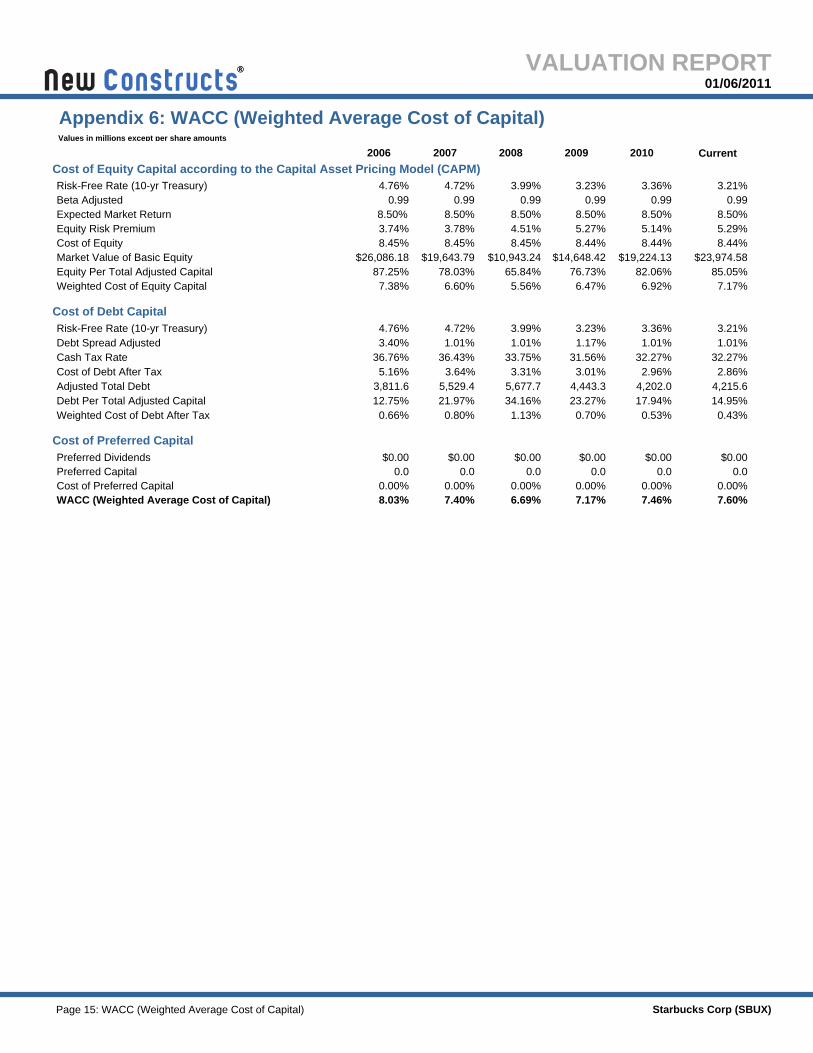
Cost of Debt Capital
Equity Per Total Adjusted Capital
7.40%
32.27%
17.94%
2.96%
1.13%
0.0
7.38%
0.99 0.99
0.00%
$19,643.798.45%
0.99 0.99
34.16%0.43%
4.76%
4.76%
0.99
Cash Tax Rate
4,202.0
Cost of Equity
36.76%
$0.00
0.00%0.00%6.69%
2009 20102007 20082006
8.50%
0.0
8.45%
3.99%
3.99%
14.95%
4.72%
4.72%
$19,224.13
6.92%
8.50%
0.66%
5.56%
Expected Market Return
0.70%
3.74%
6.60%
8.44%
Weighted Cost of Debt After TaxDebt Per Total Adjusted Capital
3.40%
5.16%36.43%
5.27%
0.53%
Debt Spread Adjusted
3.31%
0.0
Values in millions except per share amounts
6.47%
5,677.7
8.45%
7.17%
31.56%1.17%
3.78%
Page 15: WACC (Weighted Average Cost of Capital)
4.51%
0.0
Cost of Debt After Tax
3.36%
3.36%
2.86%
65.84% 85.05%
21.97%
82.06%
Starbucks Corp (SBUX)
Appendix 6: WACC (Weighted Average Cost of Capital)
0.00%
$0.00
7.17%
8.44%
3.01%
Equity Risk Premium
Cost of Equity Capital according to the Capital Asset Pricing Model (CAPM)
4,215.6
1.01%
3.21%
3.21%
0.00%Cost of Preferred Capital
Risk-Free Rate (10-yr Treasury)
Risk-Free Rate (10-yr Treasury)
$0.00 $0.00
3.23%
3.23%1.01%
0.00%
5.29%8.50%
1.01%
$0.00
3,811.6
76.73%
5,529.4
7.46%
$14,648.42
Current
$10,943.24
5.14%
0.80%
$23,974.58
4,443.3
87.25%
32.27%3.64%
0.0
Market Value of Basic Equity
$0.00Preferred Dividends
23.27%
8.44%
VALUATION REPORT
8.50%
WACC (Weighted Average Cost of Capital)
Beta Adjusted
8.03%
®
$0.52
Stock Price (closing)
1.40
0.0
2.23
Preferred Capital
12.8%
Unconsolidated Subsidiary Assets (non-operating)
971.3
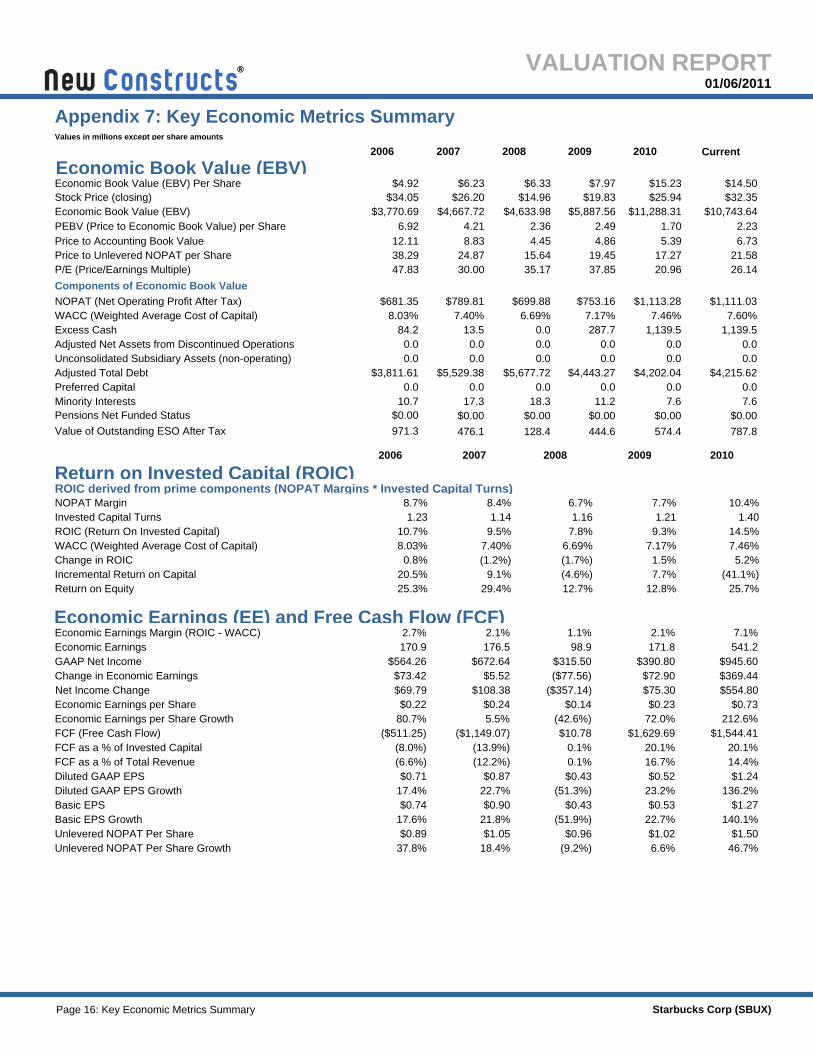
Components of Economic Book Value
Economic Earnings per Share
18.3
Adjusted Total Debt
Value of Outstanding ESO After Tax
0.0
(13.9%)
476.1
1.5%
$554.80
18.4%
$75.30
Economic Earnings
$32.35
FCF as a % of Invested Capital
20.96
$34.05
Appendix 7: Key Economic Metrics Summary
Minority Interests
$681.35
17.27
$3,770.69
(42.6%)
0.07.6
$69.79
$1.02140.1%
(12.2%)
01/06/2011
Unlevered NOPAT Per Share
$5,887.56
10.4%
0.0
9.1%
7.1%
$945.60
574.4
14.5%
$0.14
4.21
7.60%
29.4%
Price to Unlevered NOPAT per Share
25.3%
7.40%
7.40%
23.2%
$0.00
80.7%
2.1%
$4,667.72
0.0
38.29
(8.0%)
$0.53
$0.22
4.86
$315.50
26.14
0.0
$1,111.03
FCF (Free Cash Flow) ($511.25)
24.87
7.7%
Economic Book Value (EBV)
$6.33
Economic Earnings (EE) and Free Cash Flow (FCF)
ROIC derived from prime components (NOPAT Margins * Invested Capital Turns)
$390.80
1.21
0.8%
136.2%
$1,629.695.5%
15.64
6.69%
6.69%
8.83
Invested Capital Turns
$5,529.38
541.2
$0.00
2009
2009
2010
2010
2007
2007
2008
2008
2006
2006
0.00.0
$0.96
444.6
(51.3%)
$1.50
$14.96
$4,443.27
$0.43
17.6%
30.00
$0.87
0.0
0.1%
0.0
6.7%
37.85
0.0
Economic Book Value (EBV) Per Share $4.92
0.1%
(9.2%)
$672.64
1.23
$789.81
72.0%
$14.50
PEBV (Price to Economic Book Value) per Share
47.83
0.0
NOPAT Margin
Economic Earnings Margin (ROIC - WACC)
2.49
$6.23
(1.2%)
($77.56)
$0.00
171.8
(1.7%)
$25.94
$4,202.04
21.58
Pensions Net Funded Status
Excess Cash
22.7%
$0.00
Diluted GAAP EPS
$73.42
0.0
Values in millions except per share amounts
6.92
$26.20
($1,149.07)
17.3
$0.74
176.5
8.7%
0.0
$10,743.64
$72.90
2.1%
17.4%
10.7%
19.45
170.9
Page 16: Key Economic Metrics Summary
Unlevered NOPAT Per Share Growth
$0.24
20.1%
Incremental Return on Capital
0.0
0.0
12.7%
9.5%
Return on Invested Capital (ROIC)
287.7
Price to Accounting Book Value
Change in Economic Earnings
$1,113.28
$1.27Diluted GAAP EPS Growth
$3,811.61
212.6%
1,139.5
$1.24
$0.73
16.7%
0.0
Change in ROIC
$564.26
12.11
$0.89
5.39
Basic EPS Growth
128.4
$0.00
$4,215.62
20.1%
Starbucks Corp (SBUX)
14.4%FCF as a % of Total Revenue
1,139.5
787.8
$0.90
7.17%
7.17%
7.6
20.5%
22.7%
$0.00
Economic Earnings per Share Growth
7.7%
5.2%
46.7%
P/E (Price/Earnings Multiple)
$11,288.31
$0.43
$1.05
13.5
$753.16
2.36
1.1%
Basic EPS
$5.52
(51.9%)
$4,633.98
$108.38
(6.6%)
10.7
84.2
$19.83
($357.14)$0.23
NOPAT (Net Operating Profit After Tax)
1.70
11.2
7.46%
7.46%
8.4%
25.7%
Current
$15.23
0.0
ROIC (Return On Invested Capital)
$1,544.41
Return on Equity
$7.97
4.45
Net Income Change
$0.71
$369.44
21.8%
0.0
Adjusted Net Assets from Discontinued Operations
1.16
37.8%
GAAP Net Income
(4.6%)
2.7%
9.3%
$10.78
$5,677.72
$699.88
Economic Book Value (EBV)
6.6%
35.17
VALUATION REPORT
7.8%
WACC (Weighted Average Cost of Capital)
WACC (Weighted Average Cost of Capital)
6.73
1.14
8.03%
8.03%
(41.1%)
98.9
®
EY 26
DCF Forecast Drivers
50.0%
6.5%
13.1%13.1% 13.1%
50.0%
5.2%
Net Working Capital Delta as % of Revenue Delta
32.3%
01/06/2011
6.5%
86.9%
Historical
6.0%
32.3%
10.3%
13.2%
36.8%
EY 4
50.0%
(2.7%)
20.9% (5.9%)
60.1%
32.3%
Total Operating Revenue Growth
13.1%
50.0%
2.5%
13.1%
32.3%
2.5%
EY 3
2009 20102007 20082006
32.3%
50.0%50.0%
2.5%
22.3%
13.1%
3.5% 2.5% 2.5%
32.3%31.6%
11.3%
(22.9%)
EY 1
36.4%
(23.3%)
Values in millions except per share amounts
9.5%
32.3%
EY 51
6.5%6.5%
32.3%
Page 17: DCF Forecast Drivers Summary
10.8%
50.0%
17.2%
NOPBT Margin6.5%
15.4%
EY 2
10.1%
50.0%
2.5%
Starbucks Corp (SBUX)
32.3%
50.0%
EY 11
115.8%
EY 6
13.1%
126.8%
13.1%
Fixed Adjusted Assets Delta as % of Revenue Delta
Appendix 8: DCF Forecast Drivers Summary
6.5%
33.8%
6.3%
2.5%
EY 21
2.5% 2.5%
13.8% 13.1%
2.5%
32.3%
13.1%
VALUATION REPORT
6.5%
Cash Tax Rate
EY 16
50.0%
32.3%
®
01/06/2011
- We check the fine print in thousands of corporate filingsso you don't have to. As reported by Barron's, our expertise in analyzing SEC filings delivers Hidden Gems and Red Flags that drive long-term stock-picking success.
4. Transparency
3. Time Savings
- We are proud to share the results of our analysis of over50,000 10-Ks. See the Corporate Disclosure Transgressions report we provided to the SEC. Our reports details all data and assumptions. Company Models enable users to change them.
5. Objectivity
business
Additional Information
Accounting data is not designed for equity investors, but for debt investors. Accounting data must be translated into economic earnings to understand the profitability and valuation relevant to equity investors. Respected investors (e.g. Adam Smith, Warren Buffett and Ben Graham) have repeatedly emphasized that accounting results should not be used to value stocks. Economic earnings are what matter because they are:
1. Based on the complete set of financial information available. 2. Standard for all companies. 3. A more accurate representation of the true underling cash flows of the
Wall Street or investment banking services. Our models are driven by comprehensive high-quality data not stories. See our presentation to the Senate Banking Committee, the SEC and many others in DC.
Our Philosophy About Research
- New Constructs is an independent research firm, not tied to
Incorporated in July 2002, New Constructs is an independent publisher of investment research that provides clients with consulting, advisory and research services. We specialize in quality-of-earnings, forensic accounting and discounted cash flow valuation analyses for all U.S. public companies. We translate accounting data from 10Ks into economic financial statements, i.e. NOPAT, Invested Capital, and WACC, to create economic earnings models, which are necessary to understand the true profitability and valuation of companies. Visit the Free Archive to download samples of our research. New Constructs is a BBB accredited business and a member of the Investorside Research Association.
1.
How New Constructs Creates Value for Clients
See our track record in our stock-picking accolades and Proof Is In Performance reports.
2.
Superior Recommendations - Our stock picks consistently outperform.
accounting distortions and discounted cash flow analysis leverages better data to deliver smarter research.
More Accurate Research - Our patented Research Platform for reversing
New Constructs® - Profile
Page 18: New Constructs Profile Starbucks Corp (SBUX)
VALUATION REPORT
®
01/06/2011
The information and opinions presented in this report are provided to you for information purposes only and are not to be used or considered as an offer or solicitation of an offer to buy or sell securities or other financial instruments. New Constructs has not taken any steps to ensure that the securities referred to in this report are suitable for any particular investor and nothing in this report constitutes investment, legal, accounting or tax advice. This report includes general information that does not take into account your individual circumstance, financial situation or needs, nor does it represent a personal recommendation to you. The investments or services contained or referred to in this report may not be suitable for you and it is recommended that you consult an independent investment advisor if you are in doubt about any such investments or investment services. Information and opinions presented in this report have been obtained or derived from sources believed by New Constructs to be reliable, but New Constructs makes no representation as to their accuracy, authority, usefulness, reliability, timeliness or completeness. New Constructs accepts no liability for loss arising from the use of the information presented in this report, and New Constructs makes no warranty as to results that may be obtained from the information presented in this report. Past performance should not be taken as an indication or guarantee of future performance, and no representation or warranty, express or implied, is made regarding future performance. Information and opinions contained in this report reflect a judgment at its original date of publication by New Constructs and are subject to change without notice. New Constructs may have issued, and may in the future issue, other reports that are inconsistent with, and reach different conclusions from, the information presented in this report. Those reports reflect the different assumptions, views and analytical methods of the analysts who prepared them and New Constructs is under no obligation to insure that such other reports are brought to the attention of any recipient of this report. New Constructs' reports are intended for distribution to its professional and institutional investor customers. Recipients who are not professionals or institutional investor customers of New Constructs should seek the advice of their independent financial advisor prior to making any investment decision or for any necessary explanation of its contents. This report is not directed to, or intended for distribution to or use by, any person or entity who is a citizen or resident of or located in any locality, state, country or jurisdiction where such distribution, publication, availability or use would be contrary to law or regulation or which would be subject New Constructs to any registration or licensing requirement within such jurisdiction. This report may provide the addresses of websites. Except to the extent to which the report refers to New Constructs own website material, New Constructs has not reviewed the linked site and takes no responsibility for the content therein. Such address or hyperlink (including addresses or hyperlinks to New Constructs own website material) is provided solely for your convenience and the information and content of the linked site do not in any way form part of this report. Accessing such websites or following such hyperlink through this report shall be at your own risk. All material in this report is the property of, and under copyright, of New Constructs. None of the contents, nor any copy of it, may be altered in any way, copied, or distributed or transmitted to any other party without the prior express written consent of New Constructs. All trademarks, service marks and logos used in this report are trademarks or service marks or registered trademarks or service marks of New Constructs. Copyright New Constructs, LLC 2003, 2004, 2005, 2006, 2007, 2008, 2009, 2010. All rights reserved.
New Constructs®, LLC (together with any subsidiaries and/or affiliates, 'New Constructs') is an independent organization with no management ties to the companies it covers. None of the members of New Constructs' management team or the management team of any New Constructs' affiliate holds a seat on the Board of Directors of any of the companies New Constructs covers. New Constructs does not perform any investment or merchant banking functions and does not operate a trading desk. New Constructs' Stock Ownership Policy prevents any of its employees or managers from engaging in Insider Trading and restricts any trading whereby an employee may exploit inside information regarding our stock research. In addition, employees and managers of the company are bound by a code of ethics that restricts them from purchasing or selling a security that they know or should have known was under consideration for inclusion in a New Constructs report nor may they purchase or sell a security for the first 15 days after New Constructs issues a report on that security. New Constructs is affiliated with Novo Capital Management, LLC, the general partner of a hedge fund. At any particular time, New Constructs' research recommendations may not coincide with the hedge fund's holdings. However, in no event will the hedge fund receive any research information or recommendations in advance of the information that New Constructs provides to its other clients.
Page 19: Legal Disclaimers Starbucks Corp (SBUX)
DISCLOSURES
DISCLAIMERS
VALUATION REPORT