Valuation Model Use and the Price Target Performance …assets.csom.umn.edu/assets/142098.pdf1...
38
Valuation Model Use and the Price Target Performance of Sell-Side Equity Analysts Cristi A. Gleason*, W. Bruce Johnson, Tippie College of Business, University of Iowa, Iowa City, IA 52242 and Haidan Li Santa Clara University, Santa Clara, CA 95053 Draft: December 2008 We appreciate the comments and suggestions of Artur Hugon, Reuven Lehavy, Roger Loh, Mujtaba Mian, participants at the 2006 Midwest Summer Research Conference at the University of Notre Dame, and workshop participants at the University of Iowa and the University of Texas at Austin. We also gratefully acknowledge the contribution of Thomson Financial for providing earnings forecast data (available through the Institutional Brokers Estimate System) and price target data (available through First Call), as part of a broad academic program to encourage earnings expectations research. * Corresponding author: [email protected], Tippie College of Business, 108 PBB, Iowa City, IA 52242-1994. Office (319) 335-1505. Fax (319) 335-1956.
Transcript of Valuation Model Use and the Price Target Performance …assets.csom.umn.edu/assets/142098.pdf1...

Valuation Model Use and the Price Target Performance of
Sell-Side Equity Analysts
Cristi A. Gleason*, W. Bruce Johnson,
Tippie College of Business, University of Iowa, Iowa City, IA 52242
and Haidan Li Santa Clara University, Santa Clara, CA 95053
Draft: December 2008 We appreciate the comments and suggestions of Artur Hugon, Reuven Lehavy, Roger Loh, Mujtaba Mian, participants at the 2006 Midwest Summer Research Conference at the University of Notre Dame, and workshop participants at the University of Iowa and the University of Texas at Austin. We also gratefully acknowledge the contribution of Thomson Financial for providing earnings forecast data (available through the Institutional Brokers Estimate System) and price target data (available through First Call), as part of a broad academic program to encourage earnings expectations research. * Corresponding author: [email protected], Tippie College of Business, 108 PBB, Iowa City, IA 52242-1994. Office (319) 335-1505. Fax (319) 335-1956.

1
Valuation Model Use and the Price Target Performance of
Sell-Side Equity Analysts
Abstract
This study investigates the influence of inferred valuation model use on the investment performance of sell-side equity analysts’ published price target opinions. We document the superiority of price targets as an investment tool when analysts appear to be using a rigorous stock valuation technique rather than a simple valuation heuristic. This improvement in realized 12-month stock returns is most pronounced among analysts who are also adept at formulating accurate earnings forecast, a key ingredient in both stock valuation methodologies examined here. Our results underscore the importance of both forecasting ability and valuation technique to the stock evaluation process. The potential benefits of superior earnings forecasts for price target investment performance can be lost if those forecasts are used as inputs to a flawed valuation approach. JEL Classification: G10, G14. G24 Key Words: security analysts, earnings forecasts, price targets, earnings-based valuation models

2
1. Introduction “The analyst could do a more dependable and professional job of passing judgment on a common stock if he were able to determine some objective value, independent of the market quotation, with which he could compare the current price. He could then advise the investor to buy when price was substantially below value, and to sell when price exceeded value.” (Graham and Dodd, 1951: 404-405)
By the mid-1990s, a growing number of sell-side equity analysts had begun to disclose price
targets in their published stock research reports (see Bradshaw 2002; Brav and Lehavy 2003; Asquith,
Mikhail and Au 2005). Price targets presumably reflect analysts’ opinions about what a stock is truly
worth and thus form the basis for their less granular Buy/Sell recommendations. 1 Despite the growing
popularity of price targets and their potential to provide a more precise signal about analysts’ investment
opinions, large-sample evidence on the quality of analysts’ price target opinions is limited.
Investors do consider price target revisions to be informative. The average stock price reaction at
revision is comparable in magnitude to that for changes in Buy/Sell recommendations (Brav and Lehavy
2003; Asquith et al. 2005). Moreover, price target revisions contain information beyond that found in
changes in analysts’ summary earnings forecasts or recommendations (Brav and Lehavy 2003; Asquith et
al. 2005). However, only about 50 percent of analysts’ price targets are actually achieved during the
ensuing 12 months—the most common horizon specified by analysts (Asquith et al. 2005, Bradshaw and
Brown 2006). The investment returns realized from simple price target trading strategies are
substantially below the ex ante returns implied by analysts’ price targets (Brav and Lehavy 2003).
Several factors may contribute to this relatively low incidence of price target attainability. One
possibility is that price targets serve a purpose other than that envisioned by Graham and Dodd (1951).
Bradshaw (2002), for example, argues that analysts sometimes concoct price targets to justify ex post their
Buy/Sell recommendations. This ad hoc approach undoubtedly compromises price target quality. A
second possibility is that, even when analysts derive their price targets from accepted stock valuation
models, attainability is hampered by inaccurate forecasts of earnings or other firm fundamentals used as
valuation model inputs. Overly optimistic earnings forecasts may thus give rise to inflated, and less 1 Adopting the standard nomenclature, a stock the analyst believes is underpriced (i.e., one where the price target exceeds the quoted market price) will be assigned a Buy recommendation, a fairly priced stock will be assigned a Hold recommendation, and an overpriced stock will be assigned a Sell recommendation.

3
attainable, price targets. Evidence on how analysts’ earnings forecast accuracy affects price target quality
is mixed. Bradshaw and Brown (2006) find that attainability is unrelated to the (past) accuracy of
analysts’ earnings forecasts whereas Loh and Mian (2006) and Ertimur et al. (2007) find that analysts
who issue more accurate earnings forecasts also issue more profitable Buy/Sell recommendations (a
proxy for price targets).
This study departs from the prior literature and investigates a third potential contributor to low
quality price targets; namely, the possibility that some sell-side analysts use unsophisticated valuation
heuristics to set their price targets. Even analysts adept at formulating accurate earnings forecasts may
favor the use of simple (but flawed) valuation heuristics rather than more rigorous and proven
techniques.2 Using a broad sample of 45,693 price targets provided to First Call by sell-side analysts
during the calendar years 1997 through 2003, we implement a statistical procedure for inferring valuation
model use from the observed correlation between analysts’ price targets and researcher-constructed
stock valuation estimates. We then test whether the apparent use of a more rigorous valuation approach
yields higher quality price targets as measured by realized investment returns.
Our results show that substantial improvements in price target quality occur when analysts
appear to use a rigorous valuation technique rather than an heuristic. This quality improvement is most
pronounced among analysts who are also adept at formulating accurate earnings forecasts, a key input to
the valuation models we consider. The central message from our data is that the profitability of analysts’
published price targets is substantially reduced when those price targets appear to have been derived
from a valuation heuristic using inferior earnings forecasts.
We present the remainder of the paper in four parts. Section 2 reviews the relevant prior
literature and develops our hypotheses about valuation model use and price target quality. Section 3
provides details about the sample selection process, measurement issues, and descriptive statistics about
2 For example, Value Line says that the price targets produced by its analysts are based on the analyst’s projections for earnings multiplied by an estimated price/earnings ratio (see http://valueline.com/ed_vlpage.html and Brav et al. 2005).

4
sample firms and analysts. The results are presented in Section 4. Concluding remarks are provided in
Section 5.
2. Prior Research
Asquith et al. (2005) find that price targets are disclosed in about 73 percent of the research
reports authored by Institutional Investor “All American” analyst team members from 1997 to 1999.3 These
price targets are most often associated with a 12-month horizon and are on average 33 percent higher
than the stock’s market price at the time the report is published. Price targets below current market
price are uncommon, and the tendency to disclose a price target is greater for more favorable stock
recommendations. This price target disclosure pattern is also evident in random samples of sell-side
equity research reports from this same time period (Bradshaw 2002; Brav and Lehavy 2003). Published
price targets are far less prevalent before the mid-1990s.
Investors seem to believe analysts’ price target opinions are informative. Price target revisions
are accompanied by a mean five-day abnormal stock return of -3.9% around downward revision
announcements and +3.2% for upward revisions (Brav and Lehavy 2003). Investor reaction to price
target revisions is comparable in magnitude to that for changes in Buy/Sell recommendations (Asquith et
al. 2005). Both studies confirm that changes in summary earnings forecasts, stock recommendations, and
price targets each provide independent value-relevant information to the capital market.4
This investor reaction is justified only if analysts’ price targets predict future market prices. But
some have argued that published price targets may at times serve a quite different purpose. Analysts
have incentives to compromise their objectivity and optimistically bias their forecasts, recommendations,
and analysis (e.g., Lin and McNichols 1998; Michaely and Womack 1999; Dechow et al. 2000; Bradshaw 3 By comparison, all of the reports examined in Asquith et al. (2005) contain a summary Buy/Sell recommendation and nearly all reports also provide earnings per share (EPS) forecasts—99% for the current fiscal year and 95% for at least one subsequent year. Only 23% of the reports contain explicit EPS forecasts beyond one subsequent year, although EPS growth rate forecasts over a three to five year horizon are common. 4 Asquith et al. (2005) find that other information contained in a report, such as the strength of the written arguments made to support an analyst’s opinion, also exerts a significant influence on investor reaction to sell-side reports. The stronger the justifications provided in the report, the stronger the market’s reaction to the report.

5
et al. 2003; Lin et al. 2003). For example, Asquith et al. (2005, p. 276) note that: “Analysts might be more
likely to issue highly favorable recommendations due to concerns over personal compensation,
relationships with the analyzed firms’ management, or their own firm’s underwriting business. Price
targets can be either a way for analysts to ameliorate the effects of overly optimistic reports or a part of
the sales hype used to peddle stocks.”
One way to gauge the predictive ability of analysts’ price targets is to determine how often they
are attained. “All American” analysts’ price targets are attained 54 percent of the time during the 12
months following publication of the research report (Asquith et al. 2005).5 Stocks that attain the price
target usually overshoot it by an average of 37 percent during the 12 months. The remaining 46 percent of
stocks fall about 16 percent short of the price target at their peak over the year. Bradshaw and Brown
(2006) use a comprehensive price target data set compiled by First Call to investigate the quality of
95,852 price targets for U.S. firms issued in 1997-2002. Only 45 percent of the price targets are attained
in the ensuing year. They find no evidence of persistent differences among analysts in the attainability of
their price targets.
Price target attainability is an incomplete measure of quality when viewed from the perspective
of investors. After all, the probability of a stock attaining the price target is inversely related to the level
of optimism exhibited by the analyst, as measured by the projected stock price change at publication of
the research report. Put simply, a $10 stock is much more likely over then next 12 months to attain an $11
price target than is a $15 price target but the realized return from doing so is vastly lower as well. We
depart from this earlier emphasis on price target attainability and instead use a 12-month buy-and-hold
return as our quality measure.
Our first research goal is then to document the investment returns realized by portfolios built
from analysts’ price targets. If price target opinions do indeed predict future market prices, then the ex
ante return implied by the price target when first published (e.g., 10% for an $11 price target on a $10
5 Less than 3% of the price targets in Asquith et al. (2005) forecast a stock price decline, meaning that the price target is below the stock’s market price when the report is published. In these cases, the prediction is considered to be attained if the stock price falls to the price target during the ensuing 12 months.
6
stock) should exhibit a reliably positive association with the ensuring 12-month ex post realized return.
Evidence of a positive association between implied returns and realized returns would be consistent with
the notion that price targets are credible, informative, and intended to convey analysts’ opinions about
the true worth of a stock rather than to serve other purposes.
Analysts’ valuation model choice
Stock valuation methodologies fall into one of two broad categories: discounted cash flow (DCF)
models that combine projected free cash flows or abnormal earnings derived from comprehensive
financial forecasts of firm performance with estimated discount rates; and relative valuation multiples
such as price-to-earnings (P/E), price-to-revenue, or price-to-book value ratios that are compared to
historical norms or to other firms in the same industry.6 Compared to the theoretically sound DCF
approach, multiples are inferior heuristics even though they may at times yield valuation estimates equal
the DCF estimate.
What valuation methodologies do sell-side analysts use when formulating price targets? Despite
the theoretical appeal of rigorous DCF approaches and the apparent ease with which DCF models can be
implemented, many analysts seem to instead rely on heuristics. Two strands of research are pertinent.
One strand provides evidence on self-reported valuation model use. Demirakos, et al. (2004), for
example, report that only half of the 104 comprehensive research reports in their sample of London Stock
Exchange listed companies mention rigorous DCF valuation models (including variations such as
residual income). Nearly all reports mention heuristics such as earnings or sales multiples, and price-to-
book or price-to-assets ratios. This pattern is also evident in reports authored by Institutional Investor “All-
American” team members. Asquith et al. (2005) find that 99 percent of these reports mention an
earnings multiple (e.g., price-to-earnings) but only 13 percent mention the use of DCF or its variations.
6 Stock valuation methods are described, contrasted, and spreadsheet templates are provide in Damodaran (1996, 2005); Copeland, Koller, and Murrin (2000); Lundholm and Sloan (2007); and Penman (2007). These same sources discuss the shortcomings of valuation heuristics. For example, Damodaran (2005, p.754) says that the analysts’use of relative valuation multiples is often “a story telling experience; analysts’ with better and more believable stores are given credit for better valuations.”
7
DCF methods are mentioned more often when analysts issue a recommendation downgrade (20.8%)
than when they reiterate (11.1%) or upgrade (12.7%) the stock.
Evidence on valuation model use obtained from content analyses of sell-side research reports may
provide an incomplete picture of how analysts actually formulate their price targets. As Bradshaw (2004:
27) observes: “… individual analysts who use [DCF] present value models may choose to communicate the
results of their analyses in the simplest terms, excluding a detailed discussion of present value techniques
(i.e., dividend assumptions, discount rates, etc.). Additionally, there are obvious proprietary costs to
divulging particular methods of identifying any single security for recommended investment.”
Concerns of this sort spawned a second strand of research that infers valuation model use from
the observed correlation between analysts’ price targets (or recommendations) and researcher-
constructed valuation estimates. Bradshaw (2002) compares the price targets sell-side analysts disclose
in a hand-collected sample of 67 research reports on U.S. firms with pseudo-price targets constructed from
PEG ratios and industry-adjusted P/E multiples that incorporate analysts’ one-year and two-year-ahead
earnings forecasts.7 PEG-based pseudo-price targets are more highly correlated with actual price targets
than are pseudo-price targets constructed from industry P/E multiples.
Bradshaw (2004) reports large sample evidence on whether valuation estimates constructed
from analysts’ consensus earnings forecasts are consistent with consensus Buy/Sell recommendations. Four
valuation approaches are considered: two specifications of the DCF residual income model, a PEG ratio,
and analysts’ projections of long-term earnings growth.8 Analysts’ price targets are not considered
because of data availability limitations at the time. The results indicate that analysts seem to give their
highest recommendations to growth stocks without regard to valuation, and among growth stocks, the
highest recommendations are stocks favored by the PEG model. Recommendations are not well
7 The PEG ratio for a firm is its price-to-forward-earnings (P/E) ratio divided by a forecasted long-term earnings growth rate. PEG ratio advocates claim that a value greater than 1 constitutes a Buy signal. Pseudo-price targets constructed from DCF or residual income valuation models are not examined in Bradshaw (2002). 8 The two residual income specifications differ in their assumptions about earnings growth in the final year of the forecast horizon. One specification assumes residual income fades to zero over time; the other assumes residual income persists. Details are provided in Section 3 of this paper.

8
explained by pseudo-price targets constructed from residual income models. Notably, Bradshaw (2004)
concludes that investors would earn higher returns over a one-year holding period by relying on formal
DCF models that incorporate analysts’ consensus earnings forecasts rather than on analysts’ consensus
Buy/Sell recommendations alone.
Several messages from these findings are relevant to our study. First, individual analysts often
mention more than one valuation approach when describing how they arrive at their price targets and
Buy/Sell recommendations. Why they do so is unclear, but one interpretation is that analysts vary in
their adherence to rigorous stock valuation methodologies. Second, prior research on inferred valuation
model use (Bradshaw 2002, 2004) supports the view that some analysts employ heuristics that yield less
profitable price targets than do more rigorous multi-period DCF valuation approaches. However, these
findings are derived from a small sample of actual price targets (Bradshaw 2002) or from consensus stock
recommendations (Bradshaw 2004) that may not fully reflect the investment opinions of individual
analysts.
We contribute to this research stream by providing the first large sample evidence on whether
differences in inferred valuation model use by individual analysts contribute to differences in price target
quality. Our research methods allow for the possibility that competing valuation approaches (e.g., DCF
residual income and PEG model) sometimes yield the same price target estimate. Our tests control for
potential differences in analysts’ EPS forecast accuracy because earnings forecasts are inputs to the
valuation models we consider.
Analysts’ earnings forecast accuracy
Descriptions of the equity research process (e.g., Copeland, Koller, Murrin 2000; English 2001;
Penman 2007) indicate that the quality of an analyst’s stock recommendation depends on how well each
of three tasks is performed: formulating accurate forecasts of earnings and other fundamentals;
translating those forecasts into reliable valuation price targets; and then assigning a recommendation to
the stock based on a comparison of the stock’s current market price against the price target. Success at
one task does not guarantee success at the others. For example, an analyst skilled at forecasting earnings
9
may use those superior forecasts as inputs to a flawed valuation technique thereby generating inferior
price targets and recommendations. Or the advantages of accurate earnings forecasts and price targets
can be diminished when investment decisions are based solely on analysts’ Buy/Sell recommendations
and there are inefficiencies or biases in the recommendation assignment process.
Conventional wisdom suggests that more accurate EPS forecasts will result in higher quality
price targets, but there are reasons to question the strength of this predicted relation.9 Loh and Mian
(2006) and Ertimur et al. (2007) both find that analysts who issue more accurate EPS forecasts also
provide more profitable investment recommendations, but they do not identify price target superiority as
the source of this profitability improvement. Bradshaw (2002) argues that analysts concoct their price
targets whereas Bradshaw and Brown (2006) say analysts have few (if any) incentives to set accurate
price targets. These assertions raise doubts about overall price target quality and imply a rather tenuous
link between price targets and earnings forecast accuracy. Moreover, the potential benefits of superior
EPS forecasts for price target quality can be lost if those forecasts are used as inputs to a flawed stock
valuation model.
Our research extends Loh and Mian (2006) and Ertimur et al. (2007) by investigating whether
more accurate EPS forecasts are associated with superior price targets. In so doing, we provide evidence
on the extent to which inferred valuation model use amplifies or attenuates the influence of EPS forecast
accuracy on price target performance. Our tests rely on concurrent EPS forecast accuracy and control for
concurrent Buy/Sell recommendations.
9 Sustained differences exist over time in the EPS forecast accuracy of individual analysts (Stickel 1992; Sinha et al. 1997). These differences in EPS forecast accuracy can be traced to a variety of analyst, brokerage, and firm characteristics (Brown 2001; Brown and Mohammad 2001; Clement 1999; Mikhail, Walther and Willis 1997, 1999; Jacob, Lys and Neale 1999). Despite these differences, analysts’ EPS forecasts remain informative for investment purposes. EPS forecasts are more informative when they are issued by analysts with a track record for accuracy, although stock prices do not appear to fully reflect the benefits of superior forecast accuracy by less well known analysts (Gleason and Lee 2003).

10
3. Sample Selection, Measurement Issues, and Descriptive Statistics
Data requirements
Analysts’ price targets are from a First Call database of roughly 750,000 price targets issued from
1997 through 2003 by analysts affiliated with 314 distinct brokerage and stock research firms. First Call
identifies the brokerage or research firm—but not the individual analyst—submitting the price target.
Individual analysts are identified from the I/B/E/S earnings forecast detail file. We require each First Call
price target to be associated with a U.S. company, U.S. brokerage or research firm, and calendar month
for which we are also able to identify from I/B/E/S the affiliated analyst for that same company and month.
We adopt a company-year perspective and limit the sample to price targets in effect at the end of the
fourth month after the company’s fiscal year end. We also require analysts’ one-year EPS forecasts from
I/B/E/S to be current that same month.10 These data restrictions yield a preliminary sample of 64,281
company-year-analyst observations from the merged First Call and I/B/E/S files.
We require share price to be available from CRSP three days prior to the First Call price target
submission date. We delete firms with share prices below $1 so that our results are not influenced by
extremely large bid-ask spreads. We then remove extreme price targets by deleting the top and bottom
one percent of observations based on the ratio of price target to pre-submission date share price.
Our research design groups analyst-firm-year price targets by EPS forecast accuracy quintile and
the I/B/E/S detail population is used to assign quintile rankings (described below). This approach
ensures that our forecast accuracy measure is not contaminated by any self-selection bias associated with
the decision to report price targets to First Call. Analyst-firm-year observations from I/B/E/S are retained
for purposes of forming EPS forecast accuracy quintiles if: (1) one-year ahead EPS forecasts are current in
the fourth month after fiscal year end; (2) share price at that time is at least $1; (3) the absolute forecast
error scaled by share price (denoted AFE) is less than 25 percent; and (4) there are at least five unique
10 An EPS forecast is “current” if it is newly issued in the fourth month after the company’s fiscal year-end, or was issued previously but confirmed by I/B/E/S (thus reiterated by the analyst) in that same month or later. This approach reduces the likelihood that stale EPS forecasts contaminate our sample. We also delete stale price targets (i.e., those outstanding for more than one year) because most price targets are issued with a 12-month horizon.
11
values of AFE for each firm-year. 11 Requirement 3 mitigates the influence of I/B/E/S data errors on our
accuracy rankings. As in Loh and Mian (2006), requirement 4 ensures that each firm-year combination is
represented in each EPS forecast accuracy quintile. These restrictions further reduce the price target
sample to 45,693 analyst-firm-year price targets representing 4,086 individual sell-side analysts covering
2,717 distinct U.S. firms.
Analysts’ price targets
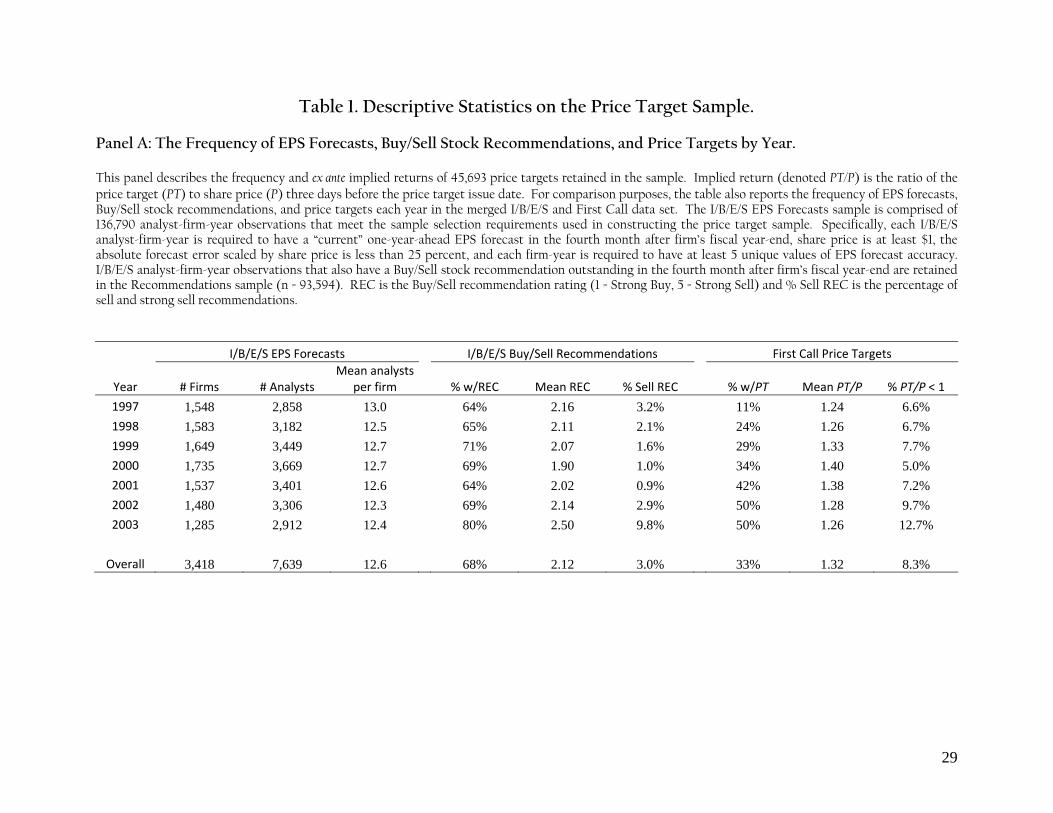
Table 1 reports descriptive statistics for the price target sample. Panel A describes the frequency
and average price target ex ante (implied) return, denoted PT/P and defined as the ratio of the analyst’s
price target (PT) to the stock’s market price (P) three days prior to the date the price target submission
date. Values of PT/P greater than 1 presumably convey the analyst’s belief that the stock is an attractive
investment opportunity whereas values less than 1 indicate an unattractive stock. Panel A also reports
comparative statistics on the frequency with which I/B/E/S analysts issue stock recommendations or
price targets each year.12
Several features of the price target sample are noteworthy. As indicated in panel A, price targets
are available from First Call for only about one-third of the I/B/E/S analyst-firm pairs meeting our
selection criteria. Price target availability increased markedly during the sample period from a low of 11
percent in 1997 to 50 percent in 2003. By contrast, Buy/Sell recommendations are available for roughly
two-thirds of the I/B/E/S analyst-firm pairs, and recommendation availability peaks at 80 percent in 2003.
The average implied price target return (PT/P) for stocks in our sample is 1.32, which means that
price targets when first issued exceed share prices by 32 percent on average. Mean implied return
increases from 1.24 in 1997 to 1.40 in 2000—a period often referred to as the “tech bubble”—and then
11 Price targets, share prices, and valuation model inputs (i.e., EPS forecasts and book value per share) are not adjusted for subsequent stock splits to avoid rounding errors common to the split adjustment process and to ensure that all variables are stated on the same basis. 12 For purposes of this comparison, we identify an I/B/E/S EPS Forecasts sample comprised of 136,790 analyst-firm-year observations that pass the filters used to construct the price target sample. Specifically, each I/B/E/S analyst-firm-year must have a “current” one-year-ahead EPS forecast, share price is at least $1, the absolute forecast error scaled by share price is less than 25 percent, and each firm-year must have at least 5 unique EPS forecast accuracy values. The Recommendations sample (n = 93,594) is comprised of I/B/E/S EPS Forecasts observations that also have a Buy/Sell stock recommendation outstanding in the fourth month after firm’s fiscal year-end. Price targets are not required for the two comparison samples.

12
declines to 1.26 by 2003. Analysts’ Buy/Sell recommendations exhibit a similar pattern of increasing then
declining optimism. Only about 8 percent of analysts’ price targets take a negative view on the stock
(PT/P less than 1). This may indicate that price targets are rarely issued by analysts when the stock is
deemed unattractive, or that analysts believed few covered stocks were overvalued during our sample
period. Sell and strong sell recommendations are also rare.13
Panel B of Table 1 describes the frequency distribution of price target implied return (PT/P) for
each stock recommendation category. These conditional distributions are derived from a sample of
35,241 analyst-firm-year observations where both price targets and recommendations are available. Price
targets are sorted each year into five groups that range from “disfavored” stocks—where PT/P is less than
1—to “most favored” stocks comprising the top quartile of observations where PT/P is greater than 1.
This sorting process preserves the natural distinction between presumably overvalued (PT/P < 1) and
undervalued (PT/P > 1) stocks, and is responsive to the rather obvious asymmetry in the distribution of
observed PT/P values.
The central message in panel B is that price targets and Buy/Sell recommendations are not perfect
substitutes for one another as indicators of an analyst’s belief about a stock’s investment potential. In
fact, analysts’ price targets and recommendations provide discordant investment signals in a strikingly
large number of cases. For example, one out of every five “strong sell” rated stocks is seemingly
undervalued (PT/P > 1). Less than half of all “sell” rated stocks are overvalued (PT/P < 1). Only one out of
three “strong buy” rated stocks is associated with a PT/P value in the “most favored” implied return
quartile and 3% of these highly recommended stocks are seemingly overvalued (PT/P < 1).14 These results
13 The increased frequency of sell recommendations (9.8%) and pessimistic price targets (12.7%) in 2003 may be due to changes in the regulations governing stock research reports (see Barber, Lehavy, McNichols and Trueman 2006). 14 There are several reasons why the Panel B data depart from a clustering along the diagonal. Some analysts may base their stock recommendations on factors unrelated to price target’s implied return. Even when analysts use price target profitability to determine their recommendations, individual brokerage houses may differ in the cutoffs used for each recommendation category. Differences in cutoff values are, however, unlikely to explain the directional mismatches (e.g., strong buy recommendations assigned to overvalued stocks) evident in the data.

13
echo earlier findings drawn from limited samples of price targets and recommendations (e.g., Asquith et
al. 2005; Bradshaw 2002).
Inferred valuation model use
We consider two stock valuation methodologies—a residual income (RIM) specification of the
DCF approach and the PEG ratio heuristic—as candidates for describing how sell-side analysts
formulate price targets. The Frankel and Lee (1998) RIM specification is selected as our DCF candidate
because it incorporates analysts’ multi-period EPS forecasts and because prior research demonstrates its
ability to identify mispriced stocks.15 The PEG ratio is selected as our valuation heuristic because of both
its reliance on analysts’ EPS forecasts and its demonstrated superiority for predicting analysts’ actual
price targets when compared to industry price-earnings multiples (Bradshaw 2002). A pseudo-price
target is constructed for each valuation approach and analyst-firm-year using the analyst’s EPS forecasts.
Valuation model use is then inferred by comparing the analyst’s actual price target with these two pseudo-
price targets. This approach, described in detail below, relies on the large sample properties of the
relation between analysts’ price targets and our constructed pseudo-price targets.
A RIM pseudo-price target is estimated as the discounted present value of expected residual
income for the next five years plus a terminal value, calculated as of the end of the fifth forecast year
(TVt+5):
∑=
++
++
++=
5
155
)1(][
)1(][
τττ
rTVE
rRIEBVPSV tttt
tRIt (1)
where VRIt is the pseudo-price target at time t, BVPS is equity book value per share, RI is residual
income ( )1*t tEPS r BVPSτ τ+ + −− , EPS is earnings per share, and r is the equity cost of capital or discount
rate. Our RIM implementation follows Bradshaw (2004) and relies on analysts’ forecasts available at the
price target issue date. We require one-year and two-year-ahead EPS forecasts and long-term EPS
15 The intellectual foundations for this specification are described in Feltham and Ohson (1995) and Ohlson (1995). All DCF-based valuation models, including RIM, are theoretically equivalent to one another (Copeland, Koller and Murrin. 2000; Penman 2007). Implementation differences across analysts can induce differences in price target quality even when the same DCF model is used. Single-period comparative valuation techniques (such as the PEG ratio) are theoretically equivalent to DCF only under very restrictive conditions.

14
growth estimates (LTG) to be available for each analyst-firm-year. If three-year to five-year EPS forecasts
are unavailable, they are constructed by extrapolating the last available EPS forecast using the analyst’s
long-term EPS growth estimate; e.g., E[EPSt+3] is set equal to the analyst’s explicit forecast of EPSt+2
multiplied by (1+LTG). Equity book values are extrapolated by presuming that firms maintain their
historical dividend payout ratios. This payout ratio is defined as the actual dividend payout ratio of the
most recent fiscal year, or the mean payout over the previous three years if the prior year ratio is
unreasonable (e.g., less than 0 or greater than 1). The industry discount rate (r) is the Fama and French
(1997) industry-specific risk premium plus the risk-free rate (30-day Treasury bill yield) in effect for the
month prior to the price target issue date. Our terminal value expression allows RI to fade toward zero
over time as a result of possible competitive pressures within the industry.16
The PEG ratio valuation heuristic is implemented using the two-year-ahead EPS forecast for each
analyst-firm-year:
[ ]2 100PEG t tV E EPS LTG+= × × (2)
where VPEG is the pseudo-price target and LTG is the analyst’s projection of long-term annual earnings-per-
share growth (Bradshaw 2004). Scaling the RIM and PEG pseudo-price targets (V) by share price (P)
yields a V/P index of investment potential that is directly comparable to the analyst-based profitability
metric PT/P. To ensure comparability, the same share price (P) is used in scaling pseudo-price targets and
the analyst’s price target.
16 To quantify the rate of fade for a given firm and year, we again follow Bradshaw (2004) and derive an empirical estimate (ω) for each Fama and French (1997) industry and sample year using all firms with the requisite data available on Compustat for at least two of the ten consecutive years prior to the sample year. For purposes of these fade rate regressions ( 1t t tRI RIη ω ε−= + + ), RI is cleansed of special items and scaled by equity market value at the beginning of the year. If
residual income after the terminal year is characterized by the industry/year-specific fade rate (ω), then the terminal value estimate is:
][1
][ 55 ++ −+= tttt RIE
rTVE
ωω
Our inferences regarding valuation model use are unchanged if we instead assume that RI persists in perpetuity rather than fades toward zero.
15
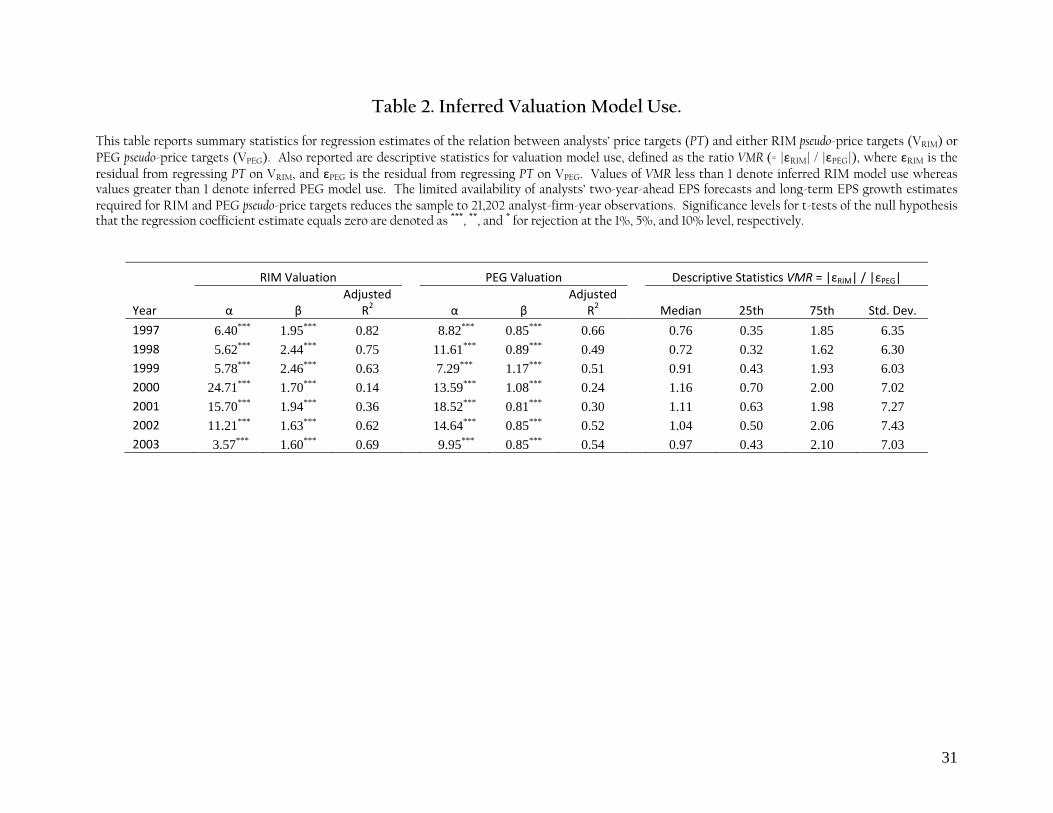
Table 2 describes the ability of RIM and PEG pseudo-price targets to explain cross-sectional
variation in analysts’ actual price targets. 17 The table reports summary statistics for annual regressions of
analysts’ price targets on each pseudo-price target. Two features of the data are noteworthy. First, RIM
and PEG pseudo-price targets both exhibit substantial explanatory power for analysts’ price targets in
that the adjusted R2 values of the annual regressions are above 50 percent in most years. Explanatory
power is moderate, however, in both 2000 and 2001. Second, the explanatory power of RIM pseudo-price
targets exceeds that for PEG pseudo-price targets in every year except 2000. These results indicate that
RIM pseudo-price targets exhibit greater descriptive validity for our sample than do pseudo-price targets
constructed from the PEG heuristic.
Table 2 also reports summary statistics describing inferred valuation model use as measured, for
a given analyst-firm-year, by ( )RIM PEGε ε where RIMε and PEGε are residuals from the pseudo-price
target regressions. The intuition behind our use of this valuation model ratio (VMR) is straight-forward:
the absolute value of the regression residual will depart from zero when the analyst’s price target is not
well described by the pseudo-price target. If RIM and PEG pseudo-price targets are both equally distant
from the actual price target, the ratio value will be 1. Ratio values less than 1 thus favor use of RIM by the
analyst whereas values greater than 1 favor use of the PEG heuristic. This approach to inferring valuation
model use takes advantage of the large sample properties of the relation between analysts’ price targets
and our pseudo-price targets, and facilitates inferences about valuation model use even when there are few
observations pertaining to a particular analyst. The approach also accommodates instances where the
two valuation approaches yield identical pseudo-price targets.
17 As in Frankel and Lee (1998) and Bradshaw (2004), we eliminate observations where equity book value is negative, return-on-equity (ROE) or forecasted ROE exceeds 100%, and where the resulting pseudo-price target is extreme. These data restrictions along with the limited availability of analysts’ two-year EPS forecasts and long-term EPS growth estimates for RIM and PEG pseudo-price targets reduce the sample to 21,202 analyst-firm-year observations.

16
Analysts’ actual price targets do not exhibit a consistent pattern of deviation from RIM and PEG
pseudo-price targets across the sample although they favor RIM in 1997 and 1998 (median VMR of 0.76 and
0.72) and favor PEG in 2000 and 2001 (median VMR of 1.16 and 1.11).
Earnings forecast accuracy
As in Loh and Mian (2006), we sort the population of I/B/E/S analysts that cover sample firms
into EPS forecast accuracy quintiles for each firm-year according to their unscaled absolute forecast
errors:
ijy ijy ijyAFE Actual Forecast= − (3)
where AFEijy is analyst i’s absolute forecast error for firm j in fiscal year y. AFE is not scaled by share price
because analysts are sorted within the same firm-year. Each analyst then receives a relative rank AFE,
where the analyst with the smallest AFE for that firm and year gets a rank equal to one. Analysts with
the same AFE are assigned the same rank. Next, we transform each assigned rank into a percentile and
sort analysts for a given firm and year into quintiles based on the percentile score.18
This approach to measuring relative EPS forecast accuracy has several desirable properties when
compared to the price deflated absolute forecast error measure common to the literature. In particular,
our approach facilitates comparisons of analysts’ relative forecast accuracy by controlling for the inherent
difficulty of the EPS forecasting task, which may vary across companies and over time for a given
company. The approach also has a drawback. It ranks analysts based on ordinal differences in forecast
accuracy, ignoring cardinal differences. This may add noise to our tests by muting larger forecast errors
or magnifying small performance differences.
Table 3 reports descriptive statistics on the distribution of scaled absolute forecast errors (AFE)
for both the population of I/B/E/S analysts who cover sample firms and the subsample who submit price
targets to First Call. The mean and median scaled AFE values increase monotonically (by construction)
across earnings forecast accuracy quintiles in both samples. Among analysts who also submit price 18 To construct percentiles, we subtract 0.25 from the assigned rank and divide the result by the maximum rank in the firm-year. Subtracting 0.25 from the assigned rank serves to equalize the observations allocated to extreme quintiles (Loh and Mian 2006).
17
targets to First Call, the mean scaled AFE is 0.024 (i.e., 2.4% of share price) in the least accurate earnings
forecast group (Quintile 5), or three times larger than the average scaled AFE for the most accurate group
(0.008 in Quintile 1). This divergence in scaled AFE suggests that differences in earnings forecast
accuracy among analysts in our sample are likely to be economically meaningful.
Between-sample t-tests in Table 3 document the superior earnings forecast accuracy of analysts
who submit price targets to First Call when compared to the larger group of I/B/E/S analysts who
provide a buy/sell recommendation (but perhaps no price target) for sample firms. This result holds for
each EPS forecast accuracy quintile and is not driven by differences in firm characteristics because, by
construction, the same firms are represented in both analyst samples. Untabulated results also confirm
that analysts who submit price targets to First Call produce superior EPS forecasts when compared to
the unrestricted population of all I/B/E/S analysts.
4. Results
To assess the realized profitability of analysts’ price target predictions, we compute 12-month
characteristics-adjusted buy-and-hold abnormal common stock returns (BHAR) as in Daniel, Grinblatt,
Titman and Wremers (1997):
⎥⎦
⎤⎢⎣
⎡+−+= ∏ ∏
= =
252
1
252
1, )1()1(
t ttCiti rrBHAR (4)
where rit is the daily raw return for stock i and rC,t is the daily value-weighted return on the
characteristics-sorted benchmark portfolio to which the firm belongs in that year.19 This approach
19 One hundred and twenty-five size, book-to-market, and momentum characteristic portfolios are formed each year. First, all NYSE, AMEX, and NASDAQ stocks are assigned to one of five size groups based on June closing equity market values and NYSE size quintiles. Within each size portfolio, firms are then sorted into five book-to-market groups using December closing values from the prior year. Within each of the 25 size and book-to-market portfolios, firms are then sorted into five return momentum portfolios based on a 12-month compounded raw return ending in May. Daily value-weighted returns to each characteristic portfolio (denoted rC,t) are then computed as the size-weighted average of the individual daily returns for firms in each portfolio. At least six non-missing monthly returns are required to calculate return momentum and missing returns are replaced by the value-weighted market return. As in Daniel et al. (1997), raw returns are compounded through May rather than June to mitigate problems associated with the bid-ask bounce (Jegadeesh, 1990). We align earnings forecast, valuation model use, and price
18
controls for differences in market-wide share price movements over the investment holding period. We
then compute the average BHAR for each of the price target implied return (PT/T) portfolios. If
differences in the price targets analysts assign to a stock are informative for investment purposes, we
should observe a pattern of increasing realized returns across these PT/P portfolios.
Table 4 reports average BHAR for the five price target portfolios. With the exception of stocks
assigned to the “disfavored” group where PT/P is less than 1, investment performance is indeed
monotonically increasing across price target portfolios. Stocks in the top (“most favored”) PT/P portfolio
earn a statistically positive 12-month BHAR of 5.00% compared to the reliably negative -1.42% BHAR
earned by “least favored” portfolio 2 stocks. By contrast, the BHAR for “disfavored” stocks is
indistinguishable from zero even though share prices are predicted by analysts to decline.
Investment performance and valuation model use
Table 4 also provides evidence on the whether valuation model use influences the quality of
analysts’ price target opinions. To investigate this question, BHAR are grouped by price target (PT/P)
portfolio and valuation model use (VMR) quintile. Two features of the data are noteworthy. First, BHAR
increases monotonically across price target portfolios when VMR implies use of a residual income
valuation approach (VMR Quintile 1). For example, VMR Quintile 1 stocks belonging to the “disfavored”
PT/P portfolio earn a 12-month abnormal return of -4.60% compared to the reliably positive 10.65% BHAR
earned by stocks in the “most favored” PT/T portfolio. Second, BHAR does not increase across price
target portfolios when VMR implies use of the PEG valuation approach (VMR Quintile 5). In fact, there is
no statistical difference in the performance of stocks assigned by analysts to the “disfavored” and “most
favored” PT/T groups in this PEG model quintile.
Collectively, the results in Table 4 are consistent with the joint hypothesis that RIM is a superior
stock valuation approach for setting price targets and that VMR captures information about analysts’
target data by accumulating returns over a 12-month period that begins on either the price target issue date or 30 days after the fiscal year-end for price targets issued prior to that date.
19
actual valuation model use. The results may also reflect the unintended influence of earnings forecast
accuracy as a correlated omitted variable. Earnings forecast accuracy has been shown to influence the
profitability of analysts’ Buy/Sell recommendations (Loh and Mian 2006; Ertimur et al. 2007), and so it is
likely to also influence the profitability of analysts’ price targets. Moreover, earnings forecasts are key
ingredients in both the RIM and PEG approach to price target formulation. The analysis that follows
provides evidence on three related issues: (1) whether earnings forecast accuracy is related to valuation
model use; (2) whether accuracy influences the profitability of analysts’ price targets; and (3) whether
this accuracy effect (if present) subsumes the documented influence of valuation model use on price
target investment performance.
Valuation model use and earnings forecast accuracy
Do analysts who are better at forecasting annual earnings also employ more rigorous valuation
models when formulating price targets? Evidence on whether inferred valuation model use varies across
earnings forecast accuracy quintiles is provided in Table 5. Analyst-firm-year observations are sorted by
valuation model ratio (VMR) into quintiles each year and earnings forecast accuracy (AFE) quintiles are
formed as described previously. If analysts who are the most accurate in forecasting EPS issue price
targets that more closely resemble RIM rather than PEG pseudo-price targets, a disproportionate number
of AFE Quintile 1 observations will fall into VMR Quintile 1. Similarly, if analysts who are the least
accurate in forecasting EPS issue price targets that approximate PEG rather than RIM pseudo-price
targets, the AFE Quintile 5 observations will cluster in VMR Quintile 5.
The data in panel A of Table 5 refute these predictions. Earnings forecast accuracy does not
appear to be correlated with valuation model use. Instead, earnings forecast accuracy is distributed
almost uniformly within a VMR quintile in that each cell contains about 20 percent of the corresponding
AFE observations. This means that valuation model use is independent of earnings forecast accuracy.

20
Earnings forecast accuracy and price target profitability
Table 5 also reports average BHAR by earnings forecast accuracy (AFE) quintile and price target
(PT/P) portfolio, both formed as described previously. If forecast accuracy differences influence the ex post
profitability of analysts’ price targets, investment performance should vary across AFE quintiles for a
given PT/P portfolio. Moreover, price target portfolios constructed from highly accurate earnings
forecasts (AFE Quintile 1) should outperform those where forecast accuracy is low (AFE Quintile 5).
Both predictions are supported by the data in panel B of Table 5.
Consider, for example, the investment performance of “most favored” stocks (PT/P portfolio 5).
Stocks in this portfolio earn, on average, a reliably positive abnormal return of 8.07% when they are
associated with analysts in the top earnings forecast accuracy group (AFE Quintile 1). By contrast, the
mean return for this PT/P portfolio is a reliably negative -5.45% for the bottom forecast accuracy group
(AFE Quintile 5). Monotonically increasing returns to improved forecast accuracy are most apparent
among highly favored stocks (PT/P portfolios 4 and 5) and disfavored stocks (PT/P portfolio 1, where
negative returns are predicted). In fact, AFE Quintile 1 stocks reliably outperform the AFE Quintile 5
stocks in every PT/P portfolio as evidenced by the Q1-Q5 hedged returns.
A second message in the data is that price targets are informative for investment purposes only
when forecast accuracy is relatively high (AFE Quintiles 1 and 2). For example, AFE Quintile 1 stocks in
the most favored PT/P portfolio earn a reliably positive average annual return of 8.07% compared to an
average return of -2.17% for AFE Quintile 1 stocks in the disfavored PT/P portfolio. However, when
earnings forecast accuracy is quite low (AFE Quintile 5), analysts’ price target investment opinions (PT/P)
are inconsistent with the direction and magnitude of realized returns. AFE Quintile 5 stocks in the most
favored PT/P portfolio earn a negative average abnormal return -5.45% compared to the 8.02% return for
disfavored stocks. The practical implication of these findings is clear: Investors would be well served to

21
ignore the stock recommendations implied by price targets of analysts with inferior EPS forecasting
ability.
Incremental influence of valuation model use
Regression analysis is employed to isolate the incremental effects on realized returns (BHAR) of
differences in analysts’ price target investment opinions, inferred valuation model use, and earnings
forecast accuracy. We also control for Buy/Sell recommendation rating (REC) because analysts who are
superior at forecasting EPS also issue more profitable recommendations (Loh and Mian 2006; Ertimur et
al. 2007). The explanatory variables PT/P_rank, VMR_rank, AFE_rank, and REC_rank are each scaled to
range between 0 and 1, and capture information about the ordinal ranking of the data.20 This approach
means that the regression coefficient estimates associated with each variable can be interpreted as the
return to a portfolio formed on that attribute. Interaction terms are included to capture the investment
performance of portfolios of specific interest; e.g., the term (AFE_rank x VMR_rank) denotes a portfolio
characterized by high earnings forecast accuracy and RIM valuation model use. Calendar year fixed-
effects are included but not reported.
Full sample regression results are presented in Panel A of Table 6.21 To facilitate interpretation of
coefficient estimates, Panel B reports contrast tests for differences in portfolio performance. These tests
involve linear combinations of the Panel A coefficient estimates and use two benchmark portfolios as
reference points. One benchmark portfolio is comprised of analyst-firm-year observations involving
stocks “most favored” by analysts’ price target opinions (PT/P_rank = 1), the “most accurate” earnings
forecasts (AFE_rank = 1), and use of a RIM valuation approach (VMR_rank = 1). This portfolio earns a
20 For example, REC_rank equals 0 if the analyst’s stock recommendation is a “strong sell” and 1 when it is a “strong buy.” Similarly, PT/P_rank equals 1 when the price target opinion denotes as a “most favored” stock, AFE_rank equals 1 for the top quintile (“most accurate”) EPS forecasts, and VMR_rank equals 1 when RIM is the inferred valuation approach. 21 Requiring a Buy/Sell recommendation for each analyst-firm-year reduces the sample to 16,858. Observations with studentized residuals greater than 3 in absolute value are deleted as non-representative outliers, and the statistical significance of individual regression coefficient estimates is assessed using standard errors corrected for within-firm time-series clustering of observations (Huber 1967; White 1980).

22
reliably positive 18.54% abnormal return over the ensuing 12 months.22 By contrast, a benchmark
portfolio characterized by “disfavored” price target stocks (PT/P_rank = 0), the “most accurate” earnings
forecasts, and RIM valuation model use earns a reliably negative -4.21% return. The returns for these two
benchmark portfolios thus confirm our earlier results on the usefulness of analysts’ price targets for
investment purposes when a RIM valuation approach is used and earnings forecast accuracy is high.
Panel B also documents the incremental effects on BHAR of changes in portfolio composition.
Consider the benchmark portfolio of “most favored” PT/P stocks, “most accurate” earnings forecasts, and
RIM valuation model use that earns a return of 18.54%. BHAR falls by 11.59% when the portfolio is tilted
to PEG use; by 17.47% when the portfolio is tilted to the least accurate earnings forecasts; and by 23.33%
when both valuation model use and earnings forecast accuracy are changed. This sharp deterioration in
realized returns confirms the incremental influence of valuation model use and forecast accuracy on the
investment performance of analysts’ price targets. As in our earlier findings, the BHAR for “most favored”
PT/P stocks is negative (-4.79% = 18.54% - 23.33%) when analysts in the bottom EPS forecast accuracy
quintile employ a PEG valuation approach in formulating their price targets.
A similar pattern of deteriorating investment performance is evident in the realized returns for
stocks disfavored by analysts’ price target opinions. Recall that these stocks are seemingly overvalued
(PT/P < 1) and thus should be sold. The benchmark portfolio abnormal return is -4.21% in Panel B for
disfavored PT/P stocks with the “most accurate” earnings forecasts and RIM valuation model use. BHAR
increases by 6.74% when the portfolio is tilted to PEG use; by 10.97% when the portfolio involves
analysts with the “least accurate” earnings forecasts; and by 12.00% when valuation model use and
earnings forecast accuracy are both changed. Investors can earn a positive 7.79% BHAR by purchasing
22 This return is computed as the sum of the coefficient estimates in Panel A with the exception of REC_rank, which we ignore. Note that the PT/T coefficient estimate of -12.58% in Panel A is correctly interpreted as the return to a portfolio characterized by “most favored” price target profitability (PT/T_rank = 1) but “least accurate” earnings forecasts (AFE_rank = 0) and inferred use of the PEG valuation approach (VMR_rank = 0). Including REC_rank in the contrast tests in Panel B alters the level of the benchmark portfolio but does not affect the level or significance of incremental returns for changes in portfolio composition.

23
(not selling short) the disfavored PT/P stocks in the bottom forecast accuracy quintile when price targets
derived using a PEG approach.
The results in Panel C of Table 6 further document the incremental effects of earnings forecast
accuracy and valuation model use on BHAR performance within each PT/P group. Benchmark portfolios
reflect RIM valuation model use and the “most accurate” earnings forecasts. These data corroborate our
full sample findings. For example, stocks in the top (“most favored”) PT/P portfolio earn a benchmark
return of 37.72% while the BHAR for “disfavored” PT/P stocks is -10.74%. This pattern of investment
performance underscores the value of analysts’ price targets for stock selection decisions. This value is
diminished by low earnings forecast accuracy or PEG valuation model use. For example, the BHAR for
“most favored” PT/P stocks falls by 11.80% when analysts’ price targets imply PEG use, and by 17.00%
when analysts’ earnings forecasts are the least accurate. Similar results hold for stocks in the next most
highly favored PT/P group. Among “disfavored” PT/P stocks, low forecast accuracy reduces the short
position BHAR by 17.37% but PEG model use has little impact on investment performance.
Supplemental analysis
Timely price targets: Untabulated results show that the beginning-of-year price targets issued
by AFE Quintile 5 analysts are 15 trading days older on average than the AFE Quintile 1 price targets
(p≤0.01). There is no difference across AFE quintiles in price targets timeliness when benchmarked
against EPS forecast release dates. There is also no difference in price target timeliness across valuation
model (VMR) quintiles. Stale price targets (and thus stale earnings forecasts) are negatively related to
realized returns (p≤0.10) but the Table 6 results are qualitatively unchanged when PT timeliness is added
to the regression model. Our findings are robust to alternative abnormal stock return measures and to
restricting the sample by averaging observations across analysts for a given firm and year within each
AFE quintile.
Timely earnings forecasts: Prior research has shown that analysts’ stale earnings forecasts are
less accurate than are timelier forecasts (e.g., see Brown et al. 1987; O’Brien 1998; Brown et al. 1990; Lys

24
and Soo 1995). Untabulated results for our sample indicate that analysts in the top earnings forecast
accuracy group (AFE Quintile 1) issue more timely annual forecasts than do those in the bottom forecast
accuracy group (Quintile 5). On average, the beginning-of-year EPS forecasts of AFE Quintile 5 analysts
are 15 trading days older than those of AFE Quintile 1 analysts, a difference that is statistically significant
(p≤0.01). This finding means that forecast timeliness may be partially responsible for difference across
AFE quintiles in realized returns (BHAR).
Recommendation quality: The full sample regression results (Panel A of Table 6) provide
evidence on the incremental influence of Buy/Sell recommendations on portfolio investment
performance. Stocks with a “strong buy” recommendation earn 5.12% less than do “strong sell” stocks
after controlling for price target opinions, earnings forecast accuracy, and inferred valuation model
use. In other words, more favorable recommendations are associated with an incremental reduction in
portfolio performance. This counter-intuitive result is confirmed in untabulated tests where we mimic
Panel C within each earnings forecast accuracy quintile. Buy/Sell recommendations have no incremental
association with realized returns for stocks in the top forecast accuracy quintile after controlling for
PT/P_rank and inferred valuation model use. PT/P_rank does exhibits a strong and positive association
with realized returns. This means that price targets are a more profitable investment tool than are
Buy/Sell recommendations when earnings forecast accuracy is high. Buy/Sell recommendations exhibit a
reliably negative incremental association with realized returns in the bottom two earnings forecast
accuracy quintiles, and are insignificant in quintiles 2 and 3.
5. Summary and Conclusions
This study investigates the influence of inferred valuation model use on the investment
performance of sell-side equity analysts’ published price targets. Our results document that substantial
improvements in price target quality occur when analysts appear to be using a rigorous residual-income
valuation technique rather than a PEG valuation heuristic. This improvement in 12-month realized

25
returns is most pronounced among analysts who are also adept at formulating accurate earnings forecasts,
a key ingredient in both stock valuation approaches. Our findings thus confirm that both departures
from RIM valuation model use and inferior earnings forecasts detract from the realized returns
associated with analysts’ price targets. The central message from our data is that the investment value of
analysts’ price target opinions is reduced substantially when those price targets are seemingly derived
from a valuation heuristic using inferior earnings forecasts.
Our results and conclusions are subject to several important caveats. First, the sample is
concentrated in years that correspond to the “technology bubble” in share prices of firms traded on U.S.
stock exchanges. Analysts’ optimistic price targets and recommendations may have contributed to, or
been affected by, the bubble in ways that limit the generalizability of our results to other time periods.
Second, the portfolio performance documented here does not reflect the actual profits available to
investors from implementable trading strategies nor was that our intent. Some (but not all) price target
portfolios are formed using information about concurrent EPS forecast accuracy that is not available to
investors until year-end. Third, we offer no conclusions about whether investors are efficient in their
use of analysts’ price targets (or Buy/Sell recommendations), or in differentiating between analysts
according to their earnings forecast accuracy or valuation model use. Efficiency questions are beyond the
scope of this paper.
Our results suggest several fruitful avenues for future research. One obvious avenue is to explore
whether price target superiority, like recommendation profitability (Ertimur et al. 2007), is influenced by
the valuation relevance of earnings and by analysts’ conflicts of interest. Our understanding of analysts’
valuation model use could also benefit from future research. Those of a more practical bent may wish to
explore the implications of our findings for identifying profit opportunities associated with
implementable trading strategies.

26
References
Asquith, P., M. Mikhail and A. Au. 2005. Information content of equity analyst reports. Journal of Financial Economics 75: 245-282.
Barber, B., R Lehavy, M. McNichols, and B. Trueman. 2006. Buy, holds, and sells: The distribution of investment
banks’ stock ratings and the implications for the profitability of analysts’ recommendations. Journal of Accounting and Economics 41: 87-118.
Bradshaw, M. 2002. The use of target prices to justify sell-side analysts’ stock recommendations. Accounting
Horizons 16: 27-41. Bradshaw, M. 2004. How do analysts use their earnings forecasts in generating stock recommendations? The
Accounting Review 79: 25-50. Bradshaw, M. and L. Brown. 2006. Do sell-side analysts exhibit differential target price forecasting ability?
Working paper, Harvard University and Georgia State University. Bradshaw, M., S. Richardson, and R. Sloan. 2003. Pump and dump: An empirical analysis of the relation between
corporate financing activities and sell-side analyst research. Working paper, University of Michigan. Brav, A. and R. Lehavy. 2003. An empirical analysis of analysts’ target prices: Short-term informativeness and long-
term dynamics. Journal of Finance 58: 1933-1967. Brav, A., R. Lehavy and R. Michaely. 2005. Using expectations to test asset pricing models. Financial Management 34:
31-64. Brown, L. 2001. How important is past analyst forecast accuracy? Financial Analysts Journal (December): 44-49. Brown, L., P. Griffin, L. Hagerman and M. Zmijewski. 1987. Security analyst superiority relative to univariate time-
series models in forecasting quarterly earnings. Journal of Accounting and Economics 9: 61-87. Brown, L. and E. Mohammad. 2001. Profiting from predicting individual analyst earnings forecast accuracy.
Working paper, Georaia State University. Brown, L., G. Richardson and S. Schwager. 1990. An information interpretation of financial analyst superiority in
forecasting earnings. Journal of Accounting Research 25: 49-67. Clement, M. 1999. Analyst forecast accuracy: Do ability resources, and portfolio complexity matter? Journal of
Accounting and Economics (June): 285-303. Copeland, T., T. Koller and J. Murrin. 2000. Valuation: Measuring and managing the values of companies. New York: John
Wiley & Sons, Inc. Damodaran, A. 1996. Investment Valuation. New York: John Wiley & Sons, Inc. Damodaran, A. 2005. Valuation approaches and Metrics: A survey of the theory and evidence, Foundations and Trends
in Finance 1: 693-784. Daniel, K., M. Grinblatt, S. Titman, and R. Wermers. 1997. Measuring mutual fund performance with characteristic-
based benchmarks. Journal of Finance 52: 1035-1058. Dechow, P., A. Hutton and R. Sloan. 2000. The relation between analysts’ long-term earnings forecasts and stock
price performance following equity offerings. Contemporary Accounting Research 17: 1-32.

27
Demirakos, E., N. Strong and M. Walker. 2004. What valuation models do analysts use? Accounting Horizons 18: 221-
240. English, J. 2001 Applied Equity Analysis. New York: McGraw-Hill. Ertimur, Y., J. Sunder, and S. Sunder. 2007. Measure for measure: The relation between forecast accuracy and
recommendation profitability of analysts. Journal of Accounting Research 45: 567-606. Fama E. and K. French. 1997. Industry costs of equity. Journal of Financial Economics 43: 153-193. Feltham, G. and J. Ohlson. 1995. Valuation and clean surplus: Accounting for operating and financial activities.
Contemporary Accounting Research 11: 689-711. Frankel, R. and C. M. C. Lee. 1998. Accounting valuation, market expectation, and cross-sectional stock returns.
Journal of Accounting and Economics 25 (June): 283-320. Gleason, C. and C. M. C. Lee. 2003. Analyst forecast revisions and market price discovery. The Accounting Review
(January): 193-225. Graham B. and D. Dodd. 1951. Security Analysis. New York: McGraw-Hill Book Company, Inc. Huber, P. 1967. The behavior of maximum likelihood estimates under nonstandard conditions. Procedures of the
fifth annual Berkeley symposium on mathematical statistics and probability 1: 221-233. Jacob, J., T. Lys, and M. Neale. 1999. Expertise in forecasting performance of security analysts. Journal of Accounting
Research (November): 51-82. Jegadeesh, N. 1990. Evidence of predictable behavior in security prices. Journal of Finance 45: 881–898. Lin, H. and M. McNichols. 1998. Underwriting relationships, analysts’ earnings forecasts and investment
recommendations. Journal of Accounting and Economics 25: 101-127. Lin, H., M. McNichols, and P. O’Brien. 2003. Analyst impartiality and investment banking relationships. Working
paper, Stanford University. Loh, R. and M. Mian. 2006. Do accurate earnings forecasts facilitate superior investment recommendations? Journal
of Financial Economics 80: 455-483. Lundholm, R. and R. Sloan. 2008. Equity Valuation and Analysis. New York: McGraw-Hill. Lys, T., and L.G. Soo. 1995. Analysts' forecast precision as a response to competition. Journal of Accounting, Auditing, and
Finance 10: 751-765. Michaely, R. and K. Womack. 1999. Conflict of interest and the credibility of underwriter analyst
recommendations. Review of Financial Studies 12: 573-608. Mikhail, M. B., B. R. Walther, and R. H. Willis. 1997. Do security analysts improve their performance with
experience? Journal of Accounting Research (Supplement): 131-157. Mikhail, M. B., B. R. Walther, and R. H. Willis. 1999. Does forecast accuracy matter to security analysts? The
Accounting Review (April): 185-200. O'Brien, P. 1988. Analysts' forecasts as earnings expectation. Journal of Accounting and Economics 10: 53-83.

28
Ohlson, J. 1995. Earnings, book values, and dividends in equity valuation. Contemporary Accounting Research 11: 661-687.
Penman, S. 2007. Financial statement analysis and security valuation. Boston, MA: McGraw-Hill Irwin. Sinha, P., L. D. Brown, and S. Das. 1997. A re-examination of financial analysts’ differential earnings forecast
accuracy. Contemporary Accounting Research (Spring): 1-42. Stickel, S. E. 1992. Reputation and performance among security analysts. Journal of Finance (December): 1811-1836. White, H. 1980. A heteroskedasticity-consistent covariance matrix estimator and a direct test for heteroskedasticity.
Econometrica 48: 817-838.
29
Table 1. Descriptive Statistics on the Price Target Sample. Panel A: The Frequency of EPS Forecasts, Buy/Sell Stock Recommendations, and Price Targets by Year. This panel describes the frequency and ex ante implied returns of 45,693 price targets retained in the sample. Implied return (denoted PT/P) is the ratio of the price target (PT) to share price (P) three days before the price target issue date. For comparison purposes, the table also reports the frequency of EPS forecasts, Buy/Sell stock recommendations, and price targets each year in the merged I/B/E/S and First Call data set. The I/B/E/S EPS Forecasts sample is comprised of 136,790 analyst-firm-year observations that meet the sample selection requirements used in constructing the price target sample. Specifically, each I/B/E/S analyst-firm-year is required to have a “current” one-year-ahead EPS forecast in the fourth month after firm’s fiscal year-end, share price is at least $1, the absolute forecast error scaled by share price is less than 25 percent, and each firm-year is required to have at least 5 unique values of EPS forecast accuracy. I/B/E/S analyst-firm-year observations that also have a Buy/Sell stock recommendation outstanding in the fourth month after firm’s fiscal year-end are retained in the Recommendations sample (n = 93,594). REC is the Buy/Sell recommendation rating (1 = Strong Buy, 5 = Strong Sell) and % Sell REC is the percentage of sell and strong sell recommendations.
I/B/E/S EPS Forecasts I/B/E/S Buy/Sell Recommendations First Call Price Targets
Year # Firms # Analysts Mean analysts
per firm % w/REC Mean REC % Sell REC % w/PT Mean PT/P % PT/P < 1
1997 1,548 2,858 13.0 64% 2.16 3.2% 11% 1.24 6.6% 1998 1,583 3,182 12.5 65% 2.11 2.1% 24% 1.26 6.7% 1999 1,649 3,449 12.7 71% 2.07 1.6% 29% 1.33 7.7% 2000 1,735 3,669 12.7 69% 1.90 1.0% 34% 1.40 5.0% 2001 1,537 3,401 12.6 64% 2.02 0.9% 42% 1.38 7.2% 2002 1,480 3,306 12.3 69% 2.14 2.9% 50% 1.28 9.7% 2003 1,285 2,912 12.4 80% 2.50 9.8% 50% 1.26 12.7%
Overall 3,418 7,639 12.6 68% 2.12 3.0% 33% 1.32 8.3%

30
Table 1. Descriptive Statistics on the Price Target Sample (continued). Panel B: Implied Price Target Profitability (PT/P) and Buy/Sell Stock Recommendations. This panel describes the conditional distribution of price target implied return (PT/P) by stock recommendation category for 35,241 analyst-firm-year observations where both a price target and Buy/Sell recommendation are available in the fourth month after the firm’s fiscal year end. Observations with PT/P less than one are assigned to a single group of “disfavored” stocks and observations with PT/P greater than or equal to one are sorted into quartiles (group 2 through 5, where 5 denotes “most favored” stocks). For each recommendation category, we report the percentage of observations in each PT/P group. Price Target Implied Return Category (PT/P<1 and then PT/T Quartiles)
Stock Disfavored Least favored Most favored
Recommendation 1 2 3 4 5 Overall N
Strong Sell 80% 7% 6% 4% 4% 0.5% 181 Sell 42% 30% 11% 7% 11% 2.0% 709 Hold 20% 38% 17% 13% 14% 26.0% 9,163 Buy 4% 23% 27% 24% 21% 35.3% 12,446 Strong Buy 3% 11% 24% 30% 32% 36.2% 12,742
31
Table 2. Inferred Valuation Model Use. This table reports summary statistics for regression estimates of the relation between analysts’ price targets (PT) and either RIM pseudo-price targets (VRIM) or PEG pseudo-price targets (VPEG). Also reported are descriptive statistics for valuation model use, defined as the ratio VMR (= |εRIM| / |εPEG|), where εRIM is the residual from regressing PT on VRIM, and εPEG is the residual from regressing PT on VPEG. Values of VMR less than 1 denote inferred RIM model use whereas values greater than 1 denote inferred PEG model use. The limited availability of analysts’ two-year-ahead EPS forecasts and long-term EPS growth estimates required for RIM and PEG pseudo-price targets reduces the sample to 21,202 analyst-firm-year observations. Significance levels for t-tests of the null hypothesis that the regression coefficient estimate equals zero are denoted as ***, **, and * for rejection at the 1%, 5%, and 10% level, respectively.
RIM Valuation PEG Valuation Descriptive Statistics VMR = |εRIM| / |εPEG|
Year α β Adjusted
R2 α β Adjusted
R2 Median 25th 75th Std. Dev.
1997 6.40*** 1.95*** 0.82 8.82*** 0.85*** 0.66 0.76 0.35 1.85 6.35 1998 5.62*** 2.44*** 0.75 11.61*** 0.89*** 0.49 0.72 0.32 1.62 6.30 1999 5.78*** 2.46*** 0.63 7.29*** 1.17*** 0.51 0.91 0.43 1.93 6.03 2000 24.71*** 1.70*** 0.14 13.59*** 1.08*** 0.24 1.16 0.70 2.00 7.02 2001 15.70*** 1.94*** 0.36 18.52*** 0.81*** 0.30 1.11 0.63 1.98 7.27 2002 11.21*** 1.63*** 0.62 14.64*** 0.85*** 0.52 1.04 0.50 2.06 7.43 2003 3.57*** 1.60*** 0.69 9.95*** 0.85*** 0.54 0.97 0.43 2.10 7.03

32
Table 3. Earnings Forecast Accuracy This table describes the conditional distribution of analysts’ absolute EPS forecast error (AFE, scaled by share price) for earnings forecast accuracy quintiles constructed from the I/B/E/S detail population for covered sample firms using one-year-ahead EPS forecasts with each firm-year required to have at least 5 unique values of AFE. For comparison purposes, conditional AFE distributions summary statistics are presented for the stock recommendation and the price target samples described in Table 1. We compute the mean scaled AFE across analysts for each firm-year in a given quintile, and then average across firm-years within each quintile. Significance levels for between-sample t-tests of the null hypothesis of mean equality are denoted as ***, **, and * for two-tailed rejection at the 1%, 5%, and 10% level, respectively.
All I/B/E/S Analysts Covering Sample Firms I/B/E/S Analysts Providing Price Targets Mean
Mean Median Std. Dev. N Mean Median Std. Dev. N Difference
Earnings Forecast Accuracy Quintile 1 (most accurate) 0.009 0.002 0.020 16,012 0.008 0.002 0.019 7,895 0.001** 2 0.012 0.003 0.023 21,343 0.011 0.003 0.020 10,905 0.001*** 3 0.015 0.005 0.026 21,037 0.013 0.005 0.024 10,482 0.001*** 4 0.018 0.007 0.031 19,584 0.017 0.007 0.028 9,490 0.001*** 5 (least accurate) 0.026 0.011 0.041 15,618 0.024 0.010 0.037 6,921 0.003*** Overall 0.016 0.005 0.029 93,594 0.014 0.005 0.026 45,693 0.002***

33
Table 4. Price Target Investment Performance and Valuation Model Use. This table reports average 12-month buy-and-hold abnormal returns (BHAR) by valuation model use (VMR) and price target implied return (PT/P). Observations with PT/P less than one are assigned to a single profitability group (‘least favored”) and observations with PT/P greater than or equal to one are sorted into quartiles (group 2 through 5, where 5 denotes “most favored”). Valuation model use quintiles are based on VMR = (|εRIM| / |εPEG|) as described in Table 2. BHAR is computed as the difference between the one-year buy-and-hold return for firm i and the (size, book-to-market and momentum) characteristic portfolio return to which firm i belongs in that year (Daniel, et. al. 1997). Returns are accumulated over a 12-month period that begins on either the price target issue date or 30 days after the fiscal year-end for price targets issued prior to that date. Hedged portfolio returns are computed for the difference between extreme valuation model use quintiles (Q1 minus Q5) or extreme PT/T categories (Most Favored minus Disfavored). The limited availability of analysts’ two-year-ahead EPS forecasts and long-term EPS growth estimates required for RIM and PEG pseudo-price targets reduces the sample to 21,202 analyst-firm-year observations. Significance levels for two-tailed t-tests of the null hypothesis that portfolio returns are zero are denoted as ***, **, and * for rejection at the 1%, 5%, and 10% level, respectively.
Price Target Implied Return Category (PT/P<1 and then PT/T Quartiles)
Disfavored Least favored Most favored N 1 2 3 4 5 MF ‐ D
Mean BHAR 21,202 2.07 -1.42** 0.18 2.20** 5.00*** 3.93** Valuation Model Use Quintile 1 (Favors RIM) 4,237 -4.60 -2.88** 3.69* 7.57*** 10.65*** 15.25*** 2 4,243 4.46 1.28 -0.50 2.41 4.04** -0.42 3 4,241 2.66 -2.76** -0.79 1.09 5.89*** 3.22 4 4,243 6.72*** 0.28 -0.47 -1.18 5.75** -0.97 5 (Favors PEG) 4,238 -0.97 -3.15*** -0.85 0.84 -3.91** -2.95
Q1 – Q5 -3.63 0.27 4.55* 6.73* 14.57***

34
Table 5. Valuation Model Use and Earnings Forecast Accuracy. Panel A: Valuation Model Use within Earnings Forecast Accuracy Quintiles. This panel describes the conditional distribution of inferred valuation model use (VMR = |εRIM| / |εPEG|) by earnings forecast accuracy (AFE) quintile. Each cell reports the proportion of analyst-firm-year observations in a particular AFE quintile that fall into each valuation model (VMR) quintile where VMR Quintile 1 favors RIM use and Quintile 5 favors PEG use. VMR quintile assignments are determined annually. AFE quintiles are also determined annually from the I/B/E/S detail population for covered sample firms using one-year-ahead EPS forecasts with each firm-year required to have at least 5 unique values of AFE. The limited availability of analysts’ two-year-ahead EPS forecasts and long-term EPS growth estimates required for RIM and PEG pseudo-price targets, and thus VMR, reduces the sample to 21,202 analyst-firm-year observations.
Valuation Model Use (VMR = |εRIM| / |εPEG|) Quintiles
Favors RIM Favors PEG N 1 2 3 4 5 Overall
Earnings forecast accuracy quintile 1 (most accurate) 3,633 19% 20% 20% 20% 20% 100% 2 5,241 19% 19% 21% 20% 20% 100% 3 5,047 20% 20% 20% 20% 21% 100% 4 4,433 21% 20% 19% 20% 20% 100% 5 (least accurate) 2,848 21% 21% 19% 20% 19% 100%
Mean VMR 0.21 0.59 1.00 1.72 10.14

35
Table 5. Valuation Model Use and Earnings Forecast Accuracy. Panel B: Price Target Investment Performance by Earnings Forecast Accuracy Quintile. This panel reports average 12-month buy-and-hold abnormal returns (BHAR) by earnings forecast accuracy (AFE) quintile and each price target implied return (PT/P) category for the entire price target sample. AFE quintiles are determined annually using one-year-ahead forecasts from the I/B/E/S detail population and procedures described in the text. This quintile assignment process yields unbalanced sample sizes. Observations with PT/P less than one are assigned to a single profitability group (“least favored”) and observations with PT/P greater than or equal to one are sorted into quartiles (group 2 through 5, where 5 denotes “most favored”). BHAR is computed as the difference between the one-year buy-and-hold return for firm i and the (size, book-to-market and momentum) characteristic portfolio return to which firm i belongs in that year (Daniel, et. al. 1997). Returns are accumulated over a 12-month period that begins on either the price target issue date or 30 days after the fiscal year-end for price targets issued prior to that date. Hedged portfolio returns are computed for the difference between extreme AFE quintiles (Q1 minus Q5) or extreme PT/T categories (Most Favored minus Disfavored). Significance levels for two-tailed t-tests of the null hypothesis that portfolio returns are zero are denoted as ***, **, and * for rejection at the 1%, 5%, and 10% level, respectively.
Price Target Implied Return Category (PT/P<1 and then PT/T Quartiles)
Disfavored Least favored Most Favored N 1 2 3 4 5 MF ‐ D
Earnings Forecast Accuracy Quintile 1 (most accurate) 7,659 -2.17 -2.37*** 1.67 5.11*** 8.07*** 10.24*** 2 10,665 -2.56** -1.48** 1.10 3.75*** 6.04*** 8.60*** 3 10,251 3.73* -0.95 -0.58 3.08*** 2.37* -1.36 4 9,271 6.85*** -1.80** -0.94 1.49 1.39 -5.46 5 (least accurate) 6,740 8.02*** 1.76 -2.52** -1.46 -5.45*** -13.47***
Q1‐ Q5 -10.19*** -4.12** 4.18** 6.57*** 13.52*** Mean BHAR over all quintiles 2.35** -1.13*** -0.14 2.58*** 2.57***

36
Table 6. The Incremental Effects on Price Target Investment Performance of Valuation Model Use and Earnings Forecast Accuracy.
This table reports the results obtained from buy-and-hold annual abnormal return (BHAR) regression tests of the incremental effects of valuation model use (VMR) and earnings forecast accuracy (AFE) after controlling for price target implied return (PT/P) and Buy/Sell stock recommendation rating. BHAR is computed as the difference between the one-year buy-and-hold return for firm i and the (size, book-to-market and momentum) characteristic portfolio return to which firm i belongs in that year (Daniel, et. al. 1997). Returns are accumulated over a 12-month period that begins on either the price target issue date or 30 days after the fiscal year-end for price targets issued prior to that date. The variables PT/P_rank, REC_rank, AFE_rank, and VMR_rank are scaled to range between 0 and 1, and capture information about the ordinal ranking of the data. Specifically, VMR_rank equals 1 when the data imply use of the RIM valuation approach, AFE_rank is 1 for the quintile of most accurate EPS forecasts, REC_rank is 0 when the analyst’s recommendation is a “strong sell” and 1 when it is a “strong buy”, and PT/P_rank is 1 for “most favored” stocks. Year fixed-effects are included but not reported. The availability of Buy/Sell recommendations limits the sample to 16,858 analyst-firm-years. Observations with studentized residuals greater than 3 in absolute value are deleted in each regression. Significance levels for t-tests of the null hypothesis that the regression coefficient is zero are denoted as ***, **, and * for rejection at the 1%, 5%, and 10% level, respectively. Panel A: Full Sample Regression.
Coefficient Estimates
Intercept PT/P_rank REC_rank AFE_rank VMR_rank PT/P_rank x AFE_rank
PT/P_rank x VMR_rank
AFE_rank x VMR_rank
PT/P_rankx AFE_rank x VMR_rank
Adjusted R2 N
7.79*** -12.58*** -5.12** -5.26* -1.03 17.00*** 6.89 -5.71 11.44 1.9% 16,858
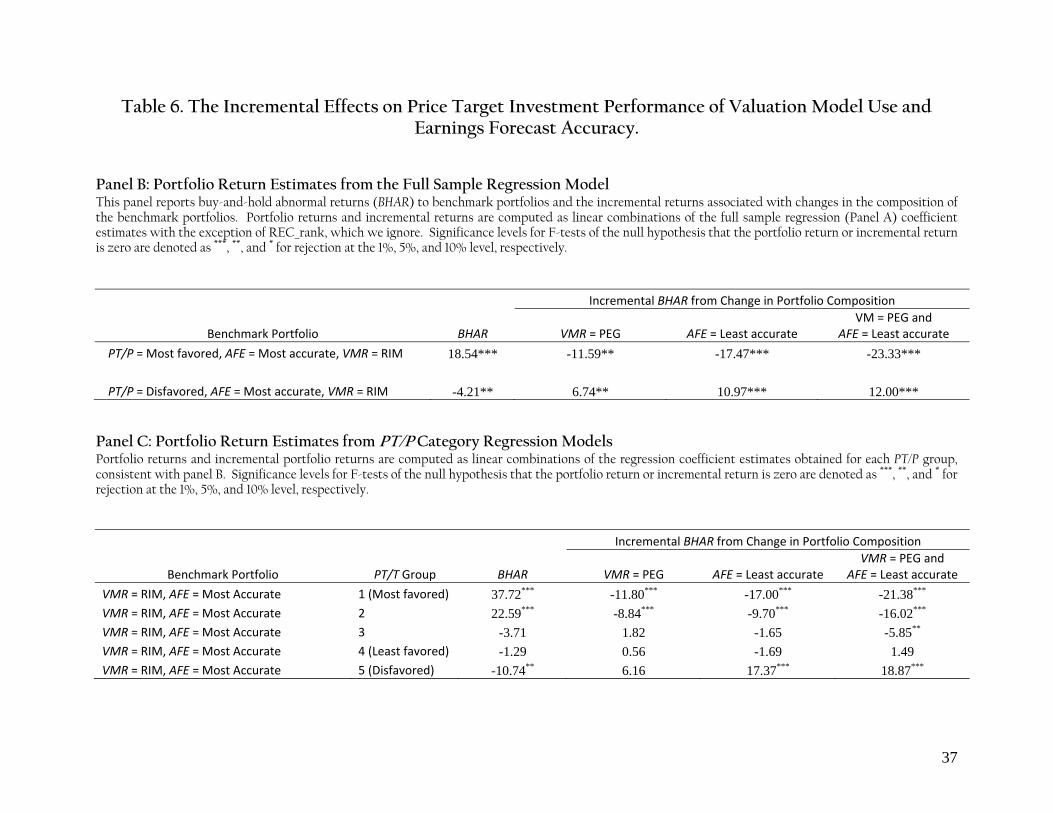
37
Table 6. The Incremental Effects on Price Target Investment Performance of Valuation Model Use and Earnings Forecast Accuracy.
Panel B: Portfolio Return Estimates from the Full Sample Regression Model This panel reports buy-and-hold abnormal returns (BHAR) to benchmark portfolios and the incremental returns associated with changes in the composition of the benchmark portfolios. Portfolio returns and incremental returns are computed as linear combinations of the full sample regression (Panel A) coefficient estimates with the exception of REC_rank, which we ignore. Significance levels for F-tests of the null hypothesis that the portfolio return or incremental return is zero are denoted as ***, **, and * for rejection at the 1%, 5%, and 10% level, respectively.
Incremental BHAR from Change in Portfolio Composition
Benchmark Portfolio BHAR VMR = PEG AFE = Least accurate VM = PEG and
AFE = Least accurate
PT/P = Most favored, AFE = Most accurate, VMR = RIM 18.54*** -11.59** -17.47*** -23.33***
PT/P = Disfavored, AFE = Most accurate, VMR = RIM -4.21** 6.74** 10.97*** 12.00***
Panel C: Portfolio Return Estimates from PT/P Category Regression Models Portfolio returns and incremental portfolio returns are computed as linear combinations of the regression coefficient estimates obtained for each PT/P group, consistent with panel B. Significance levels for F-tests of the null hypothesis that the portfolio return or incremental return is zero are denoted as ***, **, and * for rejection at the 1%, 5%, and 10% level, respectively.
Incremental BHAR from Change in Portfolio Composition
Benchmark Portfolio PT/T Group BHAR VMR = PEG AFE = Least accurate VMR = PEG and
AFE = Least accurate
VMR = RIM, AFE = Most Accurate 1 (Most favored) 37.72*** -11.80*** -17.00*** -21.38*** VMR = RIM, AFE = Most Accurate 2 22.59*** -8.84*** -9.70*** -16.02*** VMR = RIM, AFE = Most Accurate 3 -3.71 1.82 -1.65 -5.85** VMR = RIM, AFE = Most Accurate 4 (Least favored) -1.29 0.56 -1.69 1.49 VMR = RIM, AFE = Most Accurate 5 (Disfavored) -10.74** 6.16 17.37*** 18.87***