Valuation: Basics - New York...
40
Aswath Damodaran 1 Valuation: Basics Aswath Damodaran
-
Upload
nguyenkhanh -
Category
Documents
-
view
217 -
download
1
Transcript of Valuation: Basics - New York...

Aswath Damodaran! 1!
Valuation: Basics!Aswath Damodaran

Aswath Damodaran! 2!
Approaches to Valuation!
Intrinsic valuation, relates the value of an asset to the present value of expected future cashflows on that asset. In its most common form, this takes the form of a discounted cash flow valuation.
Relative valuation, estimates the value of an asset by looking at the pricing of 'comparable' assets relative to a common variable like earnings, cashflows, book value or sales.
Contingent claim valuation, uses option pricing models to measure the value of assets that share option characteristics.

Aswath Damodaran! 3!
I. Discounted Cash Flow Valuation!
What is it: In discounted cash flow valuation, the value of an asset is the present value of the expected cash flows on the asset.
Philosophical Basis: Every asset has an intrinsic value that can be estimated, based upon its characteristics in terms of cash flows, growth and risk.
Information Needed: To use discounted cash flow valuation, you need • to estimate the life of the asset • to estimate the cash flows during the life of the asset • to estimate the discount rate to apply to these cash flows to get present
value Market Inefficiency: Markets are assumed to make mistakes in
pricing assets across time, and are assumed to correct themselves over time, as new information comes out about assets.

Aswath Damodaran! 4!
Risk Adjusted Value: Three Basic Propositions
The value of an asset is the present value of the expected cash flows on that asset, over its expected life:
Proposition 1: If “it” does not affect the cash flows or alter risk (thus changing discount rates), “it” cannot affect value.
Proposition 2: For an asset to have value, the expected cash flows have to be positive some time over the life of the asset.
Proposition 3: Assets that generate cash flows early in their life will be worth more than assets that generate cash flows later; the latter may however have greater growth and higher cash flows to compensate.

Aswath Damodaran! 5!
Let’s start simple: Valuing a default-free bond!
The value of a default free bond can be computed as the present value of the coupons and the face value, discounted back to today at the risk free rate.
Thus, the value of five-year US treasury bond (assuming that the US treasury is default free) with a coupon rate of 5.50%, annual coupons and a market interest rate of 5.00% can be computed as follows: Value of bond = PV of coupons of $55 each year for 5 years @ 5% + PV of $1000 at the end of year 5 @5% = $1021.64
The value of this bond will increase (decrease) as interest rates decrease (increase) and the sensitivity of the bond value to interest rate changes is measured with the duration of the bond.

Aswath Damodaran! 6!
A little messier: Valuing a bond with default risk!
When valuing a bond with default risk, there are two ways in which you can approach the problem.
In the more conventional approach, you discount the promised coupons back at a “default-risk” adjusted discount rate. Thus, if you have a ten-year corporate bond, with an annual coupon of 4% and the interest rate (with default risk embedded in it) of 5%, the value of the bond can be written as follows:
You can also value this bond, by adjusting the coupons for the likelihood of default (making them expected cash flows) and discounting back at a risk free rate.
Price of bond = t=1
t=10
∑ 40(1.05)t
+ 1,000(1.05)10 = $922.78

Aswath Damodaran! 7!
Valuing Equity!
Equity represents a residual cashflow rather than a promised cashflow. You can value equity in one of two ways:
• By discounting cashflows to equity at the cost of equity to arrive at the value of equity directly.
• By discounting cashflows to the firm at the cost of capital to arrive at the value of the business. Subtracting out the firm’s outstanding debt should yield the value of equity.
Aswath Damodaran! 8!
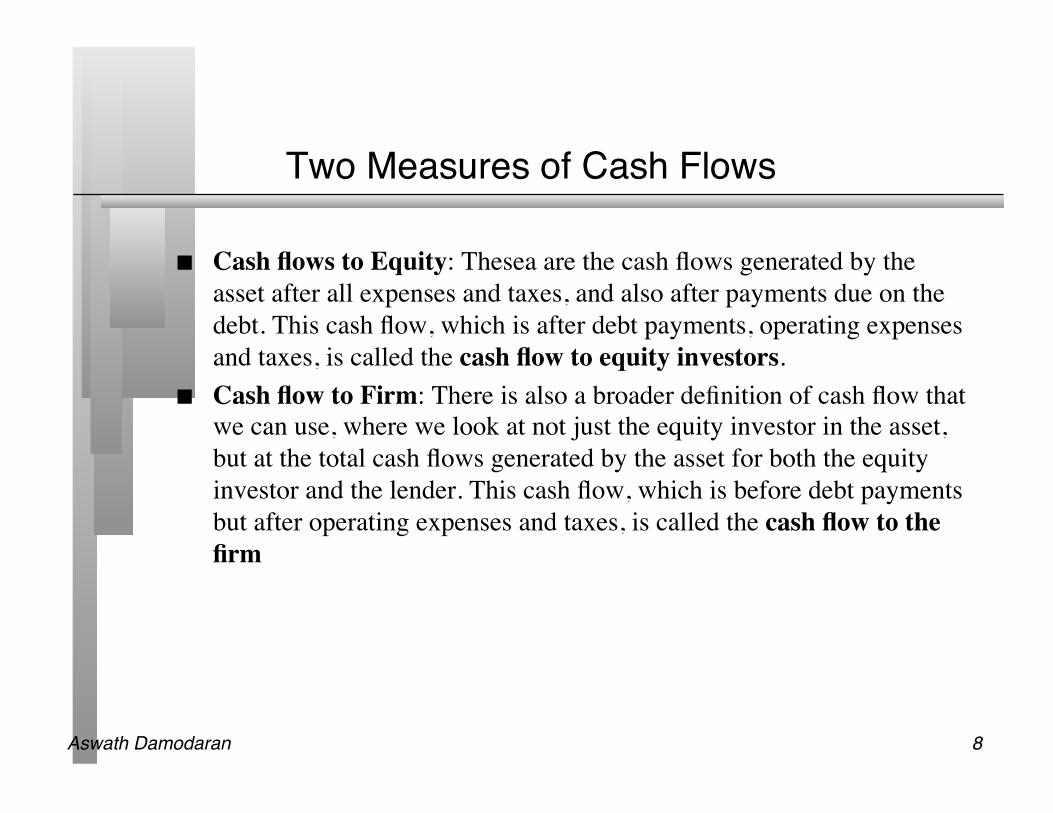
Two Measures of Cash Flows!
Cash flows to Equity: Thesea are the cash flows generated by the asset after all expenses and taxes, and also after payments due on the debt. This cash flow, which is after debt payments, operating expenses and taxes, is called the cash flow to equity investors.
Cash flow to Firm: There is also a broader definition of cash flow that we can use, where we look at not just the equity investor in the asset, but at the total cash flows generated by the asset for both the equity investor and the lender. This cash flow, which is before debt payments but after operating expenses and taxes, is called the cash flow to the firm

Aswath Damodaran! 9!
Two Measures of Discount Rates!
Cost of Equity: This is the rate of return required by equity investors on an investment. It will incorporate a premium for equity risk -the greater the risk, the greater the premium.
Cost of capital: This is a composite cost of all of the capital invested in an asset or business. It will be a weighted average of the cost of equity and the after-tax cost of borrowing.

Aswath Damodaran! 10!
Equity Valuation!
Assets Liabilities
Assets in Place Debt
EquityDiscount rate reflects only the cost of raising equity financingGrowth Assets
Figure 5.5: Equity Valuation
Cash flows considered are cashflows from assets, after debt payments and after making reinvestments needed for future growth
Present value is value of just the equity claims on the firm

Aswath Damodaran! 11!
Firm Valuation!
Assets Liabilities
Assets in Place Debt
Equity
Discount rate reflects the cost of raising both debt and equity financing, in proportion to their use
Growth Assets
Figure 5.6: Firm Valuation
Cash flows considered are cashflows from assets, prior to any debt paymentsbut after firm has reinvested to create growth assets
Present value is value of the entire firm, and reflects the value of all claims on the firm.

Aswath Damodaran! 12!
Valuation with Infinite Life!
Cash flowsFirm: Pre-debt cash flowEquity: After debt cash flows
Expected GrowthFirm: Growth in Operating EarningsEquity: Growth in Net Income/EPS
CF1 CF2 CF3 CF4 CF5
Forever
Firm is in stable growth:Grows at constant rateforever
Terminal ValueCFn.........
Discount RateFirm:Cost of Capital
Equity: Cost of Equity
ValueFirm: Value of Firm
Equity: Value of Equity
DISCOUNTED CASHFLOW VALUATION
Length of Period of High Growth

Aswath Damodaran! 13!
1. Estimating Cash flow!
Cash flows can be measured to
All claimholders in the firm
EBIT (1- tax rate) - ( Capital Expenditures - Depreciation)- Change in non-cash working capital= Free Cash Flow to Firm (FCFF)
Just Equity Investors
Net Income- (Capital Expenditures - Depreciation)- Change in non-cash Working Capital- (Principal Repaid - New Debt Issues)- Preferred Dividend
Dividends+ Stock Buybacks

Aswath Damodaran! 14!
2. The Determinants of High Growth!
Expected Growth
Net Income Operating Income
Retention Ratio=1 - Dividends/Net Income
Return on EquityNet Income/Book Value of Equity
XReinvestment Rate = (Net Cap Ex + Chg in WC/EBIT(1-t)
Return on Capital =EBIT(1-t)/Book Value of Capital
X

Aswath Damodaran! 15!
3. Length of High Growth and Terminal Value!
Terminal Value
Liquidation Value
Multiple Approach Stable Growth Model
Most useful when assets are separable and marketable
Easiest approach but makes the valuation a relative valuation
Technically soundest, but requires that you make judgments about when the firm will grow at a stable rate which it can sustain forever, and the excess returns (if any) that it will earn during the period.

Aswath Damodaran! 16!
4. Discount Rates!
Cost of Equity = Riskfree Rate + Beta X (Risk Premium)
Has to be default free, in the same currency as cash flows, and defined in same terms (real or nominal) as thecash flows
Historical Premium1. Mature Equity Market Premium:Average premium earned bystocks over T.Bonds in U.S.2. Country risk premium =Country Default Spread* (σEquity/σCountry bond)
Implied PremiumBased on how equity is priced todayand a simple valuationmodel
or
Cost of Capital = Cost of Equity (Equity/(Debt + Equity)) + Cost of Borrowing (1-t) (Debt/(Debt + Equity))
Cost of borrowing should be based upon(1) synthetic or actual bond rating(2) default spreadCost of Borrowing = Riskfree rate + Default spread
Marginal tax rate, reflectingtax benefits of debt
Weights should be market value weightsCost of equitybased upon bottom-upbeta
Cost of Capital: Weighted rate of return demanded by all investors
Cost of Equity: Rate of Return demanded by equity investors

Aswath Damodaran! 17!
I. Dividend Discount Model!
The simplest measure of cashflow to equity is the expected dividend. In a dividend discount model, the value of equity is the present value of expected dividends, discounted back at the cost of equity.
€
Value of Equity =Expected Dividendst
(1+ Cost of Equity)tt=1
t=∞
∑
Aswath Damodaran! 18!
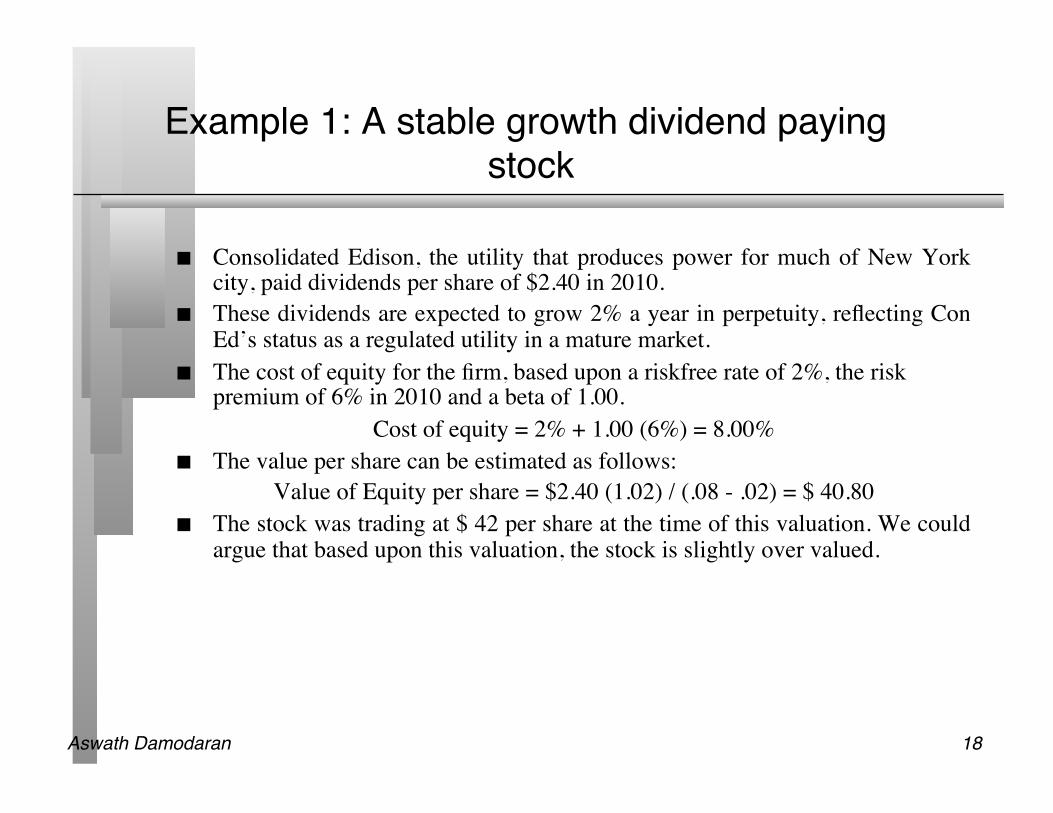
Example 1: A stable growth dividend paying stock!
Consolidated Edison, the utility that produces power for much of New York city, paid dividends per share of $2.40 in 2010.
These dividends are expected to grow 2% a year in perpetuity, reflecting Con Ed’s status as a regulated utility in a mature market.
The cost of equity for the firm, based upon a riskfree rate of 2%, the risk premium of 6% in 2010 and a beta of 1.00.
Cost of equity = 2% + 1.00 (6%) = 8.00% The value per share can be estimated as follows:
Value of Equity per share = $2.40 (1.02) / (.08 - .02) = $ 40.80 The stock was trading at $ 42 per share at the time of this valuation. We could
argue that based upon this valuation, the stock is slightly over valued.

Aswath Damodaran! 19!
Example 2: A high-growth dividend discount model valuation!
Procter and Gamble (P&G) reported earnings per share of $3.82 in 2010 and paid out 50% of its earnings as dividends.
We will use a beta of 0.90, reflecting the beta of large consumer product companies in 2010, a riskfree rate of 3.50% and a mature market equity risk premium of 5% to estimate the cost of equity:
Cost of equity = 3.50% + 0.90 (5%) = 8.00% Based upon P&G’s expected ROE of 20%, we estimated an expected
growth rate of 10% in earnings & dividends for the next 5 years: Expected growth rate = ROE * (1- payout ratio) = .20 (1-.5) = .10 or 10%
After year 5, we assumed that P&G would be a stable growth firm, growing 3% a year in perpetuity, paying out 75% of its earnings as dividends and with a cost of equity of 8.5%.

Aswath Damodaran! 20!
Valuing P&G!
The expected dividends for the first 5 years are computed based upon maintaining a 10% growth rate and a 50% payout ratio, and discounting those dividends back to today at 8%.
Value at end of year 5 =
1 2 3 4 5 Sum
Earnings per share $4.20 $4.62 $5.08 $5.59 $6.15
Payout ratio 50.00% 50.00% 50.00% 50.00% 50.00%
Dividends per share $2.10 $2.31 $2.54 $2.80 $3.08
Terminal value $86.41
Cost of Equity 8.00% 8.00% 8.00% 8.00% 8.00%
Present Value $1.95 $1.98 $2.02 $2.06 $60.90 $68.90
EPS5(1+Growth rateStable )(Payout ratioStable )
(Cost of EquityStable −Growth rateStable )
=$6.15(1.03)(.75)(.085−.03)
= $86.41

Aswath Damodaran! 21!
A Measure of Potential Dividends: Free Cashflows to Equity!
Dividends are discretionary and are set by managers of firms. Not all firms pay out what they can afford to in dividends.
We consider a broader definition of cash flow to which we call free cash flow to equity, defined as the cash left over after operating expenses, interest expenses, net debt payments and reinvestment needs. By net debt payments, we are referring to the difference between new debt issued and repayments of old debt. If the new debt issued exceeds debt repayments, the free cash flow to equity will be higher. Free Cash Flow to Equity (FCFE) = Net Income – Reinvestment Needs –
(Debt Repaid – New Debt Issued)

Aswath Damodaran! 22!
Example: Valuing Coca Cola with a high growth FCFE model!
In 2010, Coca Cola reported net income of $11,809 million, capital expenditures of $2,215 million, depreciation of $1,443 million and an increase in non-cash working capital of $335 million. Incorporating the fact that Coca Cola raised $150 million more in debt than it repaid: FCFECoca Cola= Net Income – (Cap Ex – Depreciation) – Change in non-cash Working capital – (Debt repaid – New Debt raised) = 11,809 – (2,215 -1443) – 335 – (-150) = $10.852 million
We assumed that Coca Cola’s net income would grow 7.5% a year for the next 5 years and that it would reinvest 25% of its net income each year back into the business. In addition, we assumed that the cost of equity for Coca Cola during this five-year period would be 8.45%.
At the end of year 5, we assumed that Coca Cola would be in stable growth, growing 3% a year, reinvesting 20% of its net income back into the business, with a cost of equity of 9%.

Aswath Damodaran! 23!
Valuation of Coca Cola!
The FCFE for the first 5 years are computed, using the expected growth rate of 7.5% in net income and a 25% reinvestment rate.
Terminal value of equity =
1 2 3 4 5
Sum
Expected Growth Rate 7.50% 7.50% 7.50% 7.50% 7.50%
Net Income $12,581 $13,525 $14,539 $15,630 $16,802
Equity Reinvestment Rate 25.00% 25.00% 25.00% 25.00% 25.00%
FCFE $9,436 $10,144 $10,905 $11,722 $12,602
Terminal Value of equity $230,750
Cost of Equity 8.45% 8.45% 8.45% 8.45% 8.45%
Cumulative Cost of Equity 1.0845 1.1761 1.2755 1.3833 1.5002
Present Value $8,701 $8,625 $8,549 $8,474 $162,213
$196,562
$16,802 (1.03) (.80)(.09-.03)
= $230, 750 million

Aswath Damodaran! 24!
The Paths to Value Creation!
Using the DCF framework, there are four basic ways in which the value of a firm can be enhanced: • The cash flows from existing assets to the firm can be increased, by either
– increasing after-tax earnings from assets in place or – reducing reinvestment needs (net capital expenditures or working capital)
• The expected growth rate in these cash flows can be increased by either – Increasing the rate of reinvestment in the firm – Improving the return on capital on those reinvestments
• The length of the high growth period can be extended to allow for more years of high growth.
• The cost of capital can be reduced by – Reducing the operating risk in investments/assets – Changing the financial mix – Changing the financing compositio

Aswath Damodaran! 25!
Revenues
* Operating Margin
= EBIT
- Tax Rate * EBIT
= EBIT (1-t)
+ Depreciation- Capital Expenditures- Chg in Working Capital= FCFF
Divest assets thathave negative EBIT
More efficient operations and cost cuttting: Higher Margins
Reduce tax rate- moving income to lower tax locales- transfer pricing- risk management
Live off past over- investment
Better inventory management and tighter credit policies
Increase Cash Flows
Reinvestment Rate
* Return on Capital
= Expected Growth Rate
Reinvest more inprojects
Do acquisitions
Increase operatingmargins
Increase capital turnover ratio
Increase Expected Growth
Firm Value
Increase length of growth period
Build on existing competitive advantages
Create new competitive advantages
Reduce the cost of capital
Cost of Equity * (Equity/Capital) + Pre-tax Cost of Debt (1- tax rate) * (Debt/Capital)
Make your product/service less discretionary
Reduce Operating leverage
Match your financing to your assets: Reduce your default risk and cost of debt
Reduce beta
Shift interest expenses to higher tax locales
Change financing mix to reduce cost of capital

Aswath Damodaran! 26!
II. Relative Valuation!
What is it?: The value of any asset can be estimated by looking at how the market prices “similar” or ‘comparable” assets.
Philosophical Basis: The intrinsic value of an asset is impossible (or close to impossible) to estimate. The value of an asset is whatever the market is willing to pay for it (based upon its characteristics)
Information Needed: To do a relative valuation, you need • an identical asset, or a group of comparable or similar assets • a standardized measure of value (in equity, this is obtained by dividing the
price by a common variable, such as earnings or book value) • and if the assets are not perfectly comparable, variables to control for the
differences Market Inefficiency: Pricing errors made across similar or
comparable assets are easier to spot, easier to exploit and are much more quickly corrected.

Aswath Damodaran! 27!
Categorizing Multiples!
Multiples of Earnings • Equity earnings multiples: Price earnings ratios and variants • Operating earnings multiples: Enterprise value to EBITDA or EBIT • Cash earnings multiples
Multiples of Book Value • Equity book multiples: Price to book equity • Capital book multiples: Enterprise value to book capital
Multiples of revenues • Price to Sales • Enterprise value to Sales

Aswath Damodaran! 28!
The Fundamentals behind multiples!
Every multiple has embedded in it all of the assumptions that underlie discounted cashflow valuation. In particular, your assumptions about growth, risk and cashflow determine your multiple.
If you have an equity multiple, you can begin with an equity discounted cash flow model and work out the determinants.
If you have a firm value multiple, you can begin with a firm valuation model and work out the determinants.

Aswath Damodaran! 29!
Equity Multiples and Fundamentals!
Gordon Growth Model: Dividing both sides by the earnings,
Dividing both sides by the book value of equity,
If the return on equity is written in terms of the retention ratio and the expected growth rate
Dividing by the Sales per share,
P0 =DPS1r − gn
P0EPS0
= PE = Payout Ratio * (1 + gn )
r-gn
P 0BV 0
= PBV = ROE - gn
r-gn
P 0BV 0
= PBV = ROE * Payout Ratio * (1 + gn )r-gn
P 0Sales0
= PS = Profit Margin * Payout Ratio * (1 + gn )
r-gn

Aswath Damodaran! 30!
What to control for...!
Multiple Determining VariablesPrice/Earnings Ratio Growth, Payout, RiskPrice/Book Value Ratio Growth, Payout, Risk, ROEPrice/Sales Ratio Growth, Payout, Risk, Net MarginValue/EBITValue/EBIT (1-t)Value/EBITDA
Growth, Reinvestment Needs, Leverage, Risk
Value/Sales Growth, Net Capital Expenditure needs, Leverage, Risk,Operating Margin
Value/Book Capital Growth, Leverage, Risk and ROC

Aswath Damodaran! 31!
Choosing Comparable firms!
If life were simple, the value of a firm would be analyzed by looking at how an exactly identical firm - in terms of risk, growth and cash flows - is priced. In most analyses, however, a comparable firm is defined to be one in the same business as the firm being analyzed.
If there are enough firms in the sector to allow for it, this list will be pruned further using other criteria; for instance, only firms of similar size may be considered. Implicitly, the assumption being made here is that firms in the same sector have similar risk, growth and cash flow profiles and therefore can be compared with much more legitimacy.

Aswath Damodaran! 32!
How to control for differences..!
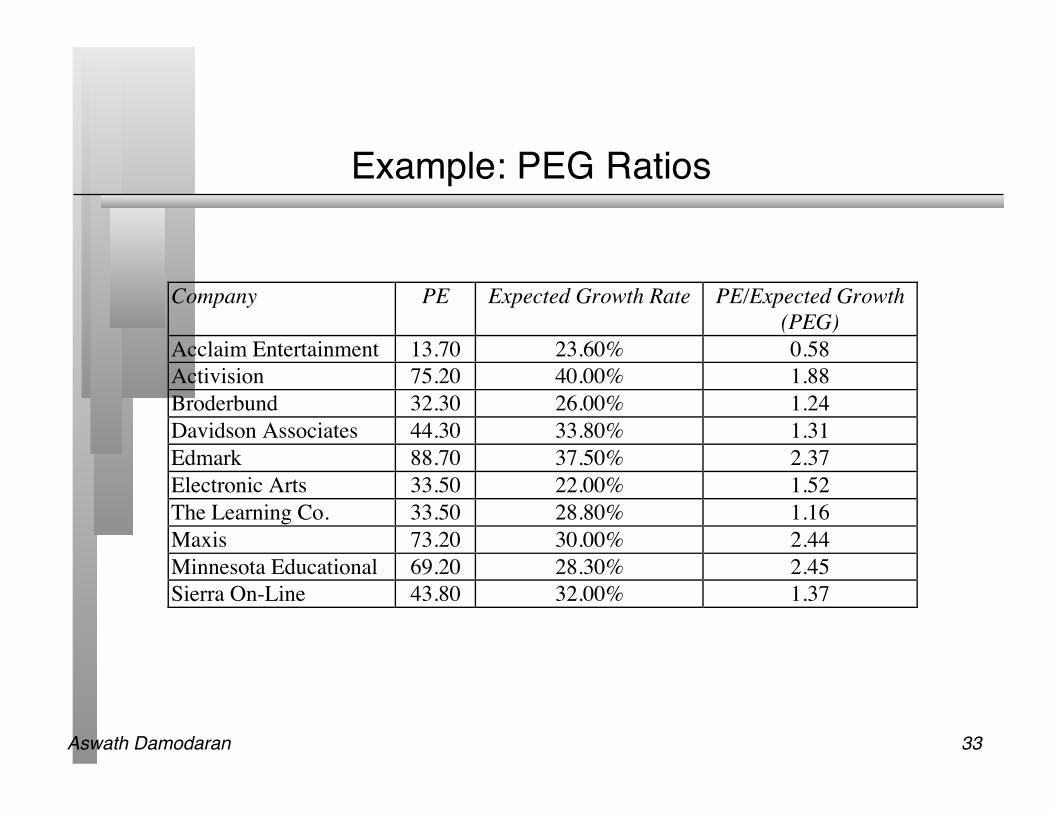
Modify the basic multiple to adjust for the effects of the most critical variable determining that multiple. For instance, you could divide the PE ratio by the expected growth rate to arrive at the PEG ratio.
PEG = PE / Expected Growth rate If you want to control for more than one variable, you can draw on
more sophisticated techniques such as multiple regressions.
Aswath Damodaran! 33!
Example: PEG Ratios!
Company PE Expected Growth Rate PE/Expected Growth(PEG)
Acclaim Entertainment 13.70 23.60% 0.58Activision 75.20 40.00% 1.88Broderbund 32.30 26.00% 1.24Davidson Associates 44.30 33.80% 1.31Edmark 88.70 37.50% 2.37Electronic Arts 33.50 22.00% 1.52The Learning Co. 33.50 28.80% 1.16Maxis 73.20 30.00% 2.44Minnesota Educational 69.20 28.30% 2.45Sierra On-Line 43.80 32.00% 1.37

Aswath Damodaran! 34!
Example: PBV ratios, ROE and Growth!
Company Name P/BV ROE Expected GrowthTotal ADR B 0.90 4.10 9.50%Giant Industries 1.10 7.20 7.81%Royal Dutch Petroleum ADR 1.10 12.30 5.50%Tesoro Petroleum 1.10 5.20 8.00%Petrobras 1.15 3.37 15%YPF ADR 1.60 13.40 12.50%Ashland 1.70 10.60 7%Quaker State 1.70 4.40 17%Coastal 1.80 9.40 12%Elf Aquitaine ADR 1.90 6.20 12%Holly 2.00 20.00 4%Ultramar Diamond Shamrock 2.00 9.90 8%Witco 2.00 10.40 14%World Fuel Services 2.00 17.20 10%Elcor 2.10 10.10 15%Imperial Oil 2.20 8.60 16%Repsol ADR 2.20 17.40 14%Shell Transport & TradingADR
2.40 10.50 10%
Amoco 2.60 17.30 6%Phillips Petroleum 2.60 14.70 7.50%ENI SpA ADR 2.80 18.30 10%Mapco 2.80 16.20 12%Texaco 2.90 15.70 12.50%British Petroleum ADR 3.20 19.60 8%Tosco 3.50 13.70 14%

Aswath Damodaran! 35!
Results from Multiple Regression!
We ran a regression of PBV ratios on both variables: PBV = -0.11 + 11.22 (ROE) + 7.87 (Expected Growth) R2 = 60.88% (5.79) (2.83)
The numbers in brackets are t-statistics and suggest that the relationship between PBV ratios and both variables in the regression are statistically significant. The R-squared indicates the percentage of the differences in PBV ratios that is explained by the independent variables.
Finally, the regression itself can be used to get predicted PBV ratios for the companies in the list. Thus, the predicted PBV ratio for Repsol would be:
Predicted PBVRepsol = -0.11 + 11.22 (.1740) + 7.87 (.14) = 2.94 Since the actual PBV ratio for Repsol was 2.20, this would suggest that the stock was
undervalued by roughly 25%.

Aswath Damodaran! 36!
III. Contingent Claim (Option) Valuation!
Options have several features • They derive their value from an underlying asset, which has value • The payoff on a call (put) option occurs only if the value of the underlying
asset is greater (lesser) than an exercise price that is specified at the time the option is created. If this contingency does not occur, the option is worthless.
• They have a fixed life Any security that shares these features can be valued as an option.

Aswath Damodaran! 37!
Option Payoff Diagrams!
Value of AssetStrike Price
Call OptionPut Option

Aswath Damodaran! 38!
Direct Examples of Options!
Listed options, which are options on traded assets, that are issued by, listed on and traded on an option exchange.
Warrants, which are call options on traded stocks, that are issued by the company. The proceeds from the warrant issue go to the company, and the warrants are often traded on the market.
Contingent Value Rights, which are put options on traded stocks, that are also issued by the firm. The proceeds from the CVR issue also go to the company
Scores and LEAPs, are long term call options on traded stocks, which are traded on the exchanges.

Aswath Damodaran! 39!
Indirect Examples of Options!
Equity in a deeply troubled firm - a firm with negative earnings and high leverage - can be viewed as an option to liquidate that is held by the stockholders of the firm. Viewed as such, it is a call option on the assets of the firm.
The reserves owned by natural resource firms can be viewed as call options on the underlying resource, since the firm can decide whether and how much of the resource to extract from the reserve,
The patent owned by a firm or an exclusive license issued to a firm can be viewed as an option on the underlying product (project). The firm owns this option for the duration of the patent.
The rights possessed by a firm to expand an existing investment into new markets or new products.

Aswath Damodaran! 40!
In summary…
While there are hundreds of valuation models and metrics around, there are only three valuation approaches: • Intrinsic valuation (usually, but not always a DCF valuation) • Relative valuation • Contingent claim valuation
The three approaches can yield different estimates of value for the same asset at the same point in time.
To truly grasp valuation, you have to be able to understand and use all three approaches. There is a time and a place for each approach, and knowing when to use each one is a key part of mastering valuation.