VALU ORLD · An Integrated Cost Modeling Computer System for 8 , ... OFM undertook a study of...
48
VALU ORLD JOURNAL OF THE SOCIETY OF AMERICAN VALUE ENGINEERS VOLUME XVII, NUMBER 2 MAY 1994 Spec/aii Issue £3# ERECTING SAINT PETER'S OBELISK
Transcript of VALU ORLD · An Integrated Cost Modeling Computer System for 8 , ... OFM undertook a study of...

VALU ORLD JOURNAL OF THE SOCIETY OF AMERICAN VALUE ENGINEERS VOLUME XVII, NUMBER 2 MAY 1994
Spec/aii Issue
£ 3 #
ERECTING SAINT PETER'S OBELISK

CONTENTS
EDITORIAL
Vox Populi 1
ARTICLES
Value Engineering as a Budgeting Tool 2 Harvey C. Childs, AIA
An Integrated Cost Modeling Computer System for 8 , Construction VE Projects
ChansikPark, PhD and Ralph D. Ellis, Jr., PhD, PE
VEST: A Graded Approach to VE 15 Roger B. Sperling, CVS
Initiating VE Early in the Life Cycle of Products 17 Joseph J. O'Rourke, PE, CVS and GlenwoodL. Garvey, AIA
Value Engineering Contribution to Financial Flexibility 21
Arthur E. Mudge, CVS, FSAVE
EXECUTIVE SERIES
Testimony in the U.S. House of Representatives 25 Larry W. Zimmerman, PE, CVS, FSAVE Free Decision-Assistance Program Enhances VE with Risk Identification and 28 Quality Practices Database
Ernie Renner, Director U.S. Navy Best Manufacturing Practice Program
RELATED LITERATURE
VE-Creative Steps Toward Total Cost Control 30 Del L. Younker, CCE, CVS After All the Tests have Been Graded, Will TQM Get an A+ or and F? 35
Management Review Staff
BOOK REVIEW
The Hidden Wealth of Cities: Policy and Productivity Methods for 39
American Local Governments, Kditcd by Edward ('. Hayes
SAVE BOOKSTORE BOOKS OF THE ISSUE
Function Analysis: The Stepping Stones to Good Value 40 Thomas J. Snodgrass, CVS and Muthiah Kasi, CVS Project Budgeting for Buildings 40 Donald E. Parker and Alphonse J. Ml'lsola. CVS, PE, FSAVE
Continued on Inside Back Cover

Editorial: Vox Populi
The voices that interest us the most are those of our readers and you certainly had something to say about the format changes in the last issue of Value World. Here is a sampling of the communiques we received.
" I am very much disappointed with your first issue of Value World. Judging by it, you are a compiler and not an editor."
"Congratulations on your first issue. In essence it looks good and I like most of the changes that you made."
"Throughout our normal day, we are bombarded with all kinds of documents that are black and white. I recommend that you add some color at least to the cover of Value World."
"It was a great shock and a severe disappointment to receive my January issue of Value World. After ten years, we finally had a product that presented a first-class image to the world in both appearance and content. The new format creates a very poor impression. It does not have style or quality."
"Congratulations on your inaugural issue of Value World. Good job. Good imagination. Your articles inside were a refreshing treat also. Keep up the good work."
"As you may know, many academics are big on attributes such as "status function"or "esteem function" when it comes to publications. While I don't necessarily support such views, I do live with my administrators who do. Unfortunately, the present Value World format and "look" will not provide for the functions of status or esteem as well as the past format did. In the previous appearance, including the picture and biography of the author did."
" I like your relaxing the computer disk requirement for offerings to Value World. There are a lot of people out there who cannot conveniently cope with that, so they do not offer that which is on their minds. I encountered the words "where appropriate" many times during my tenure as VE manager, spoken by the competition to roughen the playing field. It, therefore, gives some degree of satisfaction to read about that in the January issue of Value World. You have found the horseshoe. New gloves next?"
"Keep each issue more focused on our technical divisions. Cover should be a heavier stock and a different color. Put table of contents on inside cover. Use more font styles (e.g., bold and italics) in titles and quotes. There is too much white space."
"Then came the new-look Value World. Again I faced an unfamiliar format, but I was pleased to see the many
categories in the contents and the fine tribute to Editor Emeritus O. James Vogl, CVS, FSAVE."
And that was Vox Populi in action; prompting the format changes you see in this issue. These changes are the handiwork of our Production Editor, Doris Huston. Note the new feature Value Briefs that is intended to minimize white space while being informative. Note also the new feature SAVE Bookstore Books of the Issue. We hope you like the new features and changes but, at any rate, let us hear from you.
This special construction issue has a variety of articles starting with Harvey Childs' article on the budgeting process, followed by Drs. Park and Ellis' article on cost modeling, and Roger Sperling's article on a graded approach to the VE job plan.
Joe O'Rourke and Glen Garvey's article addresses an unusual application for VE in construction, namely, the oft-maligned public restroom. Next, Art Mudge reveals his expertise article on how VE can contribute to financial flexibility in both rich and lean years..
We have two articles in our Executive Series: The first is Larry Zimmerman's testimony to Congress on pending VE legislation. The second article is a description and offer of a free decision-assistance program by Ernie Renner, the Director of the U.S. Navy Best Manufacturing Practice Program.
Associate Editor Del Younker addresses cost control in construction in his article from Cost Engineering, the Journal of AACE International. The article After All the Tests Have Been Graded, Will TQM Get an A+ or an F? is from the AMA's Management Review. Coming on the heels of TQM discussions at our conference in New Orleans, the article is especially thought provoking. Read what Dr. W. Edward Deming, the recently deceased Dean of Quality, said about TQM.
Bemie Schulte offers sound advice for multiple-source contenders in "Perspective: And Now the Rest of the Story, our first essay in this issue. Third parties can submit VECPs against your contracts and get your share of the cost saving. You get to keep all the cost reduction. Now, ain't that a shame?
Roger Sperling returns with his delightful Perspective: Chaos Is Required in VE. Finally, Tom King closes this issue with a long-overdue salute to the grunts of the everyday world.
The upcoming September 1994 Value World will be a special healthcare issue. We have room for a few more articles and invite your contributions.
Goodnight and 30.
VALUE WORLD, Volume XVII, Number 2, May 1904

2
Value Engineering as a Budgeting Tool Harvey C. Childs, A I A
INTRODUCTION
The State of Washington has been a leader in the use of VE in the common school construction program (K-12) for the past ten years (1). Based on this success in 1990, the Office of Financial Management (OFM), which is the state budget office, implemented an additional VE program that broadens the use to all state agencies. This paper discusses the implementation and first results of the use of VE as a budgeting tool in a program called BEST, the acronym formed from Budget Estimate Team Study.
SELLING THE IDEA
In June of 1988, OFM undertook a study of capital planning and budgeting which included the following recommendations: 1) The state should strengthen all phases of its capital process, including planning, programming and monitoring; 2) Agencies should provide OFM and the Legislature with key information on capital project alternatives; and 3) The Department of General Administration, which manages construction projects for many non-university agencies, should identify opportunities for efficiencies and economies of scale in project planning, development, and execution (2).
To achieve these and other economies, OFM developed the requirement for a predesign phase on all major construction projects. (3). OFM developed the BEST process to evaluate predesign study findings.
BEST studies made it possible to develop highly refined programs of requirements prior to the commitment of the larger design and construction budgets. Real needs would be established and properly provided for, while unnecessary costs would be identified and eliminated. It would then be possible to establish appropriate and realistic project design and construction budgets.
The OFM elected not to perform BEST studies itself but to select projects and request funding for qualified value engineering firms to undertake the studies.
The primary responsibility of OFM would be to monitor each project to assure that all worthy BEST team recommendations were implemented in
the budget.
ADVANTAGES OF BEST STUDIES
There are several advantages to including VE in the budget evaluation process. These advantages are:
1. Prevention of project scope creep. BEST review will help insure the inclusion of all needed program elements and thus prevent project scope creep. Scope creep occurs when missing items in a project are discovered late in a project's design development, resulting in costly changes and additions to the project's scope. Performing a BEST study helps to maintain a strict budget to which the project must adhere right from the start. Project budgets based on unrealistic estimates precipitate enormous problems throughout the design and construction process.
2. Modification of space and construction standards. Modifications in facility space requirements and construction materials are the most effective area where capital savings can be found. In some designs, the program allocating space does not meet the project's real needs, or is used inefficiently. By analyzing a project at the predesign stage, the functional requirements of the project can be adjusted without detracting from the essential function.
3. First cost and life-cycle cost savings. The achievement of cost savings has to be emphasized along with the project improvements. Life-cycle costs are addressed during design but usually not stressed, only first costs become important. During predesign, the greatest opportunity exists to change designs which can impact not only the first cost, but more importantly, the life-cycle costs.
The study forces a tighter design. Staffing issues are identified and resolved early. Improvements in safety, security, design, and aesthetics also result.
4. Reduced adversarial relationships. Because the state budget office serves as a monitor of agency operations, there is a natural tension between agencies and OFM. However, the BEST process departs from the adversarial relationship
VALUE WORLD, Volume XVII, Number 2, Moy 1994

3
between OFM and state agencies by allowing them to work as a team to reduce costs and develop project improvements. The work plan to identify unnecessary costs and to improve project function compels in-house and outside experts to look beyond their own sphere and consider the impact of each decision on the total project. Since the goal of a BEST study is not simply to cut costs but to increase value, the study can and will identify necessary aspects of a project which are not being provided for adequately. Often, project improvement results because the elimination of unnecessary costs permits the inclusion of facility enhancements.
The creative team effort of the BEST process i
makes a budget review a more positive and fruitful' exercise rather than a difficult necessity, since both OFM and the state agencies benefit from the study. The VE study permits a budget analyst to join with the agency to maximize state dollars instead of having to work against the agency's understandable concerns with cost cutting.
Like any VE program, top management support is essential to be successful. This support was provided, and allowed the potential benefits to be realized. It was also critical to a successful BEST program to have clear project selection criteria and effective implementation procedures.
PROJECT SELECTION CRITERIA
Pareto's Law (80 percent of the cost normally occurs in 20 percent of the items) would suggest that relatively few projects would comprise the majority of costs. Therefore, it was recommended that efforts be concentrated on these selected larger projects. Cost and project size are generally good indicators of the potential for improved value. The following guidelines for identifying potential projects were established:
1. Projects involving expenditures of at least $5 million, with priority given to projects that are over $10 million.
2. Designs with a high degree of complexity.
3. Projects for which a standard or prototype could be developed (e.g. armory or prison).
In Washington State the capital budget adopted by the legislature usually includes either predesign funds or design/construction funds (projects which have completed predesign). It was recommended that BEST study projects would be selected from those that have completed predesign and met the
guidelines above.
IMPLEMENTATION OF BEST
The BEST process was accepted by OFM management and funds were made available to conduct four studies during the fall of 1992. To implement the program, OFM followed state law and requested qualifications from firms and individuals engaged in providing VE services, established a list of qualified BEST consultants, and negotiated contracts on the four projects selected. The contracting process also followed state law based on the scope of work described in the solicitation for proposals.
The studies would be conducted in Olympia on the capitol campus to allow for observation and monitoring of the process by all interested parties (executive, legislative and agency staff). Each study was scheduled for three, eight-hour, days. Each study followed the standard VE job plan and all teams were multi-disciplined with Certified Value Specialists as team leaders. At the conclusion of each study OFM, the agency, and the design team evaluated the ideas generated by the BEST team. Based on the results of the BEST study, final recommendations relating to the capital budget request for design and construction of each project were when made by OFM staff.
The following projects were selected and BEST studies conducted:
1. Western Washington University Haggard Hall Renovation. Haggard Hall was built in 1960 to house the science departments of chemistry, biology, and science education of what was then a teacher's college located in Bellingham. The building is being vacated with the construction of new science facilities. The 110,000 GSF building can no longer serve the needs of modern science instruction, but it is a sound building and with renovation can serve other needs of the university. One of these needs is for expansion of the library which is located in an adjacent building. In addition, other departments require office and support space on the campus.
The predesign study called for expansion of the library with a connecting passageway from the Wilson Library to Haggard Hall, and provision of stack space on the ground floor. Renovation of the second and third floors would accommodate the Departments of Computer Science and Foreign Languages. Abatement of asbestos within the existing building was required along with replacement of HVAC and electrical systems and meeting all code requirements. The exterior of the
VALUE WORLD, Volume XVII, Numb* 2, May I f f *

4
building would be upgraded by applying a new brick and concrete veneer panel system over the existing concrete structure. The total escalated project budget request equaled $23.1 million (4).
2. Green River Community College Center for Information Technology. The library at this Community College near Auburn is far short of the space required to serve current and projected levels of students. Also, science and skills labs are inadequate and undersized. Computer lab capacity to support academic and vocational instruction is insufficient.
The predesign study called for the construction of a Center for Information Technology and the related remodeling of two existing buildings constructed in the 1960's. The total predesign budget request for this project was $18.3 million. However, the State Board for Community and Technical Colleges, who is responsible for submitting budget requests on behalf of the various colleges in the system requested $14.6 million for this project (5).
3. Central Washington University Dean Science Building. Dean Hall was constructed in 1968 on the Ellensburg campus to serve the departments of Biological Sciences and Chemistry. The facility and its instructional equipment was virtually unchanged over the life of the structure. In 1987, the Science Education program was moved into the building after limited minor remodeling. Additional educational and research space and improved laboratory ventilation system were needed.
Predesign funds were provided to conduct an analysis for remodeling Dean Hall. At the conclusion of the study, it was determined that remodeling and expansion was not a viable option and effort was then concentrated on the planning and programming of a New Science Facility. The final outcome of the predesign study resulted in a budget request for a new science facility of 184,783 GSF at a total project cost of $87 million. Dean Hall was proposed for adaptive reuse as a separate project in the future (6).
4. University of Washington Physics Hall Remodeling. Upon completion of a new Physics/Astronomy building in 1994, the old Physics Hall on the Seattle campus will be available for reassignment. This building is over sixty years old and does not comply with a variety of life-safety, asbestos, ADA and seismic code requirements. The HVAC and electrical distribution systems are inadequate and need replacing. Renovation as a science facility is cost prohibitive.
The University's predesign study called for the complete renovation of the building. This-renovation includes a complete upgrade of all systems, the correction of fire and life safety, disabled code problems, and improvements to enhance seismic resistance. Included in the project is approximately a 20,000 gross square-foot (GSF) addition on the northeast side of the building, above sections of the building originally constructed to accommodate an addition. The project will provide over 170,000 GSF of usable space for University programs. The total budget request equaled $37.6 million (7).
RESULTS OF BEST STUDIES
The budget request for the four projects <that were selected for BEST studies exceeded $161 million. At the completion of the studies, OFM reviewed the reports provided as part of the BEST team contract and discussed the results with the agencies during the month of November. All four projects were included in the Governor's recommended capital budget presented in December, but at a reduced cost. The scope of one of the projects was reduced (Central Washington University) while another was increased (Green River Community College).
At the conclusion of the Legislative session, which also included extensive review of the agency requests and the BEST studies by the legislative staff, the projects were included in the appropriation bill and were funded. Funding was $36.2 million less than the original requests, allowing other projects to be included in the budget.
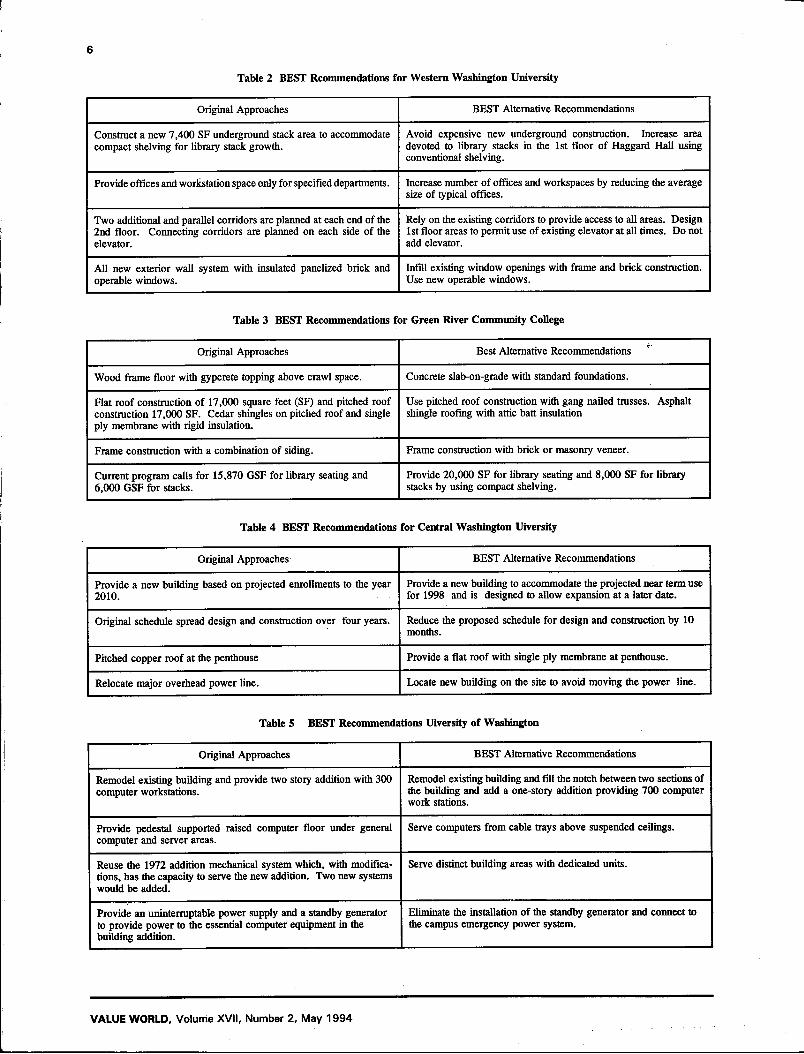
Table 1 displays the return-on-investment (ROI) for each project with respect to the cost of each study. The average ROI equaled $596 for each dollar spent on each study. It should be pointed out that the study cost does not include those costs incurred by the design team or agency personnel who participated in the process. Tables 2 through 5 give some of the ideas generated in BEST studies.
AGENCY REACTION TO BEST STUDIES
Needless to say, any time an agency request is reduced by the executive or legislative branch of state government those involved with the project request are not pleased. As stated previously, one of the advantages of doing a BEST study on requested projects is to reduce the adversarial relationship between the budget office and agencies. Although the BEST process inserts an independent third party into the budgeting process,
VALUE WORLD, Volume XVII, Number 2, May 1994

5
it has not always been met with open arms. Following are some of the comments expressed by the agencies whose projects are discussed in this paper:
1. Only during the VE team introductions on the first day of the study did the agency hear that they were welcome and encouraged to stay and participate in the rest of the study. Clearly, the philosophy of value engineering seems to have been compromised since it is crucial that the owner and the VE team work together to understand all the functional and operational costs.
2. None of the VE ideas were evaluated over a life-cycle format even though all of this information was available within the design document. '
3. The BEST conclusions and program decisions
product." says State Representative Helen Sommers, the Chair of the House Appropriations Committee and Past Chair of the House Capital Budget Committee.
John Fricke, Senior Budget Assistant for Capital and Transportation states, "We consider the BEST process very successful for two reasons. First, conducting these studies has let the design and construction industry know that there may be an independent review of their work product, which serves as an incentive to perform higher quality predesign studies for all state projects. This benefits both the state and the industry. Second, the BEST process is a model that has received overwhelming support from the design industry and most of the participants. It a process that should be instituted by many governments across the nation, and we have been communicating with them to spread the word."
The 1994 Washington State Legislature will be asked to address proposed legislation (ESHB2237)
were often made hastily with minimal data and consultation, pitted the OFM expert against the institution's expert, and often led to OFM prevailing even though the institution's expert may have been equivalent or greater.
4. While the BEST budget reviews produced some beneficial results, they are a duplication of the programming and cost estimating efforts completed during the predesign stage by the University and do not recognize the significant technical expertise at the University.
FUTURE OF BEST
"The BEST process is one step in a series of measures to reform the state's budget system and holds promise for substantially reducing capital budget costs while at the same it produces a better
that will codify the BEST process. This proposed legislation states in part, "The Office of Financial Management shall adopt a procedure for reviewing major construction projects at the predesign stage that will reduce long-term costs and increase facility efficiency. The procedures shall include, but not be limited to, the following elements: An identification of facility program, building quality and standards, and consistency with long-range facility plans; a system of cost standards to compare major capital construction projects; and a construction schedule that includes value engineering analysis and constructability review process."
The BEST process will continue as a tool used by the State Budget Office to evaluate major capital projects. Projects, funded for predesign in the last budget, will be submitted to OFM by July 1,1994 to be considered for inclusion in the next capital budget for design and construction. During August OFM will conduct the second round of BEST studies on eight to ten projects.
Table 1 Summary of BEST Sudy Results
Project Budget Request Approved Budget Study Cost ROI
Western Washington University $23,111,713 $17,312,971 $14,000 414:1
Green River Community College 14,588,000 15,944,725 15,000 90:1
Central Washington University 87,010,732 58,750,000 15,300 1,847:1
University of Washington 36,888,635 33,405,321 16,289 213:1
Totals $161,599,080 $125,413,017 $60,589 —
VALUE WORLD, Volume XVII, Number 2, May 1994
6
Table 2 BEST Rcommendations for Western Washington University
Original Approaches BEST Alternative Recommendations
Construct a new 7,400 SF underground stack area to accommodate compact shelving for library stack growth.
Avoid expensive new underground construction. Increase area devoted to library stacks in the 1st floor of Haggard Hall using conventional shelving.
Provide offices and workstation space only for specified departments. Increase number of offices and workspaces by reducing the average size of typical offices.
Two additional and parallel corridors are planned at each end of the 2nd floor. Connecting corridors are planned on each side of the elevator.
Rely on the existing corridors to provide access to all areas. Design 1st floor areas to permit use of existing elevator at all times. Do not add elevator.
All new exterior wall system with insulated panelized brick and operable windows.
Infill existing window openings with frame and brick construction. Use new operable windows.
Table 3 BEST Recommendations for Green River Community College
Original Approaches Best Alternative Recommendations *"
Wood frame floor with gypcrete topping above crawl space. Concrete slab-on-grade with standard foundations.
Flat roof construction of 17,000 square feet (SF) and pitched roof construction 17,000 SF. Cedar shingles on pitched roof and single ply membrane with rigid insulation.
Use pitched roof construction with gang nailed trusses. Asphalt shingle roofing with attic batt insulation
Frame construction with a combination of siding. Frame construction with brick or masonry veneer.
Current program calls for 15,870 GSF for library seating and 6,000 GSF for stacks.
Provide 20,000 SF for library seating and 8,000 SF for library stacks by using compact shelving.
Table 4 BEST Recommendations for Central Washington Uiversity
Original Approaches BEST Alternative Recommendations
Provide a new building based on projected enrollments to the year 2010.
Provide a new building to accommodate the projected near term use for 1998 and is designed to allow expansion at a later date.
Original schedule spread design and construction over four years. Reduce the proposed schedule for design and construction by 10 months.
Pitched copper roof at the penthouse Provide a flat roof with single ply membrane at penthouse.
Relocate major overhead power line. Locate new building on the site to avoid moving the power line.
Table 5 BEST Recommendations Uiversity of Washington
Original Approaches BEST Alternative Recommendations
Remodel existing building and provide two story addition with 300 computer workstations.
Remodel existing building and fi l l the notch between two sections of the building and add a one-story addition providing 700 computer work stations.
Provide pedestal supported raised computer floor under general computer and server areas.
Serve computers from cable trays above suspended ceilings.
Reuse the 1972 addition mechanical system which, with modifications, has the capacity to serve the new addition. Two new systems would be added.
Serve distinct building areas with dedicated units.
Provide an uninterruptable power supply and a standby generator to provide power to the essential computer equipment in the bunding addition.
Eliminate the installation of the standby generator and connect to the campus emergency power system.
VALUE WORLD, Volume XVII, Number 2, May 1994
7
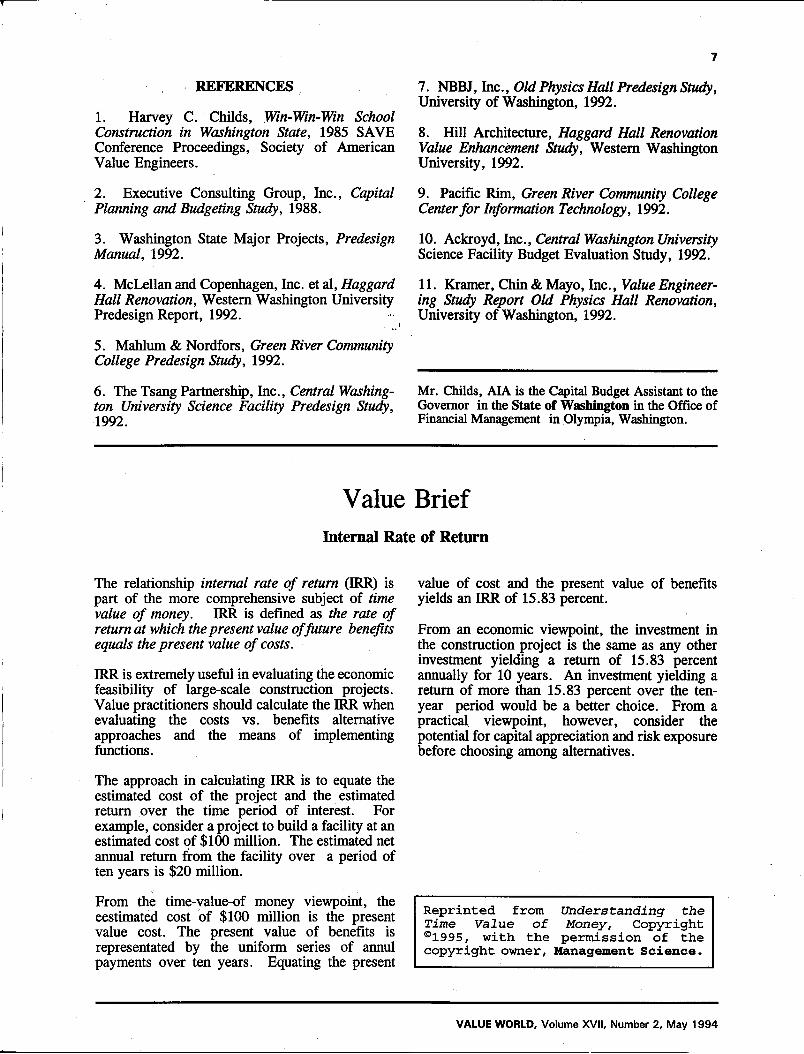
REFERENCES
1. Harvey C. Childs, Win-Win-Win School Construction in Washington State, 1985 SAVE Conference Proceedings, Society of American Value Engineers.
2. Executive Consulting Group, Inc., Capital Planning and Budgeting Study, 1988.
3. Washington State Major Projects, Predesign Manual, 1992.
4. McLellan and Copenhagen, Inc. et al, Haggard Hall Renovation, Western Washington University Predesign Report, 1992.
5. Mahlum & Nordfors, Green River Community College Predesign Study, 1992.
6. The Tsang Partnership, Inc., Central Washington University Science Facility Predesign Study, 1992.
7. NBBJ, Inc., Old Physics Hall Predesign Study, University of Washington, 1992.
8. Hill Architecture, Haggard Hall Renovation Value Enhancement Study, Western Washington University, 1992.
9. Pacific Rim, Green River Community College Center for Information Technology, 1992.
10. Ackroyd, Inc., Central Washington University Science Facility Budget Evaluation Study, 1992.
11. Kramer, Chin & Mayo, Inc., Value Engineering Study Report Old Physics Hall Renovation, University of Washington, 1992.
Mr. Childs, AIA is the Capital Budget Assistant to the Governor in the State of Washington in the Office of Financial Management in Olympia, Washington.
Value Brief Internal Rate of Return
The relationship internal rate of return (IRR) is part of the more comprehensive subject of time value of money. IRR is defined as the rate of return at which the present value of future benefits equals the present value of costs.
IRR is extremely useful in evaluating the economic feasibility of large-scale construction projects. Value practitioners should calculate the IRR when evaluating the costs vs. benefits alternative approaches and the means of implementing functions.
The approach in calculating IRR is to equate the estimated cost of the project and the estimated return over the time period of interest. For example, consider a project to build a facility at an estimated cost of $100 million. The estimated net annual return from the facility over a period of ten years is $20 million.
From the time-value-of money viewpoint, the eestimated cost of $100 million is the present value cost. The present value of benefits is representated by the uniform series of annul payments over ten years. Equating the present
value of cost and the present value of benefits yields an LRR of 15.83 percent.
From an economic viewpoint, the investment in the construction project is the same as any other investment yielding a return of 15.83 percent annually for 10 years. An investment yielding a return of more than 15.83 percent over the ten-year period would be a better choice. From a practical viewpoint, however, consider the potential for capital appreciation and risk exposure before choosing among alternatives.
R e p r i n t e d from Understanding the Time Value of Money, Copyright ®1995, w i t h the p e r m i s s i o n of the cop y r i g h t owner, Management S c i e n c e .
VALUE WORLD, Volume XVII, Number 2, May 1994
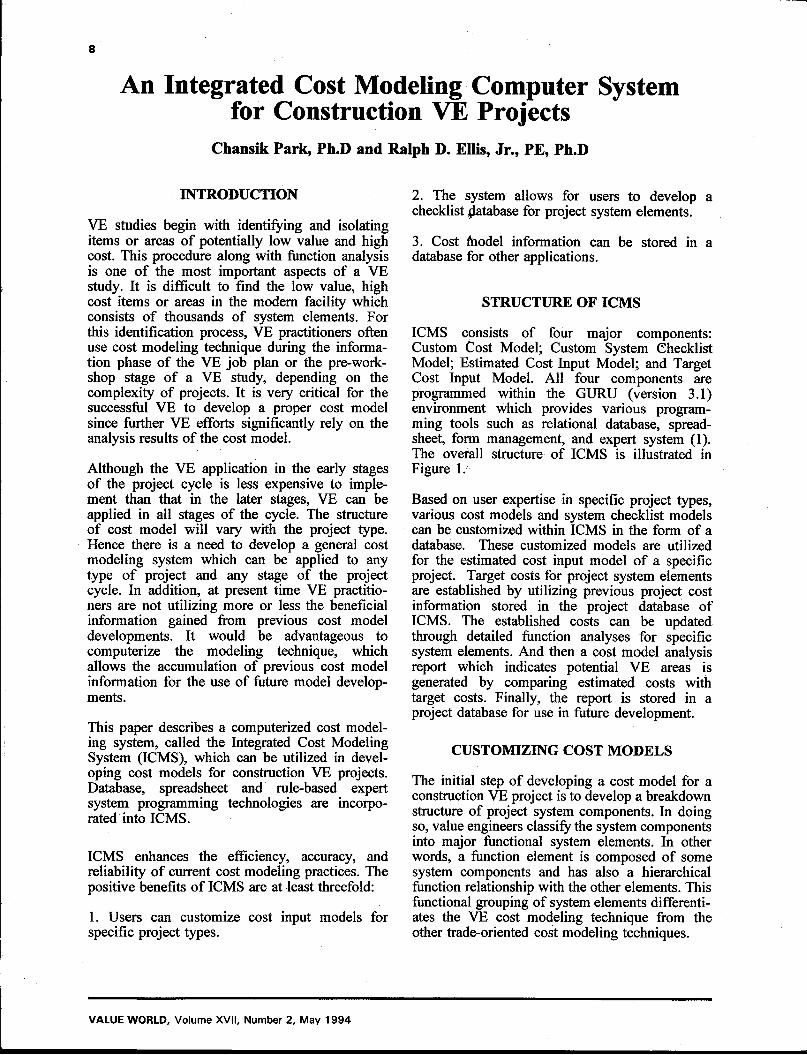
An Integrated Cost Modeling Computer System for Construction VE Projects
Chansik Park, Ph.D and Ralph D. EUis, Jr. , P E , Ph.D
INTRODUCTION
VE studies begin with identifying and isolating items or areas of potentially low value and high cost. This procedure along with function analysis is one of the most important aspects of a VE study. It is difficult to find the low value, high cost items or areas in the modern facility which consists of thousands of system elements. For this identification process, VE practitioners often use cost modeling technique during the information phase of the VE job plan or the pre-workshop stage of a VE study, depending on the complexity of projects. It is very critical for the successful VE to develop a proper cost model since further VE efforts significantly rely on the analysis results of the cost model.
Although the VE application in the early stages of the project cycle is less expensive to implement than that in the later stages, VE can be applied in all stages of the cycle. The structure of cost model will vary with the project type. Hence there is a need to develop a general cost modeling system which can be applied to any type of project and any stage of the project cycle. In addition, at present time VE practitioners are not utilizing more or less the beneficial information gained from previous cost model developments. It would be advantageous to computerize the modeling technique, which allows the accumulation of previous cost model information for the use of future model developments.
This paper describes a computerized cost modeling system, called the Integrated Cost Modeling System (ICMS), which can be utilized in developing cost models for construction VE projects. Database, spreadsheet and rule-based expert system programming technologies are incorporated into ICMS.
ICMS enhances the efficiency, accuracy, and reliability of current cost modeling practices. The positive benefits of ICMS are at least threefold:
1. Users can customize cost input models for specific project types.
2. The system allows for users to develop a checklist database for project system elements.
3. Cost model information can be stored in a database for other applications.
STRUCTURE OF ICMS
ICMS consists of four major components: Custom Cost Model; Custom System Checklist Model; Estimated Cost Input Model; and Target Cost Input Model. All four components are programmed within the GURU (version 3.1) environment which provides various programming tools such as relational database, spreadsheet, form management, and expert system (1). The overall structure of ICMS is illustrated in Figure 1.
Based on user expertise in specific project types, various cost models and system checklist models can be customized within ICMS in the form of a database. These customized models are utilized for the estimated cost input model of a specific project. Target costs for project system elements are established by utilizing previous project cost information stored in the project database of ICMS. The established costs can be updated through detailed function analyses for specific system elements. And then a cost model analysis report which indicates potential VE areas is generated by comparing estimated costs with target costs. Finally, the report is stored in a project database for use in future development.
CUSTOMIZING COST MODELS
The initial step of developing a cost model for a construction VE project is to develop a breakdown structure of project system components. In doing so, value engineers classify the system components into major functional system elements. In other words, a function element is composed of some system components and has also a hierarchical function relationship with the other elements. This functional grouping of system elements differentiates the VE cost modeling technique from the other trade-oriented cost modeling techniques.
VALUE WORLD, Volume XVII, Number 2, May 1994

9
USER EXPERTISE PROJECT COST INFORMATION
CUSTOM COST MODEL
CUSTOM SYSTEM CHECKLIST
ESTIMATED COST INPUT MODEL
TARGET COST INPUT MODEL
PREVIOUS PROJECT COST INFORMATION
PROJECT DATABASE
Figure 1 Overall structure of ICMS.
It is obvious in construction that the structure of cost model varies with project types: the function elements of building projects are different from those of other construction projects such as bridge, highway, and dam. The VE expertise on specific projects would have a great impact on the cost model development. This expertise can be stored and customized in ICMS.
It should also be noted that general-elemental cost formats for facility design and construction have been developed by several government construction agencies such as the General Services Administration (GSA), GSA's Public Building Services, and the Environmental Protection Agency in conjunction with the American Institute of Architects and the Construction Specification Institute. (2, 3). These cost formats could be used in customizing cost models.
The customized cost model is built in the form of a database. Commonly, a database consists of records which contain various sources of data. The data sources are stored in various data fields of each record. ICMS uses a predefined database which provides the user with all necessary data fields in customizing the cost model.
The data fields are the following: system code, system name, unit, and unit measure. The system code field is used to represent a hierarchy of system elements. ICMS allows the user to break a functional element down to as many as four hierarchical levels. Therefore, the cost of a
functional element at some higher level represents the summation of functional element costs at the next lower level and below. The form of the custom system input model filled with a sample system element is illustrated in Figure 2.
CUSTOMIZING SYSTEM CHECKLIST MODEL
The checklist model database for functional elements at the lowest level can also be customized. This checklist model has been designed to store listings of components or items to be included and to be excluded in the classified functional elements.
This checklist not only serves as a reference for function grouping of project system components but also ensures the reliability and accuracy of cost estimates for function elements. A sample checklist is shown in Figure 3.
The fields of system code and system name are automatically imported from the customized cost model. Users provide necessary component data to the fields "WHAT TO INCLUDE" and "WHAT TO EXCLUDE" in the figure.
Component data can be obtained from cost data sources such as R. S. Means, Inc. and GSA's UNIFORMAT H (2, 4).
VALUE WORLD, Volume XVII, Number 2, May 1994

10
Record Number: 1 ~->next "<-prlor Enter-edit Esc-quit
[ CUSTOMIZE COST INPUT MODEL]
System Code 101 k
System name I FOUNDATION k
Unit I GSF b
Unit Measure I Gross Area k
Do you want DELETE (Type TRUE): I FALSE!
Figure 2 Custom system input model.
Record Number: 1 "->next "<-prior Enter-edit Esc-quit
(CUSTOMIZE SYSTEM CHECKLIST)
System Code |0^1
System name 1 EXTERIOR WALLS k
WHAT TO INCLUDE WHAT TO EXCLUDE
.facing materials .applied finishes to interior faces
.exterior applied finishes of exterior walls
.framing, wallboard, parapets .columns and beams in ext. walls
.exterior load-bearing wall .Venetian blinds
.exterior louvers & screens .other int. sun control devices
.exterior sun control devices .roof eaves and eaves soffits
.balcony walls & railings .glazed curtain walls
.exterior soffits
Do you want DELETE (Type TRUE): IFALS&
Figure 3 System checklist data base sample record.
VALUE WORLD, Volume XVII, Number 2, May 1994
11
ESTIMATED COST INPUT MODEL
The estimated cost input model is designed for the user to input estimated costs of function elements based from the VE studies.
This model is an extended database of the customized cost model, which allows the user to input quantity and cost of each system element. The user can choose a proper cost input base, either unit or total cost and needs only to input system costs in the lowest level. The system costs in the higher level are automatically calculated by ICMS.
The customized system elements are transferred from the customized model database. During this input process, the system elements can be added, edited, and deleted. The system checklist data can also be reviewed by using a query function programmed in this model. The accuracy and reliability of the cost estimates could be enhanced by interacting with the system checklist model. In addition, the time in developing the cost model would be significantly reduced by utilizing the customized cost model.
TARGET COST INPUT MODEL
The next step of cost modeling is to establish target costs for system elements. The term target cost can be defined as a minimum cost required to fulfill basic functions of a specific system element. In construction VE studies, target costs would be determined either before or after detailed function analyses for system elements. These costs are often determined by the VE team's experience with similar projects, or cost information from previous similar projects. Then, target costs are compared with estimated actual system costs. The areas or elements showing the biggest differences are isolated for further VE study.
In ICMS, target costs are determined by utilizing the system cost information from previous VE projects stored in the project database. The previous project system costs are queried and adjusted by time, location, and size by utilizing a rule-based expert system. Two pre-defined cost index databases have been designed for the time and location adjustments. ICMS allows the user to update the time index database and customize the location index database for its use of specific locations. Construction cost indexes such as those of R.S. Means Company Inc. and Richardson Engineering Services could be used as base indexes for these databases.
For the system testing purposes, sample databases have been created on the basis of the R. S. Means, Inc. historical cost indexes and city cost indexes. The form of the target cost input model filled with a sample system element cost data and its target cost determination procedure are illustrated in Figures 4 and 5.
The expert system employed in this model is a program which contains the knowledge about how to query and obtain necessary cost and index information from the project database and the index database. Target costs determined by this program are only approximate estimates before the detailed function analyses. They must be updated after the function analyses for the use of future
1 model developments.
Figure 6 illustrates a dependency diagram of the relationships among variables in the expert system. The top two boxes in the figure indicate data sources obtained from the user input and the cost and index databases. Arrows between variables represent the hierarchical dependency of variables used for rules of the expert system.
The equation used for the cost adjustments is shown in the bottom box of the figure. Appropriate city indexes for functional elements involving several CSI divisions are calculated by averaging the related division indexes.
Figure 7 illustrates the summary report of the project cost model which ICMS generates through a series of data conversion processes. The particular project shown is a healthcare facility.
The top half of Figure 7 shows the cost distribution of the functional elements.of the systems which are being studied. The bottom portion of the the illustration shows the cost distibutions and ratios of estimated cost to target cost of the functional elements.
CONCLUSION
A prototype system of ICMS has been successfully developed in Version 3.1 of the GURU environment. Key characteristics of ICMS are its customized cost model feature, and the accumulation and utilization of cost data. All component parts of the system have user-friendly menu-driven subsystems. A function analysis system, currently being developed, will be incorporated into the prototype system for the continuous update of target cost data. This enhancement will make ICMS a total cost modeling system.
VALUE WORLD, Volume XVII, Number 2, May 1994

12
[ TARGET COST INPUT MODEL
System Code 101 •
System name I FOUNDATION
System Cost I $465,888,001
Uni t IGSF h
Uni t Measure 1 Gross Area •
Quan t i t y 1 17,391.001
|Un i t C o s t | 1 $26,791
Target Uni t Cost | $ 2 1 . 0 0 |
I ENTER I S tar t Input lESCl Query(Y) or Quit(N)
Figure 4 Target cost input model.
PROJECT DATABASE
QUERY PREVIOUS
SYSTEM COSTS
COST INDEX DATABASE
RULE-BASED EXPERT SYSTEM
TIME & LOCATION ADJUSTMENT
I DETERMINE TARGET COST
TARGET COST INPUT MODEL
Figure 5 Target cost determination procedures.
VALUE WORLD, Volume XVII, Number 2, May 1994

13
SJfQSlMlnte r_H*TkMlndM DJN&.Ut.Mmc I^MCtLoeuknlntet S_COCeSytfMiCoda ID:PNjMIO CWCSOMrtMi RPNVMM C.Cui«lt
ADJUSTED TARGET COST =:
(S_COST) • (C_CfTY/P_QTY) * (C_YlNrW,YIND) • (CJ.IND/PJJND)
Figure 6 Expert system dependency diagram.
H i ttfCOQI Dat.f 11/19/1993
M W I MALT) CHS MCI LIFT Location ea inc fv i lU , FloNdt
w . DOSMUL
s m w n OF FRojstr STTTTEK cwr n s n a u m w
COM 3Y3TN WW UK IT aiMrTirr w n nor «8 N K H H I I C U C£F 1 U . 7 9 W tacrmuu. o r m,ntM «».« 02 8UB8TRUCTUM eti J70 ,OEO.C« *i».s« 10 imwt comnion,
o r ,370 ,0I0 .» (15.41 11 fOWPNBIT e s ,371,010.01 «>.» OS DJTHICK oaemucnoBii ,in>,oio.w n s . i s ca SUFfltSTMJGTUM 19 ,370,090.00 » 1 . » 12 I I I B K W C O F ,970,(40.10 W . M OS u o n m o r ,37»,MM0 » . M K Baffin* aasutcs CtF ,37i ,Hi . ia i s . a 01 F0MMTHM (SF ,J7I,WI.I<1 (2.W or CDNEnBS SVSTB1 « r ,171,101.10 to. 73
T O U L I 1 7 J . »
m m con TM-uwr o n m - m m tan c/v » » n o > ie .os t ,m.u 138.00 <U,0<0 l0W.0p I J UD,MS>,I0I.M •20.00 13 17,M«,W9.00 MS.DO I J « s , ru i ,«n . t» *1S.W »5.IJ0,0»0.0» 1.0 H,w7,oeo.ot S B . 0 0 K,B1D,O»0,O» 1.0 B , «1 , 0«0 .0» »O.00 u.eiOjOn.oi 1.0 X.Stt.OW.Ot M0 .CO <3,700,0W.M 1.2 >i,7M,0W.M BM « , n o , o o o . K ) 1.1 S Z . O H . M O . O I 15.00 5I.K0.C00.M 1.1 tl.WfcOH.Ot 8.00 •I.BO.Dof.Ce 1.1
m s . O K . o i U J ] >9U.tM.I0 1.1 $270,0*3. M to .n BB9,D0t.l0 1.0
H3,7 » , o o o . e o t w . e « 3 , » 1 , 1 M . « 0 *13D
swraot GrM KMT ID •"TBI COST •WTPtSMTIQrl
_HMIT cow-uagw
Figure 7 Sample summary report.
VALUE WORLD, Volume XVH, Number 2, May 1994

14
REFERENCES
1. GURU, Version 3.1, Micro Database Systems, Inc. Lafayette, IN, 1992.
2. Brian Bowen, Robert P. Charette, and Harold H. Marshall, UNIFORMAT II: A Recommended Classification for Building Elements and Related Sitework, National Institute of Standards and Technology, Special Publication 841, Gaitherburg, MD, August 1993.
3. Value Engineering for Wastewater Treatment Works, Office of Water Program Operations, United States Environmental Protection Agency, September 1984.
4. The Means Assemblies Cost Data, R.S. Means Company, Inc., Kingston, MA, 1992.
Dr. Park is a Certified Architectural Engineer in Korea.
Dr. Ellis is a Professor in the Civil Engineering Department of the University of Florida in Gainesville, Florida.
Value Brief International Quality Standards
More and more companies are entering the global market place i f only to ensure their survival. Many value practitioners already have international clients. Those who are doing business or contemplate doing business overseas should become familiar with the international quality management standards which are promulgated by the International Organization for Standardization (ISO).
These are the ISO 9000 series of FIVE standards. In the United States, they are equivalent to the Q 90 series promulgated by the American National Standards Institute (ANSI) and the American Society for Quality Control (ASQC).
Standard ISO 9000, Quality Management and Quality, is equivalent to ANSI/ASQC Q 90. This is the top-level standard and contains overall policy statements, definition of terms, and requirements for certification of organizations in accordance with the pertinent standard in the series. ISO 9000 also provides guidelines for determining which subordilate standard governs the industries of interest.
Standard ISO 9001, Quality Systems-Model for Quality Assurance in Designed Development, Production, Installation, and Servicing, is equivalent to ANSI/AMQC Q 91. It is the most comprehensive of all the standard in the series and applies to equipment manufacturers of their own design.
Standard ISO 9002, Quality Systems-Model for Quality Assurance in Production and Installation, is equivalent to ANSI/AMQC Q 92. It applies to equipment manufacturers of designs by others.
Standard ISO 9003, Quality System-Model, for Quality in Final Inspection and Test, is equivalent to ANSI/AMQC Q 93.. As the name indicates, it applies to the requirements and procedures for final inspection and test.
Standard ISO 9004, Quality Management and Quality System Elements-Guidelines, is equivalent to ANSI/AMQC Q 90. It applies to the overall quality organization of companies and delineates management responsibilities for quality assurance.
The standards are available from the American National Standards Institute, 1430 Broadway, New York, NY 10018 and the American Society for Quality Control, 310 Wisconsin Avenue, Milwaukee, WI 53203.
VALUE WORLD, Volume XVII, Number 2, May 1994

15
VEST: A Graded Approach to VE Roger B. Sperling, CVS
INTRODUCTION
VE at Scope Time (VEST) is the early application of value techniques used to clarify construction project scopes of work. It focuses on function analysis and creative brainstorming, leaving development of VE proposals to the design team. VEST is a good way to apply VE to smaller construction projects; larger projects still require full formal VE studies. This article shows how VEST can be used as a graded approach to VE to help improve facilities projects no matter what their size (1, 2).
VEST MATRIX
I f only one form of VEST were offered it would not be used in many cases; when flexibly applied VEST finds more uses. Often, project managers will use VEST to try VE for the first time.
The VEST Matrix in Table 1 provides a "shopping list" of options for three different scales of VEST:
•VEST A (1 to 2 hours): Single issue meetings.
•VEST B (2 to 4 hours): Project kickoff meetings.
•VEST C (8 to 16 hours): Scope and criteria development.
VEST applies value technology to plant facilities construction projects by convening meetings of project teams and other interested organizations to ask, in effect, "Why are we doing this project?" Each project and its manager have different needs.
The activities in the matrix, which all occur in a formal VE study, are based on the VE job plan. The comments communicate the intrinsic value of each activity to potential clients. Included activities are coded "X"; optional ones are "O."
Table 1 VEST Matrix
Activity VEST
A VEST
B VEST
c Comments
1-2 HR 2-4 HR 8-16 HR
Protect Information X X X Reviews scope and criteria ol Base Desiojn
Site Visit 0 X Included whenever possible
Cost/Worth Analysis X Focuses on costs of Base Design
Function Analysis X X X The key element
Creative Bralnstormlno X X X Idea generation
Idea Evaluation 0 X X Ranks ideas the primary resul
Advantaaes/Dteadvantaoes 0 0 X Documentina the details
Proposal Development 0 0 Included when time available
Final Presentation 0 Included when requested by client
Report Preparation X X Bound report documents complete study
Idea/Proposal Implementation X X X Done by PM, PE/A, design team. cBent/user
Xlnokided ForSlngle-lsHwrrMetbiguMA P*l = Project Manager O Optional For ScopWOIUrU o»v»lopm»nt ua* B or C PE/A * Protect Enslneer/Arefikect — Excluded For Pro|«ct Klckotf rrmUngi U M A or B
VALUE WORLD, Volume XVII, Number 2, May 1994
16
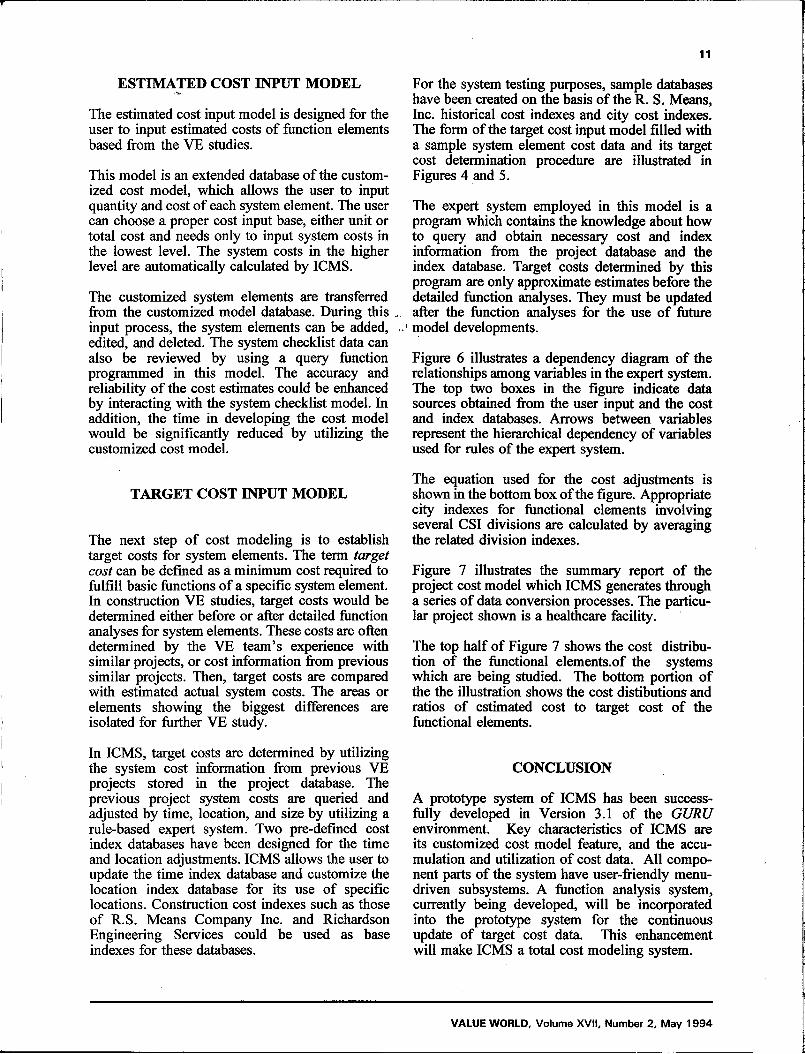
All VEST studies include the project information, function analysis and creative brainstorming phases of the job plan. As projects become larger and the VEST time increases more activities are added. VEST A utilizes only four activities; VEST B and VEST C use six and ten activities respectively. The main message of the matrix is that VEST can be tailored to any size project and any project issue.
EXAMPLES
CONCLUSION
VEST is not a full, formal VE study; but it does utilize the core of the VE job plan and applies function analysis to each project. By offering a matrix of VEST options VE, can be applied to small projects and others that otherwise might not receive the benefits of VE.
REFERENCES AND FOOTNOTES
Four brief examples of using VEST on smaller projects ($650,000 average estimated construction cost) demonstrate the benefits of doing VE early in the life of projects :
Uninteruptable Power Supply Buildings: Eight-hour VEST generated 67 ideas and found two new design approaches including using existing space and not constructing a new facility.
• Control Post: Twelve-hour VEST generated 129 ideas and identified 22 percent potential savings for new security facility.
Waste System: Eight-hour VEST generated 55 ideas and developed two design options involving segregating waste to reduce the need for secondary containment.
• Office Upgrade: Three-hour VEST generated 51 ideas and reduced project costs 24 percent by simplifying design of tenant improvements. The emphasis in VEST is idea generation and evaluation to sharpen the project scope. The return on investment is not based on dollars saved but functions improved.
1. Sperling, R., Value Engineering at Scope Time (VEST), Value World, January/February/March 1991, pp. 12f.
2. Sperling, R., VE at Scope Time (VEST); Three Construction Examples, Presented at the Society of American Value Engineers International Conference, Kansas City, MO, May 1991.
Mr. Sperling is SAVE National Director for Annual Conference Technical Programs and with Lewis & Zimmerman Associates, Inc. in Walnut Creek, California.
Value Brief General Services Administration
As the property manager and purchasing agent of the government of the United States, the General Services Adminsitration (GSA) sponsors manyVE studies. On March 28, 1994, the GSA published a solicitation for VE studies and related services with a dollar value of $3,750,00.
GSA is divided into four services in eleven regional areas. The four services are: Public
Buildings Service; Federal Supply Service; Information Resources Managment; and Federal Property Resouces Service. Among the major functions of the GSA are: the distribution of supplies, services, and personal property to federal agencies; the management of transportation and travel; the operation of Federal Information Centers; and the construction and operation of federal buildings.
VALUE WORLD, Volume XVII, Number 2, May 1994

17
Initiating V E Early in Life Cycle of Products Joseph J . O'Rourke, P E , CVS and Glenwood L . Garvey, AIA
INTRODUCTION SCR Approach
This paper recognizes the advantages of initiating VE in the conceptual phase of a project. In this Depreciation $4.66 case, it started with the recognition of a need. Supplies/Utilities 0.50 There is no facility more familiar to mankind than Labor: 15 min/day 3.13 the public restroom. It is a fact that few are maintained to any acceptable standard of Total $8.29 cleanliness and sanitation. Initially, the project was conceived to be marketed to major oil Conventional Approach companies to upgrade the tens of thousands of. unsanitary and unsightly service station facilities. ..' Supplies/Utilities $0.91
Labor: 45 min/ day 9.39 APPROACH
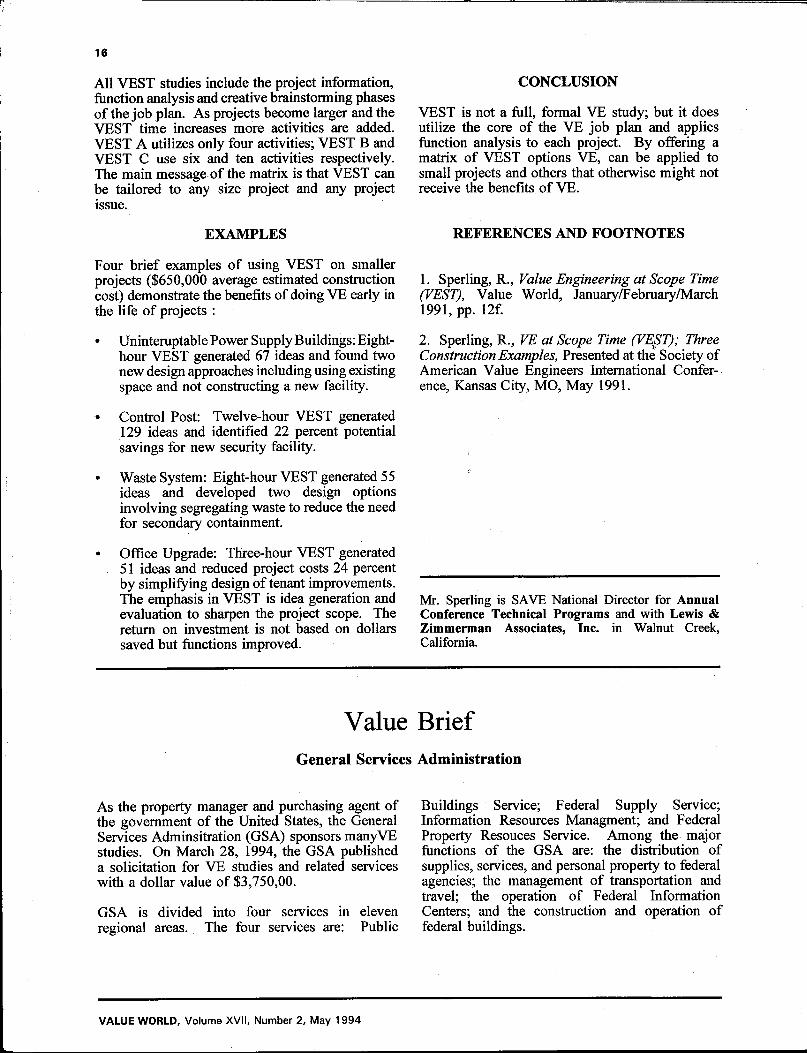
We decided early that a VE study of the functions and costs involved in cleaning restrooms conventionally and the self-cleaning restroom (SCR) reliably clean would allow the design of the SCR to be evaluated on an iterative and progressive basis. The initial highlights and differences derived from the initial detailed value analyses between a conventional installation and the self-cleaning conceptual approach are depicted on Figure 1.
The initial FAST diagram for the self-cleaning restroom is shown in Figure 2. For the costs per function, each functions was estimated on procurement of single components. Although a higher installation cost for the self-cleaning concept was indicated, allowances that could be made later were identified for manufacturing and the economy of scale from production purchases.
We determined that the "make or buy" decisions process for assemblies and subsystems could also be made after the manufacturing design and specifications were completed with the lessons learned from fabrication of the demonstration model.
When the prototype model and patenting were completed, brochures and a video were produced to introduce the product and establish its marketability. At this point, the inaugural value analysis for the SCR was expanded to consider all aspects of conventional versus self-cleaning restroom life cycle costs.
The investigation of preliminary and installation costs, yielded the following expense daily information.
Total $10.30
The daily net saving for self-cleaning with depreciation is $2.01 and without depreciation $6.67. The extended savings for one year {i.e., 365 days) equate to $734 with depreciation; $2,435 without depreciation. Cumulatively, over a 10 year usage, the investment return to purchasers should range from about 14 percent the first year to about 145 percent at the end of the 10th year. Refinements of the manufacturing process, components, and materials are expected to significantly reduce the cost of SCR units as production orders increase.
To define SCR fully in the context of a commercial enterprise, the following requirements and constraints were included in the analysis of the undertaking:
1. Regulatory requirements associated with provisions for the accessibility and safety of handicapped, and environmental protection.
2.. National plumbing and electrical standards that apply to all aspects of the design.
3. Financing to bring the project to a state that would interest investors, part manufacturers and vendors, and potential buyers for the ultimate product.
A significant amount of personal investment has been made in terms of time and outlay for research to gain the technology upon which the patents are based. Additional expenditures were made for hardware and components which had to be adapted
VALUE WORLD, Volume XVII, Number 2, May 1994
18
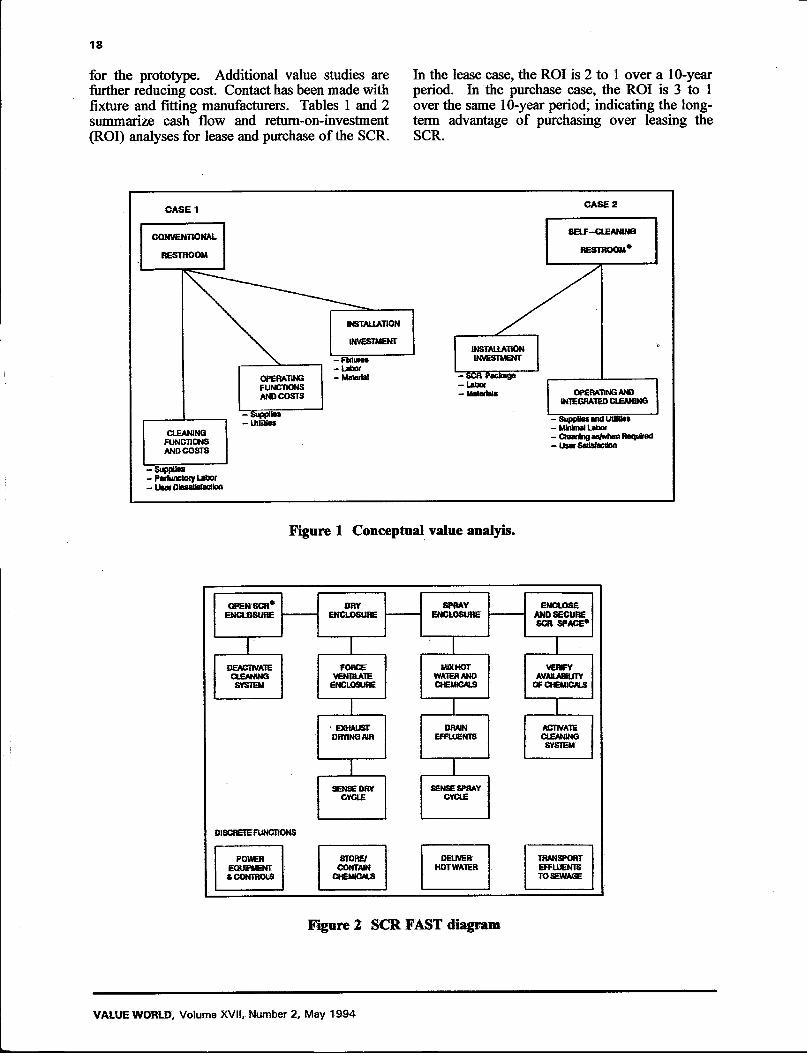
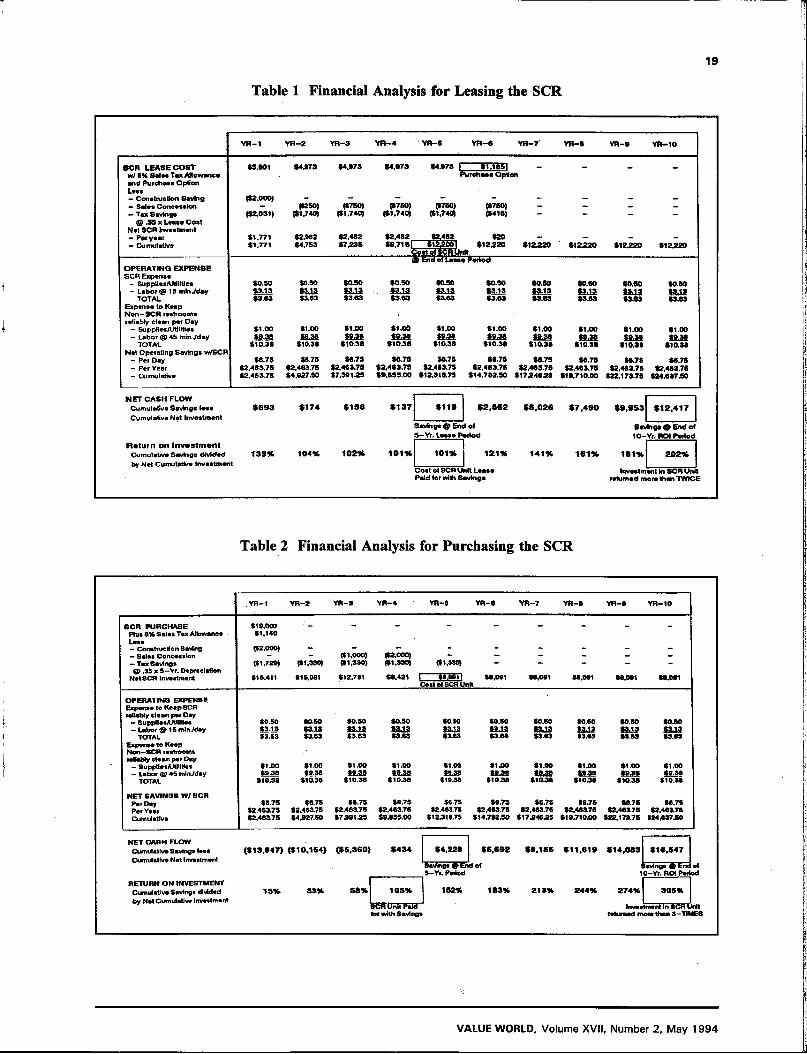
for the prototype. Additional value studies are further reducing cost. Contact has been made with fixture and fitting manufacturers. Tables 1 and 2 summarize cash flow and return-on-investment (ROI) analyses for lease and purchase of the SCR.
In the lease case, the ROI is 2 to 1 over a 10-year period. In the purchase case, the ROI is 3 to 1 over the same 10-year period; indicating the long-term advantage of purchasing over leasing the SCR.
CASE 1 CASE 2
CONVENTIONAL
RESTROOM
SELF-CLEANING
RESTROOM*
CLEANING FUNCTIONS AND COSTS
-Supplies - militias
OPERATING AND INTEGRATED CLEANING
. Supplies and UtWks
- Claaning as>*hen RaqufeBd . User Satisfaction
- Supplies - Perfunctory Labor - U s « Dissatisfaction
Figure 1 Conceptual value analyis.
OPEN SCR ENCLOSURE
DRY ENCLOSURE
DEACTIVATE CLEANING SYSTEM
DISCRETE FUNCTIONS
POWER EQUIPMENT a> CONTROLS
SPRAY ENCLOSURE
FORCE VENTILATE
ENCLOSURE
' EXHAUST DRYING AIR
SENSE DRY CYCLE
STORE/ CONTAIN
CHEMICALS
MIX HOT WATER AND CHEMICALS
DRAIN EFFLUENTS
SENSE SPRAY CYCLE
DELIVER HOT WATER
ENCLOSE AND SECURE SCR SPACE*
VERFY AVAILABILITY
OF CHEMICALS
ACTIVATE CLEANING
SYSTEM
TRANSPORT EFFLUENTS TO SEWAGE
Figure ! SCR FAST diagram
VALUE WORLD, Volume XVtl, Number 2, May 1994
19
Table 1 Financial Analysis for Leasing the SCR
Y R - i Y f t - 2 VR-3 Y R - 4 YR-5 YFt-6 YR -7 VR-B YR-9 YR-10
S C R L E A S E C O S T S5.801 $4,973 $4,973 S4.S73 $4,973 1 $1.1851 _ w/ 6% Sales Tex Allowance Purchase Optc m and Purchase Option Less - Construction Savfrig ($2,000) — — - — - - — -- —
- Sales Concession — ($150) ($750) ($750) ($750) ($750) — — — —
— Tax Savings ($2,031) #1.740) ($1,740) ($1,740) ($1,740) ($415) - - - —
® .35 x Lease Cost Net SCR kwestment - Peryear $1,771 $2,962 $2,482 $2,482 $2,482 $20 — — - —
— Cumulative $1,771 (4.753 $ 7 2 3 5 $12220 $12220 $12220 $12220
9 End of Lease Period OPERATING EXPENSE SCR Expense
- Supplies/Utilities $0.50 $0.50 $0.50 $0.50 $0.50 $0.50 $0.50 $0.50 $ 0 4 0 $0.50 - Labor® 15 mbiVday $3.13 $3.13 $313 $3.13 $3.13 $3.13 $3.13 $3.13 $3.13 $3.13
TOTAL $ 3 8 3 $3.63 $3.63 $3.83 $3.63 $3.83 $3.83 $3.63 $3.63 $3.83 Expense to Keep Non-SCR rettrooms relisbty clean per Day
— Supplies/Utilities $1.00 $1.00 $1.00 $1,00 $1.00 $1.00 $1.00 $1.00 $1.00 $1.00 - Labor <SJ 45 min ./day 1228 $9.38 $9.36 $9.36 39.36 89.38 $9 36 S&2B $9.38
TOTAL $10.36 $10.3» $10.38 $10.36 $10.38 $10.38 $10.38 $10.38 $10.36 $10.38 Net Operating Savings w/SCR
- Per Day $6.78 $6.75 $8.75 $8.75 $6.75 $8.75 $8.75 $8.78 $8.75 $6.75 - Per Year $2,463.75 $2,463.75 $2,463.75 $2,483.75 $2,463.75 $2,463.75 $2,483.75 $2,483.75 $2,483.75 $2,463.76 — Cumulative $2,463.75 $4,827.50 $7.30125 $9,635.00 $12,318.75 $14,782.50 $1724828 $18,710.00 $22,173.75 $24,637.50
N E T CASH FLOW Cumulative Savings less $ 6 9 3 $ 1 7 4 $ 1 5 6 S I 3 7 $119 S 2 . 6 6 2 $ 5 , 0 2 6 S 7 . 4 9 0 $9,953 $ 1 2 , 4 1 7 Cumulative Net Investment
Savfcigt ® End of Savings 89 E n d el S-Yr. Usee Period 1 0 - Yr. ROI Period
Return o n I n v e s t m e n t CumulaUva Savings divided 1 3 9 % 104% 1 0 2 % 1 0 1 % 1 0 1 % 1 2 1 % 1 4 1 % 1 6 1 % 1 8 1 % 2 0 2 % by Net CumulaUva Investment
Cost of SCR UnK Lease Investment in SCR Unit Paid for with Savinga returned m ore than TWICE
Table 2 Financial Analysis for Purchasing the SCR
YR-1 YR-2 Y R - I YB -4 YR-S YR-e YR-7 YR-S YR-9 YR-10
SCR PURCHASE S19.000 -' _ - _ _ _ _ _ _ Plus 6% Salt* Tax Altowanca $1,140
L n t — Construction Saving
(12.000) _ - _ - - - - _ _ — Sale* Concession — - ($1,000) ($2,000) — — — •• — —
— Tax Saving* ($1,729) (81.330) ($1,330) ($1,330) ($1330) — — — - -«3> .35 x 5-Yr. DepreelstJon $»Aeil Net SCR Investment $18,411 $15,061 $12,751 $9,421 1 $»Aeil $8,081 s»,o»i 88,091 86.091 $8,091
Cost ot SCR Unit
OPERATING EXPENSE Expense to Keep SCR reliably dean par Day
- SuppiiesAAUitMs $0.5O 80.50 $0.50 $0.50 $0.60 $0.50 $0.60 $030 $0.50 $0.60 - Labor ® 15 mlnVday 1313 83.13 $3.13 $3.13 $3.13 S3.13 $3.13 $3.13 $3.13 83.13
TOTAL $3.63 $3.63 $3.63 $3.63 83.83 $3.63 $3.63 $3.63 $3.63 $3.63 Expense to Keep Non-SCR restroom* reliabiy dean per Day
- SupptlesAJUIrttts $1.00 $1.00 $1.00 $1.00 $1.00 81J00
$1.00 $1.00 $1.00 $1.00 - Labor ® 45 minYday $9.38 89.36 $9.38 8938 89.38 8938 8938 $9.38 S&2S 89.38
TOTAL $10.38 $10.36 $10.38 $10.38 $10.36 $1038 $1038 $1036 $1038 $10.36
NET SAVINQS W/ SCR Per Day $6.75 $6.76 $6.75 $6.75 $6 75 $6.75 $6.75 $6.75 $875 $6.75 Per Yeer $2,463.75 $2,463.75 $2,463.73 $2,463.75 S2.463.7S $2,463.75 $2,483.75 $2.45375 $2,463.78 $2,463.76 Cumuiativs $2,48375 $4,917.50 $738125 $9,655.00 $12319.75 $14.76250 $1724625 $19,710.00 $22,173.75 $24,637.50
NET CASH FLOW Cumulative Savings less ( $ 1 3 , 9 4 7 ) ( $ 1 0 , 1 5 4 ) ( $ 5 , 3 6 0 ) $ 4 3 4 $ 4 , 2 2 8 $ 6 , 6 9 2 $ 9 , 1 5 5 $ 1 1 , 6 1 9 $ 1 4 , 0 8 3 $ 1 6 , 5 4 7 Cumuiltrve Net Investment
ef Cumuiltrve Net Investment
Savings g> End of Sevtnge • End ef S-Yr. Period 10-Yr. ROI Pelted
RETURN ON rNVESTMENT Cumulative Savings dIvWed 1 5 % 3 3 % 5 8 % 1 0 5 % 152% 1 8 3 % 2 1 3 % 2 4 4 % 2 7 4 % 3 0 5 % by Net Cumulative Investmant by Net Cumulative Investmant
SCR Unit PaM Investment In S C R Unit tor with Savings returned m ore then 3—TIMES
VALUE WORLD, Volume XVII, Number 2, May 1994

20
The SCR was introduced to major companies as well as to investors and material and equipment suppliers. Following the funds received from private offering, marketing the product proceeded on a national scale with a view to international expansion. On the premise that service stations have the most obvious and immediate need for the SCR, the first sales were made to AMOCO for installation in its newest service station design.
The stations with SCR have received wide media coverage, arousing a wide range of interest in potential commercial patronage by other organizations. The media showed a restroom that features wall panels that rotate in order to create a smaller enclosure. A spray of water and specially formulated detergent is applied under pressure to the wall panels and fixtures. Rinse and dry cycles follow, similar to that of a dishwasher. From the standpoint of safety, an attendant, with a special key starts the cycles so that there is no chance, nor space, for an occupant to be exposed to the 'process.
In less than 25-minutes, the rotatable wall panels are swung back into place to reveal a glistening and completely cleaned facility with most types of graffiti removed. Service station patrons were favorably impressed and the most frequently question was "When can I get an SCR for my home?"
Following the sale to AMOCO, it was time to update the value studies to reflect potential for savings in material, component and fixture procurement and to develop the plan for production of multiple restroom units.
The VE objective at this point is to achieve economies for the larger units and increased production rates associated with projected sales. The VE^study took into consideration projected sales volume and the requirements for restrooms with more than one accommodation.
CONCLUSION
Clearly, there is a lesson to be learned from the SCR story. Value engineering and analyses have a concwrent life cycle that begins with the concept, follows it through research, development, design, manufacture, ultimate installation in the field, and then allows for feed back to improve a product and its costs.
Mr. O'Rourke is President of O'Rigineering, Inc. in Granada Hills, California.
Mr. Garvey is President of Glenwood L Garvey & Associates aid Self-Cleaning Environments in Santa Monica, California
Value Briei; Converting the Industrial-Military Complex
Conversion of the industrial-military complex to civilian purposes is an ongoing issue in the Congress and state legislatures, partly because of the end of the cold war and partly because of the current budget deficit. The problem is compounded by the past approach to funding military R&D and production.
During the cold war, the Pentagon sought congressional support by spreading contracts out to as many congressional districts as possible. Many members of the Congress looked to the defense budget to provide jobs for their districts, especially in hard times.
This political engineering distorted the so-called industrial base of the nation from which to convert to civilian production. Military contractors, seeking to make the transition, face the arduous task of retooling plants, reorganizing production processes,
retraining personnel, and developing new marketing and distribution networks.
The Advanced Research Projects Agency of the U.S. Department of Defense has initiated a project called Defense Technology Conversion, Reinvestment, and Transition Assistance. The 1993 Defense Appropriations Act provides the funding for programs comprising this project but also requires transitional cost sharing by contractors.
Value practitioners may be more interested in the Small Business Innovative Research (SBIR) program that does not require transitional cost sharing by small businesses. Information on the conversion program may be obtained from the Technology Reinvestment Project, 3701 North Fairfax Drive, Arlington, VA 22203-1714.
VALUE WORLD, Volume XVII, Number 2, May 1994

VALUE ENGINEERING CONTRIBUTION TO FINANCIAL FLEXIBILITY
Arthur E. Mudge, CVS, FSAVE
BACKGROUND
Shortly after the systematic approach of value analysis (later called cost improvement and value engineering), was born in 1947, the question that started to arise was: "What kind of financial benefits can be expected from this type of program?" This question triggered various answers from those who were involved and dedicated to' such programs. These individuals, proud of their accomplishments, answered the question quickly and honestly. For instance, the answer might have been something like this: "In our last VE study we were able to reduce product cost by $50,000." Or their answer could have been: "As the result of our VA Program, the company realized savings of a little over $5 million last year." Such answers, although truthful and to the point, do not give questioners much information to which they can relate.
The numbers may be meaningful to the individuals giving them but not necessarily to the listeners. Experience shows that people asking such questions relate much better to answers given as percentages. People can readily apply percentages to their own products in their own companies. Regarding the financial benefits of VE, a better answer would have been: "On our last VE study we were able to reduce the product cost by 3 percent. In questions regarding annual savings, a better answer would have been: "Last year, our VE program produced savings which equalled 4.15 percent of the company sales."
Percentages or ratios, such as return-on-sales, return-on-investment, investment-to-sales, debt ratio, and return-on-equity, give managers a better idea of the results they can expect from VE programs of their own. These managers can put their trust in such percentages, and therefore back VE programs with the investment of time and money. Dollar and the percentages convey the results and success of VE programs.
The more difficult question to answer is: "What is the contribution of a VE program to the overall finances of the company." This question is not an easy one to answer because it deals with the long-range effect of VE on many programs of a diverse nature.
FINANCIAL BENEFITS OF VALUE ENGINEERING
During the course of the cost improvement program at Joy Manufacturing Company, such questions were asked frequently by Operating Unit General Managers, Managing Directors, company vendors and customers, and by other companies who had heard about Joy's program. They were referred to the person best qualified to answer them, the Executive Vice President and Chief Financial Officer who was Mr. Andre R. Horn.
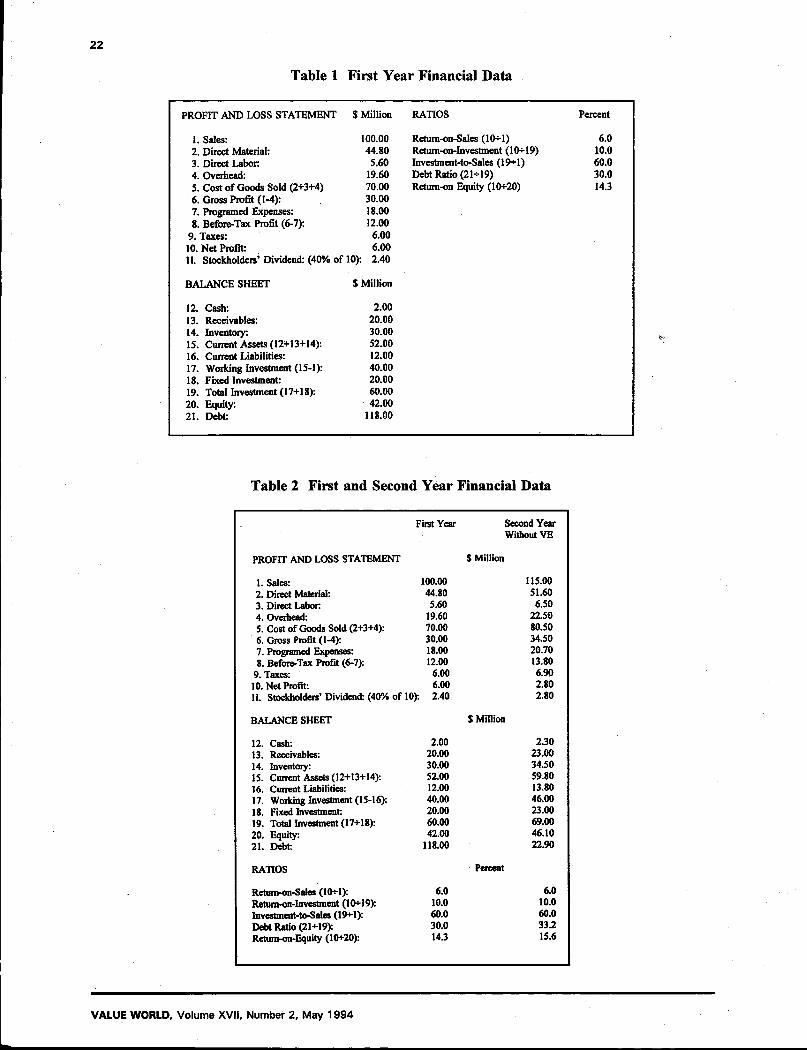
Mr. Horn answered such questions in the context of a hypothetical model company with the financial data given in Vable 1. The financial statement, balance sheet, and ratios in the table are similar to those of the typically successful companies of that time such as Joy Manufacturing Company.
Mr. Horn would point out that the ratios at the bottom of Table 1 are what most company managers use to measure the effectiveness of any given program. He developed these ratios through two years of operation of the model company, with and without VE, to illustrate the significant contribution of VE to a company's financial flexibility. Table 2 gives the financial data for the first and second year of operation without the benefit of VE.
The company has not yet introduced VE but, nonetheless, shows a 15 percent growth in sales. In addition, the company does show increases in the gross profit, before-tax profit, net profit, stockholders' dividend and equity. Such increases are heartily welcomed by both the management and the stockholders. The balance sheet in Table 2 also shows increases in the total investment and debt level. These increases adversely affect some of the ratios. Lurking at the end of the second year, a very serious problem begins to appear.
The first three ratios have remained the same (/.<?., Return-On- Sales, return-on-investment, and investment-to-sales) over the two years so there is no problem there. The problem lies in the debt ratio.
VALUE WORLD. Volume XVII, Number 2, May 1994
22
Table 1 First Year Financial Data
PROFIT AND LOSS STATEMENT $ Million RATIOS Percent
1. Sales: 100.00 Return-on-Sales (10+1) 6.0 2. Direct Maierial: 44.80 Return-on-investment (10+19) 10.0 3. Direct Labor 5.60 Investinent-to-Sales (19+1) 60.0 4. Overhead: 19.60 Debt Ratio (21*19) 30.0 5. Cost of Goods Sold (2+3+4) 70.00 Return-on Equity (10+20) 14.3 6. Gross Profit (1-4): 30.00 7. Programed Expenses: 18.00 8. Before-Tax Profit (6-7): 12.00
9. Taxes: 6.00 10. Net Profit: 6.00 11. Stockholders' Dividend: (40% of 10): 2.40
BALANCE SHEET $ Million
12. Cash: 2.00 13. Receivables: 20.00 14. Inventory: 30.00 15. Current Assets (12+13+14): 52.00 16. Current Liabilities: 12.00 17. Working Investment (15-1): 40.00 18. Fixed Investment: 20.00 19. Total Investment (17+18): 60.00 20. Equity: 42.00 21. Debt: 118.00
Table 2 First and Second Year Financial Data
First Year Second Year Without VE
PROFIT AND LOSS STATEMENT $ Million
1. Sales: 100.00 115.00 2. Direct Material: 44.80 51.60 3. Direct Labor: 5.60 6.50 4. Overhead: 19.60 22.50 5. Cost of Goods Sold (2+3+4): 70.00 80.50 6. Gross Profit (1-4): 30.00 34.50 7. Programed Expenses: 18.00 20.70 8. Before-Tax Profit (6-7): 12.00 13.80
9. Taxes: 6.00 6.90 10. Net Profit: 6.00 2.80 11. Stockholders'Dividend: (40% of 10): 2.40 2.80
BALANCE SHEET $ Million
12. Cash: 2.00 230 13. Receivables: 20.00 23.00 14. Inventory: 30.00 34.50 15. Current Assets (12+13+14): 52.00 59.80 16. Current Liabilities: 12.00 13.80 17. Working Investment (15-16): 40.00 46.00 18. Fixed Investment: 20.00 23.00 19. Total Investment (17+18): 60.00 69.00 20. Equity: 42.00 46.10 21. Debt: 118.00 22.90
RATIOS Percent
Return-on-Sales (10+1): 6.0 6.0 Return-on-investment (10+19): 10.0 10.0 Investment-to-Sales (19+1): 60.0 60.0 Debt Ratio (21+19): 30.0 33.2 Returns-Equity (10+20): 14.3 15.6
VALUE WORLD, Volume XVII, Number 2, May 1994

23
Despite the 15% increase in sales, the debt ratio has increased by 3.2% in just one year. This is a significant increase and shows that the company is not in financial balance. I f allowed to continue unchecked, the rate of increase could mean disaster in the not too distant future. This loss of financial balance by companies rapidly leads to the inability to borrow the operating and expansion capital.
To be conservative, Mr. Horn used the average of five years of results from Joy's cost improvement program. He then imposed these results of this successful cost improvement program on the model company.
The results are given in the third and fourth columns of Table 3. Sixty percent of savings' realized were in the direct material, 10 percent in direct labor, and 30 percent in overhead. The return-on-sales and return-on-investment have increased by 2.0 percent and 3.6 percent respectively while the investment-to-sales has decreased by 1.3 percent.
It is important to note that, because of the VE program, the 15 percent increase in sales has decreased the debt ratio. Even more important
Table 3 First and Second Year Fi:
from a management standpoint that is that the return-on-equity percentage has increased 5 percent over the first year and 3.7 percent over the second year because of the introduction of the VE program.
On several occasions, the question asked by managers was: "Those results look good when sales are steady or increasing; however, what happens i f sales are decreasing?"
Mr. Horn answered such questions by introducing a sales decrease rather than increase in the second year of the model company's operation. He then developed the profit and loss statement, balance
1 sheet, and rations for the second year with and without the benefit of a VE program..
Table 4 gives the model company's financial data with a 15 percent decrease in second year sales with and without VE. It can be noted that even with a sales decrease, VE has improved the company's financial situation. Gross profit, before-tax profit, net profit, and stockholders' dividend have increased. Total investment and debt are reduced while the equity is greater.
lancial Data with and without VE
Second Year Effect of VE Second Year Without VE With VE
PROFIT AND LOSS STATEMENT $ Million
1. Sales: 100.00 115.00 115.00 2. Direct Material: 44.80 51.60 (2.76) 4J.74 3. Direct Labor 5.60 6.50 (0.46) 6.04 4. Overhead; 19.60 22.50 (UJ) 21.12 5. Cost of Goods Sold (2+3+4): 70.00 80.50 (4.60) 75.90 6. Gross Profit (1-4): 30.00 34.50 4.60 39.10 7. Programed Expenses: 18.00 20.70 27.00 S. Before-Tax Profit (6-7): 12.00 13.80 4.60 11.40
9. Taxes: 6.00 6.90 2.30 9.20 10. Net Profit: 6.00 6.90 230 9.20 11. Stockboldera'Dividend: (40% of 10): 2.40 2.80 0.90 3.70
BALANCE SHEET S Million
12. Cash: 2.00 230 230 13. Receivables: 20.00 23.00 23.00 14. Inventory: 30.00 34.S0 (2.00) 3230 15. Current Assets (12+13+14): 52.00 ' 59.80 (2.00) 57.80 16. Current Liabilities: 12.00 13.80 (030) 1330 17. Working Investment (I5-16> 40.00 46.00 (130) 44.50 18. Fixed Investment 20.00 23.00 23.00 19. Total Investment (17+18): 60.00 69.00 (1.50) 6730 20. Equity: 42.00 46.10 1.40 4730 21. Debt 18.00 22.90 (2.90) 20.00
RATIOS Percent
Retam-co-Sales (10+1): RetenvOD-lavestment (10+19): InvestmcnMo-Sabs (19+1): Debt Ratio (21+19): Retunwjo-Eotuty (10+20):
SAVINGS AS A PERCENTAGE OF SALES
6.0 6.0 2.0 1.0 10.0 10.0 3.6 13.6 60.0 60.0 (13) 517 30.0 33.2 (3.6) 29.6 143 15.6 3.6 193
Five-Yeer Average: 4.01 Percent Savings Distribution
Material: 60 Percent Labor. 10 Percent Overhead: 30 Percent
VALUE WORLD, Volume XVII, Number 2, May 1994

24
Table 4 First and Second Year Financial Data with Decreased Sales and with and without
First Year Second Year Effect of VE Without VE
Second Year With VE
PROFIT AND LOSS STATEMENT $ Million
1. Sales: 1° 0 0 0
2. Direct Material: 4 4 8 0
3. Direct Labor: 5.60 4. Overhead: 1 9 6 0
5. Cost of Goods Sold (2+3+4): 70.00 6. Gross Profit (1-4): 30.00 7. Programed Expenses: 18 0° 8. Before-Tax Profit (6-7): 12.00 9. Taxes: «•« 10. Net Profit: 6 - 0 0
11. Stockholders' Dividend: (40% of 10): 2.40
85.00 38.08
4.76 16.66 59.50 25.50 15.30 10.20 S.10 5.10 2.40
(2.04 (0.34) (1.02) (3.40) 3.40
3.40 1.70 1.70 0.68
85.00 36.04 4.42 15.64 56.10 28.90 15.30 13.60 6.80 6.80 2.72
BALANCE SHEET S Million
12. Cash: 13. Receivables: 14. Inventory: 15. Current Assets (12+13+14): 16. Current Liabilities: 17. Working Investment (15-16): 18. Fixed Investment 19. Total Investment (17+18): 20. Equity: 21. Debt:
2.00 20.00 30.00 52.00 12.00 40.00 20.00 60.00 42.00 18.00
1.70 17.00 25.50 42.20 10.20 34.00 20.00 54.00 45.06 22.90
(1.50) (1.50) (0.60) (0.90)
(0.90) 1.02
(2.90)
1.70 17.00 24.00 42.70 9.60
33.00 20.00 53.10 46.08 20.00
"RATIOS "Percent
Retum-on-Sales (10+1): Returns-Investment (10+19): Investment-to-Sales (19+1):
' Debt Ratio (21+19): Return-on-Equity (10+20):
6.0 10.0 60.0 30.0 14.3
6.0 9.4 63.5 16.6 11.3
2.0 3.4
O.D r
(3.4) 2.5
8.0 12.8 62.4 13.2 13.8
SAVINGS AS A PERCENTAGE OF SALES
Five-Year Average: 4.01 Percent. Savings Distribution
Material: 60 Percent Labor: 10 Percent Overhead: 30 Percent
In addition, return-on-sales and return-on-investment have increased; whereas the investment-to-sales and debt ratio have decreased The return-on-equity, although lower than that of the first year by 0.5 percent, is 2.5 percent greater than that of the second year without VE.
CONCLUSION
VE can contribute to the financial flexibility of companies whether sales are increasing or decreasing. Management can and should put their trust in a properly run VE program.
The problem is to learn to define the end result wanted and create the attitude and incentives to achieve them.
John Diebold
This article is adapted from Chapter XV of Successful Program Management: Sharpening the Competitive Edge with the permission of the copyright owner, Arthur E. Mudge, CVS, FSAVE. The book is available from the SAVE Bookstore.
Mr. Mudge is a Senior Associate with Value Associates in Bethel Park, Pennsylvania.
VALUE WORLD, Volume XVII, Number 2, May 1994

25
Testimony of the Society of American Value Engineers in the U.S. House of Representatives
Larry W. Zimmerman, CVS, F S A V E
Editor's Note
The testimony was presented on March 8, 1994 by Mr. Larry W. Zimmerman, CVS, FSAVE, before the Legislation and National Subcommittee of the Committee on Government Operations of the U.S. House of Representatives.
Testimony
Mr. Chairman and members of the Subcommittee, I am Larry Zimmerman, President of the Society of American Value Engineers (SAVE) and Principal of Lewis & Zimmerman Associates, Inc. I am a Fellow of SAVE. I have 19 years experience in value engineering and value management. I have participated in over 450 VE studies worldwide.
It is an honor for me to appear before you today on behalf of the 1,200 members, and the 23 affiliate, international societies which comprise SAVE.
Mr. Chairman, in your invitation to me to testify before this Subcommittee, you asked that I address three topics:
1) The effectiveness of the current OMB Circular A-131.
2) My views on the legislative proposals set forth in H.R. 133, the "Systematic Application of Value Engineering Act of 1993", and H. R. 2014, the "Value Engineering Better Transportation Act of 1993 ".
3) The potential usefulness of an incentive arrangement, similar to that proposed in H. R. 2014.
OMB Circular A-131
Let me begin by first addressing OMB Circular A-131. This document is well done. We wish to thank and congratulate the OMB Office of Federal Procurement Policy for this well-conceived approach to implementing value engineering in the federal government.
OMB, in concert with the President's Council on Integrity and Efficiency, the General Accounting Office, and agency Inspectors General, has very clearly told the federal government and the American people that value engineering works and that greater use of the VE methodology will result in additional savings to the government.
However, there are two specific items in the Circular which we recommend be changed in order to make this regulation truly effective.
The first item appears in the very first paragraph of the Circular which allows federal departments and agencies to use VE, "where appropriate".
Ladies and gentlemen, federal departments and agencies will not find it "appropriate" to initiate viable VE programs. These two words, "where appropriate", encourage debate within agencies rather than encourage the implementation of value engineering, as the Circular intended.
A-131 deals with change; concept which Vice President Gore and the members of the National Performance Review committee dealt with clearly. Promoting change, as every Administration, and every Congress knows, is very difficult. Federal departments and agencies steeped in decades of policies and regulations face a daunting task when they are told to make change happen.
How do they define and then prioritize what needs to happen? They are presented with many methodologies, but the one which gives them the tools to define the functions they need to perform, identify and evaluate their options and then establish a program of implementation is Value Engineering. All this, yes, and it saves money too. A lot of money.
You are here to make a better government. This is your opportunity to tell the Administration and your colleagues in the House and the Senate that you promote positive change. This is your opportunity to clearly tell the federal agencies that you want and expect change. You have the opportunity to create a government that work* better and costs less; and you have Ihc methodology to make that happen.
VALUE WORLD, Volumo XVII. Numb** J. May It9«

26
Do not allow each federal agency to decide individually i f VE is appropriate for them. OMB, the President's Council on Integrity and Efficiency, the General Accounting Office, and agency Inspectors General have already said it is appropriate. Put real teeth into VE. Make it a law.
Our second concern with Circular A-131 is much simpler. Currently, there is a $1 million threshold for projects and programs requiring the application of VE. We propose that the policy for this follow that proposed by Congresswoman Collins in H.R. 133. Specifically, we agree that, firstly, each agency should establish its own dollar threshold and, secondly, that VE should be applied to programs, projects, systems, and products comprising 80 percent of the agency's budget.
The variance in the magnitude of programs and projects from one agency to another is so great that a $1 million threshold causes problems for those agencies whose projects are so large. For example, $1 million is a very small element when dealing with the Department of Agriculture's Food Stamp Program or environmental clean-up in the US/EPA or the Department of Energy. The two-pronged approach of establishing a minimum dollar threshold and applying VE to 80 percent of the agency's annual budget is excellent.
H.R. 133 - Systematic Application of Value Engineering Act of 1993
Let me now turn to H.R. 133. Mrs. Collins, Mr. Chairman and Cosponsors of the bill here today, let us thank you for this bold initiative. Mrs. Collins, for years you have been promoting the concept of change which this Administration so vocally advocates.
We applaud this very close interpretation of OMB Circular A-131, which was used as the format for H.R. 133, and appreciate that the two concerns we have with the Circular Testimony before Legislation and National Security Subcommittee March 8, 1994 are addressed in the bill; namely, that VE will be mandatory and that each agency can establish its dollar thresholds and program applications based on its own budget.
H.R. 133 simply states the following:
1) Implement Value lvnginccring.
2) Establish senior management responsibility and accountability.
3) Develop criteria and guidelines.
4) Provide training.
5) Ensure funding.
6) Document and measure results through annual reporting.
We support this legislation and thank Mrs. Collins for her long history of support for value engineering.
H.R. 2014 - Value Engineering Better Transportation Act of 1993 - Incentives
H.R. 2014 introduces an incentive approach to value engineering during the design of transportation projects. It offers grant recipients the opportunity to increase their federal grant shares by 5-10 percent based on value engineering performance and implemented savings.
To date, value engineering incentives have been offered as value engineering change proposals (VECP) which allow the federal agency and its contractor to share the savings resulting from the implementation of contractor proposals. The formula for this approach is spelled out in the Federal Acquisition Regulations.
VECPs are developed for either construction or manufactured items and are prepared during actual construction or manufacturing. H.R. 2014 offers the incentives during the design or development phase. The advantage to the H. R. 2014 approach is that changes can be made much more cost effectively early on in the process, rather than during construction or production.
Incentives are important to ensuring the success of value engineering. Managers of programs and projects are responsible for producing cost-effective results. This is what they are paid to do. Incentives, however, provide the stimulus to change.
Incentives as they apply to H.R. 133 may have several focuses:
• They must be easy to implement.
• They should empower federal employees to get results. • They should reward the federal employee or team of employees for high quality and cost-effective performance
• They should give the federal employee team and the customers the ability to apply the savings to
VALUE WORLD, Volume XVII, Number 2, May 1994

27
other needs of that same program or of the agency as a whole.
Therefore, we support incentives, but recognize that they must be structured to reward those who make the program or the project better.
Conclusion
As we all know, the Nation's debt exceeds $4 trillion. This translates to $16,600 for every man, woman and child in America. Clearly, value engineering must be mandated. When legislated, VE will become a duty and a job responsibility for each federal employee and each agency, as they dedicate themselves to conserving and protecting our resources.
As a private and corporate taxpayer, mandating the use of value engineering means to me that there is a program in place to constantly search for new ways to improve services and costs. Having performed over 450 VE efforts, many of them on federal or federal grant-funded projects, I have seen first-hand the excellent results produced by the VE methodology. Our federal departments and agencies will become better stewards of the taxpayers' hard-earned dollars.
As I conclude my remarks, I would like to relate a recent example of VE legislation in the Commonwealth of Virginia. In 1990, legislation mandating VE moved their transportation program for a case-by-case basis to a full program. The results were $34 million in savings implemented over three years plus improvements in the quality of their designs and services. This led to the passage of broader VE legislation to all Capital programs in Virginia. On February 18, 1994, the Virginia House of Delegates voted 99-0 and the Senate voted 38-0 for passage. Legislation was supported by the Virginia Department of Transportation, the agency which was originally required to use VE, and by the professional community.
1 SAVE supports the passage of Value Engineering legislation!
Mr. Zimmerman is the Immediate Past President of SAVE and Vice President of Lewis & Zimmerman Associates in Rockville, Maryland.
Value Brief Gross Domestic Product versus Gross National Product
Gross domestic product (GDP) is the total output of goods and services produced by labor and property, located in the United States, and valued at market prices. GDP is viewed as the "national income" of the United States.
Gross national product (GNP) differs from GDP in that GNP includes allowances for depreciation and for indirect business taxes such as sales and property taxes.
According to the 1993 Statistical Abstract of the United States, the GDP was $5,950.7 billion in 1992. The GNP was $4,118 billion in the same year.
It is interesting to compare the GDP and GNP to the gross national debt. The gross national debt was $4,002.7 billion in 1992. This figure is more than 67 percent of the GDP and 97 percent of the GNP.
VALUE WORLD, Volume XVII, Number 2, May 1994

28
Free, Decision Assistance Program Enhances V E with Risk Identification and Quality Practices Database
Ernie Renner
INTRODUCTION
The object was quality. Quality for new procurements. Quality in existing programs that would produce reliability, maintainability, and cost effectiveness; all the goals that are the basis of value engineering. Eight years ago the United States Navy set out to achieve that quality objective in the weapon systems, components, goods, and services it was procuring from American industry.
APPROACH
The approach was unique: no inspections, no regulations, no boards of inquiry. Instead, the Best Manufacturing Practices Program was created to gather data and to provide a means to improve the quality of American industry's products and to increase its competitiveness through technology transfer.
The approach was simple: find out who has the best manufacturing practices, document them, and let others know about them so they could improve themselves. That would get the Navy and the rest of the Department of Defense the quality it needed on the front lines and the taxpayers the most for their dollars.
The means to do that was to: 1) Survey large and small companies with teams of engineers and technical experts who observe, and record how firms do things in the areas of design and test, production and facilities, and logistics management; 2) give those companies complete control of what was surveyed and the report that was subsequently written; and, 3) publish and distribute the reports while putting the information in a user-friendly data base.
Between ten and fifteen surveys are conducted each year and thousands of best practices from design and vendor relationships to solderability and casting, have been documented at numerous companies and government industrial facilities.
The reports led to an annual workshop where surveyed companies could showcase their best practices and representatives of industry, and government could address common issues and problems. Those discussions spawned the
formation of working groups that produced publications and handbooks on topics such as producibility measurement and solderability.
Industry wanted more. The survey data was useful, but what was really needed was a way to tie together the requirements and procedures with risk assessment and the means to solve problems. The U.S. Navy Best Manufacturing Practices Program responded. It produced a powerful, expert decision assistance package, the Program Manager's Work Station (PMWS), that mirrors value engineering's goal of continuous quality improvement.
It provides a means to identify, assess, and mitigate the risks in the design, development, and production process by applying the best practices identified from the surveys done by the U.S Navy Best Manufacturing Practices Program throughout the nation's industrial base. Work on the PMWS was started two years ago to give those involved in the design, development, and production process a way to: 1) determine requirements that had to be met; 2) identify risk potential for various aspects of a program; and 3) integrate and apply the data gathered by the survey teams to mitigate the risks that were identified.
The PMWS was tested by 400 industry and government users. The test was successful and today there are more than 4,000 users nationwide generating more than 25,000 inquiries per year. It is also part of the curriculum for program managers and their assistants at the Defense Systems Management College.
The Program Manager's Workstation is available to industry and government at no cost. Being engaged in defense manufacturing is not needed to become a user; it is available to anyone who wants to improve the quality of their products via this analytical and technology transfer tool.
It can be accessed by any personal computer and has simplified screens and help menus developed from the field test experience of people dealing with real situations in their own companies. Both IBM-compatible or Macintosh computers can utilized the Workstation's full range of capabilities by downloading to the user's computer.
VALUI WORLD. Volume XVII, Number 2, May 1994

29
There are three powerful, interrelated tools in the Program Manager's Workstation: Know-How; TRIMS; and the BMP Database. Know-How is knowledge about government regulations, such as the DoD 5000 series of directives, instruction, and requirements for reporting that contractors have to observe. Know-How has technical reference guideline handbooks for things such as the design review process and templates that include funding, test, and transition planning. With on screen helps, logic driven menus, and an exclusionary engine, it can cut document search time up to 95 percent. It can complete a typical search in about three minutes.
TRIMS is the Technical Risk Identification and Mitigation System, which, based on user supplied data, identifies and ranks actual or proposed courses of action as low, medium, or high risk. It can do a full range of risk assessments throughout the development and production process. In addition to identifying risk, it tracks program goals and responsibilities, and can generate a variety of reports. There is also a companion tool in the PMWS for software risk assessment.
The Best Manufacturing Practices Database, which is continually being updated and revised, has thousands of documented best practices that can be used to solve problems. In addition, through the database, the PMWS serves as a communications network. It allows users to reach the U.S. Navy Manufacturing Technology Centers of Excellence and to communicate with special interest groups that may be able to help them solve problems.
While the PMWS is not a cost accounting system, it is an indispensable tool for achieving quality by incorporating the best technology available into product development and production from concept to delivery and beyond. It makes proposal preparation easier and less risky by guiding users through the labyrinth of requirements they frequently face. It charts the steps and allows the identification and opportunity to mitigate risks throughout the key aspects of design, development, and production that an item to be marketed faces. And, once the product is being manufactured the Workstation allows us to determine what effect modifications to it, or changes in our production processes will mean.
CONCLUSION
The Program Manager's Workstation is not a panacea for all of industry's manufacturing problems. It is a vehicle for technology transfer to improve quality and make the process of managing a program from design through production easier and less risky while increasing profit potential and customer satisfaction.
To use the Program Manager's Workstation or for additional information, send your name; title; and company or agency name, address, and telephone and facsimile numbers via facsimile to U.S. Navy Best Manufacturing Practices Program, PMWS, at (703) 271-9059.
Mr.Renner is Director of the U.S. Navy Best Manufacturing Practices Program in Arlington, Virginia.
Value Navy Centers
The resources of the U.S. Navy's Manufacturing Technology Centers are available to academia, industry, and other organizations in the private and public sectors. These centers reflect the latest state-of-the art in their respective disciplines and are available for dcesign guidance as well as problem solving.
The Automated Manufacturing Research Facility is located at the National Institute of Standards and Technology in Gaithersburg, Maryland. The telephone number is of the center (301) 975-3414.
The Electronics Manufacturing Productivity
Brief of Excellence
Facility is located in Indianapolis, Indiana. The telephone number is of the center is (317) 226¬5607.
The National Center for Excellence in Metalworking Technology is located in Johnstown, Pennsylvania and is operated by Concurrent Technologies Corporation, a subsidiary of the University of Pittsburgh. Ihc telephone number of the center is (814) 269-2420,
The Center for Excellence for ('ompoaltc* Manufacturing is located in Kenosha, Wisconsin. The telephone number of the center is (414) 947¬8900.
VALUI WOftlO. Votunw XVII. Numbof 2, May 1994

30
VE-Creative Steps Toward Total Cost Control Del L . Younker, C C E , CVS
INTRODUCTION
VE, a very useful tool to all of us, enables a better project to be built without sacrificing quality. An owner's return-on-investment in VE is phenomenal. Our experience indicates that as much as a 10 percent cost savings may result from a minor VE team cost. Cost control is a basic part of the creative design and construction phases of the process of producing good construction projects. Having solid project controls in place provides for opportunities to control costs. Generating profits instead of incurring more losses is the backbone and main purpose of a working cost control system. Through VE, we can take one of the first steps toward total cost control.
VE PROCESS
The VE process begins when the VE coordinator selects a project for a VE workshop. The basic guidelines for selection are:
• Cost (over $2 million), or as required by the owner.
• Status of design completion (25 percent to 35 percent).
• Availability of VE workshop information.
The team coordinator then selects the VE team members and match the disciplines to the available information. Selecting members who are responsive to the VE methodology is important to the success of the VE workshop. Equally important is the selection of a VE team leader who can lead the members through the five-step job plan and produce recommendations that result in a significant return-on-investment (ROI) in the VE workshop. (ROI has been 1000 to I in several VE studies undertaken by our firm).
The five phases of the VE workshop normally consist of information, creation (speculative), judgment (analyt ical ) , development, recommendation, and implementation. When analyzing a project consisting of highways, bridges, pipelines, treatment plants, dams, and other associated facilities, the team coordinator should select experts from each of the five major areas
mentioned. In addition to design experts in these fields, we recommend that at least one member with construction cost estimating and scheduling experience. Experience has shown that having these individuals on the team will help produce the most beneficial results.
The team members produce the best results when they are able to work without interruptions in a workshop space within close proximity to the proposed construction project. When the VE team absorbs all of the available information during the first phase (information), they are then armed with data to proceed to the next step, the creative phase. We find that the additional time spent during the initial phase allows the team members time to become familiar with the project. It is recommended that the cost-saving ideas are written down as soon as they are generated during the information gathering.
We have determined that the creative phase is the most critical of all phases in the VE process. This phase is where the project is separated into components that seem to offer the most potential for initial cost savings. The VE team leader enthusiastically and professionally encourages the team to brainstorm and submit ideas without receiving any prejudgment.
The VE team should be reminded of the fact that any idea generated in this phase is a good one. Even i f the initiator or VE team may not think the idea is worthwhile after evaluating it, someone may think of a better, related idea later.
A few questions that might be asked in the initial stages of the VE workshop include the following:
• What is the basic function? Why is it needed? • What is it supposed to do? • Are there any constraints? • What was considered before this method was
designed? • What are the bare requirements? • What is the function worth?
Reprinted with the permission of AACE International, Post Office Box 1557, Morgantown, West Virginia 26507-1557, USA. Telephone (800) 858-COST or (304) 296-8444; Fax (304) 291-5728.
VALUI WORLD, Volume XVII, Number 2, May 1994

31
• What does the current method cost? • What are the cost drivers? . What else will perform the required functions? • Are there cost savings by using this proposed
method? • Will the proposed method sacrifice quality?
Ideas generated for construction projects in preliminary design phases are many and varied. Many projects can be subdivided into major components, such as bridge structures, earthwork, pavement, concrete, mechanical, buildings, electrical, retaining walls, and systems such as HVAC or closed-circuit TV.
Some methods used to encourage creative ideas are:
• Establish the rule that no idea is a bad idea. • Discourage criticism of ideas. • Use brainstorming. • Encourage freewheeling. • Combine ideas. • Modify ideas from previous checklists. • Use three-dimensional graphic techniques. • Think of wild or unusual ideas that may be
practical, and use functional analysis system technique (FAST) diagramming (Figure I ).
Some ideas that may be generated by the team are listed in Table 1. Alternate construction methods are explored and compared to the present design.
Wastewater treatment plants may be subdivided into areas such as sitework, sludge treatment, preliminary treatment, primary treatment, secondary treatment, flow equalization, basins, aeration tank and equipment, clarifiers, pumping, holding tanks, dewaterimg, buildings, tunnels, electrical, and control and instrumentation.
On some teams, ideas such as those listed in Table 2 were created to perform value-added functions.
Pipeline projects may be subdivided into major cost component areas, such as pipeline materials, earthwork, pavement replacement, pipeline routing, pumping, manholes-lift station, interceptor-piping, and collector-piping. Remember that Pareto's law states that 80 percent of the costs are included in 20 percent of the project.
The VE team thus focuses on the major cost components. Some of the ideas created by the team to perform value-added functions are shown in Table 3.
Several teams generated over 140 ideas for seven major areas. They usually scrutinize and develop
nearly 40 ideas; these may result in 5 percent to 30 percent cost savings from the originally designed total project costs.
When the generation of ideas is completed, the team rates the ideas based upon a previously designed rating procedure. For certain projects we normally rate an idea for its potential cost savings and its potential for acceptance.
At this stage, the team has documented the analysis and is ready for the development phase. It is important to point out that the team members should engage in problem-solving techniques such as FAST to determine the basic and secondary functions of the project. When asked: "What is the
' function of a bridge?", it is likely that the team will conclude that the basic function of a bridge is to span obstacles.
Other functions are likely to be secondary functions. The function is usually identified by the verb-noun order.
It may be helpful to view the project cost in graphic format. This will assist the team in concentrating effort in areas where most of the costs exist to get the most for their time. On particular projects, it is useful to develop charts and tables to portray to the team where the team should exert most of its effort to derive the greatest results.
It may also help to develop a cost-loaded critical path schedule to identify major components of the project that have the most value. This assists in creating ideas to level the project costs.
RATING THE BEST IDEAS
The idea-rating method our teams composed is quite important to the analysis process. This rating method forces the team to concentrate on the ideas that promise the greatest cost-saving or value added to the owner's project. Ideas are often rated according to various attributes or weights the team feels could influence the owner or design team when implementation later occurs. For example, the idea to eliminate a certain redundant facility (due to a projected need for this facility) may be rated by cost saving and owner acceptance,
The highest rated ideas arc developed further by teams during the next phase. Usually ideas with a total rating of seven or more arc developed further, Team members develop their own high-rated ideas. Team members arc encouraged to work together to develop ideas, Usually, the team Is provide with data on similar construction.
VALUI WOMO. Volume XVII, Number 2, May 1994
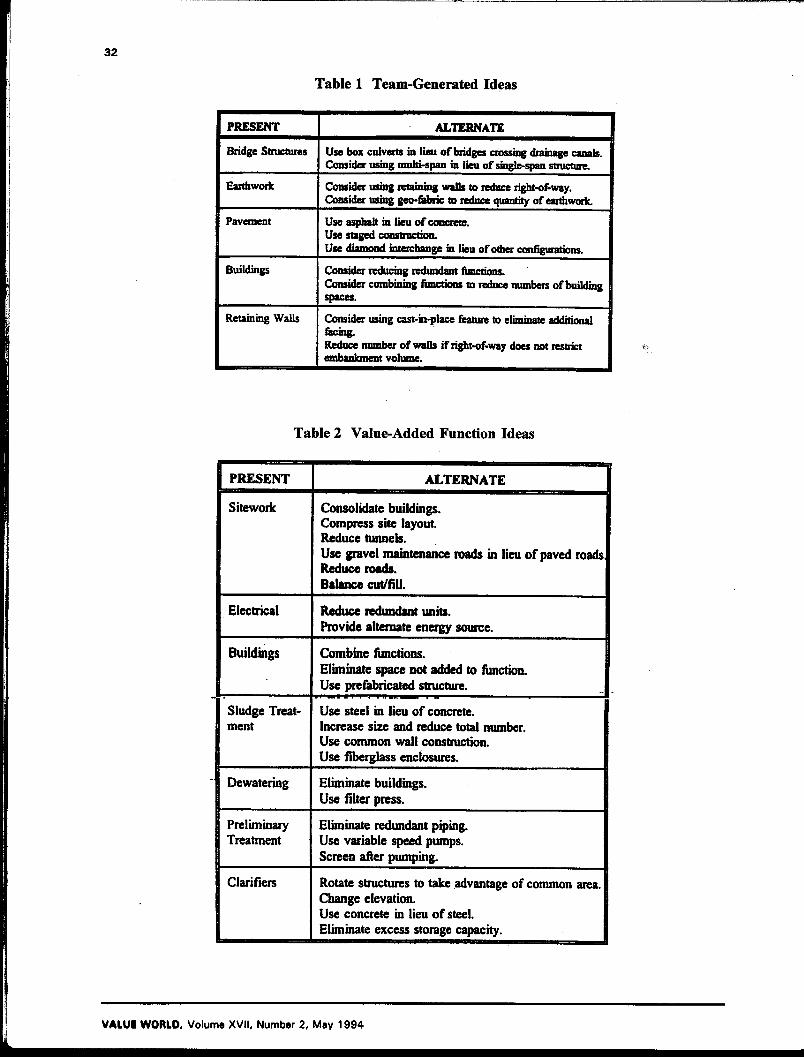
32
Table 1 Team-Generated Ideas
PRESENT ALTERNATE
Bridge Structures Use box culverts in lieu of bridges crossing drainage canals. Consider using multi-span in lieu of single-span structure.
Earthwork Consider using retaining walls to reduce right-of-way. Consider using geo-fabric to reduce quantity of earthwork.
Pavement Use asphalt in lieu of concrete. Use staged construction. Use diamond interchange in lieu of other configurations.
Buildings Consider reducing redundant functions. Consider combining functions to reduce numbers of building spaces.
Retaining Walls Consider using cast-in-place feature to eliminate additional facing. Reduce number of walls if right-of-way does not restrict embankment volume.
Table 2 Value-Added Function Ideas
PRESENT ALTERNATE
Sitework Consolidate buildings. Compress site layout. Reduce tunnels. Use gravel maintenance roads in lieu of paved roads Reduce roads. Balance cut/fill.
Electrical Reduce redundant units. Provide alternate energy source.
Buildings Combine functions. H Eliminate space not added to function. Use prefabricated structure.
Sludge Treatment
Use steel in lieu of concrete. Increase size and reduce total number. Use common wait construction. Use fiberglass enclosures.
Dewatering Eliminate buildings. Use filter press.
I Preliminary 1 Treatment
Eliminate redundant piping j Use variable speed pumps. I Screen after pumping. |
Claritiers Rotate structures to take advantage of common area. Change elevation. Use concrete in lieu of steel. Eliminate excess storage capacity.
VALUI WORLD, Volume XVII, Number 2, May 1994

33
IDEA DEVELOPMENT
During the developmental phase, the team members document the original design and contrast the original concept with the team's proposed change. In this phase, the team members research the ideas and collect data, document the reality of the idea, develop the proposed cost decrease, and describe the advantages and disadvantages.
The cost development includes all items pertinent to the idea. The cost breakdown should clearly indicate the proposed design change cost differences between the original concept and the proposed change.
Items such as reduction in maintenance or life cycle cost are calculated. The apparent advantages and disadvantages are described to give the reader a clear understanding of the implications to the project should the idea become reality.
Further discussion is included with the document to describe fully the proposed change. Supporting documents are attached, including sketches, state-of-the-art studies, and similar procedures used elsewhere.
IDEA PRESENTATION
Upon completion of the development of the highest rated ideas, the team should summarize the results of all the ideas, and present them to the design consultant. During a dry-run presentation, each member prepares to answer clarification questions from the design consultant. This process helps the presenter to be fully prepared to present his/her own ideas.
As the team scrutinizes the development of each idea, they should put themselves in the client's shoes to make sure ideas and costs are fully described and understood. It is advisable to reference source materials that were used to develop each idea.
Prior to the presentations, the team develops charts, graphs, drawings, and reports to depict and assist with explanation during the presentation. We have developed a computer spreadsheet that generates the forms used in a workshop. Having these forms readily available enables the team to quickly make changes as the workshop progresses, and produce a very professional work product.
The computer assists with expeditious calculations so that the result will be a quality product. It is usually best to hold the presentation on the last day
of a five-day study.
A draft copy of the preliminary VE report usually can be handed to the design consultant at the end of the oral presentation.
The design consultant is invited to ask clarification questions after each recommendation is presented. The presentation may take as long as two to three hours, depending on the VE team's findings and the complexity of the project. The VE coordinator directs the completion and distribution of the formal submittal of the VE report to the design consultant, which is the work product of the VE workshop.
IMPLEMENTATION
During the formal presentation the most often asked questions are "When can we begin to implement this idea?" and "Whv didn't we think of this before?" After hearing the results of the VE workshop, the design consultant may say you have proven that these recommendations can save up to so many dollars and produce a better project.
It is recommended that the VE coordinator continue to be the driver to follow up on the implementation of the ideas created by the VE team. An implementation program plan should be issued to the design consultant by the VE coordinator. Follow-up by the VE coordinator is necessary.
The design consultant submits a response to the recommendations proposed by the VE team by indicating acceptance for each proposed recommendation. Reasons should be given for partial or complete rejection. Cost-saving ideas that were accepted during the VE workshops are often multiplied several times, due to the same type of cost savings being applied to each future project that will be constructed by the clients.
CONCLUSION
The VE process works because team members are allowed to be creative by our VE team leader*, thi* enables creative ideas to be transformed Into reality and contributes to our total cost control, 'limn, the ultimate owner is getting more value from the work product of the VE workshop*.
Cost savings alone are not the only pari of Ihe Vli process. The process can allow value-added functions to be implemented along with total cost control for more profit,
VALUI WOMD. Volum* XVII, Numb* 2, May 1994

34
STUDY JOBS
AVAILABLE
o m i u z s GENERATE BUSINESS REVEMtB GOALS
SATISFY ECONOMIC
OROWTH
ATTRACT
BUSJNBtS
FAST DIAGRAM TRANSPORTATION SYSTEM
EXAMPLE
ANALYZE WORKER
PROVIDE
OPPORTUNITY!
ALTERNATES
PROVDE BETTER FUTURE
INVEST 10 ATB TRAFFIC PATTERNS
ENVIRONMENTl
AOCOMOOATB
PROVIDE PUBLIC AREAS
STUDY OROWTH
AREA
MEET PUBLIC
BUILD TOLL
1 ROADWAYl
D B H O N
PROJECT
rRovmBl
PUNDIHol
ASSESS
COST
Figure 1 FAST diagram.
Table 3 More Value-Added Ideas
Pipeline Materials Vitrified clay Pipeline Materials Ductile iron Concrete Fiberglass PVC
Team will Material cod consider: Instillation method/cost
Infiltration potential Control of grade Ability to tap for future Ease of repair Corrosion resistivity Business interruption due to traffic control Construction phasing Additional pump station Relocate piping Purchase additional right-of-way Eliminate service connection crossing street
BIBLIOGRAPHY
Building Research Advisory Board, Federal Construction Council. May 27, 1969. Federal Construction Agencies, Symposium/Workshop Report, Number 4.
Alphonse J. Dell'Isola, Value Engineering in the Construction Industry, Smith, Hinchman & Grylls, 1988.
DOD Handbook. 5010.8-H, September 12„ 1968.
General Services Administration. March 2, 1973. Value Engineering Handbook, March 2, 1973.
Lawrence D. Miles, Techniques of Value Analysis and Engineering. 2nd Edition, McGraw-Hill. 1961.
Mr. Younker is an Associate Editor of Value World and a program manager at PBS&J Construction Services, Inc. in Orlando, Florida.
VAIUI WORLD, Volume XVII, Number 2, May 1994
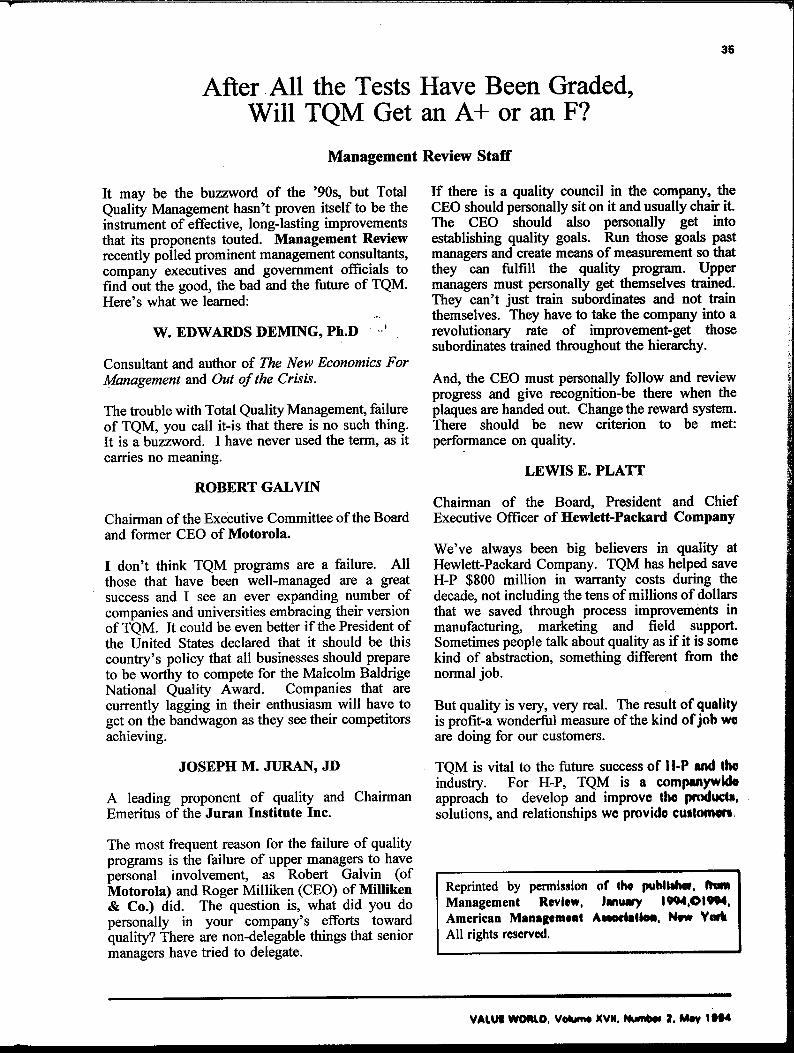
35
After All the Tests Have Been Graded, Will TQM Get an A+ or an F?
Management Review Staff
It may be the buzzword of the '90s, but Total Quality Management hasn't proven itself to be the instrument of effective, long-lasting improvements that its proponents touted. Management Review recently polled prominent management consultants, company executives and government officials to find out the good, the bad and the future of TQM. Here's what we learned:
W. EDWARDS DEMING, Ph.D '
Consultant and author of The New Economics For Management and Out of the Crisis.
The trouble with Total Quality Management, failure of TQM, you call it-is that there is no such thing. It is a buzzword. I have never used the term, as it carries no meaning.
ROBERT GALVIN
Chairman of the Executive Committee of the Board and former CEO of Motorola.
I don't think TQM programs are a failure. All those that have been well-managed are a great success and I see an ever expanding number of companies and universities embracing their version of TQM. It could be even better i f the President of the United States declared that it should be this country's policy that all businesses should prepare to be worthy to compete for the Malcolm Baldrige National Quality Award. Companies that are currently lagging in their enthusiasm will have to get on the bandwagon as they see their competitors achieving.
JOSEPH M. JURAN, JD
A leading proponent of quality and Chairman Emeritus of the Juran Institute Inc.
The most frequent reason for the failure of quality programs is the failure of upper managers to have personal involvement, as Robert Galvin (of Motorola) and Roger Milliken (CEO) of Milliken & Co.) did. The question is, what did you do personally in your company's efforts toward quality? There are non-delegable things that senior managers have tried to delegate.
I f there is a quality council in the company, the CEO should personally sit on it and usually chair it. The CEO should also personally get into establishing quality goals. Run those goals past managers and create means of measurement so that they can fulfill the quality program. Upper managers must personally get themselves trained. They can't just train subordinates and not train themselves. They have to take the company into a revolutionary rate of improvement-get those subordinates trained throughout the hierarchy.
And, the CEO must personally follow and review progress and give recognition-be there when the plaques are handed out. Change the reward system. There should be new criterion to be met: performance on quality.
LEWIS E . PLATT
Chairman of the Board, President and Chief Executive Officer of Hewlett-Packard Company
We've always been big believers in quality at Hewlett-Packard Company. TQM has helped save H-P $800 million in warranty costs during the decade, not including the tens of millions of dollars that we saved through process improvements in manufacturing, marketing and field support. Sometimes people talk about quality as i f it is some kind of abstraction, something different from the normal job.
But quality is very, very real. The result of quality is profit-a wonderful measure of the kind of job we are doing for our customers.
TQM is vital to the future success of H-P and the industry. For H-P, TQM is a companywlde approach to develop and improve the product*, solutions, and relationships we provide customer*
Reprinted by permission of the publlabei, from Management Review, January IW4 t©l«M. American Management Ateocialto*, New York All rights reserved,
VALUI WOULD, Volume XVM, Numfew 3. May 1994

36
As we carefully measure what we are doing and put in place the total quality environment that thrives on continual improvement, we will have delighted customers and good profits.
TOM PETERS, Ph.D
President of The Tom Peters Group and author of Thriving in Chaos and Liberation Management.
TQM has failed for three reasons. First, TQM done right is a way of life, not a program. It becomes the religion, organizing logic and culture of the firm. Second, as Dr. Deming has said, and most have ignored, the essence is a belief in the capability of the front-line employees. For instance, any employee at the Ritz Carlton Hotels, even a bellhop, can spend up to $2,000 without approval to fix a customer problem. Third, many quality programs are not customer-focused. They are internal programs run by technocrats.
People got the Deming technique but they didn't get the Deming philosophy. Deming said most of the problems are with managers, but managers are not going to voluntarily reject hierarchical steps of the past. The nation, overall, is more concerned with quality than it was in the 1970s, and giant companies will fall by the wayside i f they don't get with the program in as revolutionary and as progressive a way as .they need.
ROSABETH MOSS KANTER
Professor, the Harvard Business School and author of 11 books including The Challenges of Organizational Change.
When TQM programs fail, it is because they are mounted as programs, unconnected to business strategy, rigidly and narrowly applied, and expected to bring about miraculous transformations in the short term without top management lifting much of a finger.
Once companies in an industry jump on the bandwagon and adopt new practices, and once customers begin to see product or service perfection as a God-given right, rather than something some companies thoughtfully provide, then TQM type practices become a baseline business necessity to stay in the game at all. "Quality" by itself stops being a distinguishing feature.
TQM is here to stay in many ways. ISO-9000 in Europe (setting defacto world standards) and the Baldrige Award in the United States make quality processes and outcomes an essential feature of
business, but not the be-all and end-all primary feature of business success.
I f TQM consultants find that their market is withering as disenchantment sets in, they can always ply their trade in the government. The Gore Reinventing Government blueprint features TQM in a big way, and there will be lots of change efforts and lots of consulting on government contracts for years to come.
CHARLES BOWSHER
Comptroller General of the United States.
I don't see TQM as a failure at all but I do know that it is not a quick fix for problems that exist in organizations. It requires time to identify current conditions and patience to achieve success. Success is also dependent on the willingness of the leadership and the staff of the organization to be trained in the tools of TQM, as well as the principles underlying it.
One of the keys to the future success of TQM in the public sector is the need for the political leadership to work very closely with the career leaders of an organization to ensure continuity as the leadership changes. Thus, over time, the success of TQM in public organizations will depend to a certain extent on career leaders' ability to demonstrate the usefulness of TQM and the benefits being realized in improving the way organizations relate to their customers and carry out their missions.
JACK WEST
President of American Society of Quality Control.
The people advocating [quality programs] look at them as ways to reduce defects, and increase training, motivation and involvement but they don't look at whether those things are important to the business. In addition, there's not a strong consistent top management push that keeps [quality] on track, reviews progress, makes corrections and allocates resources.
People tend to pick a canned program, but TQM must be unique to the culture and customers of the organization, and it must respect the company's history and where it wants to go. The improvement process must be refocused on things that add value to the customer. As a result, people will begin to use quality improvement as a personal ethic and as a way to improve interaction with family or coworkers.
VALUI WORLD. Volume XVII, Number 2, May 1994

37
CHRISTOPHER W. HART, Ph.D
President of the TQM Group, author of Extraordinary Guarantees and former Baldrige Award screener.
TQM is not simply a set of tools applied by team but a radically different system of management based on a philosophy of prevention, management by fact, employee satisfaction and growth. Without a powerful set of company values throughout all levels of the organization, and a deep understanding of the TQM concept, training-based efforts generally start with a burst of enthusiasm and then wither.
The constraint is simple: Different organizations require different approaches. Is "appropriate quality practice" in an electronics circuit board manufacturing the same as the appropriate quality practice for an advertising agency? The Baldrige framework will be the guide for companies to take stock of where they are and where they need to go. The result will be continuous progress made in developing new approaches that fall under the total quality umbrella because of Baldrige guidelines.
BRUCE W. WOOLPERT
President and CEO of Graniterock, winner of 1992 Malcolm Baldrige National Quality Award.
TQM must be led by the existing management team and must involve current employees from the very beginning. They have the knowledge that will make a difference, once they become empowered. When an outsider is hired, people tend to wait until the "messiah" does something. TQM approaches conflict terribly with traditional management approaches and can't be implemented as an "addon" to the company's current operation. Instead, a revolutionary change is needed -not a failed attempt to mix oil and water.
Companies need to set a window of five years to seven years before they should expect to view, themselves as total quality companies. Revolutionary change should be brought to one area of the company at a time-such as compensation and then let time elapse before another change is implemented. Because the change is revolutionary, it requires more time for people to buy in.
TQM companies will continue to out-perform their competitors into the future. Unfortunately, many American companies take a very short-term view of the world and won't implement a five to seven year transition of company approaches and culture.
MICHELE HUNT
Director of the Federal Quality Institute.
TQM is not a destination, it is a journey. It is a cycle of constantly changing yourself to respond to internal conditions and these are natural cycles we're not paying attention to. The goal is to not always be the highest performer at a particular time; the goal is to constantly have the capacity, mindset, freedom and the tools to continuously recreate, improve and change.
We need to understand that it's a continuous journey. We have to tackle the short-term American mentality of black and white and of either winning or losing.
People are beginning to discover quality beyond a program level. They're taking a look at deeper assumptions about how we work together as well as our structures, hierarchies and belief systems. It says something i f the largest, most powerful, complex organization-one that hasn't been transformed before-decides to take on this journey.
JOHN P. CLANCEY
President and Chief Executive Officer of SeaLand Service Inc.
Too often the TQM focus shifts from meeting customer requirements and expectations to less productive internal processes. The customer linkage, that "eye on the ball," must be maintained. In addition, in some quarters, TQM can be viewed as threatening by employees. In this period of cost cutting, TQM can be construed as a methodology resulting in headcount reductions. This is not a TQM objective.
Reward and recognition are essential. These must be tied directly to business performance, goals and objectives. The organization must realize that TQM adds value and produces results. Performance-based compensation programs can be clearly aligned with TQM to heighten this awareness. TQM will regain momentum when companies clinically evaluate the failures and act decisively to correct them. Many successful companies are adapting the Quality Process more directly to our performance goals. Many companies are integrating TQM with more sophisticated, evolutionary, process improvement and benchmarking programs. This is a logical extension that leverages TQM and directly lies the process lo our core business performance
VALUE WORLD. Volume XVII, Number 2, May 1994

38
RON HEIDKE
Vice President and Director of Corporate Quality at Eastman Kodak.
Successful programs require three components: skill, knowledge and will. Often the lack of will to carry out a program causes a failure. Not understanding the cause of failure also leads to erroneous conclusions about the value of the knowledge and skill to those who have the will.
DAVID GREGERSON
Vice President for Quality, Carrier Corp.
I f TQM is an equilateral triangle, companies must factor in all three angles: management leadership, employee involvement and technical systems. The problem is, companies don't do all three, they only do one or two. They must link total quality
There is a definite need for strong leadership but not everybody can step into the leader's role and give a world class performance. Managers need to learn the kind of leadership that is required and they must perfect it over many long, hard years.
The future of TQM is to become ingrained in the very fabric of the way we live and operate such that people won't talk about it anymore. They will just be doing it. It will no longer be perceived as the "program of the month" or a passing fancy, it will just be the way we do our work.
programs to business strategies of the company and make sure management believes in them. I f the business strategy is for a down market, then companies should change their programs to reflect downsizing, outsourcing, etc. The acronym TQM will disappear and transition into *total quality, maybe even customer satisfaction. The acronvm TQM is a fad.
Value Brief Standard Industrial Classification
The Standard Industrial Classification (SIC) system was established by the Federal Government for defining industries and classifying individual establishments by industry. The SIC system covers economic activity in nine major categories: agriculture; forestry and fishing; mining; construction; manufacturing; transportation; communications and public utilities; wholesale trade; finance, insurance, and real estate; and services.
These categories are further divided into major groups that have 2-digit codes; then into industry groups that have 3-digit codes; and finally into industries that have 4-digit codes.
For example, the major group SIC code is 17 for Construction-Special Trade Contractors. The SIC code is 174 for Masonry, Stone Setting, Tile Setting, and Plastering.
The three industries within SIC code 174 are: 1741 for Masonry, Stone Setting, and Other Stone Work; 1742 for Plastering, Drywall, Acoustical, and Insulation Work; and 1743 for Terrazzo, Tile,
Marble, and Mosaic work.
The SIC code is 35 for Industrial and Commercial Machinery and Computer Equipment. The SIC Code is 357 for Computer and Office Equipment. The four computer industry codes are: SIC 3571 for Electronic Computers; SIC 3572 for Computer Storage Devices; SIC 3575 for Computer Terminals; and SIC 3577 for Computer Peripheral Equipment.
The SIC code for Business Services is 73. The SIC code is 737 for Computer and Data Processing Services. The SIC code is 7372 for Computer Software.
Copies of the Standard Industrial Code Manual are available by mail from the National Technical Information Service, to 5285 Port Royal Road, Springfield, Virginia, 22161, or by telephoning (703) 4874600, and by mail from the U.S. Government Printing Office, Washington, DC 20402, or by telephoning (202) 783-3238.
Ask for Order No. PB87-100012.
VALUE WORLD. Volume XVII, Number 2, May 1994

39
BOOK REVIEW The Hidden Wealth of Cities: Policy and Productivity for American Local Governments
Edited by Edward C. Hayes, 1989, JAI Press, Inc.
The theme of this book is the fascinating notion that local government can not only live with less federal financial assistance but can, by fully addressing the question of increased productivity, reverse the flow of money from Washington and help reduce the enormous federal deficit.
On an overall basis, the book offers a compelling argument in support of the notion. Value practitioners, especially those doing or contemplating business with state, county, and city entities will find the book a worthwhile addition to their libraries.
The book is one of eight volumes in the series Contemporary Studies in Sociology published by Press, Inc. in Greenwich, Connecticut
and London, England. The editor, Dr. Hayes, is President of COMMUNICORP in San Diego, California, and a member of SAVE. Russell c! Brannen, also a member of SAVE, is a contributor to one of the chapters of the book.
Nine authors contributed to the twelve chapters in this well-written and well-documented book. The three appendixes identify a large number of productivity centers and networks whose resources are available to public and private organizations wishing to implement and pursue a productivity policy on an organized basis.
The bibliography lists an extensive number of publications devoted to management-centered and technical methods for improving local public sector productivity and cost control. These publications are in addition to the refvences cited in the volume.
The book is organized in four parts: "Federal Aid: How Much is Necessary?", "Increasing Productivity, Controlling Cost"; "Toward the Self-Financed City", and " The Hidden Wealth of Cities. The book begins by outlining the history of federal grants to state and local governments.
The book cites a number of success stories, and concludes with the plea that local governments adopt a "productivity policy" as the essential step in
severing the umbilical cord to increasingly tenuous federal-assistance programs.
In the part "Toward the Self-Financed City", the images of the entrepreneurial city manager and enterprise zones as alternatives to federal-assistance programs are not only intriguing but appear to be the ultimate solution for the financial difficulties of local government.
There is a sole dissenting voice in the volume. The author of Chapter 4, "Federal Support to Cities Must Not be Reduced", does not disagree with the compelling need for increased productivity in local government but argues that cities constitute the nation and urban problems are national problems. The author hypothesizes that the elimination of federal grants will only damage cities severely and not reduce the federal deficit as much as tax reform that closes loopholes.
In essence, the contributing authors, with the one dissension, view increased productivity as the golden key to alleviating the financial problems of local government.
Chapter 7, "Value Analysis and the Cities" asserts that VE can afford local government entities the opportunity to realize substantial savings the first time they use it with a significant return-on-investment The chapter gives a brief description of the VE process illustrated with several examples of local-government application.
The example in Chapter 7 of mandated VE for school construction in the State of Washington underscores the advantage of productivity policies at all levels of government. In particular, the example illustrates the motivational leverage from using VE in the budget-approval process and how useful VE and productivity policies could be to officials in the other states and in the counties as well as the cities of the nation. The State of Washington, with its budgetary process of expenditure control, has become a leader in VE. The state should serve as an excellent role model for other state and local governments.
VALUE WORLD, Volume XVII, Number 2, May 1994
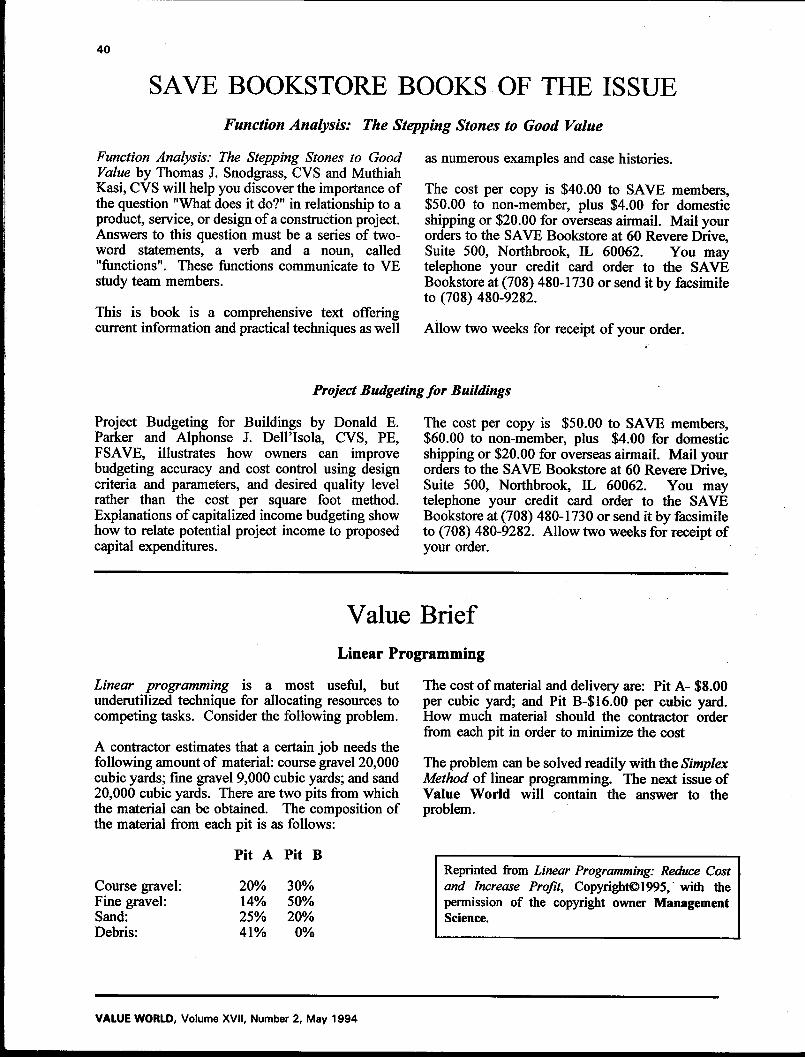
40
SAVE BOOKSTORE BOOKS OF THE ISSUE Function Analysis: The Stepping Stones to Good Value
Function Analysis: The Stepping Stones to Good Value by Thomas J. Snodgrass, CVS and Muthiah Kasi, CVS will help you discover the importance of the question "What does it do?" in relationship to a product, service, or design of a construction project. Answers to this question must be a series of two-word statements, a verb and a noun, called "functions". These functions communicate to VE study team members.
This is book is a comprehensive text offering current information and practical techniques as well
as numerous examples and case histories.
The cost per copy is $40.00 to SAVE members, $50.00 to non-member, plus $4.00 for domestic shipping or $20.00 for overseas airmail. Mail your orders to the SAVE Bookstore at 60 Revere Drive, Suite 500, Northbrook, IL 60062. You may telephone your credit card order to the SAVE Bookstore at (708) 480-1730 or send it by facsimile to (708) 480-9282.
Allow two weeks for receipt of your order.
Project Budgeting for Buildings
Project Budgeting for Buildings by Donald E. Parker and Alphonse J. Dell'Isola, CVS, PE, FSAVE, illustrates how owners can improve budgeting accuracy and cost control using design criteria and parameters, and desired quality level rather than the cost per square foot method. Explanations of capitalized income budgeting show how to relate potential project income to proposed capital expenditures.
The cost per copy is $50.00 to SAVE members, $60.00 to non-member, plus $4.00 for domestic shipping or $20.00 for overseas airmail. Mail your orders to the SAVE Bookstore at 60 Revere Drive, Suite 500, Northbrook, IL 60062. You may telephone your credit card order to the SAVE Bookstore at (708) 480-1730 or send it by facsimile to (708) 480-9282. Allow two weeks for receipt of your order.
Value Brief Linear Programming
Linear programming is a most useful, but underutilized technique for allocating resources to competing tasks. Consider the following problem.
A contractor estimates that a certain job needs the following amount of material: course gravel 20,000 cubic yards; fine gravel 9,000 cubic yards; and sand 20,000 cubic yards. There are two pits from which the material can be obtained. The composition of the material from each pit is as follows:
The cost of material and delivery are: Pit A- $8.00 per cubic yard; and Pit B-$ 16.00 per cubic yard. How much material should the contractor order from each pit in order to minimize the cost
The problem can be solved readily with the Simplex Method of linear programming. The next issue of Value World will contain the answer to the problem.
Pit A Pit B
Course gravel: Fine gravel: Sand: Debris:
20% 14% 25% 41%
30% 50% 20% 0%
Reprinted from Linear Programming: Reduce Cost and Increase Profit, Copyright©1995, with the permission of the copyright owner Management Science.
VALUE WORLD, Volume XVII. Number 2, May 1994
41
Perspective: And Now the Rest of the Story Bernard J . Schulte
Life essentially consists of two elements: a cast of characters and a series of events which are linked together and interrelated. Every story, book, play, or experience is basically a microcosm in time related to a specific combination of these two elements.
And so it was in my paper Third Party VECPs—A Case History, that was published in the January 1988 issue of Value World. It was a true story with its own set of characters and events. I f it were a play, it would be called a tragedy. In the paper, I dealt with events involving Companies A, B, and C. This paper intends to identify some of the basic causes of Company A's problems and how to avoid them in the future. Hence the title And Now The Rest Of The Story.
BACKGROUND
During the 1970's the Army needed a lightweight, portable detector system to warn troops of the presence of lethal war gas. The system currently in use was a wet-chemical system that passed air samples through a chemical bath and required frequent chemical replacement and heating to prevent freezing. It was a logistical nightmare and expensive to maintain. The system was being produced by Company C.
During this same time period, Company A developed a similar system for the Air Force using a concept called the ionization principle. This system required no heating or replacement of chemicals. Company A proposed to build a similar type unit for the Army to replace the one that they had in production. The Army was interested in the design but only had enough money to upgrade and improve Company Cs original system.
The following events took place during the time period of February 1983 to April 1986.
1. Using company funds, Company A proposed a light-weight version of the detector for the Army to replace the obsolete design currently in production by Company C.
2. The Army was impressed by Company A's new design and issued a development contract to Company A.
3. After completion of the development program, the Army issued a request for quotation on a production contract for 30,000 of the detectors
4. A new contender, Company B won the competition over Company A for the production contract. Company C dropped out of contention.
5. Company A obtained an export license from the State Department and went into production of the system for NATO countries.
6. Company A incorporated many improvements into the NATO system making it a better and lower cost system than the one being produced by Company B for the Army. Company A submitted to the Army a number of unsolicited VE change proposals (VECP) against the 30,000-unit production contract held by Company B.
7. The Army tried to buy Company A's design package for the improvements. Company A refused the Army's offer saying that the only way that it would give the Army access to the design package would be i f the Army were to approve the unsolicited VECPS.
8. Company B objected because it would have to reduce the selling price (and therefore profit) i f the VECPs were approved and became customer-directed changes.
This was the essence of the dilemma. At what point technically, legally, and contractually does an upgrade cease to be an improvement to an existing system and become an entirely new design? Should the decision be based on:
1. The percentage of the total number of parts from the original design that retained for the new configuration?
2. The percentage of different types of parts that could be retained?
3. The percentage of the dollar value of the parts?
4. The retention of certain key parts?
5. Some other criteria?
There were no firm guidelines in this area. Nobody knew but everybody had an idea. It should be mentioned that, when restoring antique aircraft, the FAA requires that at least percent of the original
VALUE WORLD, Volume XVII, Numbef 2, May 1904

42
aircraft must be used for it to be able to keep its original license number; otherwise it would be designated a replica, with greatly diminished monetary value.
The only guidance Company A received from the Army during the development contract was to use as many parts as possible from the old design. This, of course, was exactly what Company A did not want to do, believing that the overuse of the old parts would jeopardize the size, weight, performance, and cost advantages of the new design.
This became a major source of contention between the Army and Company A during development. The situation was exacerbated by the fact that Company A and the particular Army organization were strangers to each other, never having done business together before.
Not only did the Army dictate which items from the old design were to be retained in the new upgrade, they picked the most expensive ones. Many of these were sole source and most were those that the new configuration would eliminate because of cost and complexity.
After a prolonged, legal battle involving the unsolicited VECPS, Company A capitulated. The story is a tragedy because of the $7,039,579 in cost reduction potential on the 30,000-unit production program, the Army only realized $400,000 with $6,909,579 going down the drain. A sad day for VE.
CONCLUSIONS
What happened? What went wrong to cause this VE catastrophe? Who was to blame and how could it have been avoided? After eight years, it is now possible to review the events objectively and come to some conclusions. As for blame, there is enough to go around for everyone.
Company A was to blame for being so naive as to think that they could have moved right in and replace Company B who had a long-standing relationship with this Army organization. In addition, Company A was at fault for basing its decisions on assumptions, most of which were
wrong, rather than on facts.
The U.S. Army was to blame for being over cautious in demanding lengthy, unnecessary tests and not accepting readily available Air Force data. The Army was also to blame for allowing Company B to create meaningless road blocks to delay introduction of the new system.
I f any blame can be assigned to Company B, it was that they put their own interest ahead of what was best for the Army.
The bottom line is that the ultimate responsibility for the situation was Company A's. It was their program and their responsibility to involve other agencies who would benefit from the improved detector. Company A's defense was that they did not want to offend the Army.
AFTERMATH
An odd sidelight is that one of the company recently levied a law suit against the other claiming patent infringement on a particular product. The defendant company claimed that the device is not an upgraded version of the product being produced by the first company but an entirely new product. This case has yet to be tried in court. It will do the court no good to look to the military for assistance because the military have yet to issue guidelines in this area.
If you were to ask what is new after the many years that transpired, I would have to answer: "Everything and nothing."
Mr. Schulte is President of B. J. Schulte & Associates in Clearwater, Florida.
VALUE WORLD, Volume XVII, Number 2, May 1994

43
Perspective: Chaos Is Required in V E
Roger B. Sperling, CVS
Dick Park's presentation at Fort Lauderdale last May included this thought:
Functions create chaos; Therefore, they are hard work.
This sparked an idea. I had been trying to make a connection between the activities of a VE study and those of a design Project. By constructing the two FAST diagrams in Figure 1, I discovered it was easy to correlate most functions.
Both activities must "Satisfy Client", the higher order function. Answering "How?" resulted in the two parallel paths. The starting functions became "Express Wants/Needs" in Design which is analogous to "Gather Information" in VE.
Also, "Design Project (Preliminary)" is similar to "Create Ideas". "Define Criteria" is the in-between step in Design; 'Analyze Functions" fits there also (see shading) in the VE critical path. But are they analogs of one another?
Dick Park's words suggest that they are. I f Functions do create chaos (to breakdown the problem to its elements) then that chaos resembles most surely the chaos that occurs during the criteria development phase of design. Both are chaotic times; both are abstract thinking periods when boundaries are contracted around the wants and needs of the clients.
To do VE without this chaotic phase of Function Analysis is to miss the creative grappling with the clients requirements. To jump from 'Gather Information' to "Create Ideas" (skipping "Analyze Functions") is to blindly accept the solutions of the designers as the starting point of the VE study.
To miss Functions and FAST is to limit the creative potential of the VE team, not allowing them to return to the seminal ideas that created the project under study. That creative process, that hard work, is vital. We need to let the chaos break the Information Phase paradigm and allow the Creative Phase to build a new paradigm.
How? Why?
Design Project FAST
StUjf CHcat Project
Des If • Project
Sorlew Da%B
D « if ll Project
VE Study FAST
SatkfT CUcst
I - l Ide
Develop Ideu
Evalaalc Idem
Create Idea
Critcrii WaaUMcca*
FtnclioM Getter
Ik fonMl iaa
Figure 1 Chaos Is Required in VE.
VALUE WORLD, Volume XVII, Number 2, May 1994
44
Thunder: Grunts of the Every Day World
Thomas R. King, CVS, F S A V E
Recently, I felt a closeness for the grunts of the working world, 'rise term grain is meant favorably and totally. I am talking about a Steady Eddie or Steadfast Edith, who plods along doing what the beautiful people might perceive as routine and mundane tasks, with very little exposure and credit. This appreciation for grunts occurred in but a single afternoon.
A co-worker from another division dropped into my office with an inquiry. George-the-Grunt. He was disappointed at the frequent absence of participants from scheduled meetings, particularly those in higher offices. I suggested that busy schedules might be a factor. With a wistful composed smile, as only a Romanian can, he went on. "You know," he started, "When I was a student in Romania I was in a political science class. The teacher's method of operation was to assign night work followed up by oral quizzes on the assigned material."
Grading was tough and carried much penalty for those who were unprepared. But there was saving grace. At the beginning of the period, one could opt out of the day's quizzes with a minimally valid excuse, such as: "Feeling a little poorly, up late delivering a new born calf, up early milking the cows, or jilted by a friend."
As the course got further into the semester, instead of the normal two or three who opted out earlier, the number climbed to about half the class. Amused at the trend, the teacher folded his hands, wistfully smiled as only a Romanian can, and said, "Stupid must be the person who cannot find an excuse." I'm sure George related this to make a point about executive commitment and did so effectively. Then, he continued with what Paul Harvey would say is the rest of the story.
He said most Europeans have been fairly common folk, predictable over the years. Yet, Napoleon took his troops all the way to Moscow almost unimpeded. Caesar took his legions great distances in establishing the Roman Empire. And Alexander the Great took his followers all the way victorious to Mesopotamia.
And what was the difference between these French, Italian and Greek warriors and their countrymen of later times'? Leadership with a capital L.
I was impressed. George spoke eloquently with purpose; and here I was unable to pronounce Mesopotamia without the word curling around my Pennsylvania Dutch tongue. Exit George.
Later that afternoon while walking* through the company parking lot, a truck pulled into the lot. A pot bellied man, who obviously had not missed many meals, climbed out of his pickup. The temperature was about 30 degrees, and his tee shirt noticeably terminated about 3 curved inches above his navel. I said "Hi", thinking that good help must be hard to come by these days as I continued toward the plant. In ten minutes I returned by the same route and found the man sitting flat on the cold ground changing a tire. He was not an employee, but a passerby experiencing tire trouble.
He smiled at me and said a cheery hello; He related that his truck had a bad shimmy and in checking he found a bubble on a front tire. Incidentally, lie now braved the cold in a flannel shirt. Standing there in my trendy London Fog trench coat, I felt a pang of discomfort, not only for judging him earlier, but for judging him at all.
Here was a person, a grunt to be sure, with a beat up old truck, short on presentable clothes, having the misfortune of a ruined tire, and yet in high spirits. In contrast, I but a day earlier had bemoaned a 1-inch wide circular streak on the windshield of my sparkling Buick LeSabre that impeded my vision. Having had a succession of brand new cars, would I even know what a jack or spare tire looked like? How pleasant would I be under similar circumstances? A little more introspection would add much. Maybe I ' l l strive for more humility in my daily affairs.
Mr. King is a SAVE Past President and with Joy Technology, Inc. in Franklin, Pennsylvania.
VAlUf WORLD. Volumo XVII, Number 2, May 1994
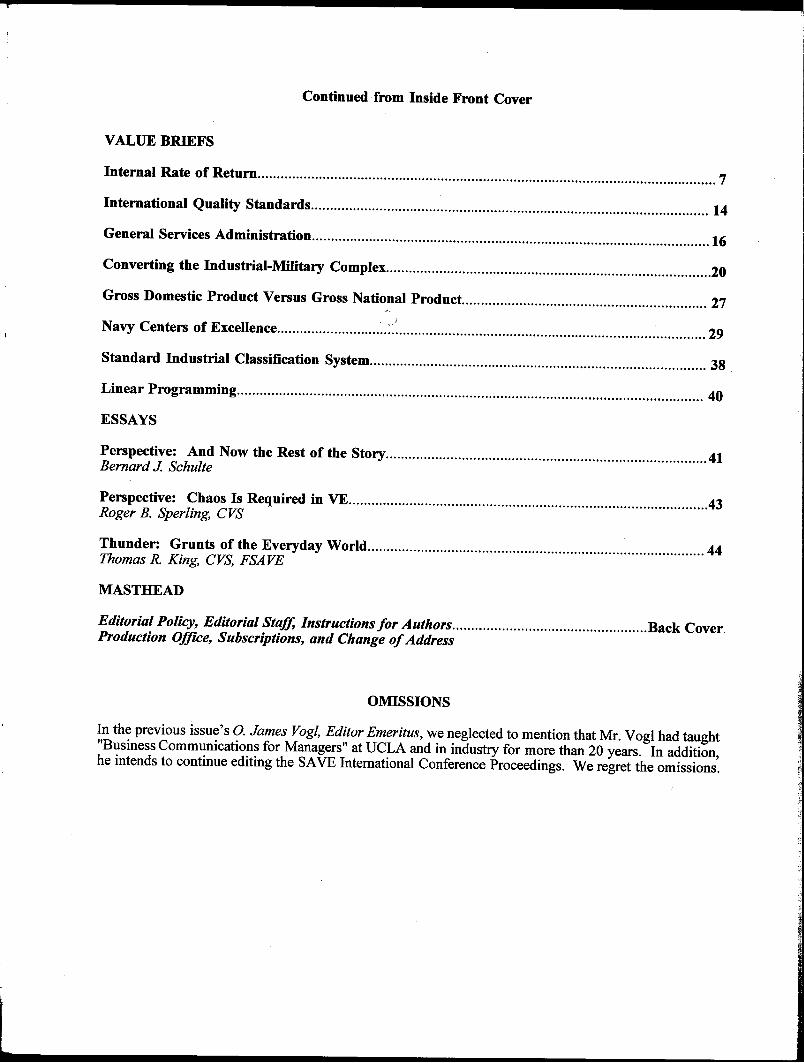
Continued from Inside Front Cover
VALUE BRIEFS
Internal Rate of Return
International Quality Standards
General Services Administration
Converting the Industrial-Military Complex.
..7
14
16
20
Gross Domestic Product Versus Gross National Product 27
Navy Centers of Excellence 29
Standard Industrial Classification System 3 8
Linear Programming 4 Q
ESSAYS
Perspective: And Now the Rest of the Story 4 1
Bernard J. Schulte
Perspective: Chaos Is Required in VE.. 4 3
Roger B. Sperling, CVS
Thunder: Grunts of the Everyday World 44 Thomas R. King, CVS, FSAVE
MASTHEAD
Editorial Policy, Editorial Staff, Instructions for Authors Back Cover Production Office, Subscriptions, and Change of Address
OMISSIONS
In the previous issue's O. James Vogl, Editor Emeritus, we neglected to mention that Mr. Vogl had taught "Business Communications for Managers" at UCLA and in industry for more than 20 years In addition he intends to continue editing the SAVE International Conference Proceedings. We regret the omissions'

VALUE WORLD VALUE WORLD is published three times a year by the Society of American Value Engineers in the months of January, May, and September, and is distributed internationally.
EDITORIAL POLICY
VALUE WORLD welcomes original articles on value engineering and related disciplines. Reprints or abstracts of articles from other journals and periodicals arc acceptable provided that prior permission has been obtained from the original publishers. VALUE WORLD'S policy is to provide the medium tor contributors to express themselves professionally on advances in the state-of-the art. The views expressed in VALUE WORLD arc neither approved nor disapproved by the Society of American Value Engineers.
EDITORIAL STAFF
Editor-in-Chief: Jack V. Michaels, Ph.D, PE, CVS Editor Emeritus: O. James Vogl, CVS, FSAVE Associate Editors: Harold J. Heydt, CVS; Del L. Younker, CVS, CCE Production Editor: Doris J. Huston Contributing Editors: Construction: Rex ( j . Wood. CVS
Education: Theodore C. Fowler, CVS Finance: Jeffrey L. Van Atten, CVS Industry: Thomas W. Warwick, CVS International: William F.Lenzer, CVS Marketing: Stephen J. Kirk, Ph.D, AIA, CVS' Membership: Eugene A. Dcgenhart, PE, CVS Service: Alfred I . Paley, CVS At Large: Thomas R. King, CVS, FSAVE: Joseph V. Lambert, CVS; Arthur W. Schwartz, AIA, CVS,
Ginger R. Willingham CVS: Larry W. Zimmerman, PE, CVS, FSAVE
INSTRUCTIONS FOR AUTHORS
Articles may be submitted in hard copy or computer diskette (3.5" or 5.25") in IBM and Word Perfect or Microsoft Word compatible format Artwork should be camera-ready. The lead lime for publishing articles in any given issue is three months. Forward papers to the Editor-in-Chief at the Production Office address along with permission to publish the papers by the copyright owner if required. Include your full name, home address and telephone number, your title, affiliation, and affiliation address and telephone number.
PRODUCTION OFFICE
VALUE WORLD Telephone: (407) 382-0289 3515 Idle Hour Drive Facsimile: (407)382-6291 Orlando, Fl. 32822-3037
SUBSCRIPTIONS: A yearly subscription for SAVE members is included in the annual dues, 'fhe yearly rate for nonmembers in the U.S. is $75.00; international $100.00 including airmail postage.
(TIANUE OF ADDRESS: Send address changes lo VALUE WORLD. 60 Revere Drive, Suite 500, Northbrook, I I . 60062.
Copy right©1994 by the Society of American Value Engineers. All rights reserved.
Society of American Value Engineers BULK RATE
60 Revere Drive, Suite 500 VJS. Postage Northbrook, I L 60062 P A , D
Orlando, FL ADDRESS C O R R E C T I O N R E Q U E S T E D Permit* 3056
T h e o d o r e C. F o w l e r CUS
F o w l e r & U h i t e s t o n e ,::;U3 W e d d i n q t o n D r i u e
D a y t o n OH 4 5 4 2 6
21 4 4