Valley Ag Software Newsletter - vas.com · Specifically for VAS, 2012 has been a year of pushing...
13
Page 1 Valley Ag Software Newsletter Fourth Quarter 2012 – Number 31 Contents Overview ..................................................................................................................................... 1 Extended Support Hours ............................................................................................................. 2 World Ag Expo ........................................................................................................................... 2 BREDSUM – Colors, Lines and Numbers.................................................................................. 3 Additional Options in Protocols (Alter\7) ................................................................................... 7 Parlor Summary Trends Now Internal to DC305........................................................................ 7 Using Types 127, 128, 129 to Reflect Energy-Corrected Milk (ECM) Projections .................. 7 User Management and Activity Logging .................................................................................... 9 Pocket Cowcard Development [From the Programmers’ Corner] ............................................ 12 Overview As I read over last year’s newsletter, I realize that this year is somewhat similar. Some in the dairy industry are struggling and regional milk and feed price differences are making business difficult, especially in California. Dairymen in other areas have said that there is slow recovery going on. The rest of the world has not been exempt from this pressure. Some areas of Western Europe have had a lower milk price than California for at least part of the year. At least the early winter indications look like more crop land is getting rain. We all hope that will continue. Specifically for VAS, 2012 has been a year of pushing forward with many projects to get them to completion. We’re making many improvements in Pocket Cow Card. We are spending considerable time developing and preparing for the new mobile world we live in. We have converted most of Pocket Cowcard to Android and have many users working with us to test and improve it. We have a limited version of Pocket Cowcard on iOS devices (iPhone and iPad) under development, now in the hands of early testers, and this year expect to continue making great strides in developing Dairy Comp interfaces for those mobile platforms, with applications targeted to both dairyman and consultants.. (See PCC Development on page 12.) Dairy Comp 305, Version 8, is now on many dairies not only in the US, but throughout the world. It has been well received. We feel lucky we have been able to continue to grow. We continue to increase staff to provide the best support possible and improve our products to meet the needs not just for today but also for tomorrow.
Transcript of Valley Ag Software Newsletter - vas.com · Specifically for VAS, 2012 has been a year of pushing...
Page 1
Valley Ag Software Newsletter Fourth Quarter 2012 – Number 31
Contents Overview ..................................................................................................................................... 1 Extended Support Hours ............................................................................................................. 2 World Ag Expo ........................................................................................................................... 2 BREDSUM – Colors, Lines and Numbers.................................................................................. 3 Additional Options in Protocols (Alter\7) ................................................................................... 7 Parlor Summary Trends Now Internal to DC305........................................................................ 7 Using Types 127, 128, 129 to Reflect Energy-Corrected Milk (ECM) Projections .................. 7 User Management and Activity Logging .................................................................................... 9 Pocket Cowcard Development [From the Programmers’ Corner] ............................................ 12
Overview As I read over last year’s newsletter, I realize that this year is somewhat similar. Some in the dairy industry are struggling and regional milk and feed price differences are making business difficult, especially in California. Dairymen in other areas have said that there is slow recovery going on. The rest of the world has not been exempt from this pressure. Some areas of Western Europe have had a lower milk price than California for at least part of the year. At least the early winter indications look like more crop land is getting rain. We all hope that will continue. Specifically for VAS, 2012 has been a year of pushing forward with many projects to get them to completion. We’re making many improvements in Pocket Cow Card. We are spending considerable time developing and preparing for the new mobile world we live in. We have converted most of Pocket Cowcard to Android and have many users working with us to test and improve it. We have a limited version of Pocket Cowcard on iOS devices (iPhone and iPad) under development, now in the hands of early testers, and this year expect to continue making great strides in developing Dairy Comp interfaces for those mobile platforms, with applications targeted to both dairyman and consultants.. (See PCC Development on page 12.) Dairy Comp 305, Version 8, is now on many dairies not only in the US, but throughout the world. It has been well received. We feel lucky we have been able to continue to grow. We continue to increase staff to provide the best support possible and improve our products to meet the needs not just for today but also for tomorrow.
Page 2
Extended Support Hours We have extended our regular technical support hours to better serve our customers throughout the United States and the world. Our regular support hours are now from 6:00am to 5:00pm Pacific time Monday through Friday. The VAS administrative office will remain on an 8:00am to 5:00pm Pacific time schedule. We can’t wait to hear from you! Contact us at (559) 686-9946 or (888) 225-6753 or [email protected]. Helpful hint: If you need technical support and it is not urgent, please make an appointment. You can call or email us ahead of time, let us know the scope or nature of your support need so that one of our Support Specialists will contact you at the selected time to make the changes needed.
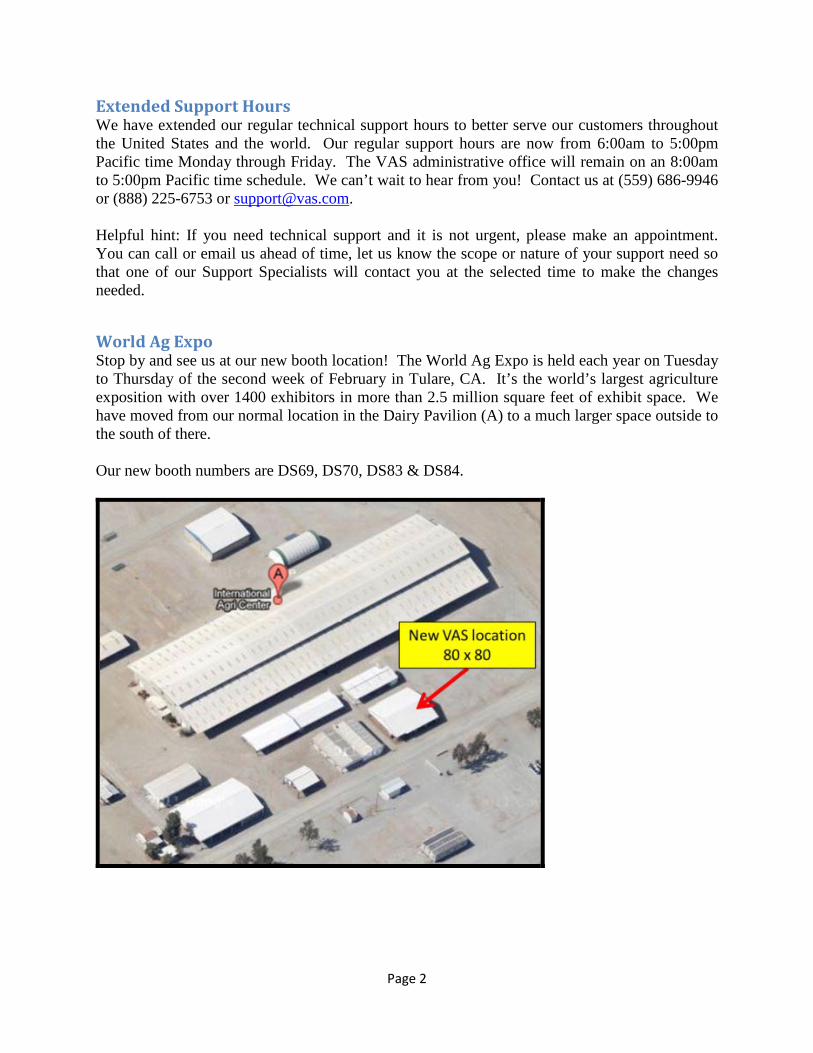
World Ag Expo Stop by and see us at our new booth location! The World Ag Expo is held each year on Tuesday to Thursday of the second week of February in Tulare, CA. It’s the world’s largest agriculture exposition with over 1400 exhibitors in more than 2.5 million square feet of exhibit space. We have moved from our normal location in the Dairy Pavilion (A) to a much larger space outside to the south of there. Our new booth numbers are DS69, DS70, DS83 & DS84.
Page 3
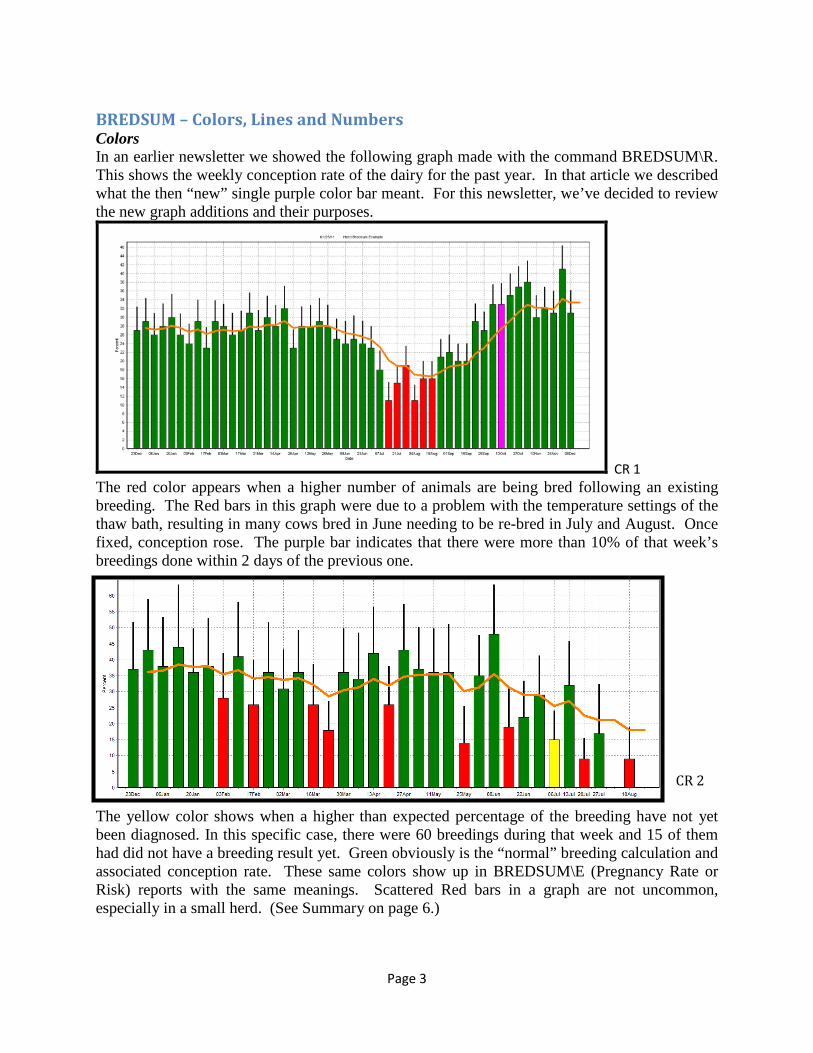
BREDSUM – Colors, Lines and Numbers Colors In an earlier newsletter we showed the following graph made with the command BREDSUM\R. This shows the weekly conception rate of the dairy for the past year. In that article we described what the then “new” single purple color bar meant. For this newsletter, we’ve decided to review the new graph additions and their purposes.
CR 1 The red color appears when a higher number of animals are being bred following an existing breeding. The Red bars in this graph were due to a problem with the temperature settings of the thaw bath, resulting in many cows bred in June needing to be re-bred in July and August. Once fixed, conception rose. The purple bar indicates that there were more than 10% of that week’s breedings done within 2 days of the previous one.
CR 2
The yellow color shows when a higher than expected percentage of the breeding have not yet been diagnosed. In this specific case, there were 60 breedings during that week and 15 of them had did not have a breeding result yet. Green obviously is the “normal” breeding calculation and associated conception rate. These same colors show up in BREDSUM\E (Pregnancy Rate or Risk) reports with the same meanings. Scattered Red bars in a graph are not uncommon, especially in a small herd. (See Summary on page 6.)
Page 4
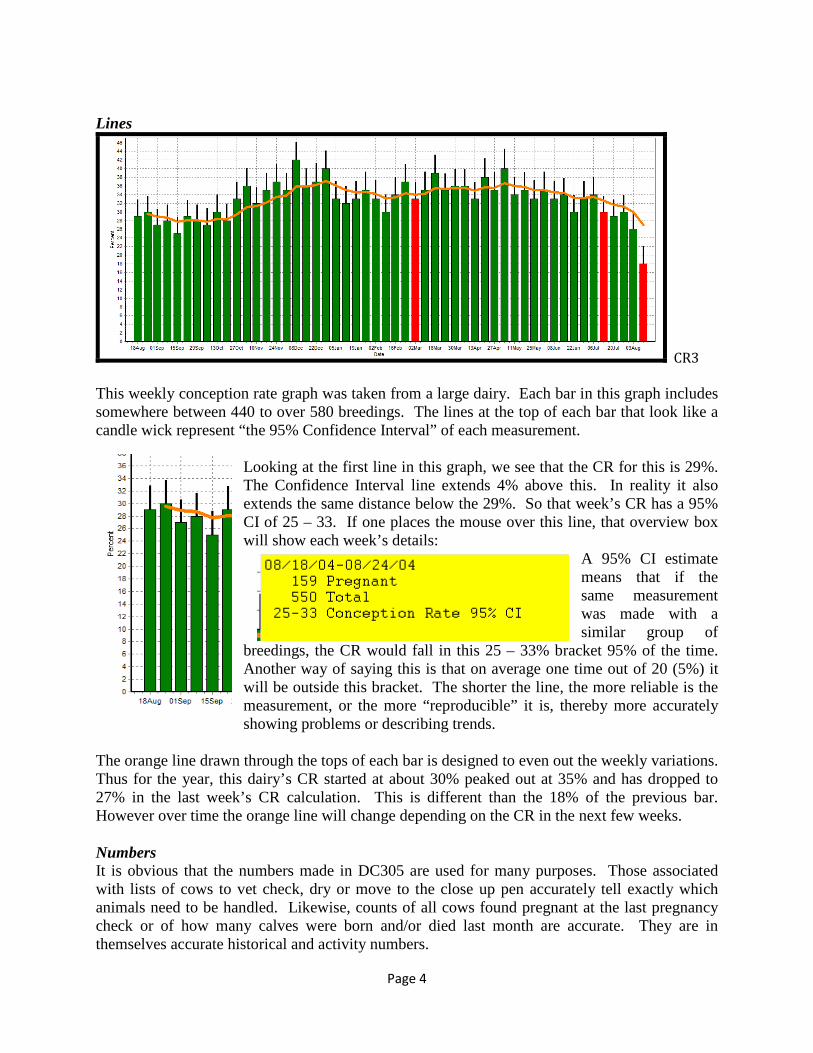
Lines
CR3 This weekly conception rate graph was taken from a large dairy. Each bar in this graph includes somewhere between 440 to over 580 breedings. The lines at the top of each bar that look like a candle wick represent “the 95% Confidence Interval” of each measurement.
Looking at the first line in this graph, we see that the CR for this is 29%. The Confidence Interval line extends 4% above this. In reality it also extends the same distance below the 29%. So that week’s CR has a 95% CI of 25 – 33. If one places the mouse over this line, that overview box will show each week’s details:
A 95% CI estimate means that if the same measurement was made with a similar group of
breedings, the CR would fall in this 25 – 33% bracket 95% of the time. Another way of saying this is that on average one time out of 20 (5%) it will be outside this bracket. The shorter the line, the more reliable is the measurement, or the more “reproducible” it is, thereby more accurately showing problems or describing trends.
The orange line drawn through the tops of each bar is designed to even out the weekly variations. Thus for the year, this dairy’s CR started at about 30% peaked out at 35% and has dropped to 27% in the last week’s CR calculation. This is different than the 18% of the previous bar. However over time the orange line will change depending on the CR in the next few weeks. Numbers It is obvious that the numbers made in DC305 are used for many purposes. Those associated with lists of cows to vet check, dry or move to the close up pen accurately tell exactly which animals need to be handled. Likewise, counts of all cows found pregnant at the last pregnancy check or of how many calves were born and/or died last month are accurate. They are in themselves accurate historical and activity numbers.
Page 5
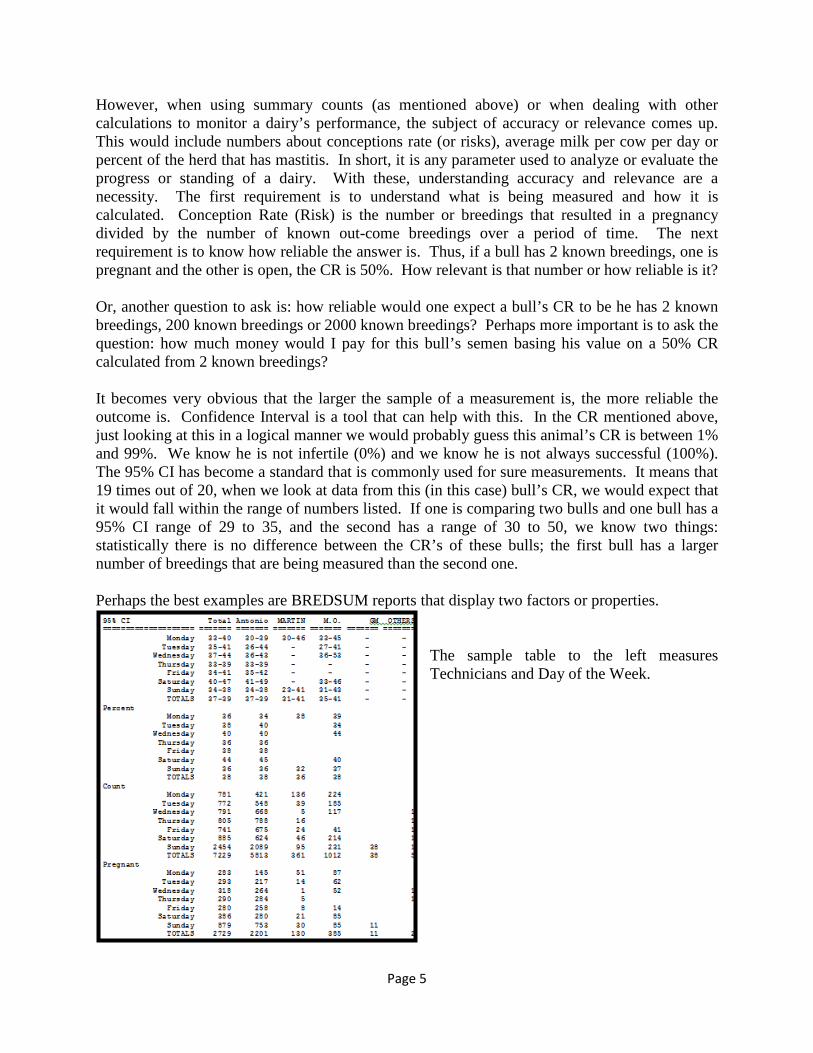
However, when using summary counts (as mentioned above) or when dealing with other calculations to monitor a dairy’s performance, the subject of accuracy or relevance comes up. This would include numbers about conceptions rate (or risks), average milk per cow per day or percent of the herd that has mastitis. In short, it is any parameter used to analyze or evaluate the progress or standing of a dairy. With these, understanding accuracy and relevance are a necessity. The first requirement is to understand what is being measured and how it is calculated. Conception Rate (Risk) is the number or breedings that resulted in a pregnancy divided by the number of known out-come breedings over a period of time. The next requirement is to know how reliable the answer is. Thus, if a bull has 2 known breedings, one is pregnant and the other is open, the CR is 50%. How relevant is that number or how reliable is it? Or, another question to ask is: how reliable would one expect a bull’s CR to be he has 2 known breedings, 200 known breedings or 2000 known breedings? Perhaps more important is to ask the question: how much money would I pay for this bull’s semen basing his value on a 50% CR calculated from 2 known breedings? It becomes very obvious that the larger the sample of a measurement is, the more reliable the outcome is. Confidence Interval is a tool that can help with this. In the CR mentioned above, just looking at this in a logical manner we would probably guess this animal’s CR is between 1% and 99%. We know he is not infertile (0%) and we know he is not always successful (100%). The 95% CI has become a standard that is commonly used for sure measurements. It means that 19 times out of 20, when we look at data from this (in this case) bull’s CR, we would expect that it would fall within the range of numbers listed. If one is comparing two bulls and one bull has a 95% CI range of 29 to 35, and the second has a range of 30 to 50, we know two things: statistically there is no difference between the CR’s of these bulls; the first bull has a larger number of breedings that are being measured than the second one. Perhaps the best examples are BREDSUM reports that display two factors or properties.
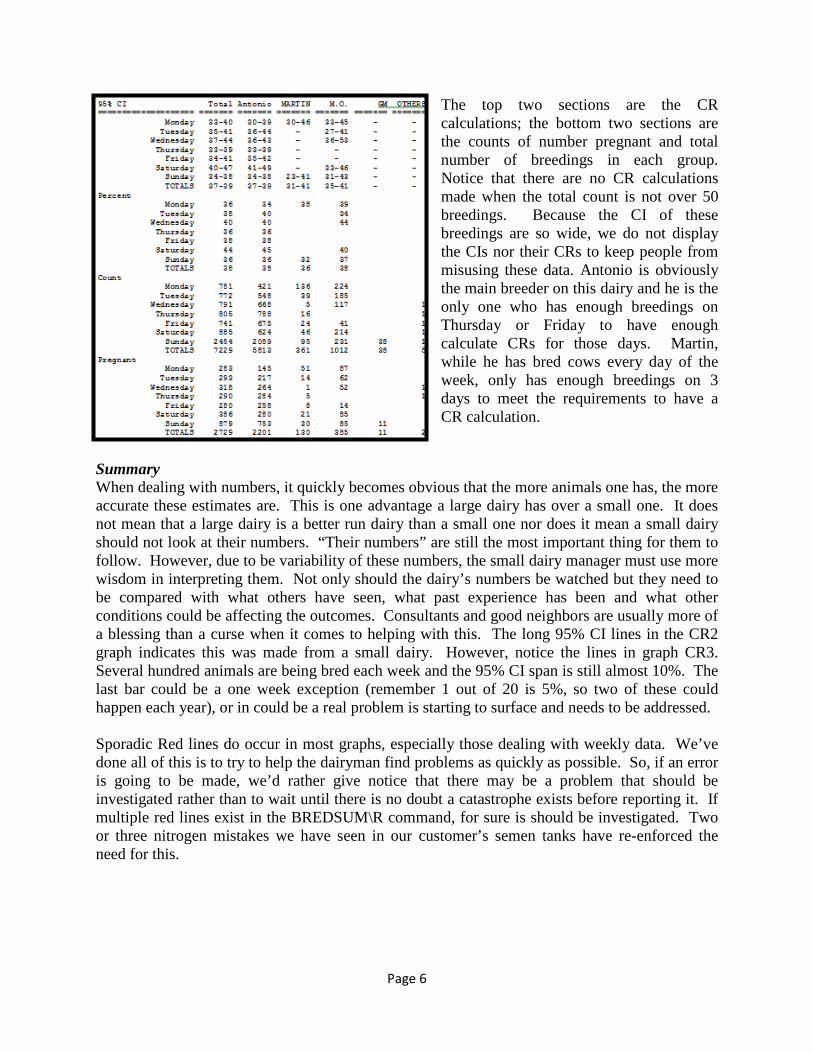
The sample table to the left measures Technicians and Day of the Week.
Page 6
The top two sections are the CR calculations; the bottom two sections are the counts of number pregnant and total number of breedings in each group. Notice that there are no CR calculations made when the total count is not over 50 breedings. Because the CI of these breedings are so wide, we do not display the CIs nor their CRs to keep people from misusing these data. Antonio is obviously the main breeder on this dairy and he is the only one who has enough breedings on Thursday or Friday to have enough calculate CRs for those days. Martin, while he has bred cows every day of the week, only has enough breedings on 3 days to meet the requirements to have a CR calculation.
Summary When dealing with numbers, it quickly becomes obvious that the more animals one has, the more accurate these estimates are. This is one advantage a large dairy has over a small one. It does not mean that a large dairy is a better run dairy than a small one nor does it mean a small dairy should not look at their numbers. “Their numbers” are still the most important thing for them to follow. However, due to be variability of these numbers, the small dairy manager must use more wisdom in interpreting them. Not only should the dairy’s numbers be watched but they need to be compared with what others have seen, what past experience has been and what other conditions could be affecting the outcomes. Consultants and good neighbors are usually more of a blessing than a curse when it comes to helping with this. The long 95% CI lines in the CR2 graph indicates this was made from a small dairy. However, notice the lines in graph CR3. Several hundred animals are being bred each week and the 95% CI span is still almost 10%. The last bar could be a one week exception (remember 1 out of 20 is 5%, so two of these could happen each year), or in could be a real problem is starting to surface and needs to be addressed. Sporadic Red lines do occur in most graphs, especially those dealing with weekly data. We’ve done all of this is to try to help the dairyman find problems as quickly as possible. So, if an error is going to be made, we’d rather give notice that there may be a problem that should be investigated rather than to wait until there is no doubt a catastrophe exists before reporting it. If multiple red lines exist in the BREDSUM\R command, for sure is should be investigated. Two or three nitrogen mistakes we have seen in our customer’s semen tanks have re-enforced the need for this.
Page 7
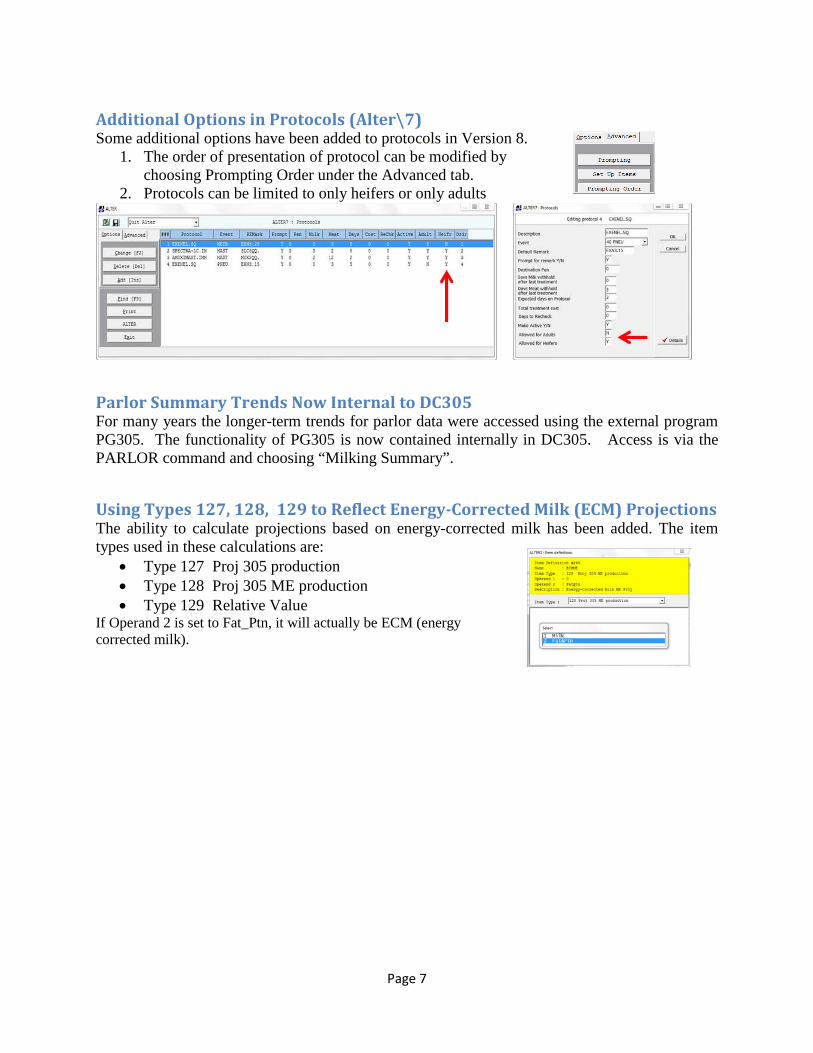
Additional Options in Protocols (Alter\7) Some additional options have been added to protocols in Version 8.
1. The order of presentation of protocol can be modified by choosing Prompting Order under the Advanced tab.
2. Protocols can be limited to only heifers or only adults
Parlor Summary Trends Now Internal to DC305 For many years the longer-term trends for parlor data were accessed using the external program PG305. The functionality of PG305 is now contained internally in DC305. Access is via the PARLOR command and choosing “Milking Summary”.
Using Types 127, 128, 129 to Reflect Energy-Corrected Milk (ECM) Projections The ability to calculate projections based on energy-corrected milk has been added. The item types used in these calculations are:
• Type 127 Proj 305 production • Type 128 Proj 305 ME production • Type 129 Relative Value
If Operand 2 is set to Fat_Ptn, it will actually be ECM (energy corrected milk).
Page 8
Updating Component-Related Production Data from TestDay DNL Many of the testing organizations can calculate projections based on fat and protein. Often this information will be included in the downloaded testday DNL file. VAS can make this information available with DC305. Typically it will require the use of a version 8 cowfile. Contact VAS for assistance in setting up these items.
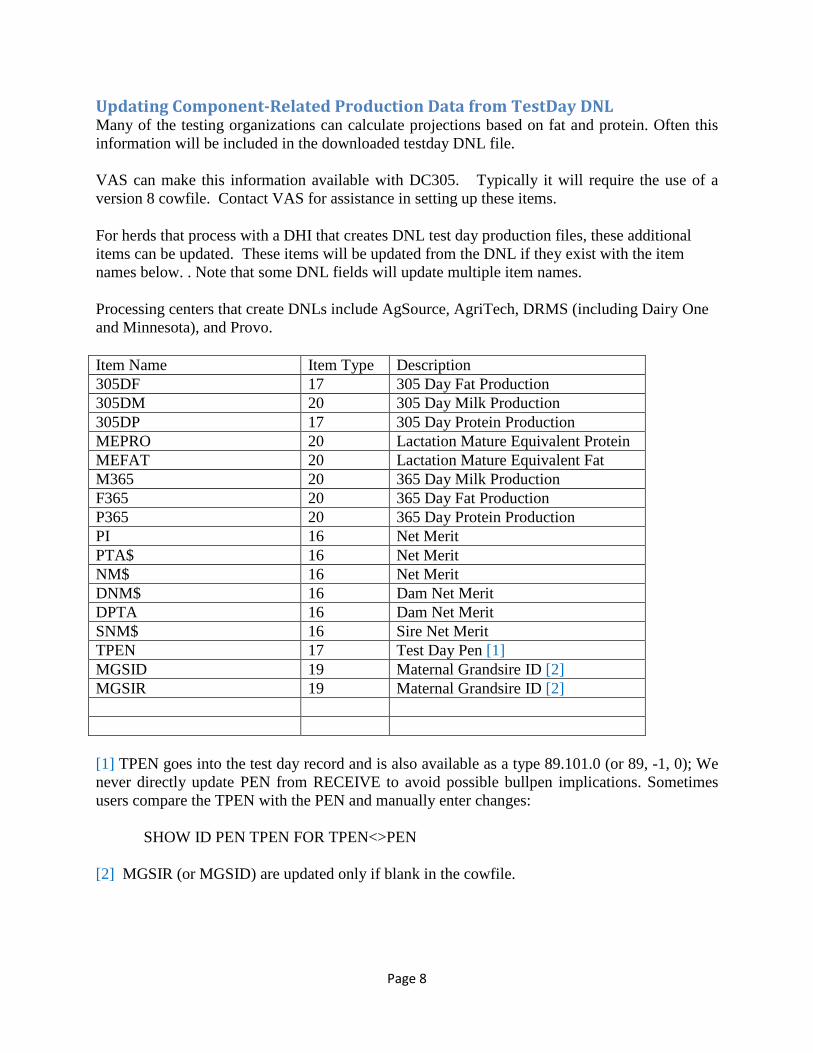
For herds that process with a DHI that creates DNL test day production files, these additional items can be updated. These items will be updated from the DNL if they exist with the item names below. . Note that some DNL fields will update multiple item names.
Processing centers that create DNLs include AgSource, AgriTech, DRMS (including Dairy One and Minnesota), and Provo.
Item Name Item Type Description 305DF 17 305 Day Fat Production 305DM 20 305 Day Milk Production 305DP 17 305 Day Protein Production MEPRO 20 Lactation Mature Equivalent Protein MEFAT 20 Lactation Mature Equivalent Fat M365 20 365 Day Milk Production F365 20 365 Day Fat Production P365 20 365 Day Protein Production PI 16 Net Merit PTA$ 16 Net Merit NM$ 16 Net Merit DNM$ 16 Dam Net Merit DPTA 16 Dam Net Merit SNM$ 16 Sire Net Merit TPEN 17 Test Day Pen [1] MGSID 19 Maternal Grandsire ID [2] MGSIR 19 Maternal Grandsire ID [2] [1] TPEN goes into the test day record and is also available as a type 89.101.0 (or 89, -1, 0); We never directly update PEN from RECEIVE to avoid possible bullpen implications. Sometimes users compare the TPEN with the PEN and manually enter changes:
SHOW ID PEN TPEN FOR TPEN<>PEN
[2] MGSIR (or MGSID) are updated only if blank in the cowfile.
Page 9
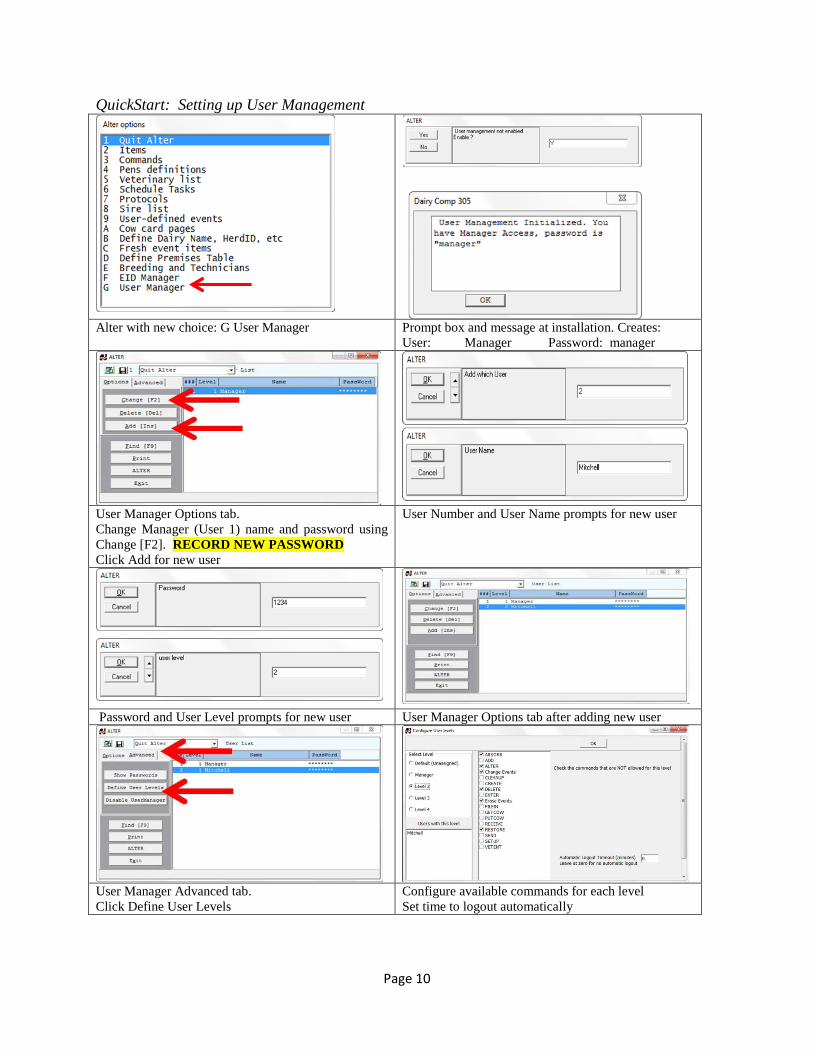
User Management and Activity Logging Recently we have received requests from dairy managers to better monitor and control the use of the program by employees. The “User Manager” is our response to those requests. The User Manager is an optional program feature. Once set up, a list of users can be created, and these users can be assigned to groups (user levels) for which certain commands can be disabled. For example, some users can be kept from using ENTER or ALTER. One person is assigned to the “Manager” level, and can define the users and levels. Once that is done, individual users must use the LOGIN command, with a password, to use the program. Any time a user logs in (LOGIN) or logs out (LOGOUT) it is recorded in the Activity Log, so managers can see who may have been using the program at certain times. Setting up the User Manager Use the ALTER command and select “User Manager”. The first time this is run, it creates a single user named “Manager” who has full control of the user manager. At this point we recommend you change the name of the Manager and assign a better password than the default “manager”. Write this manager password down and keep in a safer place (safer than a Post-It note stuck to the monitor). From here, the interface looks like the rest of ALTER, where you can Add users, Change them, Delete them, and configure the User Levels. Each user, when added, is assigned to some User Level, which is often level zero. Level Zero is the default level used when no one is logged in to the program. If your goal is to simply know who is using the program and when, then simply create users, assign them passwords, and have them LOGIN and LOGOUT as needed. If your goal is to restrict some commands from certain users, then you want to define at least one “User Level”, assign users to those levels, and check off the commands that that are not allowed for those users. The simplest way to use the User Manager is to select the restricted commands for level zero. Since level zero is in effect for anyone who is not logged in as the Manager, you would not even need to add any user names, just set up the restrictions for level zero.
Page 10
QuickStart: Setting up User Management
Alter with new choice: G User Manager Prompt box and message at installation. Creates: User: Manager Password: manager
User Manager Options tab. Change Manager (User 1) name and password using Change [F2]. RECORD NEW PASSWORD Click Add for new user
User Number and User Name prompts for new user
Password and User Level prompts for new user User Manager Options tab after adding new user
User Manager Advanced tab. Click Define User Levels
Configure available commands for each level Set time to logout automatically
Page 11
User and level notes • Up to 255 users can be defined. • There is always one special user, the Manager (User #1), created the first time the User
Manager is run. The default name (Manager) and password (“manager”) should be changed. The manager cannot be deleted and is always Level 1.
• There are up to five levels available, with the ability to customize each level to allow or deny access to program commands and assign individual users to each level.
o Level 0 is the "default level" and is used for unassigned users. Any user added without an assigned level is level 0. Additionally, when no one is logged in, such as at program startup, the current level is zero. Restrictions (disables) for level zero can be optionally defined.
o Level 1 is a special level: The Manager level. It is the one level that has no restrictions and no option exist to create disables for the Manager. Only someone with Manager level can use ALTER to change the User Manager settings.
o There are three more levels for now (Level 2, 3 and 4). • User Manager works for DCClients, but is not yet fully functional. We are working on it
and a full feature set will be available at some point. • Potentially a curious person could end up setting this up, and later you then decide you
want to remove all the user management features. To do this, run ALTER-User manager (with manager access) and on the Advanced tab, click the "Disable User Manager" button.
• The User Manager operates on a program wide level, and is not specific to any cowfile. • The user level restrictions only affect commands manually entered into the program by a
user. Incoming transactions from PCC, or clients, are not affected by the restrictions on the currently logged in user.
Page 12
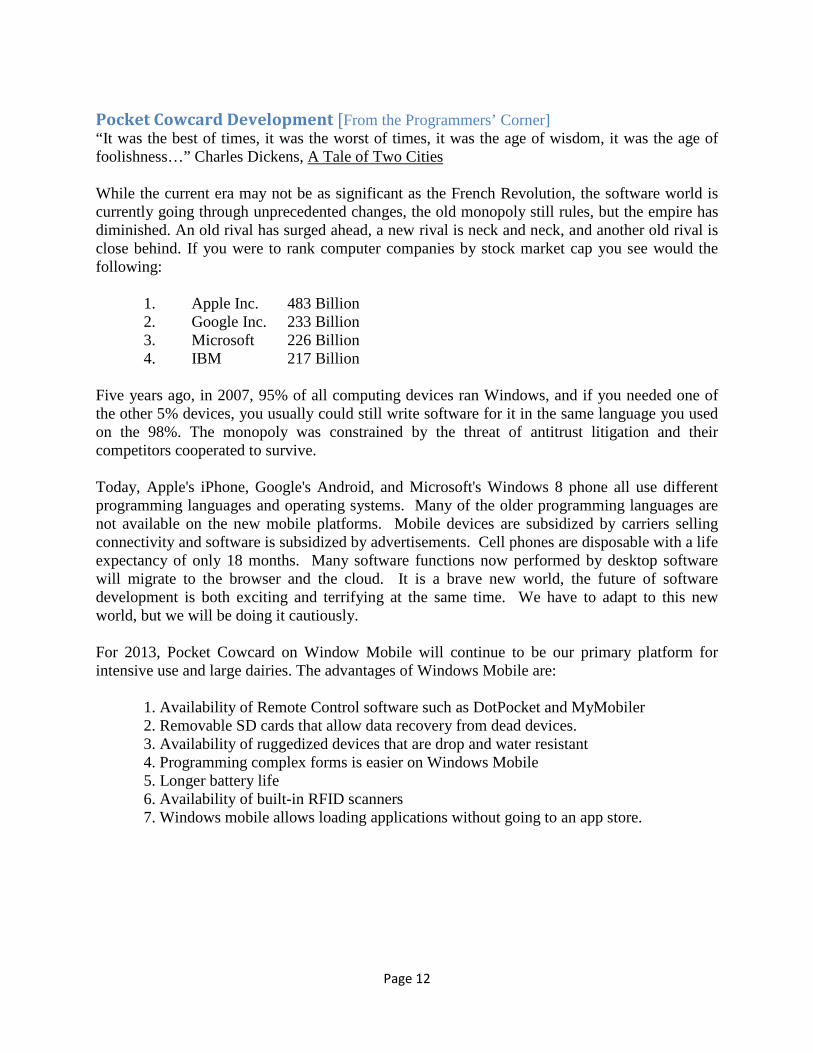
Pocket Cowcard Development [From the Programmers’ Corner] “It was the best of times, it was the worst of times, it was the age of wisdom, it was the age of foolishness…” Charles Dickens, A Tale of Two Cities While the current era may not be as significant as the French Revolution, the software world is currently going through unprecedented changes, the old monopoly still rules, but the empire has diminished. An old rival has surged ahead, a new rival is neck and neck, and another old rival is close behind. If you were to rank computer companies by stock market cap you see would the following:
1. Apple Inc. 483 Billion 2. Google Inc. 233 Billion 3. Microsoft 226 Billion 4. IBM 217 Billion
Five years ago, in 2007, 95% of all computing devices ran Windows, and if you needed one of the other 5% devices, you usually could still write software for it in the same language you used on the 98%. The monopoly was constrained by the threat of antitrust litigation and their competitors cooperated to survive. Today, Apple's iPhone, Google's Android, and Microsoft's Windows 8 phone all use different programming languages and operating systems. Many of the older programming languages are not available on the new mobile platforms. Mobile devices are subsidized by carriers selling connectivity and software is subsidized by advertisements. Cell phones are disposable with a life expectancy of only 18 months. Many software functions now performed by desktop software will migrate to the browser and the cloud. It is a brave new world, the future of software development is both exciting and terrifying at the same time. We have to adapt to this new world, but we will be doing it cautiously. For 2013, Pocket Cowcard on Window Mobile will continue to be our primary platform for intensive use and large dairies. The advantages of Windows Mobile are:
1. Availability of Remote Control software such as DotPocket and MyMobiler 2. Removable SD cards that allow data recovery from dead devices. 3. Availability of ruggedized devices that are drop and water resistant 4. Programming complex forms is easier on Windows Mobile 5. Longer battery life 6. Availability of built-in RFID scanners 7. Windows mobile allows loading applications without going to an app store.
Page 13
For 2013, Pocket Cowcard on Android will be our secondary platform recommended for less intensive tasks, smaller dairies and as a secondary device. The advantages of Android are 1. Device Availability, over 500 million Android devices have been activated. 2. Communications speed and reliability, herd refresh tends to be much faster on Android. 3. Stylus free operation 4. Voice cow id entry 5. Android allows “side loading” of applications without going to an app store.
The Android version of Pocket Cowcard supports cowcard viewing, event entry, to-do lists, pen validation, vet lists and hospital lists. The "batch forms" are not yet supported and RFID scanning is not yet as robust as Windows Mobile.
For 2013, Pocket Cowcard on the iPhone will be our experimental platform. We will be looking for a few die-hard Apple fans with Pocket CowCard experience who are willing to go through the Apple Development Device Provisioning installation process. Our programming staff uniformly agrees that we should proceed with iPhone development although the reasons vary from “the iPhone is the best device ever” to “Apple might win a lawsuit saying they own rounded corners and the color black”.
Advantages of iPhone
1. Only a few product versions to support 2. Simplicity and Quality 3. Availability of drop resistant and water proof cases.
Disadvantages of iPhone 1. No removable SD card – so all entered data lost if hiccup during use 2. No remote control software – so support very difficult if issues 3. Will not interface with a standard Cattle RFID scanner.