VALIDITY OF GARBER MODEL IN PREDICTING PAVEMENT …
13
Kufa Journal of Engineering Vol. 9, No. 2, April 2018, PP. 139-151 Received 11 May 2017, accepted 25 July 2017 VALIDITY OF GARBER MODEL IN PREDICTING PAVEMENT CONDITION INDEX OF FLEXIBLE PAVEMENT IN KERBALA CITY Hussein A. Ewadh 1 , Raid R. A. Almuhanna 2 and Saja J. M. Alasadi 3 1 Former Professor of Civil Engineering, Babylon University, Kerbala, Iraq. Email: [email protected] 2 Lecturer in Civil Engineering, Kerbala University, Kerbala, Iraq. Email: [email protected] 3 Formerly Postgraduate Student in Civil Engineering, Kerbala University, Kerbala, Iraq. Email: [email protected] http://dx.doi.org/10.30572/2018/kje/090211 ABSTRACT Pavement Condition Index (PCI) is one of the important basics in pavement maintenance management system (PMMS), and it is used to evaluate the current and future pavement condition. This importantance in decision making to limit the maintenance needs, types of treatment, and maintenance priority. The aim of this research is to estimate the PCI value for flexible pavement urban roads in the study area (kerbala city) by using Garber et al. developed model. Based on previous researches, data are collected for variables that have a significant impact on pavement condition. Data for pavement age (AGE), average daily traffic (ADT), and structural number (SN) were collected for 44 sections in the network roads. A field survey (destructive test (core test) and laboratory test (Marshall Test)) were used to determine the capacity of structure layer of pavement (SN). The condition index (CI) output from a developed model was compared with the PCI output of PAVER 6.5.7 by using statistical analysis test. The developed model overestimates value of CI rather than PCI estimated from PAVER 6.5.7 due to statistical test to a 95% degree of confidence, (R = 0.771) for 44 sections (arterial and collector). KEYWORDS: Pavement Condition Index (PCI); Garber et al. model; Maintenance model; Flexible pavement; Structural number; Coring test.
Transcript of VALIDITY OF GARBER MODEL IN PREDICTING PAVEMENT …

Kufa Journal of Engineering
Vol. 9, No. 2, April 2018, PP. 139-151 Received 11 May 2017, accepted 25 July 2017
VALIDITY OF GARBER MODEL IN PREDICTING
PAVEMENT CONDITION INDEX OF FLEXIBLE
PAVEMENT IN KERBALA CITY
Hussein A. Ewadh1, Raid R. A. Almuhanna2 and Saja J. M. Alasadi3
1 Former Professor of Civil Engineering, Babylon University, Kerbala, Iraq. Email:
2 Lecturer in Civil Engineering, Kerbala University, Kerbala, Iraq. Email:
3 Formerly Postgraduate Student in Civil Engineering, Kerbala University, Kerbala,
Iraq. Email: [email protected]
http://dx.doi.org/10.30572/2018/kje/090211
ABSTRACT
Pavement Condition Index (PCI) is one of the important basics in pavement maintenance
management system (PMMS), and it is used to evaluate the current and future pavement
condition. This importantance in decision making to limit the maintenance needs, types of
treatment, and maintenance priority. The aim of this research is to estimate the PCI value for
flexible pavement urban roads in the study area (kerbala city) by using Garber et al. developed
model.
Based on previous researches, data are collected for variables that have a significant impact on
pavement condition. Data for pavement age (AGE), average daily traffic (ADT), and structural
number (SN) were collected for 44 sections in the network roads. A field survey (destructive
test (core test) and laboratory test (Marshall Test)) were used to determine the capacity of
structure layer of pavement (SN). The condition index (CI) output from a developed model was
compared with the PCI output of PAVER 6.5.7 by using statistical analysis test.
The developed model overestimates value of CI rather than PCI estimated from PAVER 6.5.7
due to statistical test to a 95% degree of confidence, (R = 0.771) for 44 sections (arterial and
collector).
KEYWORDS: Pavement Condition Index (PCI); Garber et al. model; Maintenance model;
Flexible pavement; Structural number; Coring test.

140 Hussein A. Ewadh et al.
1. INTRODCTION
Maintenance of highway pavement is one of the most important components of the entire road
system and should be accorded due importance. The work dimension for maintenance is very
large, but the funds obtainable are not adequate to identify the needs of maintenance (Shah et
al., 2012). Pavement maintenance management systems (PMMS) is part of pavement
management system (PMS), as shown in Fig. 1. Management of pavement extend a sensible
and cost effective approach to operations of pavement maintenance (Hass et al., 1994). The
PMMS process involves the following steps for a given pavement section: (1) assess present
pavement condition, (2) predict future conditions, (3) conduct an alternatives analysis, and (4)
select an appropriate rehabilitation strategy (Garber et al., 2011).
Fig. 1. Pavement Maintenance Management System (PMMS) and Pavement Management
System (PMS)(Abo –Hashema et al., 2006).
Pavement Condition is “a generic phrase to describe the ability of a pavement to sustain a
certain level of serviceability under given traffic loadings”. The PCI is an evaluation process
that is evaluated in correspondence with steps include in ASTM D 5340, Standard Test
Method for PCI Survey. This procedure is used worldwide to provide a measurement of the
condition of pavements taking into account the functional performance with implications of
structural performance. Determinations of periodic PCI on the same pavement will show the
differences in level of performance with time. Because the PCI procedure is designed to be
objective and repeatable, it can also be used to predict the condition. Table 1 shows the general
description for each pavement condition.

Kufa Journal of Engineering, Vol. 9, No. 2, 2018 141
Table 1. Pavement condition level (Juan and Martinez, 2012).
Condition PCI Range Description
Excellent 86 - 100 No significant distress.
Very Good 71 - 85 Little distress, with the exception of utility patches in good
condition, or slight hairline cracks; may be slightly weathered.
Good 56 - 70 Slight to moderately weathered, slight distress, possibly patching.
Fair 41 - 55 Severely weathered or slight to moderate levels of distress
generally limited to patches and non-load-related cracking.
Poor 26 - 40 Moderate to severe distresses including load-related types, such as
alligator cracking.
Very Poor 11 - 25 Severely distressed or large quantities of distortion or alligator
cracking.
Failed 0 - 10 Failure of the pavement, distress has surpassed tolerable
rehabilitation limits.
2. RELATION AND MODELS OF PCI
Predictions model for maintenance and rehabilitation treatment alternatives are essential for
programming of priority (Hass et al., 2015). When developing the condition prediction models
should be use a valid statistical approach to store a basis for determining the model accuracy
and precision. The most development model uses a regression analysis method, statistical
methods that show the precision of the regression equations are often used. Probably the tests
widely used are the standard error of estimate, the coefficient of determination, correlation
coefficient, the residual analysis, F-test, and other tests are also used (Smith, 1986).
Deterioration modeling for long life pavements notation for flexible pavements requires a
periodic monitoring of surface distresses (APA, 2010) based on a greater probability of
deterioration active in the wearing course than deeper in the structure of pavement, and the fact
that deeper failures also reflect to the surface. As a result, when design criteria are satisfied.
Therefore, after satisfying design criteria, such as reaching limits of cumulative strain,
performance, or deterioration. Then a scheduled maintenance and rehabilitation are needed to
yield the required design life. While design methods like MEPDG (AASHTO, 2008) can be
used to predict deterioration; there is not much evidence to date on their accuracy, especially
over the longer term. There are four basic types of prediction models: purely mechanistic,
mechanistic-empirical, regression based, and subjective.
142 Hussein A. Ewadh et al.
3. GARBER ET AL. MODEL
Garber et al. developed a model depended on a data collected by rating the condition of 20
individual pavement sections. The fitted model describes the deterioration of the pavement
sections as follows (Garber et al., 2011):
CI=98.87– 2.18AGE + 0.02ADT + 0.28SN 1
Where:
CI = condition index.
AGE = number of years since construction.
ADT = average daily traffic in 1000 veh/day.
SN = structural number.
The R2 of this model is equal to (0.973) (Garber et al., 2011).
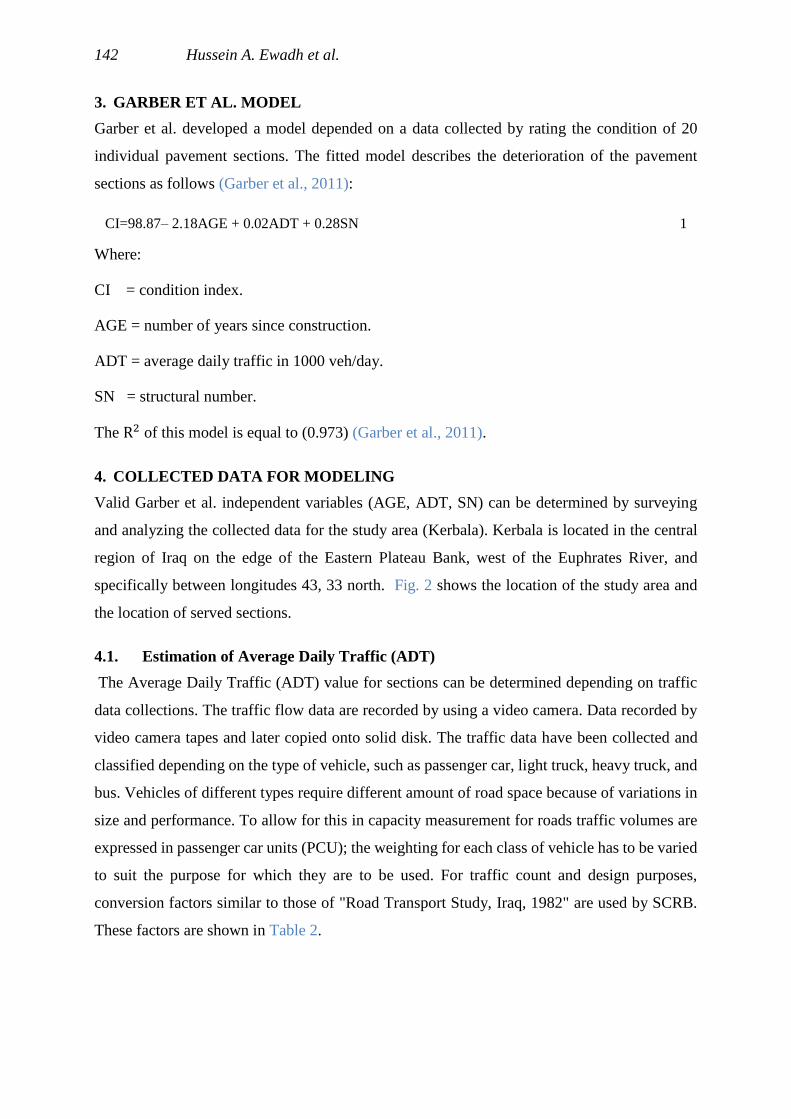
4. COLLECTED DATA FOR MODELING
Valid Garber et al. independent variables (AGE, ADT, SN) can be determined by surveying
and analyzing the collected data for the study area (Kerbala). Kerbala is located in the central
region of Iraq on the edge of the Eastern Plateau Bank, west of the Euphrates River, and
specifically between longitudes 43, 33 north. Fig. 2 shows the location of the study area and
the location of served sections.
4.1. Estimation of Average Daily Traffic (ADT)
The Average Daily Traffic (ADT) value for sections can be determined depending on traffic
data collections. The traffic flow data are recorded by using a video camera. Data recorded by
video camera tapes and later copied onto solid disk. The traffic data have been collected and
classified depending on the type of vehicle, such as passenger car, light truck, heavy truck, and
bus. Vehicles of different types require different amount of road space because of variations in
size and performance. To allow for this in capacity measurement for roads traffic volumes are
expressed in passenger car units (PCU); the weighting for each class of vehicle has to be varied
to suit the purpose for which they are to be used. For traffic count and design purposes,
conversion factors similar to those of "Road Transport Study, Iraq, 1982" are used by SCRB.
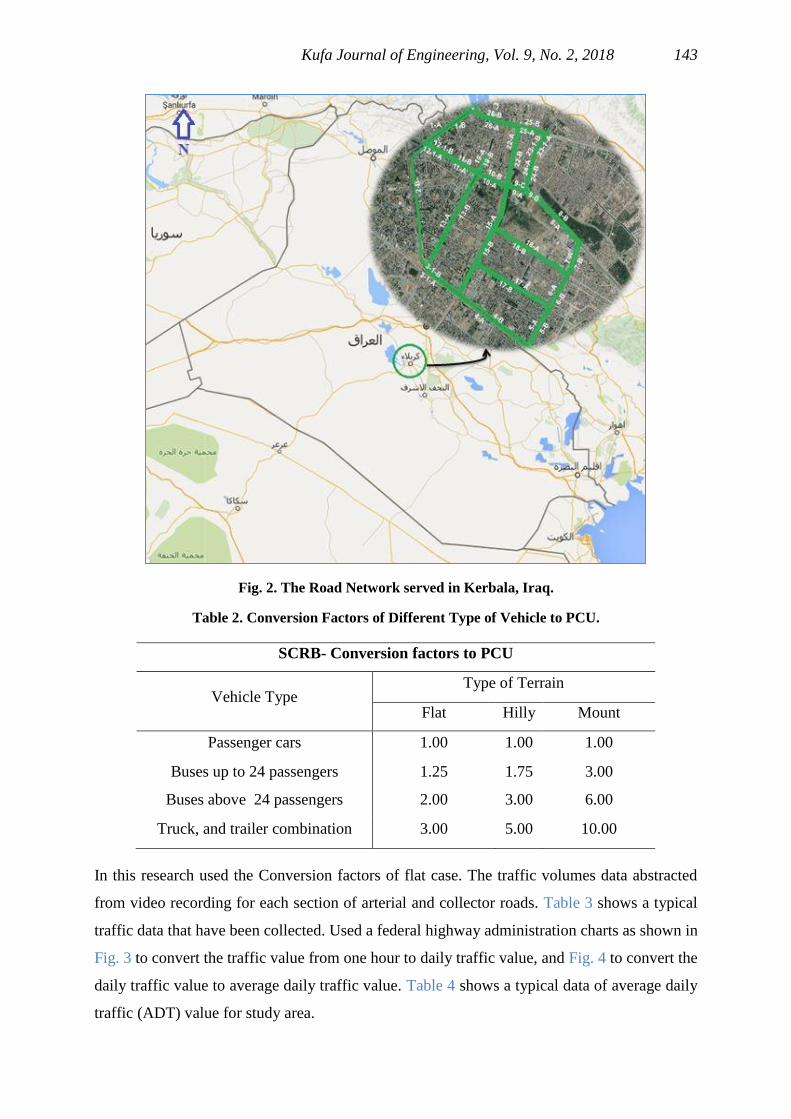
These factors are shown in Table 2.
Kufa Journal of Engineering, Vol. 9, No. 2, 2018 143
Fig. 2. The Road Network served in Kerbala, Iraq.
Table 2. Conversion Factors of Different Type of Vehicle to PCU.
SCRB- Conversion factors to PCU
Vehicle Type Type of Terrain
Flat Hilly Mount
Passenger cars 1.00 1.00 1.00
Buses up to 24 passengers 1.25 1.75 3.00
Buses above 24 passengers 2.00 3.00 6.00
Truck, and trailer combination 3.00 5.00 10.00
In this research used the Conversion factors of flat case. The traffic volumes data abstracted
from video recording for each section of arterial and collector roads. Table 3 shows a typical
traffic data that have been collected. Used a federal highway administration charts as shown in
Fig. 3 to convert the traffic value from one hour to daily traffic value, and Fig. 4 to convert the
daily traffic value to average daily traffic value. Table 4 shows a typical data of average daily
traffic (ADT) value for study area.

144 Hussein A. Ewadh et al.
Table 3. Traffic Data Collected for Each Section in Study Area of kerbala city
Street Passenger Light
truck
Heavy
truck Bus Time Day
1-A 1389 86 10 173 3:59-4:59 PM Saturday
1-B 1433 118 7 198 3:59-4:59 PM Saturday
2-B 1207 93 37 73 4:05-5:05 PM Tuesday
3-1-A 807 133 27 152 9:0-10:0 AM Saturday
3-1-B 615 183 29 67 9:0-10:0 AM Saturday
4-A 1512 192 69 185 9:0-10:0 AM Saturday
4-B 1629 195 70 190 9:0-10:0 AM Saturday
5-A 507 74 13 18 10:0-11:0 AM Saturday
5-B 652 62 14 29 10:0-11:0 AM Saturday
6-A 620 52 11 28 10:0-11:0 AM Saturday
Fig. 3. Daily Traffic Factors (Sucrose: Federal Highway Administration, 2016).
Fig. 4. Average Daily Traffic Factors (Sucrose: Federal Highway Administration, 2016).

Kufa Journal of Engineering, Vol. 9, No. 2, 2018 145
4.2. Estimation of Structural Number
Structural evaluation of pavement depends on nondestructive or destructive tests (DT). The data
obtained is primary to determine the pavement structural capacity for sections and networks
(Hass et al., 2015). Destructive testing techniques include coring in bound layers, boring in soft
layers, and dynamic cone penetrometer (DCP) testing in subgrade soils (Uddin, 2002).
Table 4. The Average Daily Traffic (ADT) Value.
Section ADT veh/h C(hr) C(day) ADT veh/day
1-A 1873 0.08 1.01 23181
1-B 1998 0.08 1.01 24728
2-B 1580 0.0815 1 19387
3-1-A 1358 0.061 1.01 22042
3-1-B 1065 0.061 1.01 17286
4-A 2329 0.061 1.01 37802
4-B 2463 0.061 1.01 39977
5-A 675 0.057 1.01 11725
5-B 830 0.057 1.01 14417
6-A 774 0.057 1.01 13445
During destructive tests, each core was numbered and transferred safely to the Laboratory.
However, cores serve one or more of the three general purposes in forensic investigations (i.e.,
for thickness, for cause of distress, and for laboratory testing).
Core test is usually conducted information about the pavement from the surface down to the
subgrade. Coring provide a very detailed picture of how the roadway structure exists at the point
cored. The core samples were taken for surface and base layer for each arterial and collector
section in the studied area (44 sections). Fig. 5 shows core test for a specific section in the study
area.
Steps followed throughout current study:
1. Choose places of core samples for each section, and take the coordinates of them.
2. Use core device to cut a samples.
3. Cut cores at an angle of 90° to the surface in order to ensure recovery of straight.
4. Numbering and mark the core and record number and location on the core log.
5. Photograph the core and record the photograph number on the core log.

146 Hussein A. Ewadh et al.
Fig. 5. Core Test for Study Area.
4.2.1. Laboratory Testing of Samples
The Marshall Stability Test procedure was used to prepare test specimens using (ASTM D
1559, 1989). Based on the requirements for Marshall to find each of (strength, bulk density, air
voids, VMA, and flow). To determine layer coefficient and structural number for each layer
(binder, surface, and base).
Steps of test:
1. Separate each pavement layer (binder, surface, base).
2. Take the average high for each core, the dry weight also should be taken and to
determine bulk density.
3. Before testing of the core samples leave it in a water bath having a temperature of 60oC
for half an hour and test it after that.
The cores were tested in a pine press Marshall device which applies load via a motor driven by
mechanical jack at a speed rate of 2 in/min (5.08 cm/min) (AASHTO 90-5, 1993).
The structural number was determined depending on data collected from marshal test results
(marshal stability). Average thickness of core samples was used to determine stability
correlation factors by using ASTM D6927- 15 for Marshal Stability to correct the stability
values. The corrected stability values were used to find structural layer coefficient (a) for each
surface and base layer by using the charts presented in NCHRP-128, 1972. These correlation
charts are used for estimating resilient modulus of asphalt concrete. Table 5 shows a typical
value of structural number for the different sections in the area under study.

Kufa Journal of Engineering, Vol. 9, No. 2, 2018 147
To determine structural number for both the surface and base course in each section, equation
(2) was used as follows. The SN is calculated as below:
SN= a1 D1+a2 D2m2 + a3 D3m3 2
Where:
SN: Pavement structural number.
a1 , a2 , a3 : Layer coefficients representative of surface, base, and subbase course, respectively.
D1, D2, D3: Actual thickness in inches of surface, base, and subbase courses, respectively.
m2, m3: Drainage coefficient for untreated layer (2 & 3).
Table 5. Structural Number of the Different Sections in the Area under Study.
Sample Layer Name
Average
Thickness
of Layer
(inches)
Marshall
Stability
(Ib)
Correction
Factor of
Thickness
Correction
Stability
(Ib)
Layer
Coff. (a) SN
3 Base (1A) 4.429 4372.140 0.685 2994.916 0.398 3.3825
4 Binder (1A) 4.331 1656.333 0.91 1507.263 0.374
5 Base (1B) 4.724 4409.244 0.647 2852.781 0.381 3.201
6 Binder (1B) 3.858 991.639 1.4366 1424.589 0.363
9 Binder (2B) 2.165 1800.294 1.4 2520.412 0.487 2.243
10 Base (2B) 3.622 4365.152 0.647 2824.253 0.386
11 Binder( 3-1-A) 2.827 3187.002 0.938 2989.407 0.531 2.493
12 Base ( 3-1-A ) 2.661 2150.829 1.06 2279.879 0.359
13 Binder( 3-1-B) 2.697 1688.740 1.4366 2426.045 0.475 2.694
14 Base (3-1-B) 3.268 2892.464 0.775 2241.660 0.352
15 Binder ( 4A ) 2.559 3010.632 0.9875 2972.999 0.524 2.2091
16 Base ( 4A ) 2.480 2003.120 1.0375 2078.237 0.35
17 Binder ( 4B ) 1.929 1688.740 1.6425 2773.756 0.503 2.0727
18 Base ( 4B ) 3.150 2892.464 0.736 2128.854 0.35
19 Binder ( 5-A ) 3.008 2223.582 0.95 2112.403 0.438 2.15163
20 Base (5-A ) 3.083 2234.759 0.858 1917.423 0.325

148 Hussein A. Ewadh et al.
5. RESULTS OF GARBER ET AL. MODEL
Pavement conditions index (CI) is calculated for 44 sections (34 major and minor arterial
sections and 10 collector sections) from all network of Kerbala city using Garber et al. model.
Table 6 includes typical input data and the results of CI from developed model and the PCI of
PAVER 6.5.7 which are estimated depending on the collected data of distress for the same
sections in kerbala city.
Table 6. Typical Input Data and Pavement Condition Index of Kerbala City by Using Garber et
al. Model.
Input data Results
CI
PCI of
PAVER Street Type ADT*1000 Age year SN
1-A minor arterial 23.181 8 3.382 81.91 86
1-B minor arterial 24.728 8 3.201 81.83 85
2-B major arterial 19.387 3.3 2.243 91.92 72
3-1-A major arterial 22.042 2 2.493 94.77 90
3-1-B major arterial 17.286 2 2.694 94.92 98
4-A major arterial 37.802 14 2.209 68.21 60
4-B major arterial 39.977 14 2.073 68.13 46
5-A collector 11.725 4 2.152 90.52 80
5-B collector 14.417 4 2.074 90.44 77
6-A collector 13.445 4.3 2.359 89.89 85
PCI: PAVER 6.5.7 pavement condition index output, CI: condition index of Garber et al.
Further, CI values obtained from the method are compared with PCI values for these sections
which represent the output of PAVER 6.5.7 application. SPSS two paired test tools are used to
analysis data and compare them, as shown in Tables 7 and 8. The Garber et al. model
overestimated value of CI rather than PCI estimated from PAVER due to statistical test to a
95% degree of confidence, (R = 0.771) for 44 sections (arterial and collector ). According to
the results in Tables 7& 8, it can be concluded that there is a significant difference between
value CI and PCI for each it (0.000 < 0.05) it is reject null hypothesis. It can be calculated that
there is a need to develop a new model or modeling calibration for model of Garber et al. A
new model is performed with the same independent variable to achieves a hole calibration for
each variable rather than the hole model.

Kufa Journal of Engineering, Vol. 9, No. 2, 2018 149
Table 7. Paired Samples Statistics for Pavement Condition Index of PAVER and Condition
Index of Garber Model.
Sample Mean N Std. Deviation Std. Error Mean
Pavement condition index
(PCI) due to PAVER 79.5000 44 10.51798 1.58565
Pavement Condition Index
(CI) due to Garber et al.
Model
87.0416 44 6.79316 1.02411
Table 8. Paired t Test Results for Pavement Condition Index of PAVER and Condition Index of
Garber Model.
Sample
Paired Differences
t df Sig. (2-
tailed) Mean Std.
Deviation
Std.
Error
Mean
95% Confidence
Interval of the
Difference
Lower Upper
Pavement condition
index (PCI) due to
PAVER
Pavement Condition
Index (CI) due to
Garber et al. Model
-7.5415 6.82875 1.02947 -9.61772 -5.4654 -7.326 43 0.000

150 Hussein A. Ewadh et al.
6. CONCLUSIONS
Garber et al. developed a model that cannot be used to predict PCI values for the study
area (Kerbala city center), because there is a significant difference between this value
and PCI obtained from PAVER 6.5.7 for the sections.
The clear different in PCI values between Garber et al. model and PAVER 6.5.7 results
may be due to the different environmental condition where the data come from (loading
type, materials used, and layer thickness). Low structural number value compares with
age for many sections cases a large effect on the different between these two values
also.
7. REFERENCES
AASHTO (1993), "Guide for Design of Pavement Structures", AASHTO, Washington, D.C.
AASHTO (2008). "Mechanistic-Empirical Pavement Design Guide, Interim Edition: A Manual
of Practice". American Association of State Highway and Transportation Officials,
Washington.
Abo-Hashema, M. A.; Abdel Samad, A.M., Al-Zaroni, Y.A., and Hawwary, M.M.S., (2006)
"Integrating Pavement Maintenance Management Practices and Geographic Information
System in Al Ain City, UAE", Third Gulf Conference on Roads (TGCR06), Muscat, March 6-
8, ISSN 1817-4310, pp 279-287.
American Society for Testing and Materials (ASTM) (1989). "Test Method for Resistance to
Plastic Flow of Bituminous Mixtures Using Marshall Apparatus", D1559.
American Society for Testing and Materials (ASTM) (2015): "Standard Test Method for
Marshall Stability and Flow of Asphalt Mixtures", D6927.
Asphalt Pavement Alliance (APA) (2010), "Perpetual Asphalt Pavements: A Synthesis".
Lanham, Maryland.
Federal Highway Administration, (2016)."Policy and Governmental affairs
Office of Highway Policy Information", U.S. Department of Transportation,
1200 New Jersey Avenue, SE, Washington, DC 20590, 2023664000.
Garber, N. J.; Hoel, L. A. and Sadek, a. w., (2011). "Transportation Infrastructure Engineering",
A Multimodal Integration SI Edition, Cengage Learning Publishing Company, Toronto,
Canada.

Kufa Journal of Engineering, Vol. 9, No. 2, 2018 151
Haas, R., W.R. Hudson, and J.P. Zaniewski, (1994) "Modern Pavement Management", Krieger
Publishing, Florida.
Haas, R; Hudson, Q.R. and Falls, L. C. (2015). "Pavement Asset Management". New Jersey,
and Scrivener Publishing LLC, Salem, Massachusetts. Published simultaneously, Canada.
Juan L. and Martinez, P.E., (2012): Engineering Consulting Services for The Updating of The
City of Beverly Hills Pavement Management Program (PMP) Utilizing Automated Condition
Surveying. City of Beverly Hills (310) 285-2512, October.
Shah, Y.U.; Jain, S.S. and Parida, M. (2012) "Evaluation of prioritization methods for effective
pavement maintenance of urban roads". Civil Engineering Department, Indian Institute of
Technology Roorkee, IIT, Roorkee, 247667, India.
Smith, G (1986), "Probability and Statistics in Civil Engineering", Nichols Publishing
Company, New York, US.
Uddin, W. (2002). "In Situ Evaluation of Seasonal Variability of Subgrade Modulus using DCP
and FWD Tests", Proceedings, International Conference on the Bearing Capacity of Roads and
Airfields, Lisbon, Portugal, Vol. 1, June, pp. 741 – 750.
Van Til, C.I; McCullough, B.F.; Vallerga, B.A. and Hicks, R.G. (1972). "Evaluation of
AASHO Interim Guides for Design of Pavement Structures," NCHRP Report 128.