Research Methods in Psychology Quasi-Experimental Designs and Program Evaluation.

Validity in Quasi-Experimental Designs to Determine Home
Visiting Program Effectiveness 1
D R . M A R Y K A Y F A L C O N E R
O U N C E O F P R E V E N T I O N F U N D O F F L O R I D A
D R . M . H . C L A R K
U N I V E R S I T Y O F C E N T R A L F L O R I D A

Learning Objectives for this Session
1) Review threats to validity in evaluations of home visiting programs.
2) Become familiar with two statistical techniques used tominimize selection bias in quasi-experimental designs and how these statistical adjustments balance the treatment and control groups in a quasi-experiment to obtain less biased treatment estimates for a home visiting program.
3) Understand variations of propensity score use, including how they can be used to supplement RCTs that do not have equivalency across treatment and control groups.
2

Types of Validity
Statistical Conclusion Validity Addresses how well the cause and effect covary
Can we make reasonable inferences from the statistics?
Internal Validity Addresses whether the relationship between variables is causal
Construct Validity Addresses how well the operations represent constructs
Are we manipulating or measuring what we intended?
External Validity Addresses how well we can generalize from the specific
operations of the study to broader constructs.
3

Threats to Validity
Statistical Conclusion Validity Low power, violating assumptions, fishing, unreliability of
measure, restriction of range
Internal Validity Ambiguous temporal precedence, attrition, maturation,
history, testing, selection
Construct Validity Reactivity to experimental situation, experimenter biases,
treatment diffusion, construct confounding
External Validity Interactions of the causal treatment with: units, treatments,
outcomes or settings
4

Statistical Conclusion Validity 5
What are the most appropriate statistics to evaluate program outcomes? Statistics depend on the design
Designs depend on research questions
Examples
When samples are related, use a within-subject statistic.
When observations are related, use a mixed effects statistic.
Have we violated any statistical assumptions? Many researchers fail to check
Do we have enough data? Are the tests powerful enough to find effects?
Is there a lot of missing data?

Internal Validity 6
RCTs rule out many threats to internal validity, but they are not infallible. They rule out selection and interactions with selection
They reduce the impact of other threats (maturation, history)
What happens to one group will likely happen to the other
They are still susceptible to attrition
Can non-randomized groups be balanced?
Designs without control groups may reduce threats to other types of validity, but increase threats to IV Within-subjects designs increase power and reduce treatment
diffusion, but increase testing, history and maturation.
Model Fidelity

Construct Validity
What is the purpose of the program?
Are we measuring the intended outcome?
What data are available to measure the purpose?
Do groups include a reasonable counterfactual?
Do data sets include all relevant information?
Are the available measures valid/reliable?
Measurement Fidelity
Are we able to get valid responses?
Will participants be honest?
Will participants accurately recall past behavior?
7

External Validity
Representative Participants
Can we obtain data from the population of interest?
Cultural orientation, racial diversity and language barriers
Stage of Program Replication
Multiple Program Sites Operating
Statewide Program
Method of Observation
Self-report vs. other report vs. observation
Settings
Do results vary by region?
8

Analysis of Program Impacts
Without Statistical Adjustments Perceived ―effects‖ may be due to pre-existing differences.
This may be used when biases are unobserved.
With Covariate Adjustments Known biases are measured and included in statistical models
E.g. ANCOVA, multiple regression, matched analyses
With Propensity Scoring Adjustments Similar to covariate adjustments with multiple covariates
except the covariates are aggregated into a single covariate
Propensity score is the predicted probability that a unit will be assigned to a treatment condition.
Comparable to covariate adjustment, but uses fewer df
9

Covariate Adjustments
Known biases need to be included in the model
What contributes to biases (i.e., motivation)
Measure these covariates
Will participants provide information?
Non-ignorable covariates are accounted for
What are the basic steps?
Hardest part is obtaining measures of covariates
Measurement attrition, reactivity to experimental situation
All covariates are added to a statistical model
ANCOVA, MANCOVA, multiple regression
matched t-test, blocking with factorial ANOVA
10

Propensity Score Adjustments
PSA is a type of covariate adjustment
It uses the same data as the previous adjustments
Analyses are the same, but use the propensity score as an aggregated covariate
Computing the propensity score
Select covariates that are related to both outcome and selection
They don’t have to be significant at p < .05
Estimate the probability that each unit will be in the treatment group from all the covariates using logistic regression
Test the propensity scores for balance
Are they evenly distributed between groups (Rubin, 2001)
11

Healthy Families Florida 12
DETERMINATION OF PROGRAM EFFECTIVENESS USING A
QUASI -EXPERIMENTAL DESIGN

Illustration Healthy Families Florida
Healthy Families Florida is based on the Healthy Families America Model which is a voluntary, long-term, home visiting program that serves families assessed as high risk for child abuse and neglect.
Outcome is Reduction in Child Abuse and Neglect
Evaluation used a quasi-experimental design
Began evaluation of HFF in FY 1998-99 (24 projects)
Ended the evaluation of HFF in FY 2003-2004 (38 projects)
13
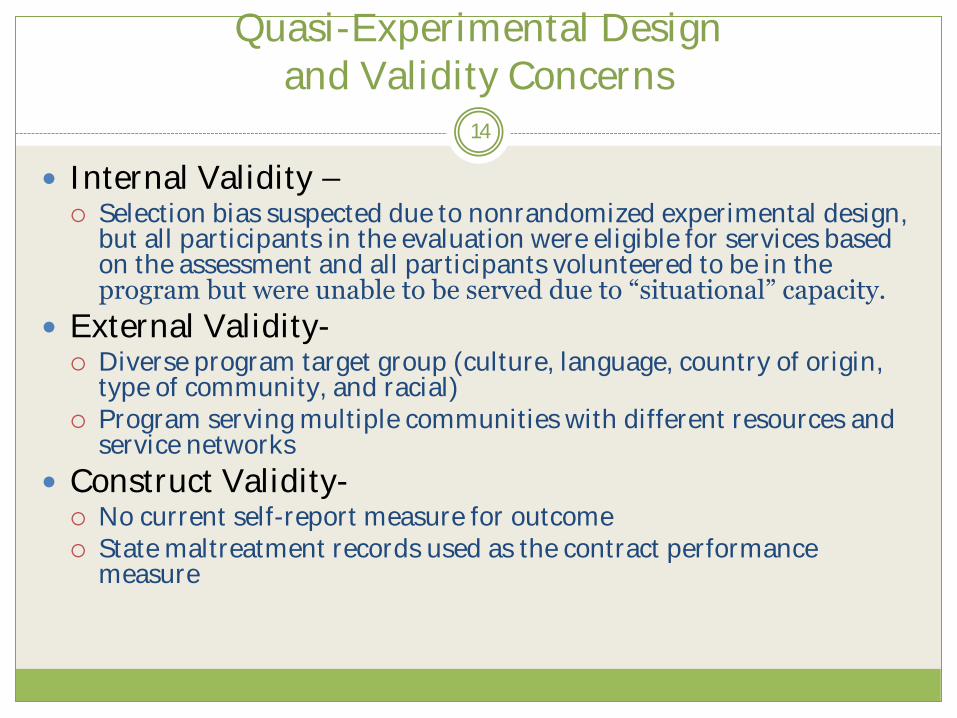
Quasi-Experimental Design and Validity Concerns
Internal Validity – Selection bias suspected due to nonrandomized experimental design,
but all participants in the evaluation were eligible for services based on the assessment and all participants volunteered to be in the program but were unable to be served due to ―situational‖ capacity.
External Validity-
Diverse program target group (culture, language, country of origin, type of community, and racial) Program serving multiple communities with different resources and service networks
Construct Validity- No current self-report measure for outcome State maltreatment records used as the contract performance
measure
14

Quasi-Experimental Design
Retrospective
Multiple Comparison Groups No Service (eligible for program; volunteered to participate;
could not be served due to situational capacity)
Program Completers
High Fidelity (several criteria)
Low Service Dosage (< 3 months of services)
Time Frame Children up to 12 months of age (this analysis)
Children up to 24 months of age (this analysis)
Additional age groups in the original evaluation
15
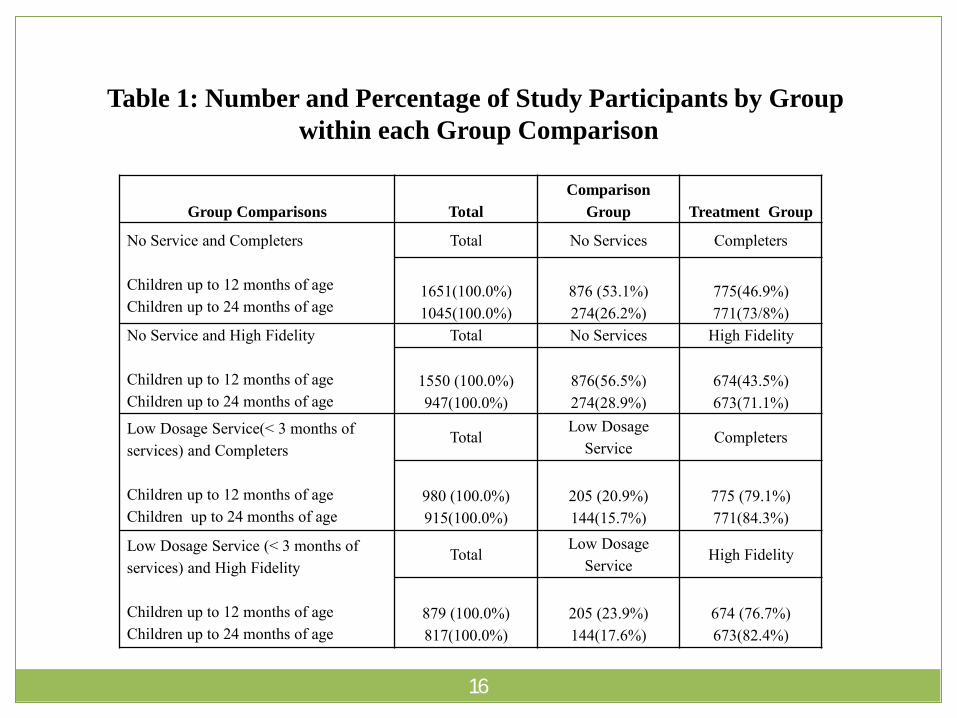
Table 1: Number and Percentage of Study Participants by Group
within each Group Comparison
16
Group Comparisons Total
Comparison
Group Treatment Group
No Service and Completers Total No Services Completers
Children up to 12 months of age 1651(100.0%) 876 (53.1%) 775(46.9%) Children up to 24 months of age 1045(100.0%) 274(26.2%) 771(73/8%) No Service and High Fidelity Total No Services High Fidelity
Children up to 12 months of age 1550 (100.0%) 876(56.5%) 674(43.5%) Children up to 24 months of age 947(100.0%) 274(28.9%) 673(71.1%) Low Dosage Service(< 3 months of services) and Completers
Total Low Dosage
Service Completers
Children up to 12 months of age 980 (100.0%) 205 (20.9%) 775 (79.1%) Children up to 24 months of age 915(100.0%) 144(15.7%) 771(84.3%)
Low Dosage Service (< 3 months of services) and High Fidelity
Total Low Dosage
Service High Fidelity
Children up to 12 months of age 879 (100.0%) 205 (23.9%) 674 (76.7%) Children up to 24 months of age 817(100.0%) 144(17.6%) 673(82.4%)

Steps in the Impact Analysis No Statistical Adjustments
Without Statistical Adjustments
Percentage of Children Maltreated in each Group
Computation of Effect Sizes
Binary Logistic Regression (Model 1)
Dependent Variable is Occurrence of Maltreatment
Comparison Group Membership
Odds Ratio or Exp(B)
17

Table 2: Child Abuse and Neglect Unadjusted Effect Sizes
for Group Comparisons
18
CAN is at least one report of child abuse or neglect that is verified or has some indicators.
Target Child Subgroups N
Up to 12 months of age 876
Up to 24 months of age 274
Target Child Subgroups N
Up to 12 months of age 876
Up to 24 months of age 274
Low Dosage Service Group
Target Child Subgroups N
Up to 12 months of age 205
Up to 24 months of age 144
Low Dosage Service Group
Target Child Subgroups N
Up to 12 months of age 205
Up to 24 months of age 144
No Service Group
# of CAN % N
71 0.0811 674
40 0.1460 673
No Service Group
# of CAN % N
71 0.0811 775
40 0.1460 771
# of CAN % N
25 0.1220 775
25 0.1736 771
# of CAN % N
25 0.1220 674
25 0.1736 673
High Fidelity Group
# of CAN % Effect Size
34 0.0504 -0.2202
62 0.0921 -0.2265
Completers Group
# of CAN % Effect Size
15 0.0194 -0.6502
34 0.0441 -0.5688
Completers Group
# of CAN % Effect Size
15 0.0194 -0.8474
34 0.0441 -0.6584
High Fidelity Group
# of CAN % Effect Size
34 0.0504 -0.4174
62 0.0921 -0.3160

Steps in the Impact AnalysisCovariate Adjustments
Covariate Adjustments with Binary Logistic Regression Several Covariate Models (all include comparison group
membership)
Model 2 (HFFAT score)
Model 3 (HFFAT score, primary participant age, race/ethnicity, married)
Model 4 (HFFAT score, primary participant age, race/ethnicity, married, less than high school, number of children at intake)
Model 5 (HFFAT score, primary participant age, race/ethnicity, married, less than high school, number of children at intake, employed)
Model 6 (HFFAT score, primary participant age, race/ethnicity, married, less than high school, number of children at intake, employed, history of substance abuse during pregnancy, smoking during pregnancy)
19

Table 4: No Service Group and Completers Group Comparison
Odds Ratios for Child Abuse and Neglect in No Service Group
by Model and Age of Child
Notes: *** p < .001; ** p < .01; * p < .05; N (Number of children abused or neglected)
20
Subgroup
based on Age
of Child
Model 1 Model 2 Model 3 Model 4
Up to 12 months
N=1651 (86) N=1462 (82) N=1436(82) N=1430 (82)
Exp(B) 4.469*** 5.985*** 5.298*** 5.563***
CI (95%) 2.538-7.868 3.080-11.628 2.707-10.371 2.830-10.934
Up to 24 months
N=1045 (74) N=866 (63) N=841 (63) N=835 (63)
Exp(B) 3.705*** 3.998*** 3.574*** 3.739***
CI (95%) 2.292-5.990 2.333-6.853 2.058-6.207 2.125-6.577

Subgroup Model 1 Model 2 Model 3 Model 4
based on Age
of Child
Up to 12 months
N=1550 (105) N=1519 (104) N=1491(102) N=1488 (102)
Exp(B) 1.660* 2.088*** 2.092** 2.223***
CI (95%) 1.089-2.531 1.342-3.247 1.324-3.306 1.391-3.553
Up to 24 months
N=947 (102) N=926 (97) N=898 (93) N=895 (93)
Exp(B) 1.685* 1.845** 1.907** 1.925**
CI (95%) 1.101-2.577 1.178-2.891 1.196-3.040 1.198-3.093
Table 5: No Service Group and High Fidelity Group Comparison
Odds Ratios for Child Abuse and Neglect in No Service Group
by Model and Age of Child
Notes: ***p < .001; ** p < .01; * p < .05; N (Number of children abused or neglected)
21

Propensity Score Adjustments
Covariate Selection
Selected factors that are related to both the treatment condition and outcome (primary participant’s age, race, marital status, education, number of children at intake andHFFAT score)
Computing Propensity Scores
Regressed factors onto a dichotomous variable indicating treatment group membership
Predicted probabilities from this regression were transformed using a log linear function and these values were the adjusted propensity scores
22
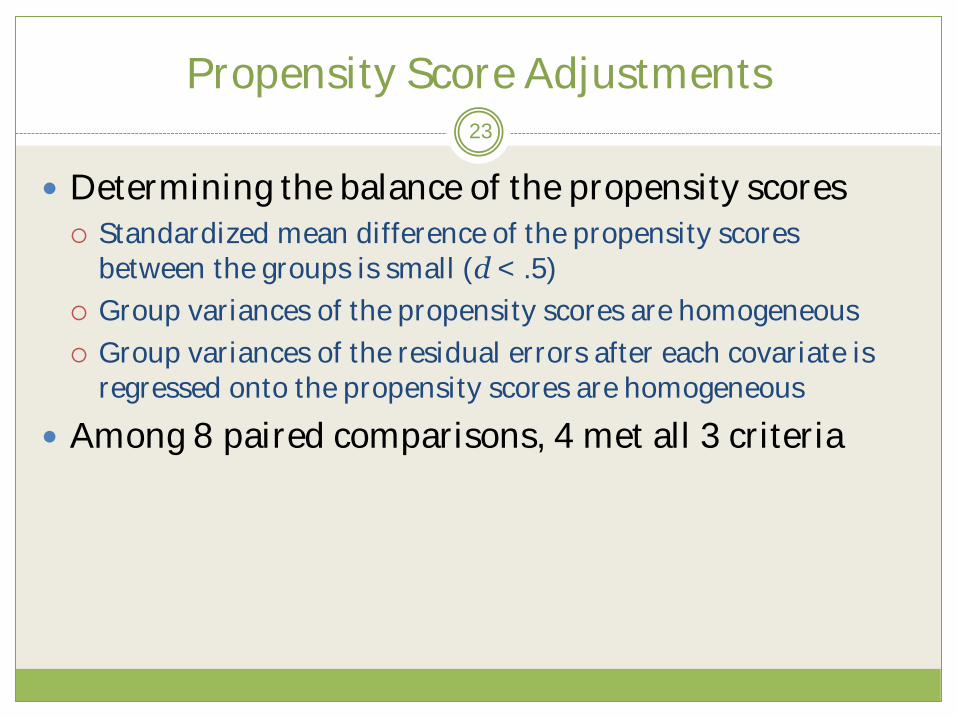
Propensity Score Adjustments
Determining the balance of the propensity scores
Standardized mean difference of the propensity scores between the groups is small (d < .5)
Group variances of the propensity scores are homogeneous
Group variances of the residual errors after each covariate is regressed onto the propensity scores are homogeneous
Among 8 paired comparisons, 4 met all 3 criteria
23

Propensity Score Adjustments
Matching
Participants were matched on the propensity scores using a paired caliper matching procedure
The maximum distance between the matches was restricted to ensure a 95% reduction in selection bias
Estimating Effect
CAN indicated presence or absence of abuse and neglect
McNemar test was used to estimate the adjusted treatment effect for a dichotomous outcome with matched pairs.
Works like a Chi-Square for dependent groups
Measures change in outcome for each pair
24

Table 8: McNemar test using Matched Pairs of Propensity Scores to Identify
Differences in Child Abuse and Neglect Outcomes
Between Comparison and Treatment Groups
25
Notes: ***p≤.001; **p≤.01; * p≤.05
Group Comparison and N McNemar
Subgroup based on test
Age of the Target Child
Comparison (< 3 months of service) and High Fidelity
Target children up to 12 months of age 117 4.654*
Target children up to 24 months of age 113 3.375
Comparison (< 3 months of service) and Completers
Target children up to 12 months of age 185 11.115***
Target children up to 24 months of age 127 7.682**
No Service and Completers
Target children up to 12 months of age 543 24.475***
Target children up to 24 months of age 267 21.951***
No Service and High Fidelity
Target children up to 12 months of age 583 6.3*
Target children up to 24 months of age 267 6.568**

Comparing Results Across Statistical Analyses
Treatment and Comparison Group Differences More consistency in results across the techniques with and without
adjustments than expected No statistically significant differences between the low dosage service
group and the high fidelity group for children up to 24 months of age in the statistically adjusted effects (both covariate and propensity score adjustments)
Other group differences had statistically significant results across with and without statistically adjusted techniques.
Group differences increased (not always significantly) in most comparisons after accounting for covariates.
Variations in the results across the subgroups based on age of the children were not particularly noteworthy
Propensity score adjustments had lower treatment effects when comparing no service and high fidelity (< 12 months) and low service dosage to completers (< 24 months)
Traditional covariate adjustments had a lower treatment effect when comparing low service to high fidelity (< 12 months)
26

Internal Validity Strengths and Challenges
Strengths All participants were eligible for services and volunteered to be in the
program Control group could not be served due to situational capacity.
Covariates were good theoretical and empirical contributors to the outcome (particularly HFFAT risk scores)
Using state records reduced missing data for outcome measure
Challenges/Limitations Selection bias likely due to nonrandomized design Limited number of covariates (hidden bias was a likely problem) Measurement attrition
Did not have covariate values for all participants (employment, certain items on the HFFAT, such as substance abuse and smoking during pregnancy) However, there was a high percentage of cases retained in the no service and high fidelity group comparisons (around 95%)
Treatment Attrition occurred only when participants moved out of state
27

Construct Validity Strengths and Challenges
Strengths State maltreatment reports are consistent with state contract
performance measures Evaluators were familiar with the data (data fields and codes used for
maltreatment findings and types) and had timely access to the records
Comprehensive maltreatment measure due to inclusion of ―verified‖ and ―some indicators‖; included precursors to maltreatment; higher percentage with occurrence of maltreatment compared to using just verified
State records reduced measurement bias by not using self-reports
Challenges/Limitations Claims that these reports do not include all of the occurrences of
child abuse and neglect Claims that these reports are affected by ―surveillance bias‖
28

External Validity Strengths and Challenges
Strengths
Study participants were from several projects throughout the state (in all groups, participants from 30 or more projects)
No participants were excluded due to language, literacy skills or cultural barriers
Challenges/Limitations
Collecting HFFAT scores and other participant information from several HFF projects
Community and project level factors could not be included as factors in the evaluation
29

Recommendations for Evaluations Measuring Home Visiting Program Impact using Quasi-Experimental Designs
30
Challenges Evaluating Home Visiting
Long-term—multiple years of services at varying levels of service Families vary in culture, number of adults, number of children, economic circumstances, and receptivity to and compatibility with home visitors Curriculum for the home visits is important Assessment and/or intake tools vary (simple set of criteria for eligibility or a more thorough assessment of risk)
Formation of Study Groups
Recommend prospective but can be retrospective Include at least one ―no service‖ group that has individuals eligible for the program, willing to participate, but unable to be served due to insufficient capacity (situational) Multiple treatment groups can be included depending on the availability of information on program implementation

Recommendations for Evaluations Measuring Home Visiting Program Impact using Quasi-Experimental Design
31
Attrition Analysis
Are those participants not included due to missing data significantly different from those who remain in the study?
Are those who drop out of the study different on the outcome from those who remain in the study?
Measurement of participant factors related to the outcome or assignment to study groups
Need more than demographic and economic factors
Risk assessment helpful (HFFAT score) but including values for the single items on the assessment total would have been ideal

Recommendations for Evaluations Measuring Home Visiting Program Impact using Quasi-Experimental Design
32
Outcome Measurement
Multiple Indicators (self-report and state records)
Measure consistent with what is required for state contract should also be included
Analytical Techniques
Multiple techniques can allow for replication/confirmation
Covariate Models
Propensity Score Adjustment
Regression Discontinuity Design
Supplement RCT when non-equivalency of treatment and control groups is identified

Regression Discontinuity Designs
Regression Discontinuity Designs assign participants to treatment groups based on a cut-off score
Assignment variable must be continuous, but does not have to be related to the outcome (e.g. income)
May give treatment to more needy participants
If assignment variable is related to outcome or need for treatment
Evaluators must have control over assignment
Since the assignment mechanism is known, it is accounted for in the statistical model
The assignment variable serves as a covariate
33

Regression Discontinuity Designs
How would it work with home visiting programs?
RDDs are well suited for HFF, assuming that participants remain in their assigned treatment groups.
HFFAT risk score would serve as a good assignment variable
It is continuous
As a measure of child abuse and neglect risk, we could assign those at greater risk to the treatment group
Treatment effects could be estimated after accounting for risk
Unmeasured biases are assumed to covary with HFFAT risk score and are also accounted for by adjusting for the assignment variable
Attrition and treatment diffusion may adversely affect the validity of the results.
34

35
Questions and Discussion

36
Contact Information
M A R Y K A Y F A L C O N E R
M F A L C O N E R @ O U N C E . O R G
M . H . C L A R K
M . H . C L A R K @ U C F . E D U